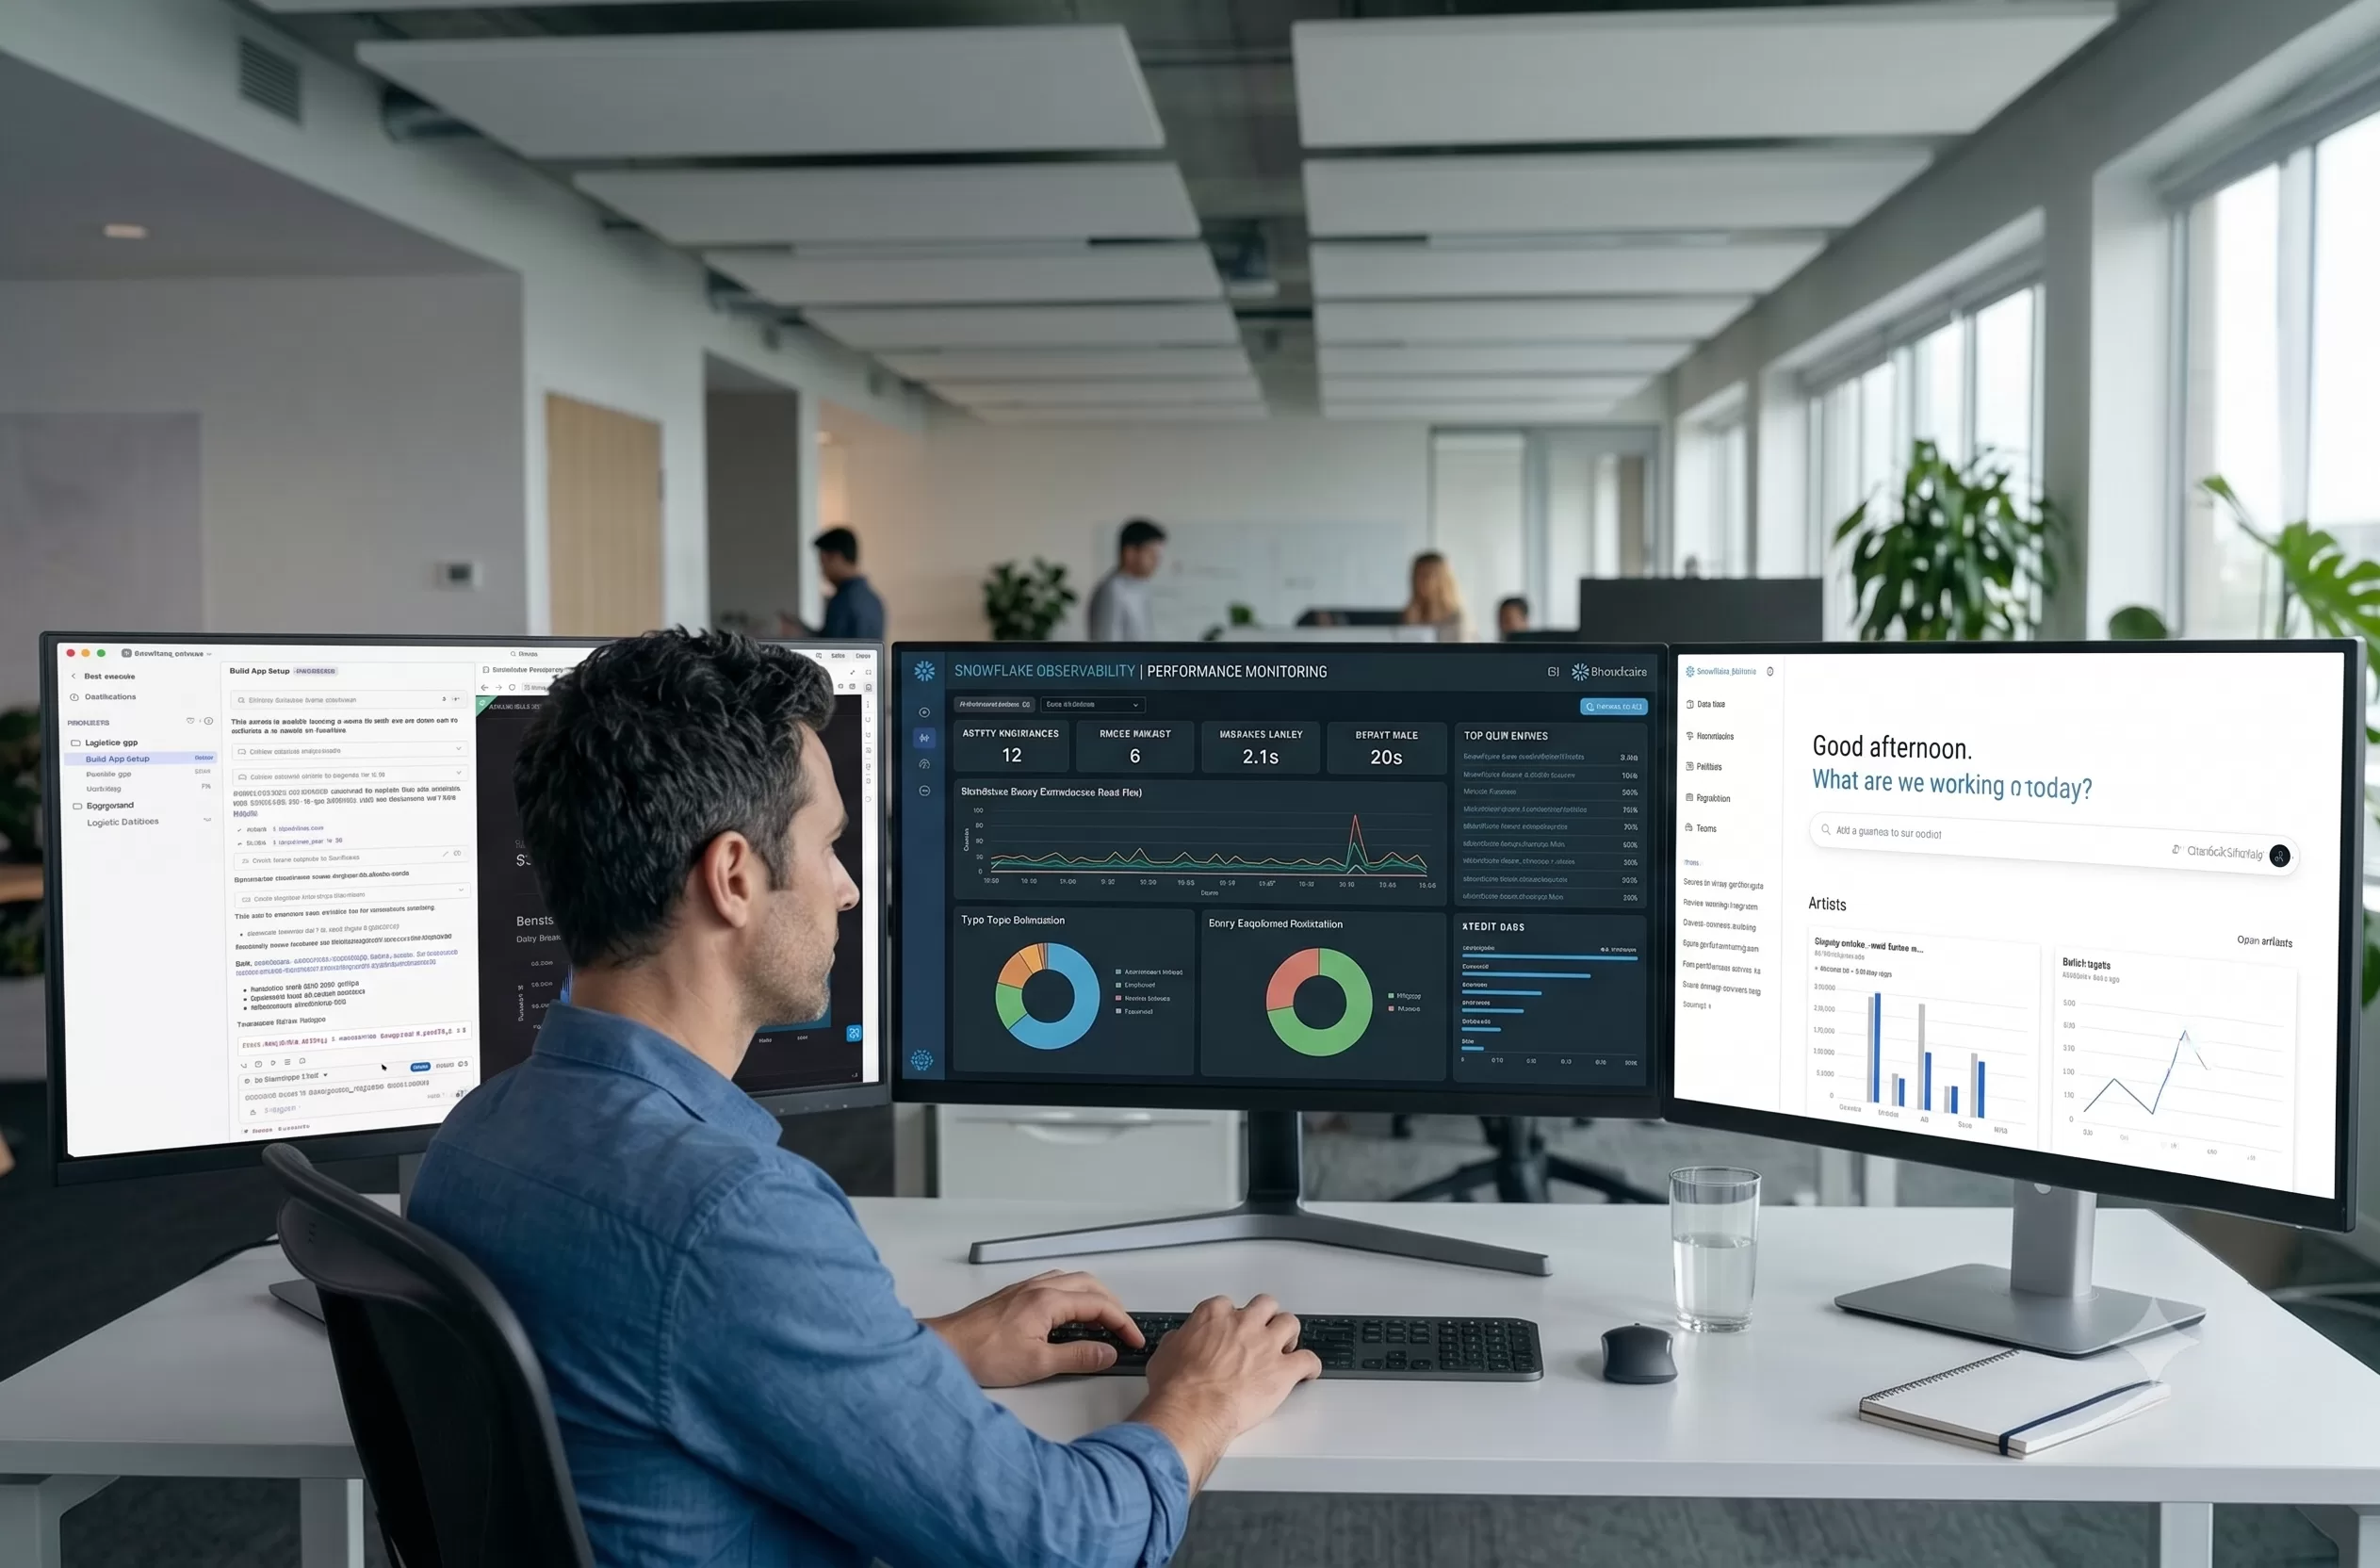
Imagine this scenario: It’s 3:00 PM on a Friday, and your company’s primary customer-facing mobile application stutters. Transactions fail, users loop infinitely on the checkout screen, and the complaints start flooding social media. Your DevOps team rushes into a war room, but instead of fixing the problem, they spend the next two hours pointing fingers. The log analytics team says the servers look fine; the infrastructure monitoring team claims CPU utilisation is normal; and the application performance team insists the database queries aren’t lagging.
By the time they identify the root cause, you’ve lost thousands in revenue and sustained a massive hit to user trust.
This is the exhausting reality of modern troubleshooting, and to be entirely candid, it is an exercise in financial self-sabotage. For years, enterprises have treated system tracking as a fragmented afterthought, splitting it into isolated buckets. But as digital ecosystems scale, this reactive approach is proving far too costly. The conversation around enterprise infrastructure has officially shifted from passive monitoring to unified data observability—and it’s a shift dictated entirely by your bottom line.
The Legacy of Fragmentation: How We Got Here
To understand why modern troubleshooting is so broken, we have to look past the marketing fluff and examine how traditional infrastructure tools evolved. Historically, systems weren’t designed to be holistic. Different vendors built massive businesses by solving exactly one isolated corner of the digital roadmap.
As corporate architectures migrated to the cloud, applications began running across distributed networks and third-party environments, resulting in a severe loss of visibility. Instead of rearchitecting their foundations from scratch, legacy monitoring platforms simply papered over the cracks by acquiring smaller tools and stitching them together into convoluted multi-product suites.

“Observability is a new category, but not really. It’s a convergence of log analytics, infrastructure monitoring, and application performance management,” explains Jeremy Burton, General Manager, Observability at Snowflake. “What you tend to find is, if you’re a legacy vendor, they have a certain architecture that was optimized for one of those things, and then they acquired or built other capabilities to add to it, but it ends up being two, three, or four different products.”
The result under the hood? Complete data fragmentation. Your technical team is forced to jump between multiple interfaces, manage distinct billing pipelines, and manually try to correlate raw logs with performance metrics when a system failure occurs.
The Snowflake Shift: Telemetry Meets the Lakehouse
This exact multi-vendor headache is why the industry is undergoing a massive architectural consolidation. The old way of building a proprietary silo for every type of telemetry data is becoming economically impossible. To get the economies of scale to actually work, an enterprise has to fundamentally rethink the underlying database architecture.
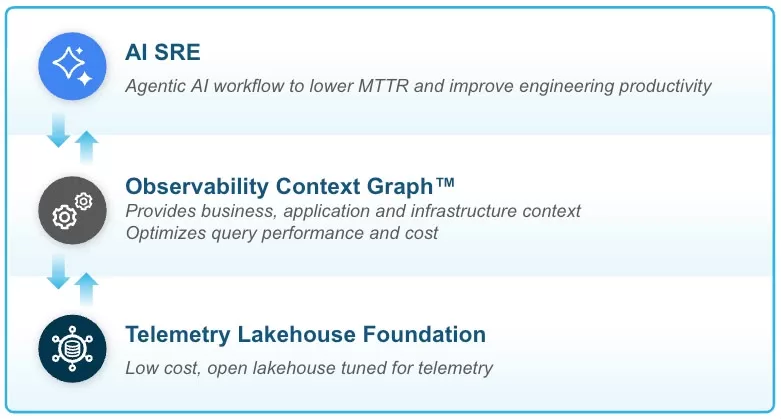
This reality crystallised with a major move: Snowflake closing its USD$600 million acquisition of Observe in February 2026. This isn’t just another tech giant swallowing a startup; it’s a deliberate pivot into the USD$50 billion IT operations space.
By integrating a platform like Observe directly into a single data ecosystem, the integrated Observe through Snowflake product shifts the paradigm entirely. Built on an open architecture utilising OpenTelemetry and Apache Iceberg, telemetry data flows from your applications straight into your own data lakehouse. There is no vendor lock-in, storage costs plummet, and you finally move away from proprietary, expensive data formats.
The Technical Reality: Observability is a Data Problem
When an application goes sideways, tracking the root cause isn’t a mystical engineering challenge; it is fundamentally a data processing problem.
Every single request, user session, and cloud container leaves behind a digital footprint. Troubleshooting is simply the act of tracing structural relationships through that mountain of data. A user session connects to a container pod, which relies on a specific virtual image, which is built on a precise line of code. If your data is siloed across separate monitoring tools, tracking that chain of custody becomes an expensive guessing game.
Traditional Monitoring vs. Unified Lakehouse Telemetry
| Engineering Metric | Legacy Fragmented Monitoring | Observe by Snowflake Platform |
| Data Repository | Multi-vendor, disconnected silos | Centralized Relational Data Lakehouse |
| Data Format | Proprietary formats per tool | Open architecture (Apache Iceberg) |
| Storage & Query Costs | Premium pricing per gigabyte processed | Up to 10x cost reduction via decoupled compute/storage |
| Relationship Mapping | Manual correlation across systems | Automated query tracking via relational data |
| Operational Workflow | Manual developer digging | AI SRE agent troubleshooting |
To put the sheer scale of modern observability into perspective, let’s look at what it takes to run a truly unified system. We are talking about architectures capable of executing roughly 300 million queries a day and scanning upwards of 17 trillion rows of data daily to track microservices at a granular level.
Furthermore, this structured data format is turning out to be a massive advantage for automation. If you hand a messy, uncontextualized data stream to an AI model, it will endlessly grind through its reasoning loop and quickly burn through your entire enterprise token budget. But by structuring and organising telemetry within a relational database, an AI SRE agent can instantly parse the critical context, finding the root cause of an incident at a price your finance director can actually afford.
Real-World Implications: Joining Telemetry with Business ROI
Let’s pull this out of the cloud server arrays and put it directly onto the office desk. Why should a C-suite executive or an SME operations manager care about unified data tables?
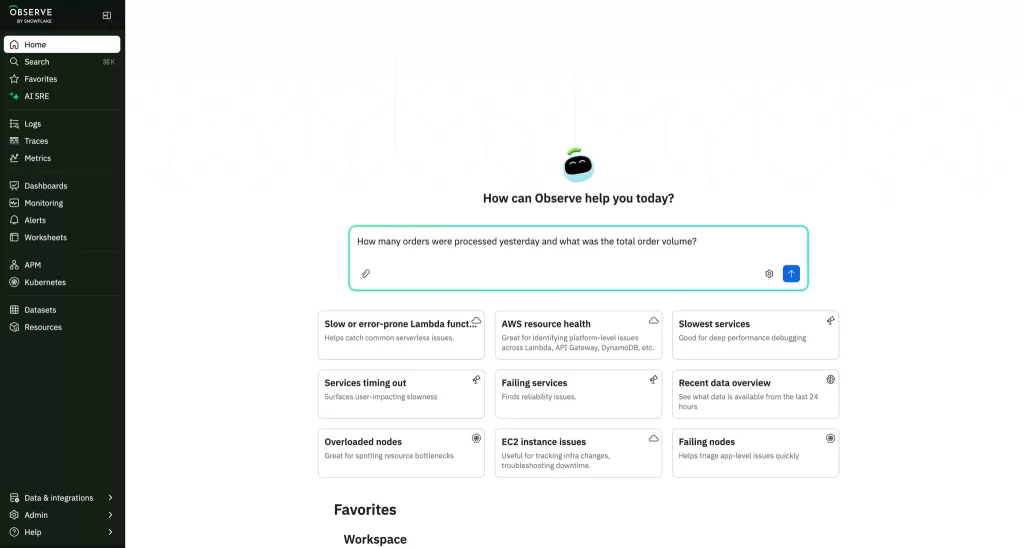
Because it finally bridges the gap between IT infrastructure metrics and actual revenue.
Under the old, fragmented model, your tech team might tell you that a database cluster suffered a 45-minute outage, but they could never tell you what that outage actually cost the business in real-time. When your telemetry data and your core business operational data live in the exact same schema, that blind spot completely vanishes.
“Fragmented data means you have your business data in a system over here and your telemetry in several systems over here,” notes Jeremy Burton. “If you could bring those together, you could look at the impact of an outage. If we have a problem on our site and it lasts two hours, what was the business impact? We should be able to join those two different data sets because they’re both in the same database, and we should be able to query across them.”
Large global enterprises like Barclays are already leveraging this unified foundation to drop operational toil and accelerate decision-making across thousands of applications. Combined with governance tools like Snowflake Horizon—which provides automated data quality controls and sensitive data classification—businesses can safely cross-reference telemetry with sales figures. If an app stutters, an operations manager can see exactly how many digital shopping carts were dropped, which specific consumer tiers were affected, and what the true financial impact was before the post-mortem meeting is even scheduled.
The Spreadsheet Lesson: Why Unified Data Leads the Next Era of Engineering
When we talk about consolidating entire telemetry lakehouses, the lurking anxiety in most enterprise rooms isn’t just about software licensing fees—it’s about how rapidly the engineering landscape is shifting. With automated AI SREs and autonomous agents entering the infrastructure space, a recurring doom-and-gloom narrative suggests that traditional IT oversight and development roles are on the chopping block.
But Jeremy Burton left us with a brilliant historical parallel that completely reframes how we look at this next wave of automation. He compared the current data-driven AI shift to a classic corporate tool we completely take for granted today: the digital spreadsheet.
“It’s sort of like when we created the spreadsheet and we thought it was the end of financial services,” Burton pointed out. “And we realized, no, no, it was the beginning of financial services. I actually think like coding agents, it’s not the end of coding. I actually think it’s the beginning of software engineering.”
This is exactly where the rubber meets the road. Moving your operations onto a unified platform like Observe by Snowflake doesn’t mean you’re engineering humans out of the loop. It means you are finally operating at a much higher level of abstraction.
When your DevOps and SRE teams aren’t stuck in the technical trenches manually trying to correlate mismatched data across three different vendor dashboards, they are freed up to focus on high-level architecture, design, and system-wide optimisation. Just as the spreadsheet turned data entry clerks into strategic financial analysts, a unified telemetry lakehouse turns reactive fire-fighters into proactive system architects.
The era of bleeding capital on uncontextualized data silos and fragmented workflows is officially over. By bringing your operational telemetry and business metrics under one governed roof, you aren’t just protecting your quarterly bottom line from unexpected downtime—you are laying down the exact structural foundation needed to run the next generation of enterprise engineering.