Tag Archives: ECP

Dymax Asia Pacific Pte Ltd Receives the Singapore SME 1000 & SME 1000 Award and Winner of D&B Business Eminence Award

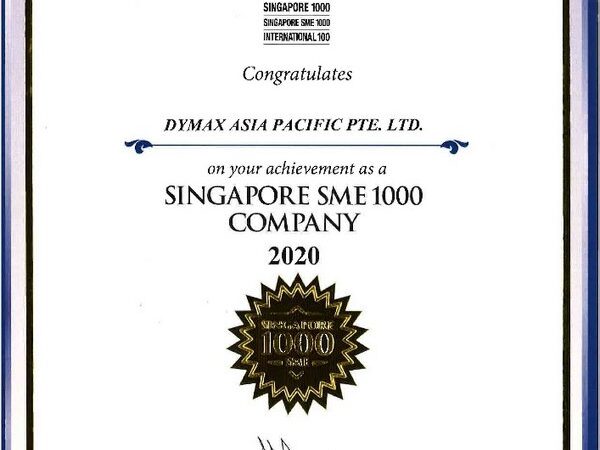
TORRINGTON, Conn., Aug. 14, 2020Dymax Corporation, leading manufacturer of rapid light-curing materials and equipment, is pleased to announce that its Singapore subsidiary, Dymax Asia Pacific Pte Ltd., has received the Singapore 1000 & Singapore SME 1000 award in its annual ranking of best companies in 2020. And it has been awarded one of the winners of the Dun & Bradstreet Business Eminence Award.

Dymax Asia Pacific Pte Ltd. SME Certificate

The Singapore 1000 Family of Rankings (Singapore 1000 & Singapore SME 1000) is the prestigious guide that ranks the nation’s top companies annually. For over 30 years, they have been profiling the success of businesses based on financial indicators such as revenue, net profit, return on equity, and overseas revenue. Taking into consideration all companies and requiring no paid nominations, the Singapore 1000 analyzes over 70,000 audited financials each year to arrive at the top 1,000 corporations and SMEs in Singapore. The rankings are shared publicly and distributed to government sectors, embassies, trade organizations, banks, universities, and libraries.

Nominees of the D&B Business Eminence Award receive this distinguished recognition for their achievements as an entrepreneurial business that has contributed to Singapore’s business landscape over the past several years. The assessment of candidates and selection process is based on Dun & Bradstreet’s proprietary financial model that recognizes top performing businesses and helps raise their international profile. The D&B D-U-N-S Registered Seal resonates with customers, suppliers, and business partners.

Dun & Bradstreet has the world’s largest commercial database, with over 240 million company records derived from 30,000 data sources. Some of the largest, most successful technology and service companies in the world embed Dun & Bradstreet data within their offerings. 

Dymax Asia Pacific Pte Ltd. joined in the ranks of this prestigious group being recognized for their abilities and contributions. The company looks forward to an exciting journey as it continually strives to achieve business excellence around the world.

About Dymax Corporation

Dymax Corporation develops innovative rapid and light-curable materials, dispense equipment, and UV/LED light-curing systems. The company’s adhesives, coatings, and equipment are perfectly matched to work seamlessly with each other, providing design engineers with tools to dramatically improve manufacturing efficiencies. Major markets include aerospace and defense; medical device; and consumer and automotive electronics.

For additional information on Dymax, visit www.dymax.com or contact us at info@dymax.com or +65-67522887.

Photo – https://photos.prnasia.com/prnh/20200814/2885951-1?lang=0

Related Links :

http://www.dymax.com

Inventec Introduces Entei, the Advanced Storage Server System

Next-gen data storage server supports dual 2nd Gen Intel Xeon Scalable Processors

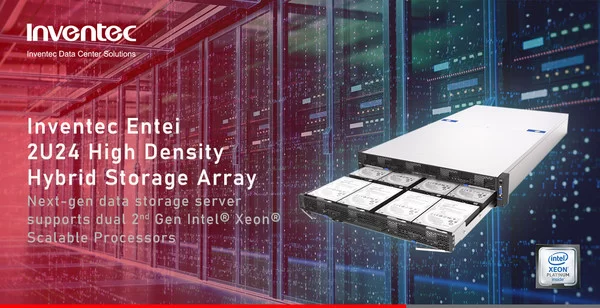
TAIPEI, Aug. 14, 2020 — To match an ever-growing need for data storage space, Inventec (2356.TW), one of the key suppliers of world’s leading server brands, hyperscale data centers and server system integrators, announced the arrival of Entei – a 2U24Bay Storage Server System to support dual 2nd Gen Intel Xeon Scalable processors. The solution comes with dual-socket 24 LFF HDD Bay in 2U form factor and will allow the scaling of the IoT and cloud industries.

Inventec Entei: 2U24Bay Storage Server System

According to market research by US-based Grand View Research, the size of the global next-generation data storage market is expected to grow at a compound annual growth rate (CAGR) of 12.5% from 2019 to 2025. The growth is driven by increasing global penetration of the IoT in various businesses sectors and industries, where there is an immense need to store multiple forms of data.

The research also indicates that market players are currently focusing on the development of scalable, practical and flexible cloud platforms to fulfil the needs of those various businesses and industries in today’s rapidly changing digital era. 

Inventec Entei: 2U High Serviceability Hybrid Storage Array

Entei is powered by dual 2nd Gen Intel Xeon Scalable processors with twelve DIMM capacity (up to 768GB with 64GB DIMMs) in the whole system, laying a new foundation of scalability. Entei also supports Intel Optane persistent memory which capacity is up to 1TB.

This enables optimized workload for synergy across computing, network and storage, and provides a higher virtualized workload throughput and number of VM density, a great boost in performance, security, agility and efficiency, while catering to a wide range of key workloads.

Ultra-Dense in 2U Form Factor

Entei supports 24x 3.5" and 4x 2.5" form factor hot-swappable drives with easy serviceability, providing balanced computing power and storage capacity, flexible I/O expansibility, and hardware redundancy. Together with multiple storage options for greater flexibility and scalability including NVMe support in the rear for a caching layer, Entei also includes 2x M.2 via interposer connection and a variety of storage mezzanine cards.

"Entei is an ideal hybrid system for warm storage and is applicable to further storage applications. By optimizing the ratio of SSDs and HDDs, it can highly accelerate IOPS and throughput performance while offering excellent storage capacity. Also, Entei’s drawer design for easier drive maintenance is a particular design feature which provides convenience to its users," said George Lin, General Manager of Business Unit VI, Inventec Enterprise Business Group (Inventec EBG).

Great Density and Scalability

Entei adopts the Intel® C621 chipset, supports dual Intel Xeon Scalable processors, and has up to 768GB of DDR4 memory. Hosting 3 PCIe x16 lanes, enabling expansion of up to 4 PCIe cards (two x8, two x16) with riser boards.

Flexible Network Configuration

Lastly, Entei offers an OCP NIC mezzanine option, ranging from 10G Ethernet to 40G (optical or Base-T, compatible with OCP 2.0). This allows high-speed performance and I/O flexibility, catering to suitable demands of different application procedures.

About Inventec Data Center Solutions (Inventec EBG)

Inventec Data Center Solutions (Inventec EBG) was established in 1998 and has been focusing on the design and manufacturing of server systems in Inventec Corporation. Over decades, Inventec EBG has been the key server system supplier of the global branding clients.
For more information, please visit: https://ebg.inventec.com/
Follow "Inventec Data Center Solutions" on LinkedIn and Wechat to receive their latest news and announcements.

Inventec logos are trademarks or registered trademarks of Inventec Corporation.
Intel, the Intel logo, the Intel Inside logo and Xeon are trademarks or registered trademarks of Intel Corporation or its subsidiaries.

ViewSonic Holds “ColorPro Award Global Photography Contest” to Highlight the Spirit of Kindness

BREA, Calif., Aug. 14, 2020 — ViewSonic International Corp.*, a leading global provider of visual solutions, invited four leaders in the creative industry with many years of experience in providing professional tools and services to creators—Blurb, Shoot the Frame (STF), Tinyspace,  and TourBox—to hold the ColorPro Award Global Photography Contest. The theme of the contest is "kindness," and everyone is welcome to submit photos from August 18 to 30 to demonstrate what kindness means to them. The top prize includes a ColorPro VP2785-2K professional display and a package of photography tools.

The theme of ColorPro Award Global Photography Contest is “kindness,” and everyone is welcome to submit photos from August 18 to 30 to demonstrate what kindness means to them.

"We are glad to host this global contest with our partners and help generate positive energy during this difficult time," said Oscar Lin, Head of the Monitor Business Unit at ViewSonic. "With this contest, we seek to encourage people to explore stories and moments about kindness and share what kindness means to them through photographs. Our aim is to inspire creativity and identify the kindness that has always been within us, no matter the changes to the way we live."

The ColorPro Award fully respects artistic creativity, setting no limits on size, aspect ratio, style, or device. Two well-known professional photographers, Luke Stackpoole and Kai W, are serving as ColorPro Award ambassadors, sharing their photographs of kindness. In Luke Stackpoole’s photo, a mother sled dog is sheltering her young puppies from a blizzard in temperatures of -35°C, reflecting the paternal instinct to care for the young. Meanwhile, Kai W’s fascinating photo shows a butcher using a meat knife to help a little girl open a straw hole on her tea carton.

Partner companies have made available generous prizes for inspiring submissions. In addition to US$1,000 in cash, the top prize includes a ColorPro VP2785-2K professional display and a TourBox Controller that will help creators develop their work. STF, Tinyspace, and Blurb will also provide memberships and vouchers, so that creators can showcase their work, build online portfolios, and take advantage of online printing and self-publishing services.

All submitted photographs will be evaluated based on three main aspects: (1) overall impression conveyed and emotion delivered; (2) originality, creativity, and storytelling; (3) technical aspects, such as lighting, exposure, color, tone, and execution.

Contest Details

  • When: 18th to the 30th of August
  • How: submit your photo with the theme of "Kindness" to event site
  • First prize:
    1.  $1,000 Cash
    2.  ColorPro VP2785-2K
    3.  TourBox Controller
    4.  12 Month Tinyspace Membership
    5.  $500 Blurb Voucher
    6.  12 Month Shoot The Frame Premium Membership
     
    Second prize:
    1.   Blurb $200 voucher
    2.  12 Month Tinyspace Membership
    3.  12 Month Shoot The Frame Premium Membership
     
    Third prize:
    1.  Blurb $100 voucher
    2.  12 Month Tinyspace Membership
    3.  12 Month Shoot The Frame Premium Membership

*The Contest is hosted and sponsored by ViewSonic International Corp., located in New Taipei City, Taiwan. ViewSonic International Corp. is a subsidiary company of ViewSonic Corp. located in California, USA.

About ViewSonic

Founded in California, ViewSonic is a leading global provider of visual solutions and conducts business in over 100 countries worldwide. As an innovator and visionary, ViewSonic is committed to providing comprehensive hardware and software solutions that include monitors, projectors, digital signage, ViewBoard interactive displays, and myViewBoard software ecosystem. With over 30 years of expertise in visual displays, ViewSonic has established a strong position for delivering innovative and reliable solutions for education, enterprise, consumer, and professional markets and helping customers "See the Difference." To find out more about ViewSonic, please visit www.viewsonic.com.

Blurb

Blurb is a creative platform that enables individuals to create high-quality Photo Books, Trade Books, Magazines, and Wall Art with free, innovative creation and layout tools. To find out more about Blurb please visit: https://www.blurb.com/

Shoot The Frame

Shoot The Frame, launched in 2012, are a suite of monthly photography awards. Join professional and amateur photographers from around the globe and enter your best portrait, landscape and wildlife photos. https://shoottheframe.com/

Tinyspace

Tinyspace is about to launch a neat little product that allows designers and creative people to build a simple portfolio & resume. We are dedicated to helping you get your next job as a creative. We’re giving away discount codes to a limited number of early users. To get your voucher, visit: http://tinyspace.io/

TourBox

TourBox team was thus founded in November 2016 and began to create new tools that would reshape the industry.TourBox innovates step by step and is dedicated to developing a tool that can increase efficiencies and truly optimize operational experiences and increase efficiencies. TourBox has now become the first choice of creators to accelerate their workflows. The support of every creator will continue to encourage us to innovate with passion and continue delivering the best tools to the digital world. To find out more about TourBox please visit: https://www.tourboxtech.com/en/index.html

Photo – https://photos.prnasia.com/prnh/20200812/2883288-1?lang=0

Related Links :

http://www.viewsonic.com

Qualcomm Announces Pricing Terms of Its Cash Offers for Four Series of Notes Open to Retail Holders Only

SAN DIEGO, Aug. 12, 2020 — Qualcomm Incorporated (NASDAQ: QCOM) announced today the pricing terms of its four separate offers to purchase for cash (each, a "Cash Offer," and collectively, the "Cash Offers") any and all of the outstanding notes listed in the table below (collectively, the "Old Notes"), on the terms and subject to the conditions set forth in the Offer to Purchase dated August 5, 2020 (the "Offer to Purchase" and, together with the certification to participate in the Cash Offers, the instructions for such certification and the notice of guaranteed delivery, the "Cash Offer Documents"). The Cash Offers are subject to an aggregate maximum condition as set forth below.

The Cash Offers will expire at 5:00 p.m., New York City time today, August 11, 2020 (such date and time, as may be extended or earlier terminated by Qualcomm, the "Cash Offer Expiration Date"). The "Cash Offer Settlement Date" will be promptly following the Cash Offer Expiration Date and is expected to be August 14, 2020.

Only holders who are not "qualified institutional buyers" and who are not non-U.S. persons (other than "retail investors" in the European Economic Area or in the United Kingdom and investors in any province or territory of Canada that are individuals or that are institutions or other entities that do not qualify as both "accredited investors" and "permitted clients") are eligible to participate in this transaction, as more fully described below. Qualcomm also announced today the pricing terms of its transaction to exchange such four series of notes pursuant to private exchange offers (each, an "Exchange Offer" and collectively, the "Exchange Offers"), which are open only to Ineligible Holders (as defined below).

The following table sets forth, for each series of Old Notes, the yields and the Tender Consideration (as defined in the Cash Offer Documents) for each $1,000 principal amount of such Old Notes validly tendered and not validly withdrawn prior to the Cash Offer Expiration Date and accepted by Qualcomm:

Title of Series of
Old Notes to be
Purchased

CUSIP/ISIN

Reference U.S.

Treasury Security

Reference Yield(1)

Fixed Spread

(basis points)

Yield(2)

Tender Consideration

3.000% Notes due 2022 ("Old 2022 Notes")

747525AE3;

US747525AE30

1.750% U.S. Treasury Notes due May 15, 2022

0.176%

15

0.326%

$1,047.06

2.600% Notes due 2023 ("Old 2023 Notes")

747525AR4;

US747525AR43

2.125% U.S. Treasury Notes due December 31, 2022

0.176%

15

0.326%

$1,053.82

2.900% Notes due 2024 ("Old 2024 Notes")

747525AT0;

US747525AT09

2.125% U.S. Treasury Notes due March 31, 2024

0.216%

15

0.366%

$1,090.54

3.450% Notes due 2025 ("Old 2025 Notes")

747525AF0;
US747525AF05

2.000% U.S. Treasury Notes due February 15, 2025

0.264%

20

0.464%

$1,133.31

(1)

Represents the bid-side yield on the Reference U.S. Treasury Security calculated as of 2:00 p.m., New York City time, on August 11, 2020, in accordance with the procedures set forth in the Offer to Purchase.

(2)

Represents the bid-side yield on the Reference U.S. Treasury Security plus the applicable Fixed Spread, calculated in accordance with the procedures set forth in the Offer to Purchase.

Upon the terms and subject to the conditions set forth in the Cash Offer Documents, Eligible Holders (as defined below) who (i) validly tender and who do not validly withdraw Old Notes at or prior to the Cash Offer Expiration Date or (ii) deliver a properly completed and duly executed notice of guaranteed delivery and all other required documents at or prior to the Cash Offer Expiration Date and tender their Old Notes pursuant to the Cash Offers at or prior to 5:00 p.m., New York City time, on the second business day after the applicable Cash Offer Expiration Date pursuant to guaranteed delivery procedures, expected to be August 13, 2020, subject in each case to the delivery of the certification to participate in the Cash Offers and tendering the applicable minimum denominations, and whose Old Notes are accepted for purchase by Qualcomm, will receive consideration in the Cash Offers equal to the applicable Tender Consideration.

We also intend to pay in cash accrued and unpaid interest on the Old Notes accepted for purchase from the last applicable interest payment date for the Old Notes to, but excluding, the Cash Offer Settlement Date (the "Accrued Coupon Payment").

Terms of the Cash Offers

The complete terms and conditions of the Cash Offers are set forth in the Cash Offer Documents, each of which have been distributed to Eligible Holders in connection with the proposed Cash Offers. Each Cash Offer is subject to certain conditions, including (i) the timely satisfaction or waiver of all of the conditions precedent to the completion of the corresponding Exchange Offer for such series of Old Notes (with respect to each Exchange Offer, the "Exchange Offer Completion Condition") and (ii) that the aggregate principal amount of cash payable by Qualcomm to Eligible Holders participating in the Cash Offers is no greater than $300 million before giving effect to the Accrued Coupon Payment (the "Aggregate Maximum Cash Offer Condition"). The Exchange Offers are subject to certain conditions, including that the aggregate principal amount of New 2028 Notes to be issued under the Exchange Offers must be equal to or greater than $500 million (the "New 2028 Notes Minimum Condition") and that the aggregate principal amount of New 2032 Notes to be issued under the Exchange Offers must be equal to or greater than $500 million (the "New 2032 Notes Minimum Condition," and together with the New 2028 Notes Minimum Condition, the "Minimum Condition Requirements"). Qualcomm will terminate a Cash Offer for a given series of Old Notes if it terminates the Exchange Offer for such series of Old Notes, and Qualcomm will terminate the Exchange Offer for a given series of Old Notes if it terminates the Cash Offer for such series of Old Notes. The Exchange Offer Completion Condition may not be waived by Qualcomm; however, Qualcomm reserves the right, in its sole discretion, to waive the other conditions, including the Aggregate Maximum Cash Offer Condition and either Minimum Condition Requirement. If (i) the New 2028 Notes Minimum Condition is not satisfied, Qualcomm will not accept any Old 2022 Notes or Old 2023 Notes in the Exchange Offers and will terminate the corresponding Cash Offers for such notes and (ii) the New 2032 Notes Minimum Condition is not satisfied, Qualcomm will not accept any Old 2024 Notes or Old 2025 Notes in the Exchange Offers and will terminate the corresponding Cash Offers for such notes, in each case unless Qualcomm waives the applicable Minimum Condition Requirement. If the Aggregate Maximum Cash Offer Condition is not satisfied or waived, Qualcomm will terminate the Cash Offers and the Exchange Offers.

Only holders of Old Notes who are not (i) "qualified institutional buyers" within the meaning of Rule 144A under the Securities Act of 1933, as amended (the "Securities Act"), and who are not (ii) non-U.S. persons (as defined in Rule 902 under the Securities Act) located outside of the United States within the meaning of Regulation S under the Securities Act, other than "retail investors" (as defined below) in the European Economic Area or the United Kingdom, are eligible to participate in the Cash Offers. For these purposes, a retail investor means a person who is one (or more) of: (i) a retail client as defined in point (11) of Article 4(1) of Directive 2014/65/EU (as amended, "MiFID II"); or (ii) a customer within the meaning of Directive 2002/92/EC (as amended, the "Insurance Mediation Directive"), where that customer would not qualify as a professional client as defined in point (10) of Article 4(1) of MiFID II; or (iii) not a qualified investor as defined in Regulation (EU) 2017/1129 (as amended, the "Prospectus Regulation"). Holders of Old Notes located or resident in a province or territory of Canada will only be eligible to participate in the Cash Offers if they are (i) individuals; or (ii) institutions or other entities that do not qualify as both "accredited investors," as such term is defined in National Instrument 45-106 – Prospectus Exemptions ("NI 45-106") of the Canadian Securities Administrators or Section 73.3(1) of the Securities Act (Ontario), and "permitted clients," as such term is defined in National Instrument 31-103 – Registration Requirements, Exemptions and Ongoing Registrant Obligations ("NI 31-103") of the Canadian Securities Administrators. We refer to holders who meet the foregoing criteria in this paragraph as "Eligible Holders." Qualcomm refers to holders of Old Notes who are not Eligible Holders as "Ineligible Holders."

Only Eligible Holders who have delivered a certification to Global Bondholder Services Corporation, certifying that they are Eligible Holders, will be authorized to participate in the Cash Offers.

Holders are advised to check with any bank, securities broker or other intermediary through which they hold Old Notes as to when such intermediary needs to receive instructions from a holder in order for that holder to be able to participate in, or (in the circumstances in which revocation is permitted) revoke their instruction to participate in the Cash Offers before the deadlines specified herein and in the Cash Offer Documents. The deadlines set by each clearing system for the submission and withdrawal of tender instructions will also be earlier than the relevant deadlines specified herein and in the Cash Offer Documents.

This press release is not an offer to sell or a solicitation of an offer to buy any of the securities described herein. The Cash Offers are being made solely by the Cash Offer Documents and only to such persons and in such jurisdictions as is permitted under applicable law.

Goldman Sachs & Co. LLC and Barclays Capital Inc. are acting as the Joint-Lead Dealer Managers for the Cash Offers, and Deutsche Bank Securities Inc., J.P. Morgan Securities LLC, Blaylock Van, LLC and Loop Capital Markets LLC are acting as Co-Dealer Managers for the Cash Offers. For additional information regarding the terms of the offer, please contact Goldman Sachs & Co. LLC at (800) 828-3182 (toll free), (212) 902-6941 (collect) or GS-LM-NYC@gs.com or Barclays Capital Inc. at (800) 438-3242 (toll free), (212) 528-7581 (collect) or us.lm@barclays.com. Global Bondholder Services Corporation will act as the tender agent and information agent for the Cash Offers. Questions or requests for assistance related to the Cash Offers or for additional copies of the Cash Offer Documents may be directed to Global Bondholder Services Corporation at (866) 470-3900 (toll free) or (212) 430-3774 (collect). You may also contact your broker, dealer, commercial bank, trust company or other nominee for assistance concerning the Cash Offers.

The Cash Offer Documents can be accessed at the following link: http://www.gbsc-usa.com/QUALCOMM/.

About Qualcomm

Qualcomm is the world’s leading wireless technology innovator and the driving force behind the development, launch and expansion of 5G. When we connected the phone to the internet, the mobile revolution was born. Today, our foundational technologies enable the mobile ecosystem and are found in every 3G, 4G and 5G smartphone. We bring the benefits of mobile to new industries, including automotive, the internet of things and computing, and are leading the way to a world where everything and everyone can communicate and interact seamlessly.

Qualcomm Incorporated includes our licensing business, QTL, and the vast majority of our patent portfolio. Qualcomm Technologies, Inc., a subsidiary of Qualcomm Incorporated, operates, along with its subsidiaries, substantially all of our engineering, research and development functions, and substantially all of our products and services businesses, including our QCT semiconductor business.

Cautionary Note Regarding Forward-Looking Statements

Any statements contained in this press release that are not historical facts are forward-looking statements as defined in the U.S. Private Securities Litigation Reform Act of 1995. Additionally, statements regarding the rapid, global spread of the recent coronavirus (COVID-19) pandemic, and its potential future impact on the global economy, including the potential for a global recession; economic uncertainty and consumer and business confidence; demand for devices that incorporate our products and intellectual property; our and the global wireless industry’s supply chains, transportation and distribution networks and workforces; 5G network deployments; and our business, revenues, results of operations, cash flows and financial condition; as well as statements regarding our planning assumptions, workforce practices, the duration and severity of the pandemic, and government and other actions to mitigate the spread of, and to treat, COVID-19 are forward-looking statements. Forward-looking statements further include but are not limited to statements regarding industry, market, business, product, technology, commercial, competitive or consumer trends; our businesses, growth potential or strategies, or factors that may impact them; challenges to our licensing business, including by licensees, governments, governmental agencies or regulators, standards bodies or others; challenges to our QCT semiconductor business; other legal or regulatory matters; competition; new or expanded product areas, adjacent industry segments or applications; costs or expenditures including research and development, selling, general and administrative, restructuring or restructuring-related charges, working capital or information technology systems; our financing, stock repurchase or dividend programs; strategic investments or acquisitions; adoption and application of future accounting guidance; tax law changes; our tax structure or strategies; U.S./China trade or national security policies; or the potential business or financial statement impacts of any of the above, among others. Forward-looking statements are generally identified by words such as "expects," "anticipates," "intends," "plans," "believes," "seeks," "estimates" and similar expressions or variations of such words, but these words are not the exclusive means of identifying forward-looking statements in this press release. These statements are based on Qualcomm’s current expectations or beliefs, and are subject to uncertainty and changes in circumstances. Actual results may differ materially from those expressed or implied by the statements herein due to changes in economic, business, competitive, technological, strategic and/or regulatory factors, and other factors affecting the operations of Qualcomm. More detailed information about these factors may be found in Qualcomm’s filings with the SEC, including those discussed in Qualcomm’s most recent Annual Report on Form 10-K and in any subsequent periodic reports on Form 10-Q and Form 8-K, each of which is on file with the SEC and available at the SEC’s website at www.sec.gov. SEC filings for Qualcomm are also available in the Investor Relations section of Qualcomm’s website at www.qualcomm.com.

Qualcomm is not obligated to update, or continue to provide information with respect to, any forward-looking statement, whether as a result of new information, future events or otherwise after the date of this press release. Readers are cautioned not to place undue reliance on these forward-looking statements, which speak only as of their dates.

Qualcomm Contacts:

Pete Lancia
Corporate Communications
Phone: 1-858-845-5959
email: corpcomm@qualcomm.com

Mauricio Lopez-Hodoyan
Investor Relations
Phone: 1-858-658-4813
email: ir@qualcomm.com

Information Agent Contact:

Global Bondholder Services Corporation
Phone: 1-866-470-3900 (toll free)
1-212-430-3774 (collect)

Related Links :

http://www.qualcomm.com/

ChipMOS REPORTS SECOND QUARTER 2020 RESULTS

  • Revenue Increases 10.7% in 2Q20 Compared to 2Q19
  • Gross Profit Increases 34.1% in 2Q20 Compared to 2Q19
  • Net Debt Reduced by US$49.9 Million to US$144.1 Million in 2Q20, with a US$189.3 Million Balance of Retained Cash and Cash Equivalents
  • Distributed Cash Dividend of NT$1.8 Per Common Share on July 31, 2020 and US$1.227 Per ADS on August 7, 2020

HSINCHU, Aug. 11, 2020 /PRNewswire-FirstCall/ — ChipMOS TECHNOLOGIES INC. ("ChipMOS" or the "Company") (Taiwan Stock Exchange: 8150 and NASDAQ: IMOS), an industry leading provider of outsourced semiconductor assembly and test services ("OSAT"), today reported consolidated financial results for the second quarter ended June 30, 2020. All U.S. dollar figures cited in this press release are based on the exchange rate of NT$29.44 against US$1.00 as of June 30, 2020.

All the figures were prepared in accordance with Taiwan-International Financial Reporting Standards ("Taiwan-IFRS").

Revenue for the second quarter of 2020 was NT$5,428.1 million or US$184.4 million, a decrease of 2.8% from NT$5,586.8 million or US$189.8 million in the first quarter of 2020 and an increase of 10.7% from NT$4,905.3 million or US$166.6 million for the same period in 2019. The second quarter of 2020 revenue level represents a six-year high for the Company.  

Net profit attributable to equity holders of the Company for the second quarter of 2020 was NT$544.9 million or US$18.5 million, and NT$0.75 or US$0.025 per basic common share, as compared to NT$712.7 million or US$24.2 million, and NT$0.98 or US$0.033 per basic common share in the first quarter of 2020, and NT$1,274.6 million or US$43.3 million, and NT$1.75 or US$0.06 per basic common share in the second quarter of 2019.  Net earnings for the second quarter of 2020 were US$0.51 per basic ADS, compared to US$0.67 per basic ADS for the first quarter of 2020 and US$1.19 per basic ADS in the second quarter of 2019. 

As of June 30, 2020, the Company’s retained balance of cash and cash equivalents was US$189.3 million, after the US$49.9 million reduction in its net debt during the second quarter 2020 to US$144.1 million.  The Company distributed a cash dividend of NT$1.8 per common share on July 31, 2020 and US$1.227 per ADS on August 7, 2020 or approximately US$0.949 per ADS after the Taiwan withholding tax and Citibank, N.A.’s depositary fees.

Second Quarter 2020 Investor Conference Call / Webcast Details

  1. Date: Tuesday, August 11, 2020
    Time: 4:00PM Taiwan (4:00AM New York)
    Dial-In: +886-2-21928016
    Password: 166416 #
    Webcast of Live Call and Replay: http://wms.gridow.com/ir/chipmos/chipmos_2020Q2_ch.html Replay Starting 2 Hours After Live Call Ends
    Language: Mandarin
  2. Date: Tuesday, August 11, 2020
    Time: 8:00PM Taiwan (8:00AM New York)
    Dial-In: +1-201-689-8562
    Password: 13706850
    Replay Starting 2 Hours After Live Call Ends: +1-412-317-6671, with ID 13706850
    Webcast of Live Call and Replay: http://wms.gridow.com/ir/chipmos/chipmos_2020Q2_en.html  
    Language: English

About ChipMOS TECHNOLOGIES INC.:

ChipMOS TECHNOLOGIES INC. ("ChipMOS" or the "Company") (Taiwan Stock Exchange: 8150 and NASDAQ: IMOS) (https://www.chipmos.com) is an industry leading provider of outsourced semiconductor assembly and test services. With advanced facilities in Hsinchu Science Park, Hsinchu Industrial Park and Southern Taiwan Science Park in Taiwan, ChipMOS provide assembly and test services to a broad range of customers, including leading fabless semiconductor companies, integrated device manufacturers and independent semiconductor foundries.

Forward-Looking Statements

This press release may contain certain forward-looking statements. These forward-looking statements may be identified by words such as ‘believes,’ ‘expects,’ ‘anticipates,’ ‘projects,’ ‘intends,’ ‘should,’ ‘seeks,’ ‘estimates,’ ‘future’ or similar expressions or by discussion of, among other things, strategy, goals, plans or intentions. These statements may include financial projections and estimates and their underlying assumptions, statements regarding plans, objectives and expectations with respect to future operations, products and services, and statements regarding future performance. Actual results may differ materially in the future from those reflected in forward-looking statements contained in this document, due to various factors, including the potential impact of COVID-19. Further information regarding these risks, uncertainties and other factors are included in the Company’s most recent Annual Report on Form 20-F filed with the U.S. Securities and Exchange Commission (the "SEC") and in the Company’s other filings with the SEC.

Contacts:

In Taiwan

Jesse Huang

ChipMOS TECHNOLOGIES INC.

+886-6-5052388 ext. 7715

IR@chipmos.com


In the U.S.

David Pasquale

Global IR Partners

+1-914-337-8801

dpasquale@globalirpartners.com 

ChipMOS REPORTS JULY 2020 REVENUE; ACHIEVES SIX-YEAR HIGH

HSINCHU, Aug. 10, 2020 /PRNewswire-FirstCall/ — ChipMOS TECHNOLOGIES INC. ("ChipMOS" or the "Company") (Taiwan Stock Exchange: 8150 and NASDAQ: IMOS), an industry leading provider of outsourced semiconductor assembly and test services ("OSAT"), today reported its unaudited consolidated revenue for the month of July 2020, which achieved a six-year high for July revenue.  All U.S. dollar figures cited in this press release are based on the exchange rate of NT$29.34 to US$1.00 as of July 31, 2020.

Revenue for the month of July 2020 was NT$1,886.6 million or US$64.3 million, an increase of 8.6% as compared to July 2019 and an increase of 5.7% compared to June 2020.  The Company noted it continues to benefit from growth in its memory business, led by Commodity DRAM and NOR flash demand in support of cloud-based storage services and applications and higher demand from the gaming market.  Within 8" COF of DDIC benefited from increase related to work from home demand for notebooks and monitors.

Consolidated Monthly Revenues (Unaudited)

July 2020

June 2020

July 2019

MoM Change

YoY Change

Revenues

(NT$ million)

1,886.6

1,784.5

1,737.3

5.7%

8.6%

Revenues

(US$ million)

64.3

60.8

59.2

5.7%

8.6%

About ChipMOS TECHNOLOGIES INC.:

ChipMOS TECHNOLOGIES INC. ("ChipMOS" or the "Company") (Taiwan Stock Exchange: 8150 and NASDAQ: IMOS) (https://www.chipmos.com) is an industry leading provider of outsourced semiconductor assembly and test services. With advanced facilities in Hsinchu Science Park, Hsinchu Industrial Park and Southern Taiwan Science Park in Taiwan, ChipMOS provide assembly and test services to a broad range of customers, including leading fabless semiconductor companies, integrated device manufacturers and independent semiconductor foundries. 

Forward-Looking Statements

This press release may contain certain forward-looking statements. These forward-looking statements may be identified by words such as ‘believes,’ ‘expects,’ ‘anticipates,’ ‘projects,’ ‘intends,’ ‘should,’ ‘seeks,’ ‘estimates,’ ‘future’ or similar expressions or by discussion of, among other things, strategy, goals, plans or intentions. These statements may include financial projections and estimates and their underlying assumptions, statements regarding plans, objectives and expectations with respect to future operations, products and services, and statements regarding future performance. Actual results may differ materially in the future from those reflected in forward-looking statements contained in this document, due to various factors, including the potential impact of COVID-19.  Further information regarding these risks, uncertainties and other factors are included in the Company’s most recent Annual Report on Form 20-F filed with the U.S. Securities and Exchange commission (the "SEC") and in the Company’s other filings with the SEC.

Contacts:

In Taiwan

Jesse Huang

ChipMOS TECHNOLOGIES INC.

+886-6-5052388 ext. 7715

IR@chipmos.com

In the U.S.

David Pasquale

Global IR Partners

+1-914-337-8801

dpasquale@globalirpartners.com


JinkoSolar reshapes PV technology scenarios with its new N-Type Tiger Pro 610W unveiled at SNEC 2020

SHANGRAO, China, Aug. 7, 2020 — JinkoSolar Holding Co., Ltd. ("JinkoSolar" or "Company") (NYSE: JKS) one of the world’s largest and most innovative module manufacturers in the world, today launched its new generation of 610W Tiger Pro High-efficiency monocrystalline TR solar module and its BIPV solutions, Building Integrated Photovoltaics product series, which will be unveiled at SNEC 2020 in Shanghai.

As a PV company that has ranked first in global modules shipments for four consecutive years, JinkoSolar has always been committed to providing global customers with high-efficiency, top quality, and extremely reliable solar modules. The key behind the success of Tiger Pro 610W is the N-Type HOT 2.0 high-efficiency cell technology, independently developed by JinkoSolar. Thanks to the introduction of new technologies, such as HOT tunneling layer passivated contact and advanced metallization, the cell efficiency has reached 24.79%, setting once again a world record for the efficiency of large area N-Type monocrystalline silicon solar cells. At the same time, the use of 78 cell design and of TR technology, which helps reduce significantly the cell gap, as well as lower the electricity cost and improve the system compatibility, represents another milestone for the PV industry in its quest for grid parity.

JinkoSolar’s module series have continuously broken the conversion efficiency record, starting from 2018, JinkoSolar Eagle PERC high-efficiency monocrystalline series, with a power of 390W and a conversion efficiency of 19.8%, followed by the Tiger HOT 1.0 high-efficiency monocrystalline series delivering a power output up to 475W and a conversion efficiency of 20.87%. The newest Tiger Pro HOT2.0, high-efficiency monocrystalline series, with its maximum output of 610W and a conversion efficiency of 22.3%, is setting once again new-standards for the industry and positioning JinkoSolar far ahead from its competitors.

Moreover, thanks to the great improvements made with the smart combination "PV + Architecture", during this edition of SNEC, JinkoSolar also unveiled its first version of colored BIPV module series. With a power output of up to 550W, this product series is available in a variety of colors and levels of translucence, incorporating modern architectural aesthetics for use as a building component.

Dr. Jin Hao, CTO of JinkoSolar, commented: "Reducing costs and increasing efficiency is the goal that the industry has always been striving for. JinkoSolar has always been committed to providing global customers with high-efficiency, top quality, and extremely reliable solar modules. We will increase our investment in R&D to ensure constant innovation in our technology, improve our products performance, and ensure the highest system compatibility. This will allow us to fulfill our commitment to offer the best service to our global customers and to allow the application of our solar modules in a variety of scenarios, further empowering the solar PV industry and achieving grid parity."

About JinkoSolar Holding Co., Ltd.

JinkoSolar (NYSE: JKS) is one of the largest and most innovative solar module manufacturers in the world. JinkoSolar distributes its solar products and sells its solutions and services to a diversified international utility, commercial and residential customer base in China, the United States, Japan, Germany, the United Kingdom, Chile, South Africa, India, Mexico, Brazil, the United Arab Emirates, Italy, Spain, France, Belgium, and other countries and regions. JinkoSolar has built a vertically integrated solar product value chain, with an integrated annual capacity of 17.5 GW for mono wafers, 10.6 GW for solar cells, and 16 GW for solar modules, as of March 31, 2020.

JinkoSolar has over 15,000 employees across its 7 productions facilities globally, 14 overseas subsidiaries in Japan, South Korea, Vietnam, India, Turkey, Germany, Italy, Switzerland, United States, Mexico, Brazil, Chile and Australia, and global sales teams in China, United Kingdom, France, Spain, Bulgaria, Greece, Ukraine, Jordan, Saudi Arabia, Tunisia, Morocco, Kenya, South Africa, Costa Rica, Colombia, Panama, Kazakhstan, Malaysia, Myanmar, Sri Lanka, Thailand, Vietnam, Poland and Argentina.

To find out more, please see: www.jinkosolar.com

Safe Harbor Statement

This press release contains forward-looking statements. These statements constitute "forward-looking" statements within the meaning of Section 27A of the Securities Act of 1933, as amended, and Section 21E of the Securities Exchange Act of 1934, as amended, and as defined in the U.S. Private Securities Litigation Reform Act of 1995. These forward-looking statements can be identified by terminology such as "will," "expects," "anticipates," "future," "intends, "plans," "believes," "estimates" and similar statements. Among other things, the quotations from management in this press release and the Company’s operations and business outlook, contain forward-looking statements. Such statements involve certain risks and uncertainties that could cause actual results to differ materially from those in the forward-looking statements. Further information regarding these and other risks is included in JinkoSolar’s filings with the U.S. Securities and Exchange Commission, including its annual report on Form 20-F. Except as required by law, the Company does not undertake any obligation to update any forward-looking statements, whether as a result of new information, future events or otherwise.

For investor and media inquiries, please contact:

Ms. Ripple Zhang
JinkoSolar Holding Co., Ltd.
Tel: +86 21-5183-3105
Email: pr@jinkosolar.com

Related Links :

http://www.jinkosolar.com

Canadian Solar Reports Second Quarter 2020 Results

GUELPH, ON, Aug. 7, 2020 — Canadian Solar Inc. ("Canadian Solar" or the "Company") (NASDAQ: CSIQ) today announced financial results for the quarter ended June 30, 2020.

Second Quarter 2020 Highlights

  • 31% sequential increase in total module shipments to 2.9 GW, exceeding guidance of 2.5 GW to 2.7 GW.
  • Net revenue of $696 million exceeding guidance of $630 million to $680 million.
  • Gross margin of 21.2% exceeding guidance of 18.5% to 20.5%.
  • 17% reduction in operating expenses compared to the second quarter of 2019.
  • Net income attributable to Canadian Solar of $20.6 million or $0.34 per diluted share.
  • Updated shipment guidance to 11 GW to 12 GW for 2020, and 18 GW to 20 GW for 2021.

Dr. Shawn Qu, Chairman and CEO, commented, "Despite challenging market conditions, second quarter results exceeded expectations both on revenue and profits. Over the past 19 years, we have built a strong foundation and track record based on technology innovation, all-around product execution, robust customer channels and prudent capital deployment. This foundation has helped us to dynamically adjust to changing market environments and consistently deliver a market-leading return on capital and equity.

Last week, we announced the plan to list our Module and System Solutions ("MSS") business on China’s stock market. If successful, it will give us greater access to additional, lower-cost sources of capital and allow us to grow faster at a time when we believe growth in the solar industry and market consolidation are both set to accelerate. We have started the pre-IPO capital raising process to bring in new partners to our MSS business and convert it into a Sino-foreign joint stock company, which is required by Chinese security regulations for listing in China’s stock market. This investment round is expected to be completed by the end of September, and will also allow us to immediately expand our manufacturing capacity using the best available technologies and equipment to support our newly set module shipment plan for 2021.

In addition, we believe the listing will help us unlock value for shareholders by addressing our valuation gap relative to China-listed solar companies. Meanwhile, as a Canadian-based global company, we remain fully committed to our NASDAQ listing and remain focused on expanding our Energy business worldwide by growing our high-quality project pipeline and sales, and increasing our partial ownership of select solar and storage projects."

Yan Zhuang, President and COO, said, "We are benefiting from a demand rebound across most of our markets, with our order backlog for the second half of 2020 and even next year already exceeding our previous expectations. While the current polysilicon supply disruption and shortage presents a near-term challenge, we are positioning ourselves for long-term growth. On the one hand, we will expand capacity and increase the level of vertical integration in our module business, which will allow us to capture more global market share, enhance pricing power, control costs and improve profitability in an industry that is rapidly consolidating. On the other hand, we are building our technological capabilities in the solar PV plus storage space, gearing up for new growth opportunities as adoption of clean solar energy accelerates."

Dr. Huifeng Chang, Senior VP and CFO, added, "As the industry demand and capital market conditions are both improving, we are working to strike a balance between investing for long-term growth and preserving cash. In the near term, uncertainties remain around the impact of the ongoing pandemic, geopolitical and policy risks. In the medium- to longer-term, the plan to list our MSS business in China’s stock market will give us the additional resources to deliver higher future earnings growth and return on capital. We remain disciplined in our capital allocation decisions, as always, and will continue to monitor the market and adjust to changes."

Second Quarter 2020 Results

Total module shipments in the second quarter of 2020 increased to 2,905 MW from 2,214 MW in the first quarter of 2020, and 2,143 MW in the second quarter of 2019. Growth in shipments was driven by moderate market share gains. Of the total, 281 MW was shipped to the Company’s utility-scale solar power projects in the second quarter of 2020.

Net revenue in the second quarter of 2020 was $696 million, compared to $826 million in the first quarter of 2020, and $1,036 million in the second quarter of 2019. Growth in module shipments and EPC service revenues were offset by lower average module selling prices ("ASP") and limited project sales. Project execution and sales schedules have been delayed due to the impact of COVID-19. That said, the Company is making headway and recently announced the financial closing of the 367 MWp Maplewood projects in Texas, for example.

Gross profit in the second quarter of 2020 was $147 million, compared to $223 million in the first quarter of 2020, and $183 million in the second quarter of 2019. Gross margin in the second quarter of 2020 was 21.2%, compared to 27.0% in the first quarter of 2020, and 17.6% in the second quarter of 2019. Gross margin was 18.2% excluding the benefit of a U.S. anti-dumping ("AD") and countervailing duty ("CVD") true-up of $20.4 million. The lower gross margin was anticipated given the significant decline in ASPs, partially offset by lower manufacturing costs.

Income from operations in the second quarter of 2020 was $45 million, compared to $113 million in the first quarter of 2020, and $61 million in the second quarter of 2019. The decline was partially offset by a 17% year-over-year reduction in the Company’s operating expenses to $102 million in the second quarter of 2020.

Non-cash depreciation and amortization charges in the second quarter of 2020 were $48 million, compared to $45 million in the first quarter of 2020, and $40 million in the second quarter of 2019.

Net foreign exchange loss in the second quarter was $4.5 million, compared to a net loss of $1 million in the first quarter of 2020 and a net gain of $4 million in the second quarter of 2019. The higher foreign exchange loss was mainly due to unfavorable moves in the Brazilian Real and the Thai Baht.

Income tax expense in the second quarter of 2020 was $9 million, compared to an income tax benefit of $29 million in the first quarter of 2020 and an income tax expense of $14 million in the second quarter of 2019.

Net income attributable to Canadian Solar in the second quarter of 2020 was $20.6 million, or $0.34 per diluted share, compared to net income of $110.6 million, or $1.84 per diluted share in the first quarter of 2020, and net income of $62.7 million, or $1.04 per diluted share in the second quarter of 2019.

Net cash used in operating activities in the second quarter of 2020 was approximately $114 million, compared to $105 million in the first quarter of 2019.

Module and System Solutions (MSS) Business Segment

Manufacturing Capacity

The table below sets forth the Company’s manufacturing capacity expansion plan until September 30, 2020. The Company is working on its new 2021 capacity expansion plans and will provide an update in the next quarter.

Manufacturing Capacity (MW)

June 30, 2020

Actual

September 30,
2020

Planned

December 31,
2020

Planned

Ingot

1,850

1,920

1,920

Wafer

5,000

5,000

5,500

Cell

9,700

10,050

10,150

Module

13,950

14,010

16,060

The Company’s manufacturing capacity expansion plan is subject to change based on market conditions and the Company’s capital allocation plan.

Operating Results 

The following table presents unaudited select results of operations data of the Company’s MSS business segment for the periods indicated.

MSS Business Segment Financial Results* 

(In Thousands of U.S. Dollars, Except Percentages and Unless Otherwise Stated)

Three Months Ended

Six Months Ended

June 30, 2020

March 31, 2020

June 30, 2019

June 30, 2020

June 30, 2019

Net revenues

706,155

689,799

673,116

1,395,954

1,142,017

Cost of revenues

557,263

540,931

519,376

1,098,194

889,040

Gross profit

148,892

148,868

153,740

297,760

252,977

Operating expenses

85,670

87,370

95,303

173,040

173,799

Income (loss) from operations

63,222

61,498

58,437

124,720

79,178

Gross margin

21.1%

21.6%

22.8%

21.3%

22.2%

Operating margin

9.0%

8.9%

8.7%

8.9%

6.9%

*Includes effects of both sales to third party customers and to the Company’s Energy Business Segment. Please refer to the attached
financial tables for intercompany transaction elimination information. Income from operations reflect management’s allocation and
estimate as some services are shared by the Company’s two business segments.


The table below provides the geographic distribution of the net revenue of the MSS business:

MSS Net Revenues Geographic Distribution* (In Millions of U.S. Dollars, Except Percentages)

Q2 2020

% of Net Revenues

Q1 2020

% of Net Revenues

Q2 2019

% of Net Revenues

Asia

261

39

175

30

236

36

Americas

215

32

252

43

181

27

Europe and others

193

29

161

27

244

37

Total

669

100

588

100

661

100

*Excludes sales from the MSS business to the Energy business.

Canadian Solar shipped 2.9 GW of modules to more than 80 countries in the second quarter of 2020. The top five markets of the MSS business ranked by revenues were the U.S., Japan, China, Spain and Australia.

Multi-crystalline modules accounted for 65% of the Company’s module shipments in the second quarter of 2020, and mono-crystalline modules accounted for 35%. The Company has the flexibility to produce both multi-crystalline and mono-crystalline modules, with the mix decision depending on the relative profitability and levelized cost of electricity ("LCOE") of the alternative products.

Energy Business Segment

Energy Business Strategy

Canadian Solar has one of the world’s largest utility-scale solar project development platforms, with a track record of originating, developing, financing, building and bringing into commercial operation over 5.6 GWp of solar power plants across six continents. As a first mover, the Company has acquired extensive experience and built a leadership position in solar project development, with a current total project backlog and pipeline of 15.1 GWp.

Traditionally, the operating model for the Company’s Energy business has been to sell projects when they reach either their notice to proceed date ("NTP") or commercial operation date ("COD"), depending on the optimal exit point for each project based on its specific risk and return profile. In certain cases, the Company has retained a minority ownership interest in order to capture additional operational value throughout the partial ownership holding period, while accelerating capital turnover into developing new solar projects. An example of this is the Canadian Solar Infrastructure Fund ("CSIF"), a publicly traded investment fund akin to a real estate investment trust, holding operating solar assets in Japan. CSIF has been listed on the Tokyo Stock Exchange since 2017 and remains 15%-owned by the Company. In addition to continuing to grow its project backlog and pipeline, the Company is evaluating ways to replicate its successful Japanese strategy in other markets, focusing on those regions with strong energy demand, attractive power prices and project returns, and stable capital markets. There are two key benefits to this approach:

  • It will permit Canadian Solar to capture higher margins while recycling a large portion of capital. Meanwhile, it will allow the Company to build a base of stable and long-term cash flows from power sales, operations and maintenance ("O&M"), asset management and other services; and create new growth opportunities, including energy storage systems integration and optimization.
  • Over time, the addition of more predictable and stable revenues and cash flows from power sales, O&M, asset management and other services will help smooth typical lumpiness associated with the development and sale of solar power projects.

Management targets are to achieve the following project sales and accumulated project ownership retained in the next 5 years:

Energy Business Targets

2020

2021

2022

2023

2024

Annual Project Sales, GWp

1.1-1.3

1.8-2.3

2.4-2.9

3.2-3.7

3.6-4.1

Cumulative Projects Retained (including inventory to be sold), MWp

~30

~130

~410

~760

~960


Note: There are uncertainties regarding the closing dates of project sales in 2020 due to COVID-19 disruptions. Forecasts for annual project sales
include both projects sold at NTP and COD, which have a significant impact on revenue but more limited impact on profits. Final timing and
recognition of project sales may be impacted by various external factors. These targets are subject to change without notice.

To help finance this business strategy, the Company is evaluating ways to create capital partnerships with investors seeking long-term stable cash flows through investments in clean, profitable and countercyclical solar energy infrastructure investments, via public or private investment vehicles. Given the low interest rate environment, management believes the Company’s solar assets are highly attractive to investors seeking stable yields, which will help build sustainable long-term value for Canadian Solar’s shareholders. The Company will make further progress updates as it executes on this strategy.

Project Backlog and Pipeline

As of June 30, 2020, the Company’s total project backlog and pipeline totaled 15.1 GWp, of which the project backlog totaled 4.2 GWp. The backlog includes projects that have passed their Cliff Risk Date and are expected to be built in the next one to four years. A project’s Cliff Risk Date depends on the country where the project is located and is defined as the date on which the project passes the last of the high-risk development stages. This is usually the receipt of all required environmental and regulatory approvals, interconnection agreements, feed-in tariff ("FIT") arrangements and power purchase agreements ("PPAs"). All projects in the current backlog have secured a PPA or FIT or are reasonably assured of securing one.

The Company’s project pipeline totaled 10.9 GWp as of June 30, 2020. The pipeline includes early- to mid-stage project opportunities currently under development but that are yet to be de-risked.

Project Backlog and Pipeline (as of June 30, 2020)

Region

Backlog

Pipeline

Total

North America

1,544

4,101

5,645

Latin America

1,539

3,657

5,196

Europe, the Middle East and Africa ("EMEA")

383

2,148

2,531

Japan

220

0

220

Asia Pacific excluding Japan

547

927

1,474

China

0

80

80

Total

4,233

10,913

15,146

Note: Backlog represents the gross MWp size of projects, including 63 MWp in Latin America and 124
MWp in EMEA that have already been sold to third parties or are not owned by Canadian Solar.


The Company believes there are significant growth opportunities in the solar plus storage market, given declining battery storage costs, higher capacity needs and accelerating retirements of fossil fuel power plants. The Company further believes it is uniquely positioned to deliver solar plus storage solutions to its customers given its integrated business model as a top-tier module technology manufacturer and global project developer, and is committed to expanding its presence in this space.

The table below sets forth the Company’s storage project backlog and pipeline as of June 30, 2020, which almost doubled compared to the previous quarter.

Backlog

Pipeline

Total

Storage (MWh)

1,201

3,482

4,683

Projects in Construction

In addition to its project backlog and pipeline, the Company has 839 MWp of solar projects in construction.

Projects in Construction (as of June 30, 2020)

Region

MWp

Expected COD

North America

32

2020-21

Latin America

732

2020-21

Japan

70

2020-21

Asia Pacific ex. Japan

5

2020

Total

839

Note: Latin America portfolio includes 508 MWp of projects already
sold at NTP, with milestone revenue recognition over the 2019-2021
period.

The Company has a sizable amount of premium, high FIT projects in Japan. The table below sets forth the expected COD schedule of the Company’s project backlog in development and construction in Japan, as of June 30, 2020:

Expected COD Schedule (MWp) 

2020

2021

2022 and
Thereafter

Total

13

66

211

290

Solar Power Plants in Operation

As of June 30, 2020, the Company’s power plants in operation totaled 956 MWp, with an estimated total resale value of approximately $773 million to Canadian Solar. The estimated resale value is based on selling prices that Canadian Solar is currently negotiating or transaction prices of similar assets in the relevant markets.

North America

Latin America

Japan

Asia Pacific ex. Japan

China

Total

216

100

85

96

459

956

Note: The table represents the gross MWp size of the power plants in operation, including 108 MWp in North
America and 26 MWp in Asia Pacific, excluding Japan, already sold to third parties.

Operating Results

The following table presents unaudited select results of operations data of the Company’s Energy business segment for the periods indicated.

Energy Business Segment Financial Results

(In Thousands of U.S. Dollars, Except Percentages and Unless Otherwise Stated)

Three Months Ended

Six Months Ended

June 30, 2020

March 31, 2020

June 30, 2019

June 30, 2020

June 30, 2019

Net revenues

26,661

238,088

374,938

264,749

406,525

Cost of revenues

15,083

148,339

353,529

163,422

375,703

Gross profit

11,578

89,749

21,409

101,327

30,822

Operating expenses

16,074

22,391

26,597

38,465

48,935

Income (loss) from operations

(4,496)

67,358

(5,188)

62,862

(18,113)

Gross margin

43.4%

37.7%

5.7%

38.3%

7.6%

Operating margin

-16.9%

28.3%

-1.4%

23.7%

-4.5%

Business Outlook

The Company’s business outlook is based on management’s current views and estimates given existing market conditions, order book, production capacity, anticipated timing of project sales, and the global economic environment. This outlook is subject to uncertainty with respect to, among other things, final customer demand, project construction and sale schedules, and the global impact of the ongoing COVID-19 pandemic. Management’s views and estimates are subject to change without notice.

For the third quarter of 2020, the Company expects total module shipments to be in the range of 2.9 GW to 3.1 GW, including approximately 300 MW of module shipments to the Company’s own projects that may not be immediately recognized as revenues. Total revenues are expected to be in the range of $840 million to $890 million, with gross margin expected to be between 14% and 16%.

For the full year of 2020, the Company now expects shipments to be in the range of 11 GW to 12 GW.

Management expects the demand in 2021 to be strong, according to various research reports and Canadian Solar’s own sales feedback. At the same time, industry consolidation is set to accelerate as customer preferences become more sophisticated around quality and service, increasingly choosing top tier solar brands.

As a result, Canadian Solar is positioning itself more assertively for returns-accretive growth. The Company is currently planning for 18 GW to 20 GW of shipments in 2021.

Dr. Shawn Qu, Chairman and CEO, commented, "We are encouraged to see demand rebounding globally, as more companies and consumers worldwide insist on sustainable power sources. For our Energy Business, our pipeline growth and project execution are making progress, although uncertainty remains around the timing and recognition of certain project sales. On the MSS side, we expect near-term margin pressure given cost increases from polysilicon supply shortages; however, given our leadership position in premium markets, we are able to share a portion of the higher costs with customers. Importantly, we expect the impact of the polysilicon supply disruption to lessen over the coming quarters as polysilicon suppliers restore their temporarily shut-down capacities and restart some of the currently idled, higher-cost capacities.

We plan to expand our market share as we increase our low-cost manufacturing capacity of high-quality modules, which will be supported by the pre-IPO round of capital raising for our MSS business. The improved access to capital through the expected China listing will help us to further capitalize on accelerating secular growth in solar demand, and to unlock sustainable value for our shareholders."

Changes to the Board of Directors

Mr. Karl Olsoni was nominated by the Company and approved by shareholders as a new independent director during the 2020 Annual Meeting of Shareholders. He will serve on the Audit and Compensation Committees. Mr. Olsoni has served as a strategic advisor to the Board of Directors since January 2020.

Furthermore, the Board of Directors has accepted the resignation of Mr. Robert K. McDermott, who has played an instrumental role in the Company’s success since his appointment as lead independent director in 2006. "On behalf of our Board of Directors and the Company, I thank Bob for his valuable service and contributions and wish him well in future endeavors," said Dr. Qu.

Recent Developments

On August 4, 2020, Canadian Solar announced that it commenced the construction of a 10 MWp solar power plant in Germany.

On July 27, 2020, Canadian Solar announced that a special committee of independent directors of the Company, with the assistance of outside financial and legal advisors, completed a review of strategic alternatives available to the Company and the board of directors of the Company decided to pursue a listing of the Company’s MSS business on either the Shanghai Stock Exchange’s Science and Technology Innovation Board or the Shenzhen Stock Exchange’s ChiNext Market.

On July 21, 2020, Canadian Solar announced its wholly-owned subsidiary Recurrent Energy closed $282 million of debt financing to construct its Maplewood and Maplewood 2 solar power projects totaling 367 MWp in Texas.

On June 23, 2020, Canadian Solar announced it signed two private power purchase agreements with Braskem S.A. and COPEL Energia for a total of 274 MWp of solar power projects in Brazil.

Conference Call Information

The Company will hold a conference call at 8:00 a.m. U.S. Eastern Daylight Time on August 7, 2020 (8:00 p.m., August 7, 2020 in Hong Kong) to discuss the Company’s second quarter 2020 results and business outlook. The dial-in phone number for the live audio call is 1-866-519-4004 (toll-free from the U.S.), +852-3018-6771 (local dial-in from Hong Kong) or +1 845-675-0437 (from international locations). The passcode for the call is 8068256.  A live webcast of the conference call will also be available on the Investor Relations section of Canadian Solar’s website at www.canadiansolar.com.

A replay of the call will be available two hours after the conclusion of the call until 9:00 a.m. U.S. Eastern Daylight Time on Saturday, August 15, 2020 (9:00 p.m., August 15, 2020 in Hong Kong) and can be accessed by dialing +1-855-452-5696 (toll-free from the U.S.), +852-3051-2780 (local dial-in from Hong Kong) or +1-646-254-3697 (from international locations), with passcode 8068256.  A webcast replay will also be available on the investor relations section of Canadian Solar’s at www.canadiansolar.com.

About Canadian Solar Inc.

Canadian Solar was founded in 2001 in Canada and is one of the world’s largest solar power companies. It is a leading manufacturer of solar photovoltaic modules and provider of solar energy solutions and has a geographically diversified pipeline of utility-scale solar power projects in various stages of development. Over the past 19 years, Canadian Solar has successfully delivered over 46 GW of premium-quality, solar photovoltaic modules to customers in over 150 countries. Canadian Solar is one of the most bankable companies in the solar industry, having been publicly listed on NASDAQ since 2006. For additional information about the Company, follow Canadian Solar on LinkedIn or visit www.canadiansolar.com.

Safe Harbor/Forward-Looking Statements

Certain statements in this press release regarding the Company’s expected future shipment volumes, gross margins are forward-looking statements that involve a number of risks and uncertainties that could cause actual results to differ materially. These statements are made under the "Safe Harbor" provisions of the U.S. Private Securities Litigation Reform Act of 1995. In some cases, you can identify forward-looking statements by such terms as "believes," "expects," "anticipates," "intends," "estimates," the negative of these terms, or other comparable terminology. Factors that could cause actual results to differ include general business and economic conditions and the state of the solar industry; volatility, uncertainty, delays and disruptions related to the COVID-19 pandemic; governmental support for the deployment of solar power; future available supplies of high-purity silicon; demand for end-use products by consumers and inventory levels of such products in the supply chain; changes in demand from significant customers; changes in demand from major markets such as Japan, the U.S., India, China and Brazil; changes in customer order patterns; changes in product mix; capacity utilization; level of competition; pricing pressure and declines in average selling prices; delays in new product introduction; delays in utility-scale project approval process; delays in utility-scale project construction; delays in the completion of project sales; continued success in technological innovations and delivery of products with the features customers demand; shortage in supply of materials or capacity requirements; availability of financing; exchange rate fluctuations; litigation and other risks as described in the Company’s SEC filings, including its annual report on Form 20-F filed on April 28, 2020. Although the Company believes that the expectations reflected in the forward-looking statements are reasonable, it cannot guarantee future results, level of activity, performance, or achievements. Investors should not place undue reliance on these forward-looking statements. All information provided in this press release is as of today’s date, unless otherwise stated, and Canadian Solar undertakes no duty to update such information, except as required under applicable law.

FINANCIAL TABLES FOLLOW


The following tables provide unaudited select financial data for the Company’s Module and System Solutions
("MSS") and Energy businesses:

Select Financial Data – Module and System Solutions, and Energy

Three Months Ended June 30, 2020
(In Thousands of U.S. Dollars, Except Percentages)

MSS

Energy

Elimination

Total

Net revenues 

$706,155

$26,661

($36,970)

$695,846

Cost of revenues

557,263

15,083

(23,712)

548,634

Gross profit

148,892

11,578

(13,258)

147,212

Gross margin

21.1%

43.4%

21.2%

Income (loss) from
  operations

63,222

(4,496)

(13,258)

45,468

Select Financial Data – Module and System Solutions, and
Energy

Six Months Ended June 30, 2020
(In Thousands of U.S. Dollars, Except Percentages)

MSS

Energy

Elimination

Total

Net revenues 

$1,395,954

$264,749

($139,222)

$1,521,481

Cost of revenues

1,098,194

163,422

(110,544)

1,151,072

Gross profit

297,760

101,327

(28,678)

370,409

Gross margin

21.3%

38.3%

24.3%

Income (loss) from
  operations

124,720

62,862

(28,678)

158,904


Select Financial Data – Module and System Solutions, and Energy

Three Months Ended

June 30, 2020 

Six Months Ended

June 30, 2020

(In Thousands of U.S. Dollars)

MSS Revenues:

Solar modules and other solar power
products

$ 613,068

$ 1,158,962

Solar system kits

42,901

72,098

EPC services

3,164

3,922

Others (materials and components)

10,052

21,750

Subtotal

$ 669,185

$ 1,256,732

Energy Revenues:

Solar power projects

$ 2,685

$ 230,439

Electricity

1,882

2,930

O&M services

5,027

10,213

Others (EPC and development services)

17,067

21,167

Subtotal

$ 26,661

$ 264,749

Total net revenues

$ 695,846

$ 1,521,481


Canadian Solar Inc.

Unaudited Condensed Consolidated Statements of Operations

(In Thousands of U.S. Dollars, Except Share and Per Share Data and Unless Otherwise Stated)

Three Months Ended

Six Months Ended

June 30,

March 31,

June 30,

June 30,

June 30,

2020

2020

2019

2020

2019

Net revenues

$ 695,846

$ 825,635

$ 1,036,275

$ 1,521,481

$ 1,520,994

Cost of revenues

548,634

602,438

853,633

1,151,072

1,230,913

Gross profit

147,212

223,197

182,642

370,409

290,081

Operating expenses:

Selling expenses

53,463

52,659

45,361

106,122

83,292

General and administrative
expenses

46,354

52,961

65,735

99,315

117,159

Research and development
expenses

10,924

10,056

12,133

20,980

25,298

Other operating income

(8,997)

(5,915)

(1,329)

(14,912)

(3,015)

Total operating expenses

101,744

109,761

121,900

211,505

222,734

Income from operations

45,468

113,436

60,742

158,904

67,347

Other income (expenses):

Interest expense

(16,960)

(19,013)

(20,654)

(35,973)

(42,352)

Interest income

2,081

2,779

4,452

4,859

6,481

Gain (loss) on change in
fair value of derivatives, net

(2,349)

33,109

(12,489)

30,759

(13,748)

Foreign exchange gain
(loss), net

(2,192)

(34,119)

16,415

(36,311)

3,828

Investment income (loss)

1,525

(14,012)

2,002

(12,487)

2,547

Other expenses, net

(17,895)

(31,256)

(10,274)

(49,153)

(43,244)

Income before income taxes and
equity in earnings of
unconsolidated investees

27,573

82,180

50,468

109,751

24,103

Income tax benefit (expense)

(8,899)

29,051

(13,951)

20,154

(6,423)

Equity in earnings of
unconsolidated investees

1,739

16

23,740

1,755

25,721

Net income

20,413

111,247

60,257

131,660

43,401

Less: Net income (loss)
attributable to non-controlling
interests

(191)

616

(2,425)

425

(2,116)

Net income attributable to
Canadian Solar Inc.

$ 20,604

$ 110,631

$ 62,682

$ 131,235

$ 45,517

Earnings per share – basic

$   0.35

$   1.86

$   1.05

$ 2.20

$   0.77

Shares used in computation – basic

59,371,856

59,376,332

59,547,209

59,539,092

59,389,975

Earnings per share – diluted

$   0.34

$   1.84

$   1.04

$ 2.18

$   0.76

Shares used in computation –
diluted

59,793,196

60,084,298

60,260,410

60,127,369

60,272,536


Canadian Solar Inc.

Unaudited Condensed Consolidated Statement of Comprehensive Income

(In Thousands of U.S. Dollars)

 Three Months Ended

Six Months Ended

June 30,

March 31,

June 30,

June 30,

June 30,

2020

2020

2019

2020

2019

Net Income

20,413

111,247

60,257

131,660

43,401

Other comprehensive income (net
of tax of nil):

Foreign currency translation
adjustment

30,997

(45,971)

(11,170)

(14,974)

4,815

De-recognition of commodity hedge
and interest rate swap

4,439

4,439

Loss on changes in fair value of
derivatives

(104)

(4,011)

(3,310)

(4,115)

(5,680)

Comprehensive income

55,745

61,265

45,777

117,010

42,536

Less: comprehensive income(loss)
attributable to non-controlling
interests

3,802

(1,441)

(1,028)

2,361

(5,355)

Comprehensive income
attributable to Canadian Solar Inc.

51,943

62,706

46,805

114,649

47,891


Canadian Solar Inc.

Unaudited Condensed Consolidated Balance Sheets

(In Thousands of U.S. Dollars)

June 30,

December 31,

2020

2019

ASSETS

Current assets:

Cash and cash equivalents

$    578,815

$     668,770

Restricted cash

398,739

526,723

Accounts receivable trade, net

421,691

436,815

Accounts receivable, unbilled

16,096

15,256

Amounts due from related parties

18,052

31,232

Inventories

547,106

554,070

Value added tax recoverable

109,358

108,920

Advances to suppliers

49,504

47,978

Derivative assets

5,989

5,547

Project assets

653,750

604,083

Prepaid expenses and other current assets

397,300

253,542

Total current assets

3,196,400

3,252,936

Restricted cash

16,766

9,927

Property, plant and equipment, net

970,065

1,046,035

Solar power systems, net

49,654

52,957

Deferred tax assets, net

136,267

153,963

Advances to suppliers

41,484

40,897

Prepaid land use right

58,800

60,836

Investments in affiliates

79,322

152,828

Intangible assets, net

22,430

22,791

Project assets

492,519

483,051

Right-of-use assets

30,162

37,733

Other non-current assets

164,661

153,253

TOTAL ASSETS

$    5,258,530

$       5,467,207


Canadian Solar Inc.

Unaudited Condensed Consolidated Balance Sheets (Continued)

(In Thousands of U.S. Dollars)

June 30,

December 31,

2020

2019

Current liabilities:

Short-term borrowings

$    1,015,749

$    933,120

Long-term borrowings on project assets –
current

179,978

286,173

Accounts payable

460,817

585,601

Notes payable

472,000

544,991

Amounts due to related parties

3,989

10,077

Other payables

448,973

446,454

Advance from customers

69,546

134,806

Derivative liabilities

10,461

10,481

Operating lease liabilities

17,218

18,767

Other current liabilities

112,496

121,527

Total current liabilities

2,791,227

3,091,997

Accrued warranty costs

47,280

55,878

Long-term borrowings

580,442

619,477

Derivatives liabilities

5,374

1,841

Liability for uncertain tax positions

15,543

15,353

Deferred tax liabilities

54,689

56,463

Loss contingency accruals

26,828

28,513

Operating lease liabilities

15,523

20,718

Financing liabilities

75,457

76,575

Other non-current liabilities

97,207

75,334

Total LIABILITIES

3,709,570

4,042,149

Equity:

Common shares

686,425

703,806

Treasury stock

(11,845)

Additional paid-in capital

22,989

17,179

Retained earnings

924,836

793,601

Accumulated other comprehensive loss

(126,193)

(109,607)

Total Canadian Solar Inc. shareholders’ equity

1,508,057

1,393,134

Non-controlling interests in subsidiaries

40,903

31,924

TOTAL EQUITY

1,548,960

1,425,058

TOTAL LIABILITIES AND EQUITY

$    5,258,530

$     5,467,207


About Non-GAAP Financial Measures

To supplement its financial disclosures presented in accordance with GAAP, the Company uses non-GAAP measures which are adjusted from the most comparable GAAP measures for certain items as described below. The Company presents non-GAAP net income and diluted earnings per share so that readers can better understand the underlying operating performance of the business before the impact of AD/CVD true-up provisions. The non-GAAP numbers are not measures of financial performance under U.S. GAAP, and should not be considered in isolation or as an alternative to other measures determined in accordance with GAAP. These non-GAAP measures may differ from non-GAAP measures used by other companies, and therefore their comparability may be limited.

Statement of Operations Data:

(In Thousands of U.S. Dollars, Except Share and Per Share Data)

Three Months Ended

Six Months Ended

June 30,

2020

June 30,

2019

June 30,

2020

June 30,

2019

GAAP net income attributable to Canadian
Solar Inc.

20,604

62,682

131,235

45,517

Non-GAAP income adjustment items:

AD/CVD provision true-up

(20,397)

(21,617)

(20,397)

(21,617)

Tax impact

5,054

5,365

5,054

5,365

Non-GAAP net income attributable to
Canadian Solar Inc.

5,261

46,430

115,892

29,265

GAAP income per share – diluted

$ 0.34

$ 1.04

$ 2.18

$ 0.76

Non-GAAP income per share – diluted

$ 0.09

$ 0.77

$ 1.93

$ 0.49

Shares used in computation – diluted

59,793,196

60,260,410

60,127,369

60,272,536


Related Links :

http://www.canadiansolar.com

DIVIDEND ALERT: CASH DIVIDEND TO BE DISTRIBUTED TO ChipMOS ADS HOLDERS OF US$1.227 OR APPROXIMATELY US$0.949 AFTER TAIWAN WITHHOLDING TAX AND DEPOSITARY FEES

HSINCHU, Aug. 4, 2020 /PRNewswire-FirstCall/ — ChipMOS TECHNOLOGIES INC. ("ChipMOS" or the "Company") (Taiwan Stock Exchange: 8150 and NASDAQ: IMOS), an industry leading provider of outsourced semiconductor assembly and test services ("OSAT"), announced today that on August 7, 2020 a cash dividend will be distributed of US$1.227 or approximately US$0.949 per ADS after the Taiwan withholding tax and Citibank, N.A.’s depositary fees. Shareholders approved the latest dividend at the Company’s June 2020 AGM.

Holders of ADSs in brokerage accounts are encouraged to check with their securities brokers for receipt of dividend payments. Questions may be directed to Tiffany Ma at Citibank, N.A. (Tel: +1-973-461-5734; email: tiffany.ma@citi.com).

About ChipMOS TECHNOLOGIES INC.:

ChipMOS TECHNOLOGIES INC. ("ChipMOS" or the "Company") (Taiwan Stock Exchange: 8150 and NASDAQ: IMOS) (https://www.chipmos.com) is an industry leading provider of outsourced semiconductor assembly and test services. With advanced facilities in Hsinchu Science Park, Hsinchu Industrial Park and Southern Taiwan Science Park in Taiwan, ChipMOS provide assembly and test services to a broad range of customers, including leading fabless semiconductor companies, integrated device manufacturers and independent semiconductor foundries.

Forward-Looking Statements

This press release may contain certain forward-looking statements. These forward-looking statements may be identified by words such as "believes," "expects," "anticipates," "projects," "intends," "should," "seeks," "estimates," "future" or similar expressions or by discussion of, among other things, strategy, goals, plans or intentions. These statements may include financial projections and estimates and their underlying assumptions, statements regarding plans, objectives and expectations with respect to future operations, products and services, and statements regarding future performance. Actual results may differ materially in the future from those reflected in forward-looking statements contained in this document, due to various factors, including the potential impact of COVID-19.  Further information regarding these risks, uncertainties and other factors are included in the Company’s most recent Annual Report on Form 20-F filed with the U.S. Securities and Exchange Commission (the "SEC") and in the Company’s other filings with the SEC.

Contacts:

In Taiwan

Jesse Huang

ChipMOS TECHNOLOGIES INC.

+886-6-5052388 ext. 7715

IR@chipmos.com

In the U.S.

David Pasquale

Global IR Partners

+1-914-337-8801

dpasquale@globalirpartners.com


Related Links :

https://www.chipmos.com

Supermicro and Scality Collaborate to Simplify Deployment of Enterprise Software Defined Storage

Supermicro Delivers an Optimized Software-Defined Storage Solution for Large Scale On-Premises Management of Unstructured Data in Partnership with Leading Software Company

SAN JOSE, California, July 28, 2020Super Micro Computer, Inc. (SMCI), a global leader in enterprise computing, storage, networking solutions, and green computing technology, announced today a new solution leveraging the Scality® RING offering, enabling enterprises to scale and protect their most valuable assets — their data, in on-premises or hybrid cloud deployments.

Scality RING is a software defined native file and object storage solution for large scale on-premises storage and management of unstructured data. RING enables both performance-optimized and capacity-optimized storage with automated data durability levels using multiple data protection methods including geo-distribution capabilities. The Supermicro and Scality solution delivers a petabyte-scale storage framework offering cost-effective scaling, performance, and resiliency paired with Supermicro’s optimized hardware configurations that provides users an appliance-like deployment and service levels to meet enterprise requirements.

“As part of our ongoing commitment to work with leading software organizations, Supermicro is teaming with Scality to bring a simple, scalable, and powerful storage solution to the most demanding environments today,” said Vik Malyala, senior vice president, Supermicro. “Customers will quickly see how easy it is to deploy the Scality RING software on Supermicro servers and storage systems. Our reference architectures allow us to design and implement solutions based on customer requirements from our flexible Building Block Solutions ® approach.”   

This flexibility makes it possible to construct capacity-optimized RINGs or performance-optimized RINGs. In all cases, the RING software abstracts the underlying physical servers and hard disk drives. RING can exploit the lower-latency access characteristics of NVMe to maintain its internal metadata. RING is designed to scale out over time, across server generations, as well as the increasing storage densities expected as a normal part of the RING platform lifecycle

“We are thrilled to create a joint solution with Supermicro that benefits our customers,” said Wally MacDermid, vice president of strategic alliances at Scality. “Innovative organizations looking to transform their infrastructures for today’s digital economy want solutions that are easy to deploy and maintain while protecting their most important asset, their data. Supermicro’s highly-configurable systems with the latest storage interface technologies combined with Scality’s industry leading RING, gives customers business agility, resiliency and efficiency to solve data storage and orchestration challenges at petabyte-scale.”

For detailed information about the Supermicro Solution for Scality RING, please visit: https://www.supermicro.com/en/solutions/scality-ring

About Super Micro Computer, Inc.

Supermicro (Nasdaq: SMCI), the leading innovator in high-performance, high-efficiency server technology, is a premier provider of advanced Server Building Block Solutions® for Data Center, Cloud Computing, Enterprise IT, Hadoop/Big Data, HPC and Embedded Systems worldwide. Supermicro is committed to protecting the environment through its “We Keep IT Green®” initiative and provides customers with the most energy-efficient, environmentally-friendly solutions available on the market.

Supermicro, Server Building Block Solutions, BigTwin, SuperBlade, and We Keep IT Green are trademarks and/or registered trademarks of Super Micro Computer, Inc.

All other brands, names and trademarks are the property of their respective owners.

SMCI-F

Related Links :

https://www.supermicro.com/

http://www.supermicro.com