Crystal International Steps Up Systems Transformation & Productivity with SAP Solutions

HONG KONG, April 25, 2022 /PRNewswire/ — Crystal International Group, a global leader in apparel manufacturing headquartered in Hong Kong, is leveraging an array of SAP solutions to power its journey to become a future-enabled Intelligent Enterprise. Throughout its end-to-end business processes, spanning operations in multiple regions, Crystal has embedded SAP’s solutions to power its product lifecycle management, enterprise resource planning, finance, human resources and manufacturing functions, data management system, analytics and automation. These deployments have enabled Crystal to enhance product customization, shorten delivery timeframes and optimize order fulfillment.

SAP solutions have been supporting Crystal for over two decades. From the early adoption of SAP ERP systems to its latest iteration SAP S/4HANA Cloud, Crystal is progressing to accelerate the systems transformation of its vertical apparel business with SAP S/4HANA for Fashion and Vertical Business, SAP S/4HANA Finance, SAP Intelligent Robotic Process Automation, SAP Manufacturing Execution, SAP Manufacturing Integration and Intelligence, SAP Analytics Cloud, SAP Business Technology Platform and SAP SuccessFactors.

By standardizing, simplifying and automating business processes, SAP solutions have optimized the company’s apparel manufacturing capacity to increase yields and minimize waste. As a result, Crystal’s aggregate business outcomes generated by these deployments include a 140% productivity improvement and a 21% revenue increment year-on-year in 2021, with order fulfillment efficiency boosted by 19%.

“Serving some of the world’s most well-known fashion brands, we run our operations at speed to capture ever-changing market opportunities and drive business growth,” said Karl Ting, IS, General Manager, Corporate Information Services, Crystal Group. “For more than 20 years, SAP’s dynamic solutions have helped us design, build and operate on a global scale, most recently enabling us to co-create with customers and optimize our multi-country manufacturing platform with SAP S/4HANA. This transformation has set us on the path to becoming an Intelligent Enterprise, and we look forward to continuing on this promising trajectory with SAP as our trusted partner.”

In addition, SAP solutions have enabled Crystal to integrate various production systems into one centralized platform for efficiency and innovation. By integrating data sources from different factories and locations across its entire operation, Crystal’s decision-makers can responsively help customers achieve unique product specifications with data-powered visibility and business intelligence. Meanwhile, Crystal continues to customize and automate manufacturing processes and workflows to optimize operations and costs, enhancing efficiency while reducing raw material consumption and waste discharge.

Rajni Sharma, Managing Director, SAP Hong Kong, said, “The global apparel industry is in a whirlwind of transformation, and success is defined by digital readiness, operational efficiency and cost-effectiveness. Apparel manufacturers are confronting a multitude of challenges from resource management and product customization, to increasing costs and ever shorter delivery timelines – all of these mean the industry must push the envelope to a level never seen before. SAP has a host of software products to support companies like Crystal to optimize their entire operation, including design, manufacturing, and order fulfillment. We look forward to enabling customers to generate insights from operational data for better decision-making, improved workflow and increased automation.”

Crystal plans to deploy SAP Manufacturing Execution / Manufacturing Integration and Intelligence applications soon. After that, its next significant step will be leveraging scalable AI technologies and machine learning applications to further accelerate systems transformation to strengthen business resilience.

About SAP

SAP’s strategy is to help every business run as an intelligent, sustainable enterprise. As a market leader in enterprise application software, we help companies of all sizes and in all industries run at their best: SAP customers generate 87% of total global commerce. Our machine learning, Internet of Things (IoT), and advanced analytics technologies help turn customers’ businesses into intelligent enterprises. SAP helps give people and organizations deep business insight and fosters collaboration that helps them stay ahead of their competition. We simplify technology for companies so they can consume our software the way they want – without disruption. Our end-to-end suite of applications and services enables business and public customers across 25 industries globally to operate profitably, adapt continuously, and make a difference. With a global network of customers, partners, employees, and thought leaders, SAP helps the world run better and improve people’s lives. For more information, visit www.sap.com/hk.  

This document contains forward-looking statements, which are predictions, projections, or other statements about future events. These statements are based on current expectations, forecasts, and assumptions that are subject to risks and uncertainties that could cause actual results and outcomes to materially differ.  Additional information regarding these risks and uncertainties may be found in our filings with the Securities and Exchange Commission, including but not limited to the risk factors section of SAP’s 2021 Annual Report on Form 20-F.

© 2022 SAP SE. All rights reserved.
SAP and other SAP products and services mentioned herein as well as their respective logos are trademarks or registered trademarks of SAP SE in Germany and other countries. Please see https://www.sap.com/copyright for additional trademark information and notices.

Please click here for our privacy policy.

Apple is Cracking Down on Outdated Apps from App Store!

Quite recently Google has updated their Play Store policy and practices to start removing apps that has been sitting idle without updates. When they say remove though, it will still sit in the database, but will not appear to users while users who are already using the app will still get access to the apps. It is a good way, in our opinions, to clean up their app databases while giving users the flexibility to choose the apps they use on their devices.

It seems like Apple wants to also do the same, except they are making the implementation more immediate in nature. This was not an announcement from Apple really, just a social media posting captured by The Verge mentioning an email received from Apple. The email is for an independent developer for a free game sitting in the Apple App Store. The email pointed out that the app has not been updated for over two years and Apple will remove the app from the App Store if the app is not updated in the next 30 days.

That is not the only developer to receive a warning email from Apple though. From The Verge’s coverage, it seems like there are more than just a few developers that received an email just because they have not updated their app for two years or so. To be fair, there is a good reason why Apple wants to ensure that apps featured on their App Store is up to date. The way Apple has been implementing it though, is a little odd.

Apple and Google, both largest app ecosystem platforms in the world, work very hard to keep their marketplaces as safe as they can be. The update security features all the time, and within their updates, they would require developers to also comply to their newer guidelines set within their updates. Understandably, most of the updates would require developers to patch their apps to match the guidelines set by both Google and Apple, in the name of protecting their users too. In that case it can be understandable for both Google and Apple to start enforcing a stricter “outdated” regulation for their app stores.

This is not technically the first time that Apple removes apps from their App Store. They had a similar exercise back in 2016 where they removed apps that has been sitting without updates for over two years in the App Store giving developers only 30 days to submit an update for the App Store. While the practice seems to have gone on for a while, Apple has made no attempts in reporting or documenting their attempts so far other than the emails sent to developers. There are currently no clear guidelines as well on what Apple considers to be “outdated” in their App Store.

As we mentioned, Google is sort of doing the same thing; they are trying to ensure that their developers keep their apps up to date to meet the security requirements set by Google. Google is giving developers until the end of October 2022 to at least submit an update for their apps. Google will also grant six-month extension requests if developers cannot meet the deadline.

Huobi Tech establishes Huobi Tech Capital to capture opportunities in Web3.0, DeFi, and Metaverse

HONG KONG, April 25, 2022 /PRNewswire/ — Huobi Technology Holdings Limited (Huobi Tech; Stock Code: 1611.HK) today announced the launch of Huobi Tech Capital, its strategic investment and M&A unit. The latter will explore investment opportunities in the blockchain industry by looking into areas such as Web3, DeFi and the Metaverse.

Huobi Tech Capital will focus on early-stage investments that ride on industry trends, as well as strategic acquisitions that strengthen Huobi Tech’s blockchain ecosystem. It will adopt flexible investment strategies, including traditional equity investment and token investment in the crypto world. 

Huobi Tech Capital has already made strong progress with investments in GameFi, and recently finished investing in a project of digital assets service platform serving family offices. Blockchain is not just a technology that offers cost efficiencies, but also acts as a social tool to build relationships and trust. Through its investments in these leading start-ups, Huobi Tech strives to support core technological developments in the blockchain industry.

About Huobi Tech Holdings Limited
Huobi Technology Holdings Limited (“Huobi Tech”, Stock Code: 1611.HK) was listed on the Main Board of the Stock Exchange of Hong Kong Limited in November 2016. Actively developing the blockchain ecosystem and virtual asset ecosystem, Huobi Tech is committed to becoming the leading one-stop compliant virtual asset service platform. Huobi Tech currently offers data centre services, cloud-based services, SaaS, virtual asset management, custody, trust & custody, OTC brokerage, lending, trading platform and other related services.

At the same time, Huobi Tech is applying for virtual asset and finance-related licenses in major markets around the world. Up to now, Huobi Tech’s subsidiaries have successfully obtained the approval to conduct Type 4 (Advising on Securities) and Type 9 (Asset Management) regulated activities from the Securities and Futures Commission of Hong Kong, registered as a Trust Company in Hong Kong with the Trust or Company Service Provider License (Hong Kong) and the Retail Trust Company License (Nevada USA).

Cision View original content:https://www.prnewswire.com/news-releases/huobi-tech-establishes-huobi-tech-capital-to-capture-opportunities-in-web3-0–defi-and-metaverse-301531479.html

WuKong Education Group Announces Launch of New Online Learning App

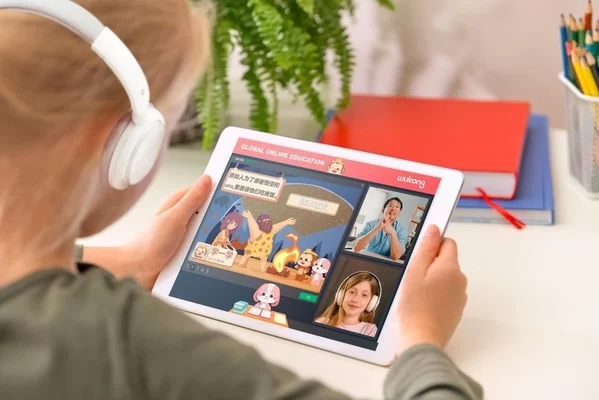
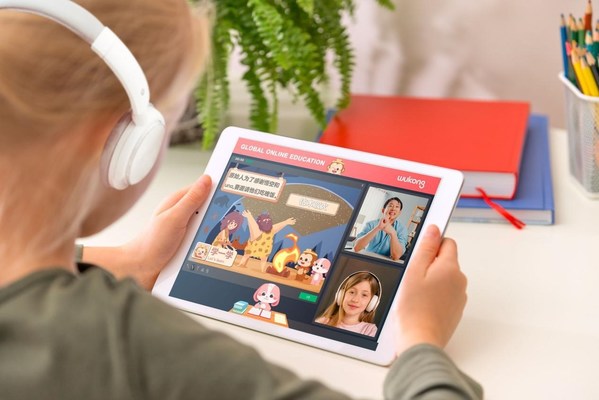
In the past two years, online learning  has become an essential form of learning for students worldwide. Taking online Chinese language learning as an example, WuKong has undoubtedly become one of the first movers and global leaders. Building on this unprecedented success, WuKong has recently announced plans to expand into additional core subject areas and the launch of a major learning digital infrastructure upgrade.

AUCKLAND, New Zealand, April 24, 2022 /PRNewswire/ — WuKong Education Group, the leading online Mandarin learning platform, has recently launched a suite of apps as part of its digital learning infrastructure upgrade strategy to further enhance its student-centered learning and teaching experiences.

“We are proud that our users love our app,Cicy Ding, the chief education officer of WuKong said. ”The app has many convenient functions such as learning management, interactive homework, and attendance recording. Once again, our investment in education technology proves to enhance learning experience for our students, engagement for parents and efficiency for our teachers.”

Founded in 2016, WuKong is an online education technology company headquartered in New Zealand and has grown from a humble startup aiming at making the Chinese language learning for Chinese families simple, easy and fun, to a global online learning platform with about 300,000 students aged 3-18 and 3,000 highly trained and selected teachers working across 4 continents and 118 countries including its core markets i.e. US, Canada, Australia, and New Zealand.

WuKong Education Group Becomes Leading Global Platform For Students’ Online Education As Their Mandarin Learning Platform Gains Popularity

In the past two years, global K12 sector has witnessed an explosive growth in online learning. WuKong is no exception. Its number of class bookings has increased 70 times since 2019.

After achieving its market leadership in online Mandarin learning through aggressive global expansion, WuKong is hoping to expand its outreach to non-Chinese families through new program offerings.

In March 2021, WuKong started its pilot Math classes taught by experienced native English speaking teachers. Aligned with the popular Singapore National core math curriculum and methodology, WuKong’s math program offering opens a new chapter to reach beyond the Chinese families in its priority markets.

Vicky Wang, the founder and CEO of WuKong Education Group was quoted as saying, “It is great to see that so many children are benefiting from our learning platform, especially in this challenging period of time. We are very pleased to see that WuKong has made a difference and added value to their learning journey and become their trusted learning partner.”

To learn more about WuKong Education Group visit their official website at https://www.wukongsch.com/en.

Cision View original content to download multimedia:https://www.prnewswire.com/news-releases/wukong-education-group-announces-launch-of-new-online-learning-app-301531466.html

PSY Comes Back as the Ambassador for Ragnarok Origin

The legend has returned with new info to share

SEOUL, South Korea, April 23, 2022 /PRNewswire/ — PSY, one of the most iconic singers of all times who took the world by the storm with his famous ‘Gangnam Style’, reappears to the public as the ambassador for Gravity’s hit mobile game Ragnarok Origin.

PSY has starred in several commercials and interviews for Ragnarok Origin. In the commercial, PSY is seen alone and tired in his studio.

The silence is broken when he receives a text message and gets sucked into the world of Ragnarok to enjoy many of the fun experiences present in Ragnarok Origin.

In the short FaceTime Video, PSY has revealed that he will be releasing a new song this year. This will be the first in 5 years that PSY will be releasing since his last album [4X2=8] in 2017.

In addition to PSY’s interview, there will be community events featuring lots of prizes and rewards to celebrate PSY’s onboarding as the second ambassador for Ragnarok Origin. Gravity has claimed that they are preparing many more different collaboration events and activities with PSY to deliver a fun and exciting experience for the players.

Apart from PSY and Ragnarok Origin’s collaboration, Ragnarok Origin has recently released a massive update featuring a new class, increased level cap to lvl90, new stories, dungeons, and various events.

Here’s a quick summary of the update.

  1. New Job: Crusader
  2. New Lvl 90 storyline
  3. New Map: Ancient City
  4. Sky Set system
  5. New Dungeon: Attacking Prontera at Night
  6. War of Emperium Siege Fight

Sky Set: Wings of the Valkyries

For details on the major update, check out the update notice here.

Users can play Ragnarok Origin now by downloading the game on iOS or Android in the USA and Canada. To learn more about Ragnarok Origin visit the official site or follow the game on Facebook, Twitter, and Instagram.

About Gravity co., Ltd.:

Founded in April 2000, Gravity is a global game company and the only Korean game company listed on NASDAQ directly. As of June 30, 2021, Gravity’s signature IP, Ragnarok IP, has exceeded 120 million in global cumulative accounts. In addition, it was selected as the 2nd most loved Korean game overseas for 3 consecutive years (Global Hallyu Trend 2021).

Currently, Gravity has subsidiaries consisting of Gravity NEO CYON (Korea), Gravity Communications (Taiwan Region), Gravity Game Link (Indonesia), Gravity Interactive (USA), Gravity Game Arise (Japan), Gravity Game Tech (Thailand), Gravity Game Hub(Singapore), leading to a strong global network. Together with its branches, Gravity is expanding its recognition and influence worldwide by expanding its service with Ragnarok Online IP-related games as well as other games of various genres and platforms. In addition to various Ragnarok goods, it is accelerating Ragnarok content businesses, such as advancing into animation, IPTV, and webtoon fields, as well as conducting various brand collaborations.

Cision View original content to download multimedia:https://www.prnewswire.com/news-releases/psy-comes-back-as-the-ambassador-for-ragnarok-origin-301529269.html

Roan Holdings Group Co., Ltd. Reports 2021 Financial Year Results

BEIJING and HANGZHOU, China, April 23, 2022 /PRNewswire/ — Roan Holdings Group Co., Ltd. (“Roan” or the “Company”) (OTC Pink Sheets: RAHGF and RONWF), a comprehensive solution provider for industrial operation and capital market services, today reported its financial results for the fiscal year ended December 31, 2021. All amounts are in U.S. dollars.

Fiscal year 2021 Highlights:

  • Net income increased to $0.76 million for the year ended December 31, 2021 from a net loss of $0.85 million for the year ended December 31, 2020.
  • Net earnings per share increased to $0.01 for the year ended December 31, 2021 from a net loss per share of $0.07 for the year ended December 31, 2020.
  • Net commission and fees on financial guarantee services was $0.40 million for the year ended December 31, 2021, as compared to $0.29 million for fiscal year 2020, reflecting an increase of 37.93% for business development.
  • Operating expenses in total decreased by $0.81 million, to $3.30 million for year ended December 31, 2021 compared to $4.11 million for the year ended December 31, 2020. The decreases were primarily the result of the Company’s cost control strategies.

For fiscal years ended December 31

($ millions, except per share data, differences
due to rounding)

2021

2020


Change

Net revenues of services

$0.79

$2.13

(62.91%)

Net commission and fees on financial guarantee
services

$0.40

$0.29

37.93%

Total interest and fees income

$2.41

$2.48

(2.82%)

Operating income

$3.61

$4.90

(26.33%)

Net income

$0.76

($0.85)

N/A

Net earnings per share – Basic and Diluted

$0.01

($0.07)

N/A

Mr. Junfeng Wang, Chairman of the Board commented, “We are pleased to conclude fiscal year 2021 with sound financial performance. Although the external environment is full of challenges, through our service and extensive cooperation experience and resources accumulated over the past 10 years and with more than 500 customers and partners in various industries, the Company further optimized its strategic planning and business layout in 2021, and is in process of reforming operation structure, optimization of management team, integration of market resources, establishment of new business entities, and upgrading of our business services and products to meet Roan’s future development needs. As a result, the Company not only achieved substantial improvement in financial performance in 2021, but also turned from a net loss of $0.85 million in fiscal year 2020 to a net profit of $0.76 million in fiscal year 2021. At the same time, Roan has successfully expanded its business into the field of new energy, new materials, and semiconductor related industries, and we obtained our first $0.14 million industrial operation service fee income.”

“In the future, through our strategic business layout in industrial operation and capital market services, the Company plans to obtain long-term operation rights for new-generation technologies, products, and services in the fields of new energy, new materials, semiconductors, culture, tourism, and health so as to position ourselves to generate income from our services and products in order to share further the upward trend of these industries,” Mr Wang said.

Mr. Wenhao Wang, Chief Financial Officer of Roan, commented: “In 2021, in line with our expectations, we became profitable, turning around from last year’s losses. We grew our annual net income by $1.61 million to $0.76 million. We boosted our business development by upgrading our business ecosystem, and we applied cost-efficient strategies that helped us save $0.81 million in operating expenses for the past year. We also have a positive working capital balance of $51.94 million as of December 31, 2021, which makes us believe that the efforts we put in place and the strategic development we are taking will bring us significant improvements to profitability, creating long-term value for our shareholders.”

Fiscal Year 2021 Financial Results

Services Revenues

The following table sets forth a breakdown of our revenue by services offered for the years ended December 31, 2021 and 2020:

($ millions, differences due to rounding) 

For the years
ended December
31,

Variance

2021

2020

Amount

%

Management and assessment service

$

0.44

$

0.02

$

0.42

2100%

Consulting services relating to debt collection

0.21

2.11

(1.90)

(90.05)%

Industrial operation services

0.14

0.14

100.00%

Revenues from services

$

0.79

$

2.13

$

(1.34)

(62.91)%

  • Management and assessment services

Revenue from management and assessment services was $0.44 million ended December 31, 2021, which was increased 0.42 million or 2100% compared with $0.02 million for the year ended December 31, 2020. The increase was caused by the new contracts of management and assessment services brought significant revenue and cashflow to the Company.

  • Consulting services relating to debt collection

Revenue from consulting services relating to debt collection was $0.21 million for the year ended December 31, 2021, a decrease of $1.90 million, or 90.05%, as compared to $2.11 million for the year ended December 31, 2020, which was mainly due to the negative impact of the COVID pandemic. We had less contracts for debt collection service during the year ended December 31, 2021.

  • Industrial operation services

On December 31, 2021, Hangzhou Zeshi investment partnership (“Zeshi investment”), a wholly-owned subsidiary of the Company, entered into an agreement with ZhongTan Future New Energy Industry Development (Zhejiang) Co., Ltd. (“ZhongTan”). Revenue of $0.14 million was recognized during the year ended December 31, 2021 after the target customer was located, due diligence and initial negotiation was completed, and requirements of ZhongTan were met.

Revenue for commission and fees on financial guarantee services
Commission and fees on financial guarantee services was $0.46 million for the year ended December 31, 2021, an increase of $0.08 million, or 21.05% as compared to $0.38 million for fiscal year 2020, reflecting an increase for business development.
The provisions for financial guarantee services are related to financial guarantee service business as per the requirement of local government. Provisions for financial guarantee services was $0.06 million for the year ended December 31, 2021, as compared to $0.09 million for last fiscal year.

Interest and fee income
Interest and fee income primarily consisted of interest and fee income generated from loans due from third parties. Interest and fee income was $2.41 million, a decrease of $0.07 million, or 2.82% for the year ended December 31, 2021 as compared to $2.48 million for fiscal year 2020. The decrease was mainly due to a decrease of $0.02 million in interest income from loans due from third parties and a decrease of $0.05 million in interest income on provision deposits with banks.

Operating expenses
Operating expenses in total decreased by $0.81 million, or 19.70% to $3.30 million for year ended December 31, 2021 compared to $4.11 million for the year ended December 31, 2020. The decreases in these expenses were primarily the result of our cost control strategies.  

Net income
As a result of the foregoing, we had a net income of $0.76 million for the year ended December 31, 2021, as compared to a net loss of $0.85 million for the year ended December 31, 2020

Cash and cash equivalents
Cash and cash equivalents were $1.95 million as of December 31, 2021, reflecting a decrease of $2.98 million from $4.93 million as at December 31, 2020, primarily because of the repayment of bank loan of $2.94 million during the year ended December 31, 2021.

Working capital
Our working capital was $51.94 million as of December 31, 2021.

Recent developments

On February 28, 2022, the Company signed a five-year industrial operation cooperation agreement with Jiushang (Hangzhou) Semiconductor Technology Co., Ltd. (“Jiushang”). The Company will provide Jiushang with financing and operation services, and cooperate in the transformation and industrialization of Jiushang semiconductor’s new technological achievements in the Chinese market.

On December 16, 2021, Hangzhou Zeshi invested RMB 2 million (approximately $0.31 million) in Medium Carbon Future New Energy Industry Development (Zhejiang) Co., Ltd. (“Medium Carbon”), and held 2% its equity. Future New Energy invested RMB 20 million (approximately $3.10 million) and held 20% its equity. The registered capital of Medium Carbon is RMB 100 million (approximately $15.49 million).

On November 24, 2021, Hangzhou Zeshi, a wholly owned subsidiary of the Company invested RMB100,000 (approximately $0.02 million) in Hangzhou Future New Energy Enterprise Management Partnership (Limited Partnership) (“Future New Energy”) and held 1% of the equity of Future New Energy. The registered capital of Future New Energy is RMB 10 million (approximately $1.55 million).

About Roan Holdings Group Co., Ltd.

Founded in 2009, Roan Holdings Group Co., Ltd. (OTC Pink: RAHGF and RONWF) is a comprehensive solution provider for industrial operation and capital market services. Adhering to the platform strategy of “cross collaboration, technology empowerment, sustainability and stability, and combination of operation and finance resources”, the Company’s services focus on the  new energy, new materials, and semiconductor industries. At the same time, the Company focuses on the application of innovative technologies in the consumer industry with respect to financial consumption, cultural and tourism consumption, and great health ecosysystem. Roan aims to provide comprehensive solutions and supporting services for diversified institutuional and local government clients across the entire industry chain. Roan has offices in Hangzhou and Beijing and subsidiaries in Hangzhou, Ningbo, Shaoxing and Tianjin. For more information, please visit: www.roanholdingsgroup.com.

Safe Harbor Statement

This announcement contains forward-looking statements within the meaning of Section 21E of the Securities Exchange Act of 1934, as amended, and as defined in the U.S. Private Securities Litigation Reform Act of 1995. These forward-looking statements relate to, among others, the consummation of the proposed transaction, and can be identified by terminology such as “may,” “will,” “expect,” “anticipate,” “aim,” “estimate,” “intend,” “plan,” “believe,” “potential,” “continue,” “is/are likely to” or other similar expressions. Such statements are based upon management’s current expectations of the consummation of the proposed transaction, and relate to events that involve known or unknown risks, uncertainties and other factors, all of which are difficult to predict and many of which are beyond the Company’s control. Further information regarding these and other risks, uncertainties or factors are included in the Company’s filings with the U.S. Securities and Exchange Commission. The Company does not undertake any obligation to update any forward-looking statement as a result of new information, future events or otherwise, except as required under law.

IR Contact:
At the Company:
Katrina Wu
Email: xiaoqing.wu@roanholdingsgroup.com
Phone: +86-571-8662 1775

Investor Relations Firm:
Janice Wang
EverGreen Consulting Inc.
Email: IR@changqingconsulting.com
Phone: +1 571-464-9470 (from U.S.)
+86 13811768559 (from China)

ROAN HOLDINGS GROUP CO., LTD.

CONSOLIDATED BALANCE SHEETS

As of December 31, 2021 and 2020

(Expressed in U.S. dollar, except for the number of shares)

December 31,
2021

December 31,
2020

  ASSETS

Cash and cash equivalents

$

1,947,142

$

4,932,048

Restricted cash

29,693,689

25,875,556

Accounts receivable, net

6,929,529

6,939,352

Inventories

33,598

30,348

Loan receivables due from third parties, net

23,751,471

17,670,652

Due from related parties

5,941

94,023

Other current assets

70,910

3,502,550

Other receivables, net

656,835

3,545,753

   Total current assets

63,089,115

62,590,282

Pledged deposits

48,752

462,835

Property and equipment, net

77,073

65,073

Intangible assets, net

3,123,394

3,977,867

Right of use assets

37,313

346,017

Goodwill

267,331

261,087

   Total non-current assets

3,553,863

5,112,879

   Total Assets

$

66,642,978

$

67,703,161

LIABILITIES

Customer pledged deposits

$

7,846

$

7,664

Unearned income

72,523

130,772

Reserve for financial guarantee losses

651,341

579,364

Dividends payable

480,000

480,000

Tax payable

2,614,257

1,767,214

Due to related parties

123,117

281,369

Warrant liabilities

16,998

13,977

Operating lease liabilities, current portion

65,498

191,643

Accrued expenses and other liabilities

1,155,903

1,642,060

Bank loans

5,961,460

8,826,054

Total current liabilities

11,148,943

13,920,117

Operating lease liabilities, noncurrent portion

102,767

Deferred tax liabilities

544,355

793,848

Total non-current Liabilities

544,355

896,615

Total Liabilities

$

11,693,298

$

14,816,732

Commitments and Contingencies

Shareholders’ Equity

Ordinary Share, no par value, unlimited shares authorized; 25,287,851 and
   25,287,851 shares issued and outstanding as of December 31, 2021 and December 
   31, 2020, respectively

Class A convertible preferred shares, no par value, unlimited shares authorized; 
   715,000 and 715,000 shares issued and outstanding as of December 31, 2021 and
   December 31, 2020, respectively

$

11,711,727

$

11,025,327

Class B convertible preferred shares, no par value, unlimited shares authorized; 
   291,795,150 and 291,795,150 shares issued and outstanding as of December 31, 2021 and 
   December 31, 2020, respectively

31,087,732

31,087,732

Additional paid-in capital

3,312,189

3,312,189

Statutory reserve

362,797

202,592

Accumulated deficit

(14,805,802)

(14,330,288)

Accumulated other comprehensive income

3,128,086

2,310,369

Total Roan Holdings Group Co., Ltd.’s Shareholders’ Equity

$

34,796,729

$

33,607,921

Noncontrolling interests

20,152,951

19,278,508

Total Equity

54,949,680

52,886,429

Total Liabilities and Equity

$

66,642,978

$

67,703,161

ROAN HOLDINGS GROUP CO., LTD.

CONSOLIDATED STATEMENTS OF OPERATIONS AND COMPREHENSIVE INCOME (LOSS)

For the Years Ended December 31, 2021, 2020 and 2019

(Expressed in U.S. dollar, except for the number of shares)

For the Years Ended
December 31,

2021

2020

2019

Revenues from services

$

793,291

$

2,128,153

$

639,220

Revenues from healthcare service packages

55,301

Cost of revenues

(50,774)

(8,080)

Net revenues of services

793,291

2,132,680

631,140

Commissions and fees on financial guarantee services

456,944

375,471

8,797

Provision for financial guarantee services

(57,417)

(89,865)

(5,008)

Commission and fee income on guarantee services, net

399,527

285,606

3,789

Interest and fees income

Interest and fees on direct loans

1,153

Interest income on loans due from third parties

2,113,918

2,131,447

34,707

Interest income from factoring business

2,782,332

Interest income on deposits with banks

300,749

348,389

64,636

Total interest and fee income

2,414,667

2,479,836

2,882,828

Interest expense

Interest expenses and fees on secured loans

(2,218,815)

Net interest income

2,414,667

2,479,836

664,013

Provision for loan losses

(2,244,601)

Net interest income (loss) after provision for loan losses

2,414,667

2,479,836

(1,580,588)

Operating income (loss)

3,607,485

4,898,122

(945,659)

Total operating expenses

Salaries and employee surcharges

(1,054,509)

(1,116,482)

(512,314)

Other operating expenses

(2,241,069)

(2,995,098)

(1,385,259)

Changes in fair value of warrant liabilities

(3,021)

5,961

530,863

Total operating expenses

(3,298,599)

(4,105,619)

(1,366,710)

Other income (expenses)

Deconsolidation gain (loss)

490,283

(1,953,248)

Interest income (expenses), net

(267,184)

Other income (expense), net

554,167

76,406

Total other income (expenses)

777,266

(1,876,842)

Income (Loss) before income taxes

1,086,152

(1,084,339)

(2,312,369)

Income tax (expenses) recovery

(328,851)

229,733

(244,741)

Net income (loss) from continuing operations

757,301

(854,606)

(2,557,110)

Net income from discontinued operations, net of income tax

26,846,018

Net income (loss)

757,301

(854,606)

24,288,908

Dividend – convertible redeemable Class A preferred share

(686,400)

Net income attributable to noncontrolling interests

(386,210)

(838,048)

(76,108)

Net income (loss) attributable to Roan Holding Group Co., Ltd.’s
shareholders

$

371,091

$

(1,692,654)

$

23,526,400

Other comprehensive (loss) income

Foreign currency translation adjustment

1,308,444

3,461,980

1,435,262

Reclassified to net gain from discontinued operations

2,691,969

1,308,444

3,461,980

4,127,231

Comprehensive income

2,065,745

2,607,374

28,416,139

Other comprehensive income attributable to noncontrolling interests

(488,233)

(1,334,101)

(97,733)

Dividend – convertible redeemable Class A preferred share

(686,400)

Net income attributable to noncontrolling interests

(386,210)

(838,048)

(76,108)

Total comprehensive income attributable to Roan Holdings Group 
    Co., Ltd.’s shareholders

$

1,191,302

$

435,226

$

27,555,898

Weighted average number of ordinary share outstanding

Basic and Diluted*

25,287,887

25,287,887

25,287,887

Earnings (Loss) per share

Net earnings (loss) per share – Basic and Diluted

$

0.01

$

(0.07)

$

0.93

Net earnings (loss) per share from continuing operations – Basic and
Diluted

$

0.01

$

(0.07)

$

(0.13)

Net earnings per share from discontinued operations – Basic and Diluted

$

$

$

1.06

ROAN HOLDINGS GROUP CO., LTD.

CONSOLIDATED STATEMENTS OF CASH FLOWS

For the Years Ended December 31, 2021, 2020 and 2019

(Expressed in U.S. dollar, except for the number of shares)

For the Years Ended
December 31,

2021

2020

2019

Cash Flows from Operating Activities:

Net income (loss)

$

757,301

$

(854,606)

$

24,288,908

Less: Net loss from discontinued operations

26,846,018

Net loss from continuing operations

757,301

(854,606)

(2,557,110)

Adjustments to reconcile net income to net cash used in operating
activities:

Depreciation and amortization expenses

1,134,738

1,102,298

55,498

Provision for credit losses

48,518

316,014

Provision for loan losses

2,244,601

Provision for financial guarantee losses

57,417

89,865

5,008

Deferred tax expenses

(265,421)

(1,001,372)

57,674

Changes in fair value of warrant liabilities

3,021

(5,961)

(530,863)

Net gain from disposal of fixed assets

(33,246)

(136,682)

Gain from lease modification

(603)

22,257

Accretion of finance leases

7,605

14,757

Gain (loss) from deconsolidation of subsidiaries

(490,283)

1,953,248

Changes in operating assets and liabilities:

Accounts receivable

(7,495)

(3,116,533)

(206,442)

Inventory

(3,250)

(30,348)

Interest and fees receivable

(149,013)

Other current assets

3,431,640

(3,215,702)

(289,694)

Other receivables

2,425,003

(3,268,571)

Pledged deposits and other non-current assets

414,265

359,202

Advances from customers

(58,249)

7,915

(6,702)

Tax payable

847,043

1,029,919

273,589

Accrued expenses and other liabilities

449,971

(727,211)

28,875

Net Cash Provided by (Used in) Operating Activities from 
Continuing Operations

8,717,975

(7,461,511)

(1,074,579)

Net Cash Used in Operating Activities from Discontinued 
Operations

(26,564)

Net Cash Provided by (Used in) Operating Activities

8,717,975

(7,461,511)

(1,101,143)

Cash Flows from Investing Activities:

Repayment of loans from factoring customers

107,833,488

Proceeds of loans from third parties

20,499,442

Loans disbursement to third parties

(26,100,286)

(3,467,607)

Loans disbursement to factoring customers

(43,422,881)

Purchases of property and equipment

(54,569)

(833)

Acquisition of a subsidiary

(427,318)

Acquisition of cash from acquired subsidiary

21,442,122

Proceeds from disposal of discontinued operations

504,713

Net inflow related to deconsolidation of subsidiaries

788

61,121

Redemption of short-term investment

8,690,374

Due to (from) related party

(70,169)

210,774

Proceeds from sale of property and equipment

40,305

837,969

Net Cash (Used in) Provided by Investing Activities from Continuing 
Operations

(5,684,489)

6,332,631

85,929,291

Net Cash Provided by Investing Activities from Discontinued

Operations

35,765

Net Cash (Used in) Provided by Investing Activities

(5,684,489)

6,332,631

85,965,056

Cash Flows from Financing Activities:

Borrowing from a related party

279,020

Proceeds from bank loans

5,889,179

8,341,311

Repayment of bank loans

(8,927,555)

Proceeds from secured loans

43,422,881

Repayment of secured loans

(107,833,488)

Repayment of third-party loans

(280,268)

Repayment of lease liabilities

(76,102)

(207,891)

Net Cash (Used in) Provided by Financing Activities from 
Continuing Operations

(3,114,478)

7,853,152

(64,131,587)

Net Cash Used in Financing Activities from Discontinued
Operations

(7,251)

Net Cash (Used in) Provided by Financing Activities

(3,114,478)

7,853,152

(64,138,838)

Effect of exchange rate changes on cash, cash equivalents, and restricted
   cash in banks

914,219

1,937,807

119,326

Net increase in cash, cash equivalents, and restricted cash in banks

833,227

8,662,079

20,844,401

Cash, cash equivalents, and restricted cash in banks at beginning of year

30,807,604

22,145,525

1,301,124

Cash, cash equivalents, and restricted cash in banks at end of year

$

31,640,831

$

30,807,604

$

22,145,525

Supplemental Cash Flow Information

Cash paid for interest expense

$

269,400

$

$

Cash paid for income tax

$

$

$

Noncash investing activities

Acquisition of a subsidiary by issuance of Class B Preferred Shares

$

$

$

31,087,732

Receivable from disposal of discontinued operations

$

$

$

940,829

Right of use assets obtained in exchange for operating lease obligations

$

$

$

615,000

The following table provides a reconciliation of cash, cash equivalents and restricted cash reported within the
statement of financial position that sum to the total of the same amounts shown in the consolidated statements of cash
flows:

December 31,
2021

December 31,
2020

Cash and cash equivalents

$

1,947,142

$

4,932,048

Restricted cash in banks

29,693,689

25,875,556

Total cash, cash equivalents and restricted cash

$

31,640,831

$

30,807,604

Cision View original content:https://www.prnewswire.com/news-releases/roan-holdings-group-co-ltd-reports-2021-financial-year-results-301531269.html

Source: Roan Holdings Group Co., Ltd.

China Matters explores the promise of smart cities in Guiyang


BEIJING, April 23, 2022 /PRNewswire/ — Why smart cities? From all perspectives, it ticks all the boxes: innovation, technology and new economy. On a day-to-day basis, it makes our urban environments more liveable, it saves energy, keeps traffic flowing and keeps us safe. 

In 2020, China was estimated to have some 800 smart cities under construction or in planning – that’s about half of the world’s total. And that number is continually rising.

And key to powering these smart cities is technologies like 5G, artificial intelligence and big data. Guiyang, the capital city of Guizhou province, has been a hotbed for experimenting with digital transformation in the country’s push towards building smart cities, thus a smart society.  Smart cities are an integral part of China’s continued push for urbanization to drive the country’s economic development now and in the years to come.  

More than 5,000 big data companies take residence in Guiyang including Alibaba, Baidu, Apple and Google, to name a few. That’s because, for years, Guizhou has been home to the country’s first national big data experimental zone. And now it has opened the floodgates for a shift from a smart-city concept to a smart-city reality.

China Matters’ Josh Arslan goes to Guiyang to see what ordinary folks can get out of living in a smart city? What benefits it brings? He also meets up with people behind the innovations that power a smart city from facial recognition to a car parking app vital in congested cities to autonomous vehicles, redefining the way we live, work and play.

Contact: Li Siwei
Tel:008610-68996566
E-mail:lisiwei5125@gmail.com
YouTube Link: https://youtu.be/JP7_ylRLRME  

CASETiFY Celebrates Earth Day 2022


HONG KONG and LOS ANGELES, April  22, 2022 /PRNewswire/  –This Earth Day, global lifestyle brand CASETiFY is highlighting its commitment to invest in our planet with the latest from its global impact report. Among an exciting collection of sustainable products available for a range of device sizes, the brand also unveils its newest initiative calling on the CASETiFY community to #ReCASETiFYYourWorld.
The global lifestyle brand rings in Earth Day with an update on its ongoing sustainability initiative, inviting customers to #ReCASETiFYYourWorld.

“We’re excited to share our sustainability progress with the world, but we know there is so much more room for growth,” said Wes Ng, CASETiFY CEO and Co-founder. ” We want to continue moving our industry in the right direction with sustainable innovations that refuse to compromise on quality and self-expression.”

CASETiFY Makes an Impact

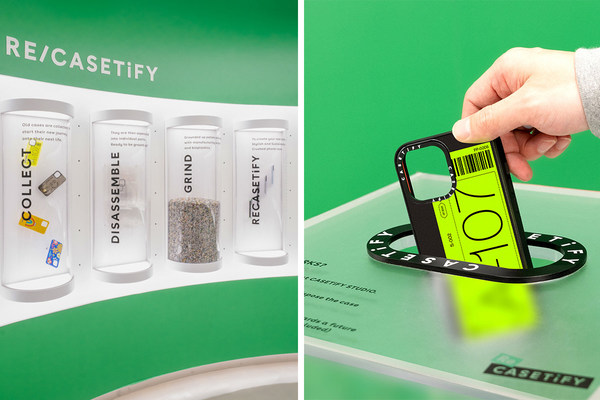
CASETiFY is committed to investing in our plant and reducing its carbon footprint wherever possible. To date, the DTC brand has recycled over 160,000 phone cases through its recycling program RECASETiFY, in partnership with TerraCycle and other global partners, diverting over 60,000 lbs of plastic from landfills. Through the program, customers are able to either globally mail-in or bring in their old, retired phone cases to a number of drop-off locations throughout Hong Kong, Japan and Korea.

Furthermore, Earthday.org and CASETiFY together have planted over 165,000 trees directly supporting The Canopy Project, which benefits local communities, increases habitat for species, and combats climate change. CASETiFY officially announced its partnership with Earthday.org in 2020 with a pledge to plant one tree for every compostable phone case and reusable water bottle sold.

Incorporating Sustainable Materials

Last year, CASETiFY moved the needle even further by launching a brand new collection of upcycled phone cases made with revolutionary Re/CASETiFY technology. The Crush Collection, uses proprietary technology turning old, discarded phone cases, manufacturing scraps and plant-based material into brand new phone cases––drastically reducing the carbon manufacturing emissions by 20%. By using retired phone cases, the Crush Collection helps to repurpose existing plastic, reduce use of virgin plastic and further close the loop on single-use plastics. The new material is currently available for select iPhone and Samsung cases as well as newly launched AirPod cases with plans to be integrated in future product launches and lineups.  

In addition to the Crush Collection, CASETiFY offers even more sustainable solutions for every eco-conscious shopper with best-selling Impact and Ultra Impact Cases featuring up to 65% recycled materials, Leather Cases made with 90% recycled material and the Compostable Collection made with ecotify™, a trademarked proprietary blend of biopolymers, starch, and bamboo.

#ReCASETiFYYourWorld

At CASETiFY, it’s in our DNA to create high quality products that empower self expression and celebrate individuality without compromising its impact on the environment. Over the past few years we’ve developed new technologies, such as Re/CASETiFY to manufacture products that help reduce carbon emissions and create better alternatives than the average plastic phone case. This year, CASETiFY is calling on its community to #ReCASETiFYYourWorld through a socially-driven initiative spotlighting ways to re-invent, recycle and upcycle old phone cases. Similar to the brand’s ReCASETiFY Couch, designed by Crosby Studios, participants can submit their own Re/CASETiFY project repurposing old phone cases to create something entirely new to CASETiFY for a chance to win up to $1000.00 USD. You can find more information regarding this initiative at casetify.com/sustainability/fund-your-idea.

To shop products made from Re/CASETiFY, compostable and recycled material, and to learn more about the process and brand initiatives, please visit www.casetify.com. For the latest news on CASETiFY, sign up for the newsletter and stay tuned to @CASETiFY on Instagram, Facebook, TikTok and Twitter.

About CASETiFY 

CASETiFY is the global lifestyle brand and home to the first and largest platform for customized tech accessories. Created with the highest-quality materials and most cutting-edge designs, CASETiFY’s products turn your personal electronics into stylishly slim, drop-proof accessories. Known for tapping top artists and creatives for its Co-Lab program, CASETiFY gives brands and individuals the opportunity to share their unique visions with the world. For more information on CASETiFY, its stores, partners and products, please visit www.CASETiFY.com.

Cision View original content to download multimedia:https://www.prnewswire.com/news-releases/casetify-celebrates-earth-day-2022-301531094.html

[Editorial] Daily Driving the Chromebook Part 1: Introducing the Acer Chromebook Spin 713. Wait, Why Chrome OS?

When you go out to buy a laptop, there is usually two options for you to pick from. You can either go with Windows laptops, which will open yourself up to a world of options. You can also go for the Mac option, which would simplify your options but at a higher cost. There is a third option though – Chrome OS.

At this point, we see many question marks on many people’s heads. “Why a Chrome OS?” you may ask. It is an odd choice in the sea of choices in the market, an unpopular one. But at the same time, we think it could be a sound and sensible one.

While the Chrome OS is regarded as the simplest of operating systems (OS), it is still a valid operating system you can choose when you buy a laptop for work. The education sector loves Chromebooks because they are rather cost effective and simplistic in nature. It is fuss free to work with, a perfect introduction into the world of computing.

Chrome OS is and can be so much more than just a laptop made for the school. It can be a rather simple way for organizations to manage their work devices. It is an inexpensive solution for enterprises looking to equip their employees for their digital transformation. They can be premium machines that fulfill all sorts of needs too, except for gaming.

So, we wondered; what is it like to live with a Chromebook? Is the Chromebook worthy to be a daily driver? Is the Chrome OS even the right platform to begin with when it comes to corporate use?

The Hardware

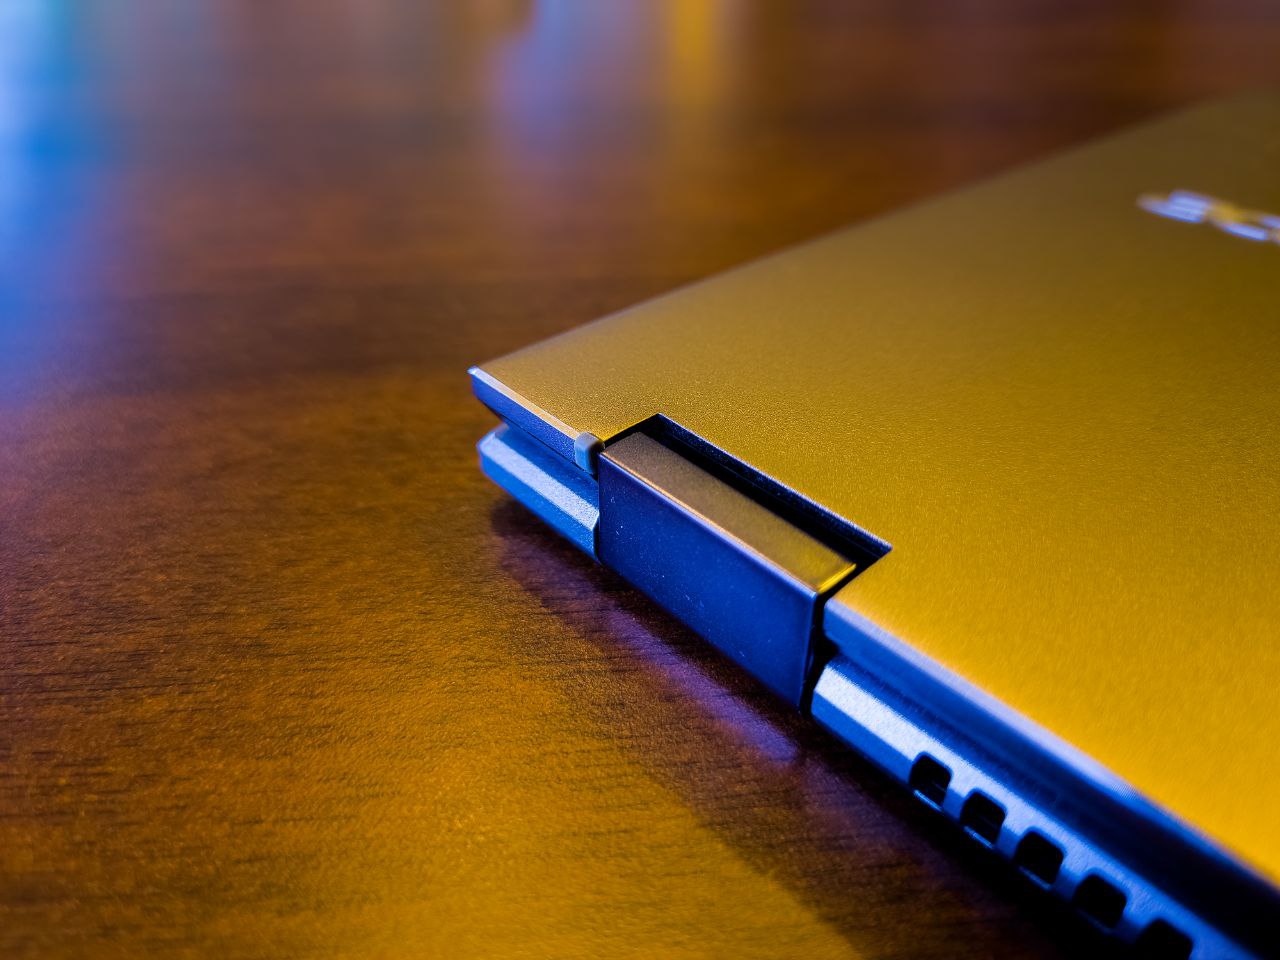
Chromebook713 1
Chromebook713 2
Chromebook713 3
Chromebook713 5
Chromebook713 6
Chromebook713 7
Chromebook713 8
1 / 7

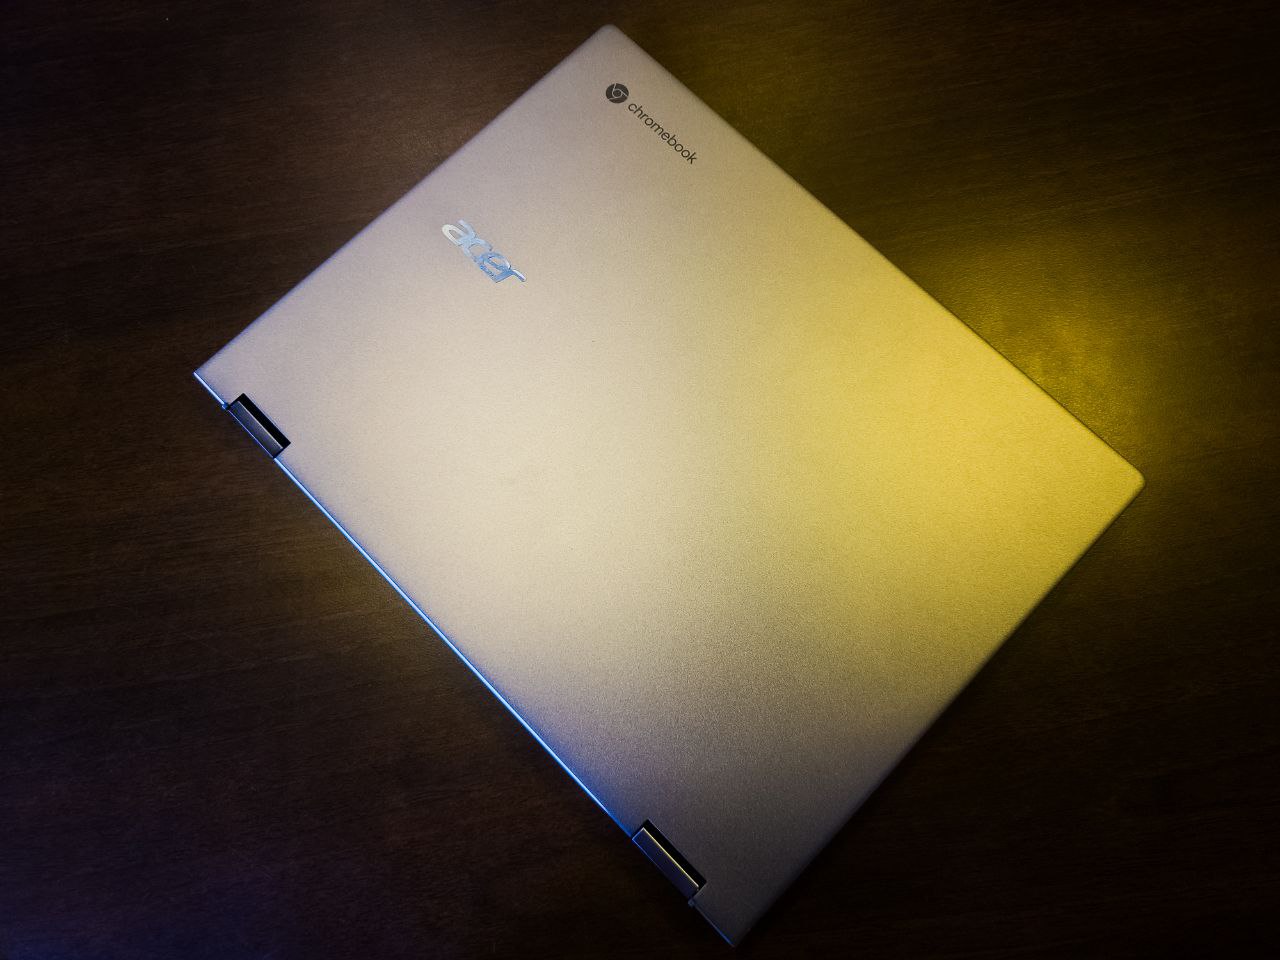
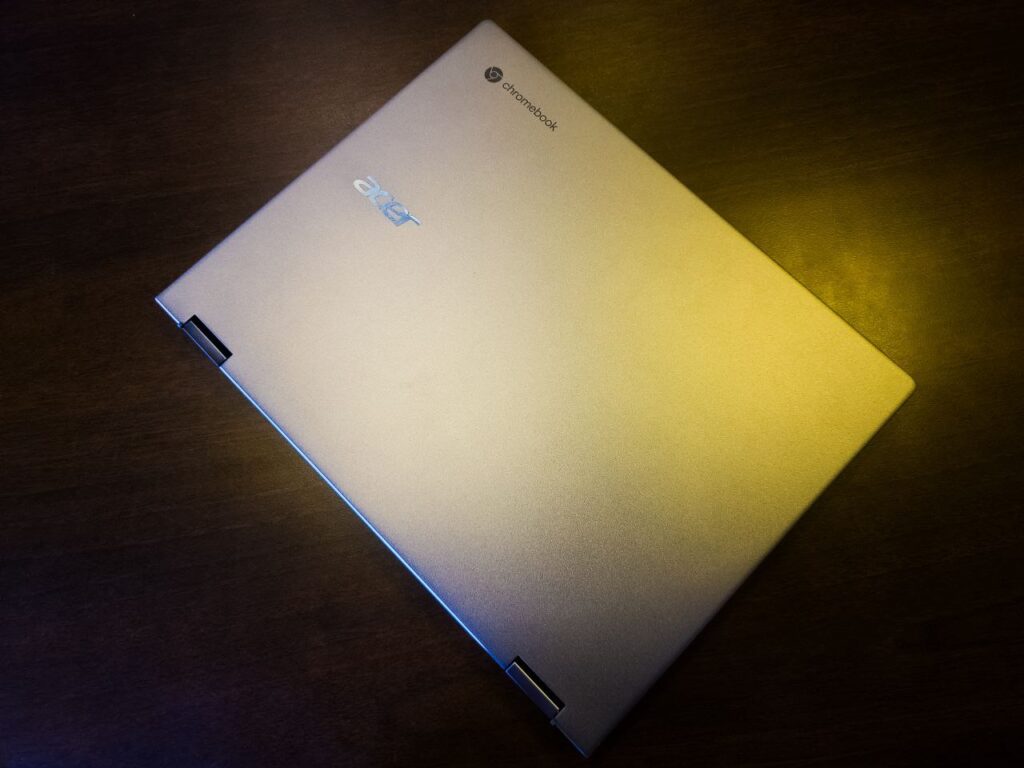
We are very lucky to get our hands on the Acer Chromebook Spin 713. Thanks to the support of Acer, we did not have to fuss over choosing the right Chromebook to work with. It is also the most premium Chromebook you can find in their line-up of Chromebooks.

The Acer Chromebook Spin 713 is nothing like a budget Chromebook made for the school. It still can take scrapes and bumps with MIL-STD810G certification. It is an MYR 3,799 convertible. It is also a rather powerful Chromebook.

It packs Intel’s 11th Generation Core i5-1135G7 processor, something you generally find on thin-and-light Windows notebooks. It has 8GB of RAM and 256GB in storage. Acer advised us against opening the guts of the notebook to replace or upgrade anything within the Chromebook in fear of bricking the unit, so we will comply with their requests for now.

Chromebook713 5

It is a convertible, so it also comes with a glass protected touch display that measures in at 13.5-inch with 2,256 by 1,504 pixels on tap from the IPS panel. Yes, it is a 3:2 aspect ratio display, quite odd. The dual speakers leave a little more to be desired, but you can plug your headphones in with the AUX jack, or connect your Bluetooth enabled gear to the Chromebook.

Aside from the AUX jack, you have two USB Type-C ports, both Thunderbolt ports thanks to Intel. The Chromebook charges via USB Type-C too. There is another USB port beside a MicroSD card reader, a Type-A for convenience. There is also a full-sized HDMI port for extra versatility.

Setting up Chrome OS

ChromeOS Setup1
ChromeOS Setup10
ChromeOS Setup9
CrhomeOS Setup8
ChromeOS Setup7
ChromeOS Setup6
ChromeOS Setup5
ChromeOS Setup4
ChromeOS Setup3
ChromeOS Setup2
ChromeOS Setup11
2 / 11

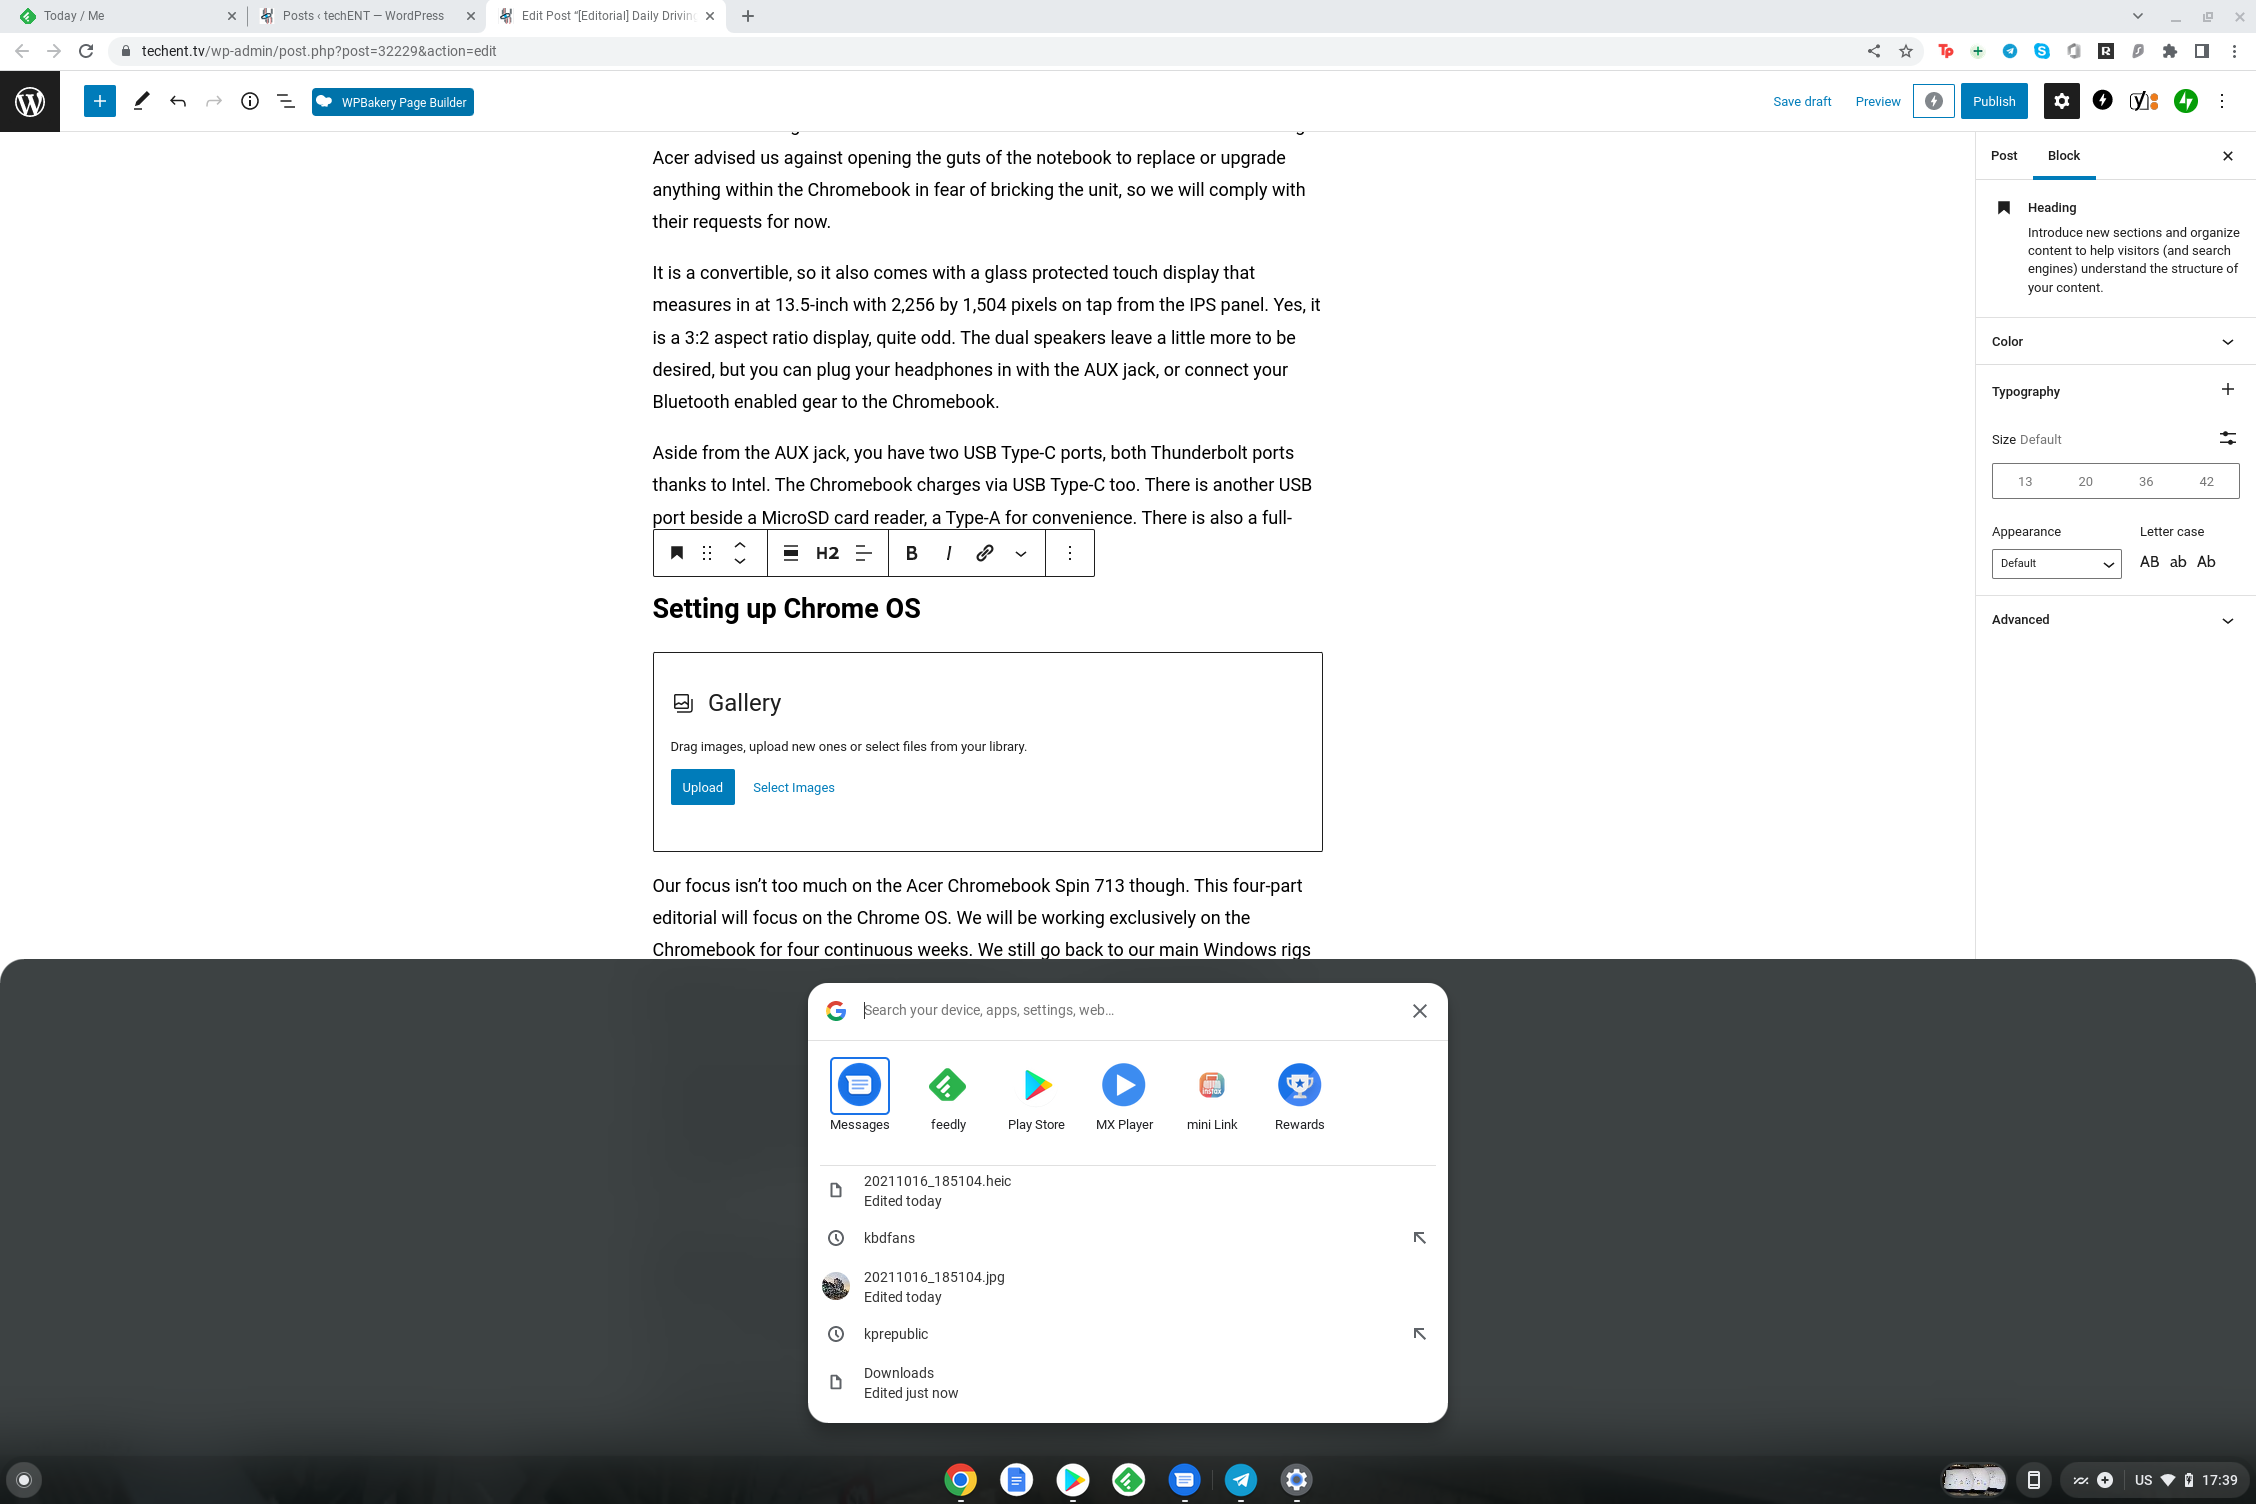
Our focus isn’t too much on the Acer Chromebook Spin 713 though. This four-part editorial will focus on the Chrome OS. We will be working exclusively on the Chromebook for four continuous weeks. We still go back to our main Windows rigs for video editing. Everything else will be done on the Chromebook and Chrome OS though. In fact, this article is mostly typed and edited on the Chromebook itself.

While we are aware of Google Chrome OS, we are rather new to the interface. We expected some learning curve; there are some, though not as steep as we expected it to be. There are a few major differences in the interface that we will talk about in the coming weeks. Before we get into any of that, we must set up the Chrome OS first.

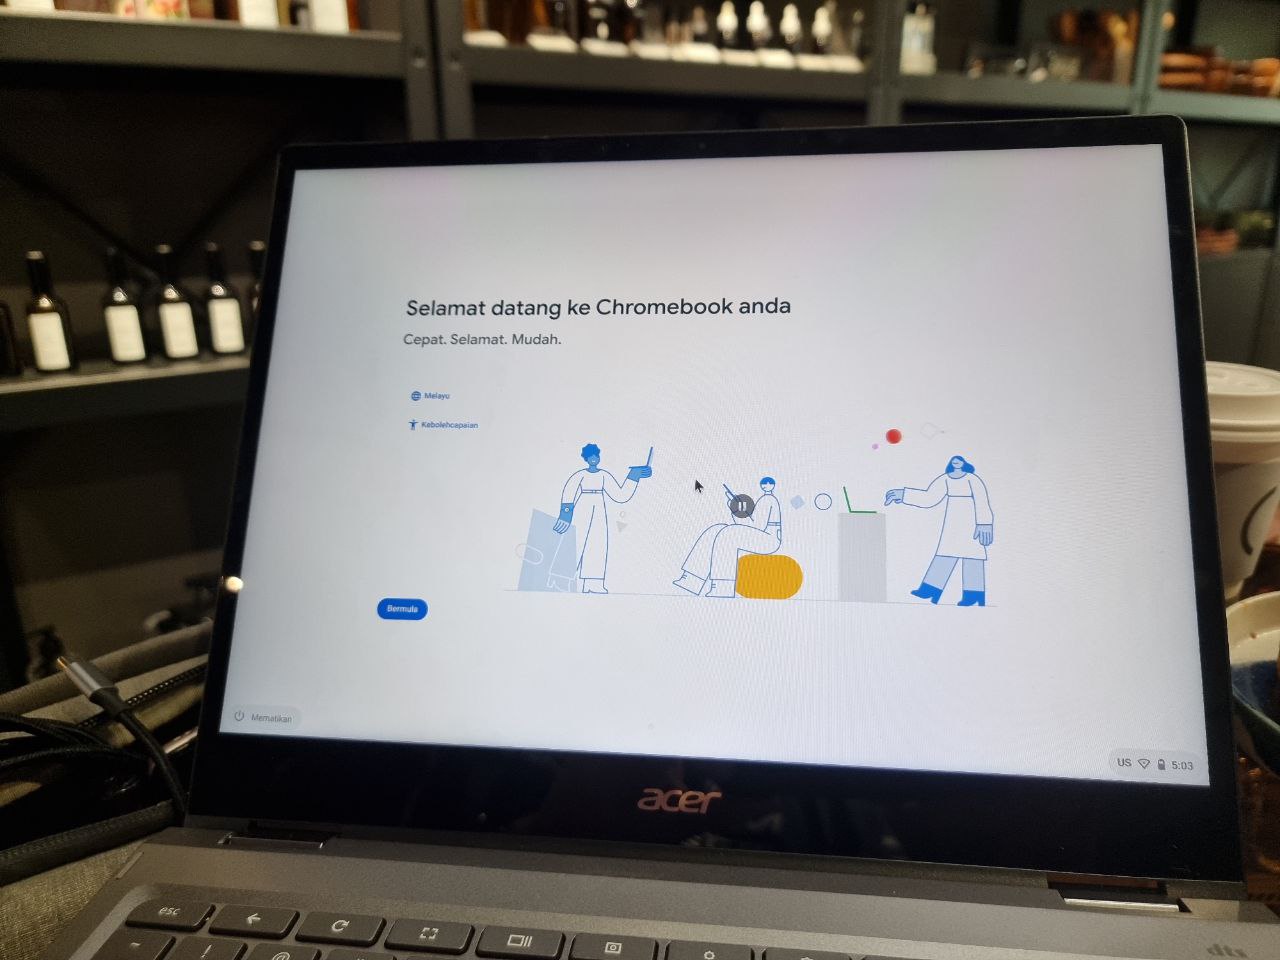
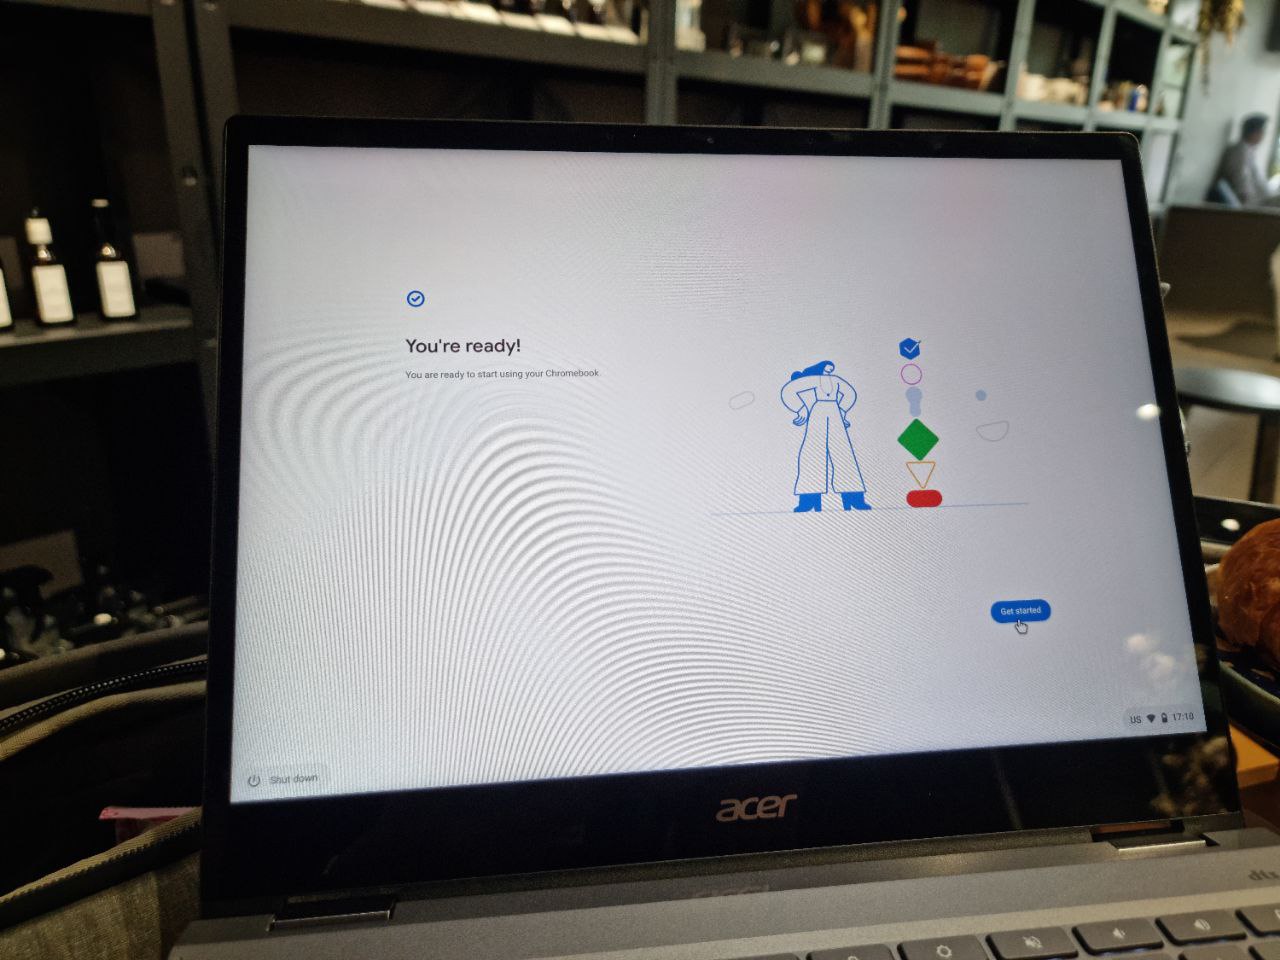
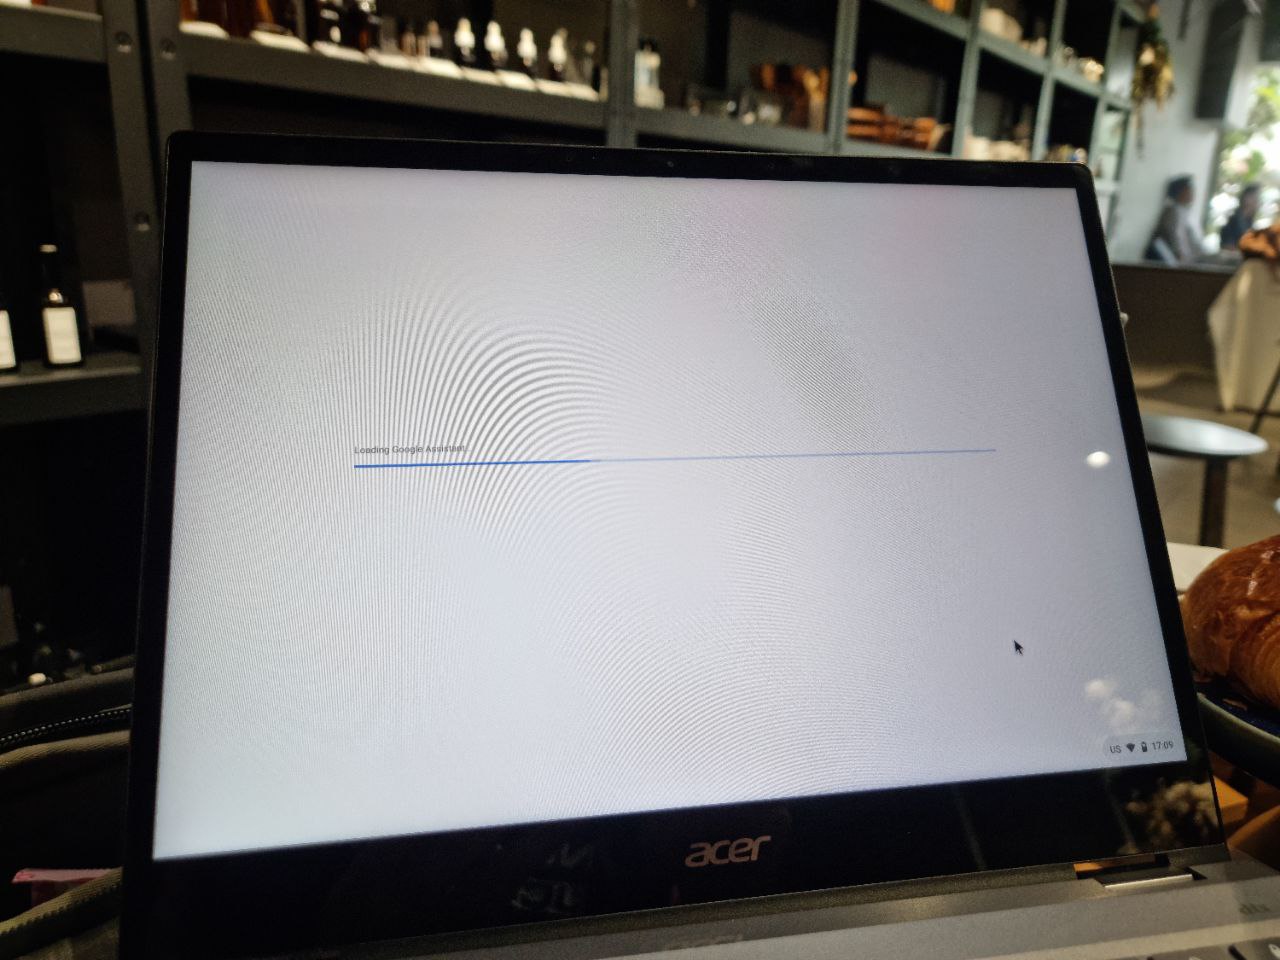
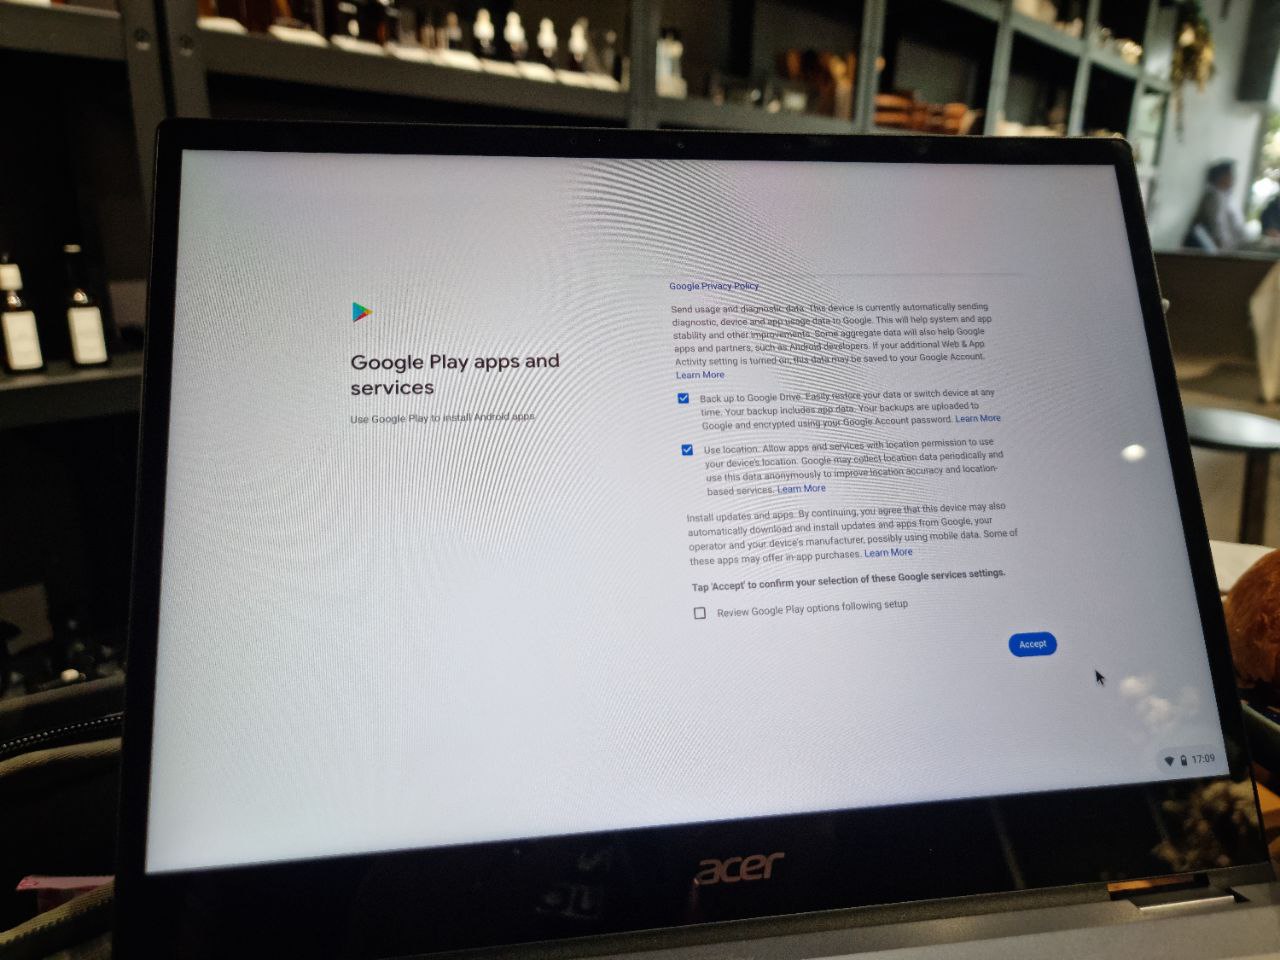
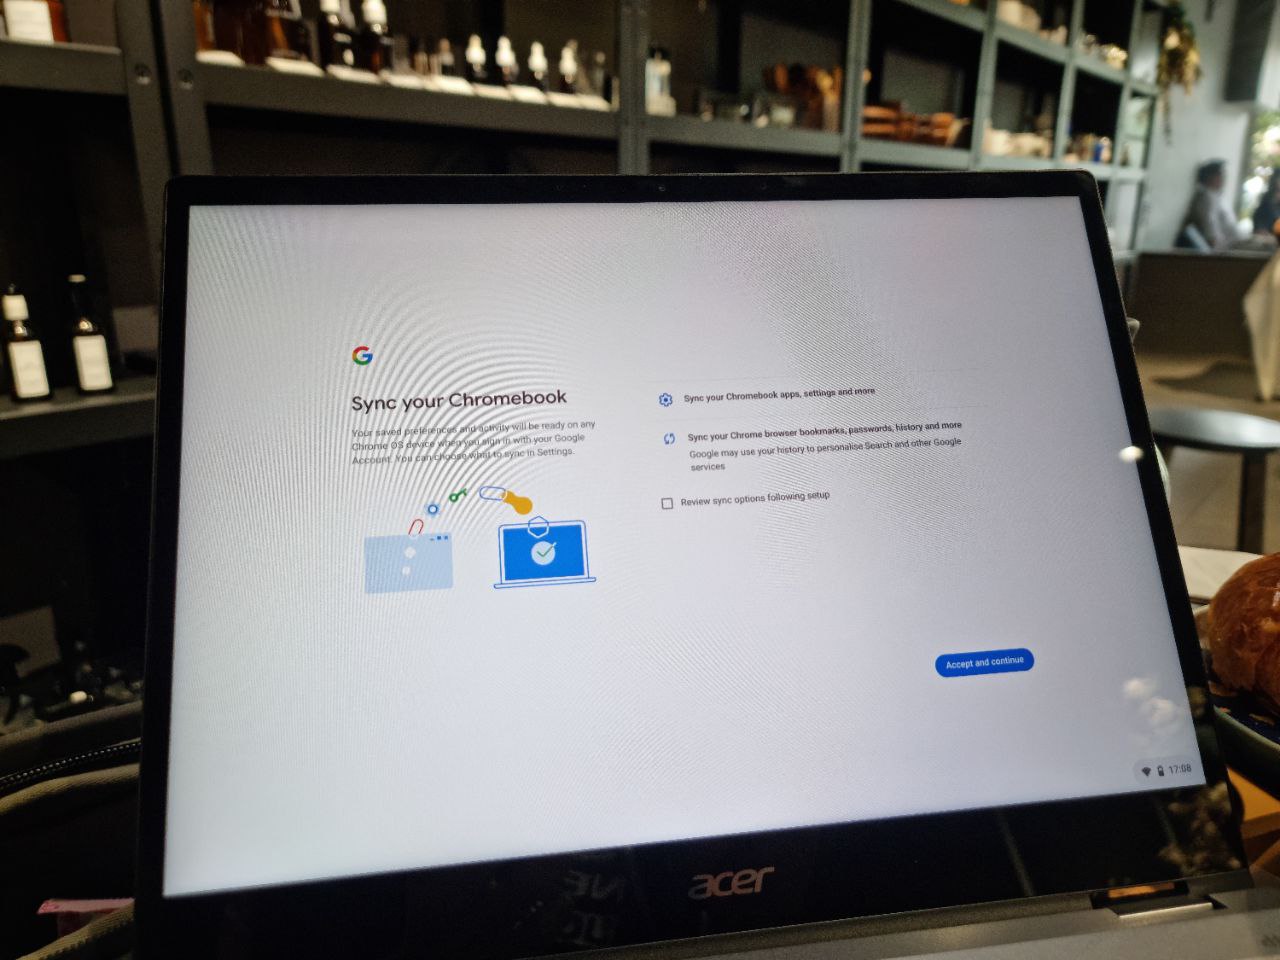
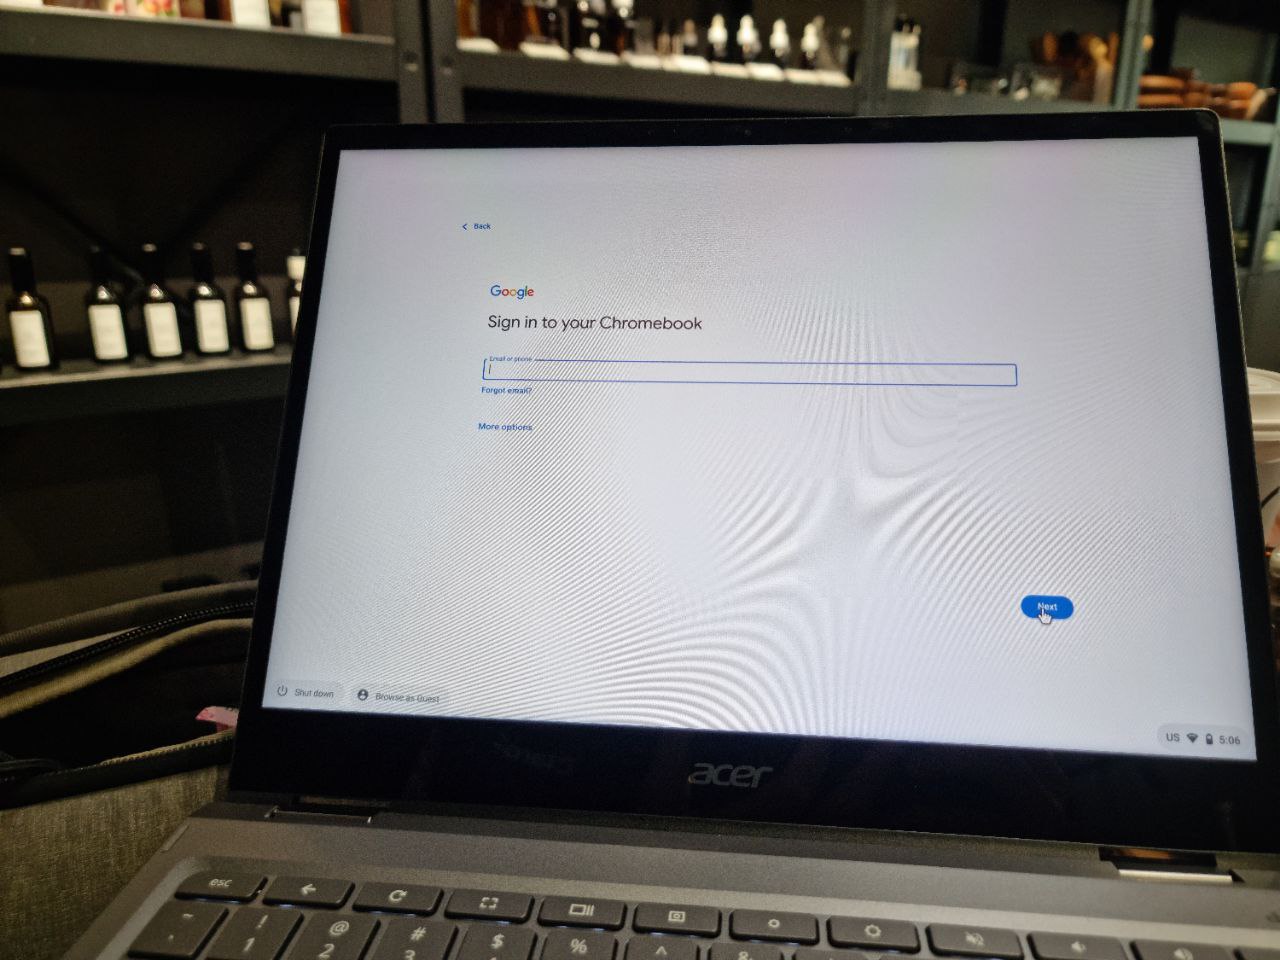
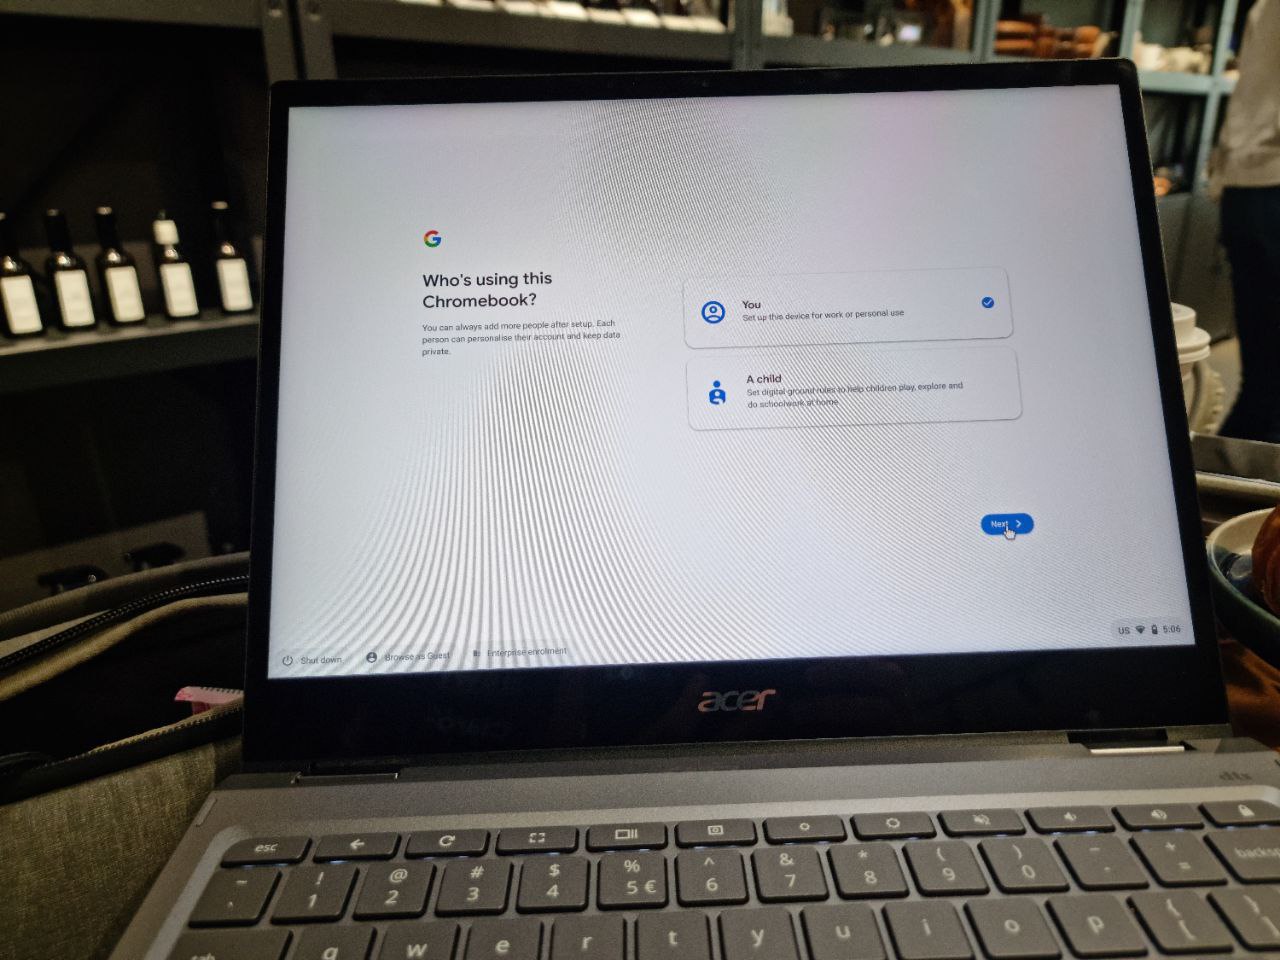
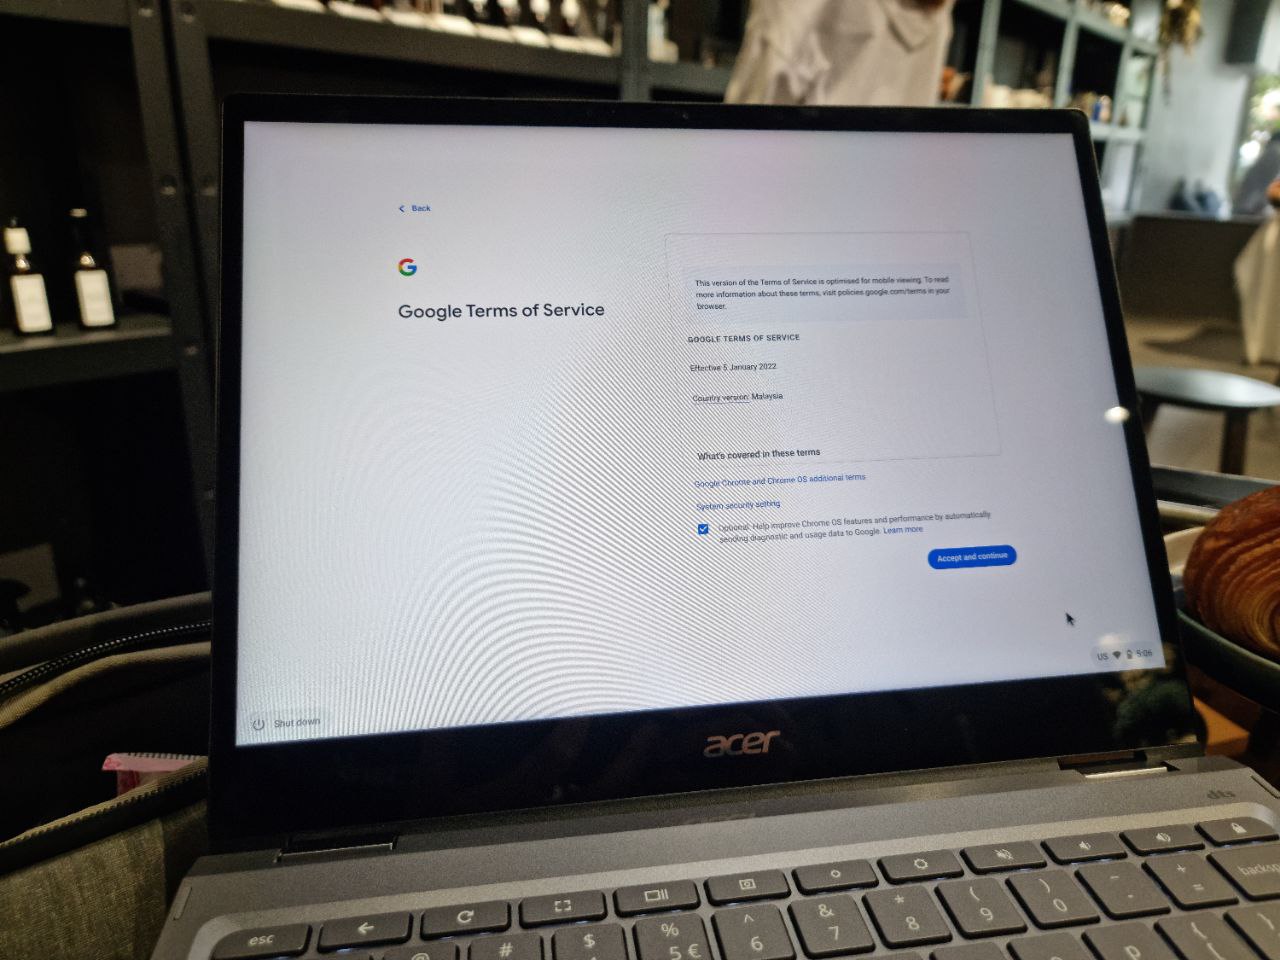
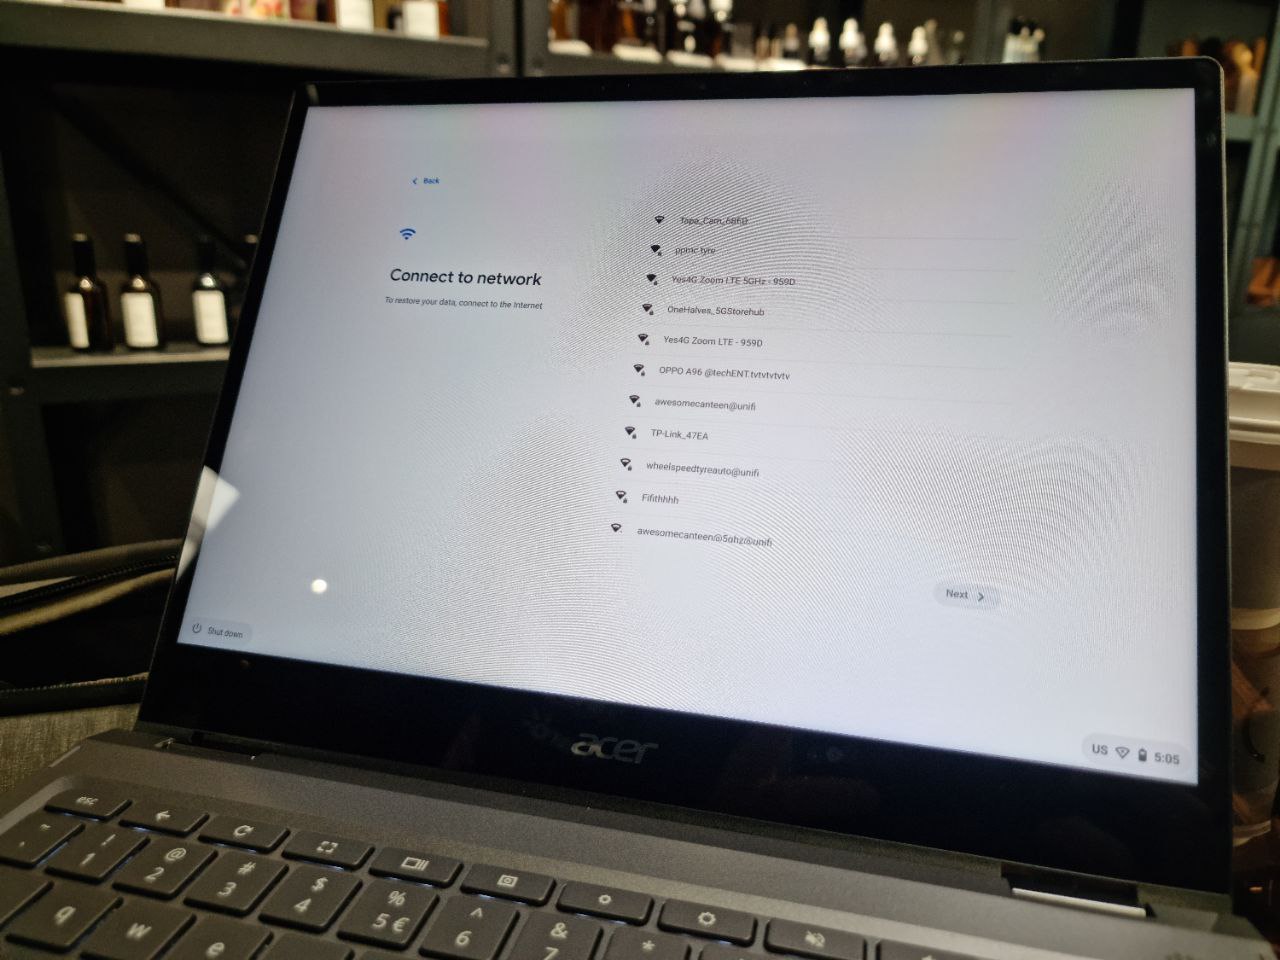
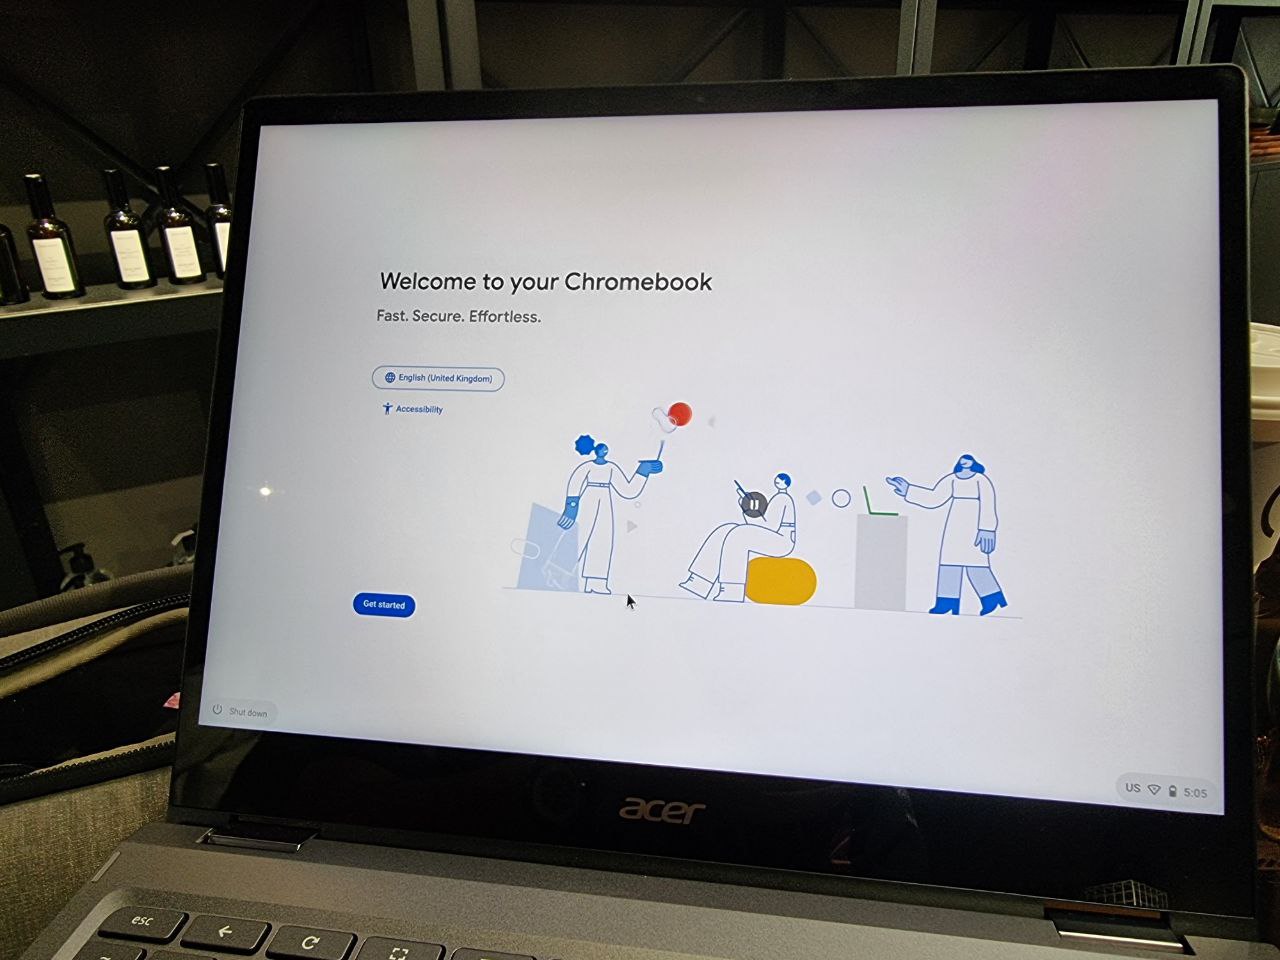
Its first boot leads us to a very familiar set-up screen. Obviously, you do not get a Windows style or Mac style set-up. It is even simpler than what we expected, to be fair. If you already have a Google Account in the first place, that is really all you need to get going. Within five minutes, we are ready to work with the Chromebook.

First Impressions – Picking Up the Clues

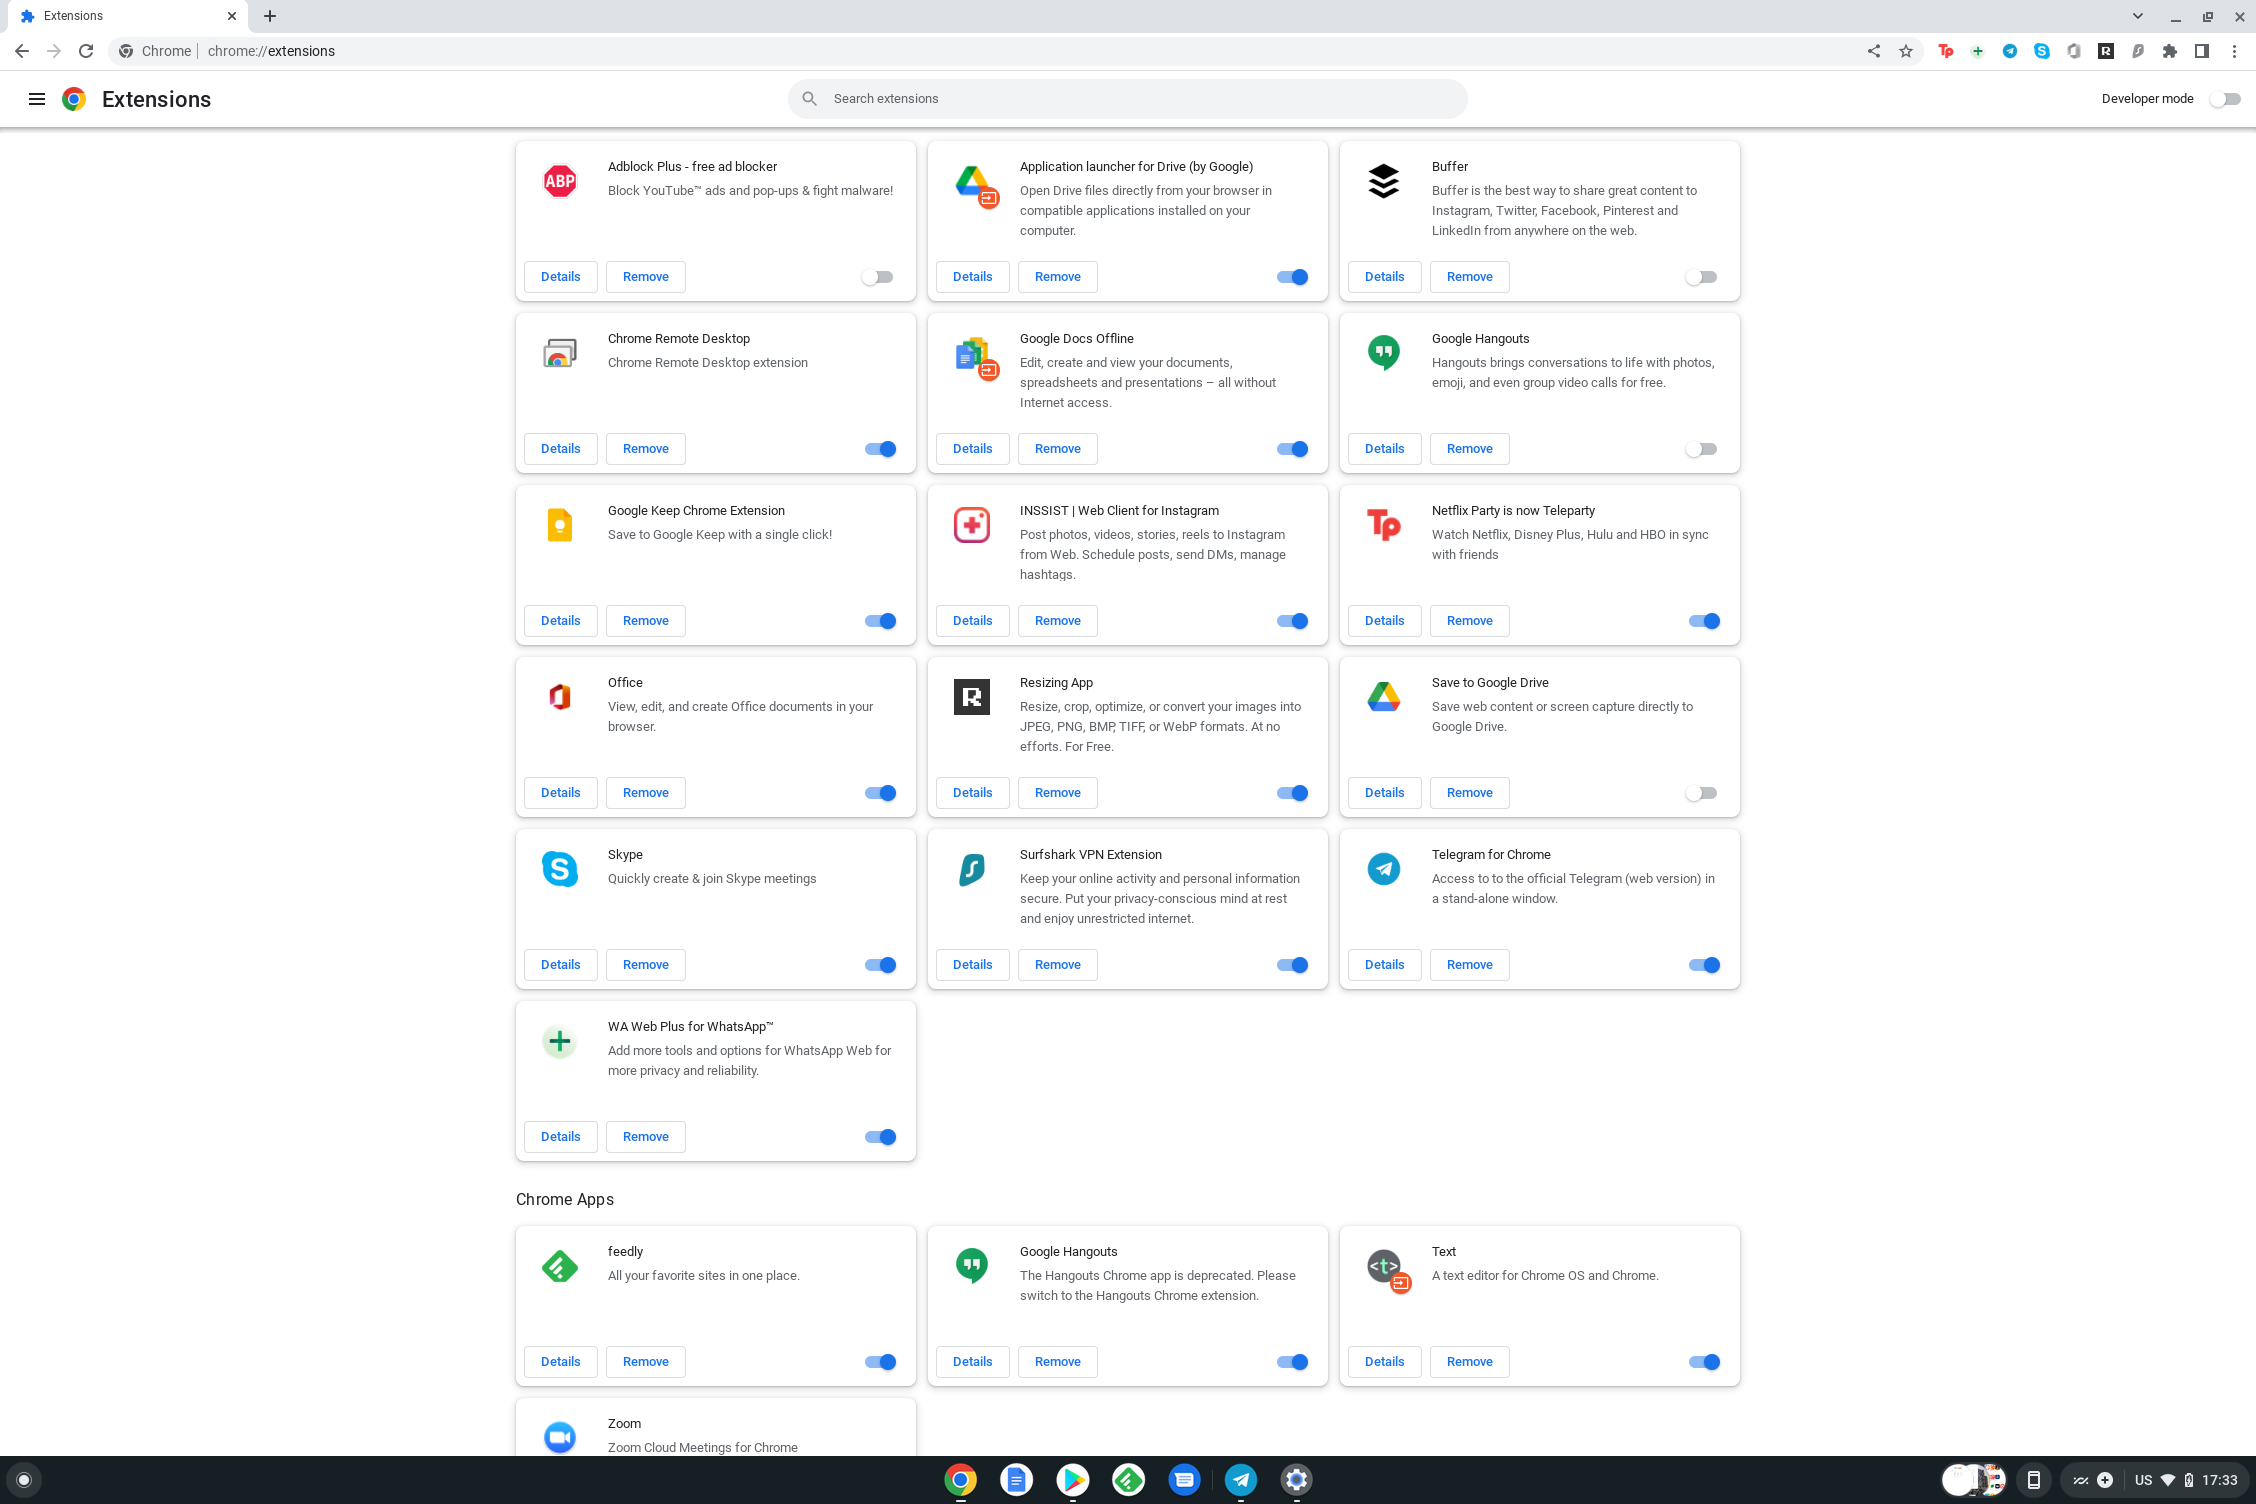
Screenshot 2022 04 22 17.32.25
Screenshot 2022 04 22 17.32.35
Screenshot 2022 04 22 17.32.43
Screenshot 2022 04 22 17.32.54
Screenshot 2022 04 22 17.33.05
Screenshot 2022 04 22 17.33.22
Screenshot 2022 04 22 17.33.29
Screenshot 2022 04 22 17.33.43
Screenshot 2022 04 22 17.34.58
Screenshot 2022 04 22 17.35.08
Screenshot 2022 04 22 17.35.26
Screenshot 2022 04 22 17.36.09
Screenshot 2022 04 22 17.39.05
3 / 13

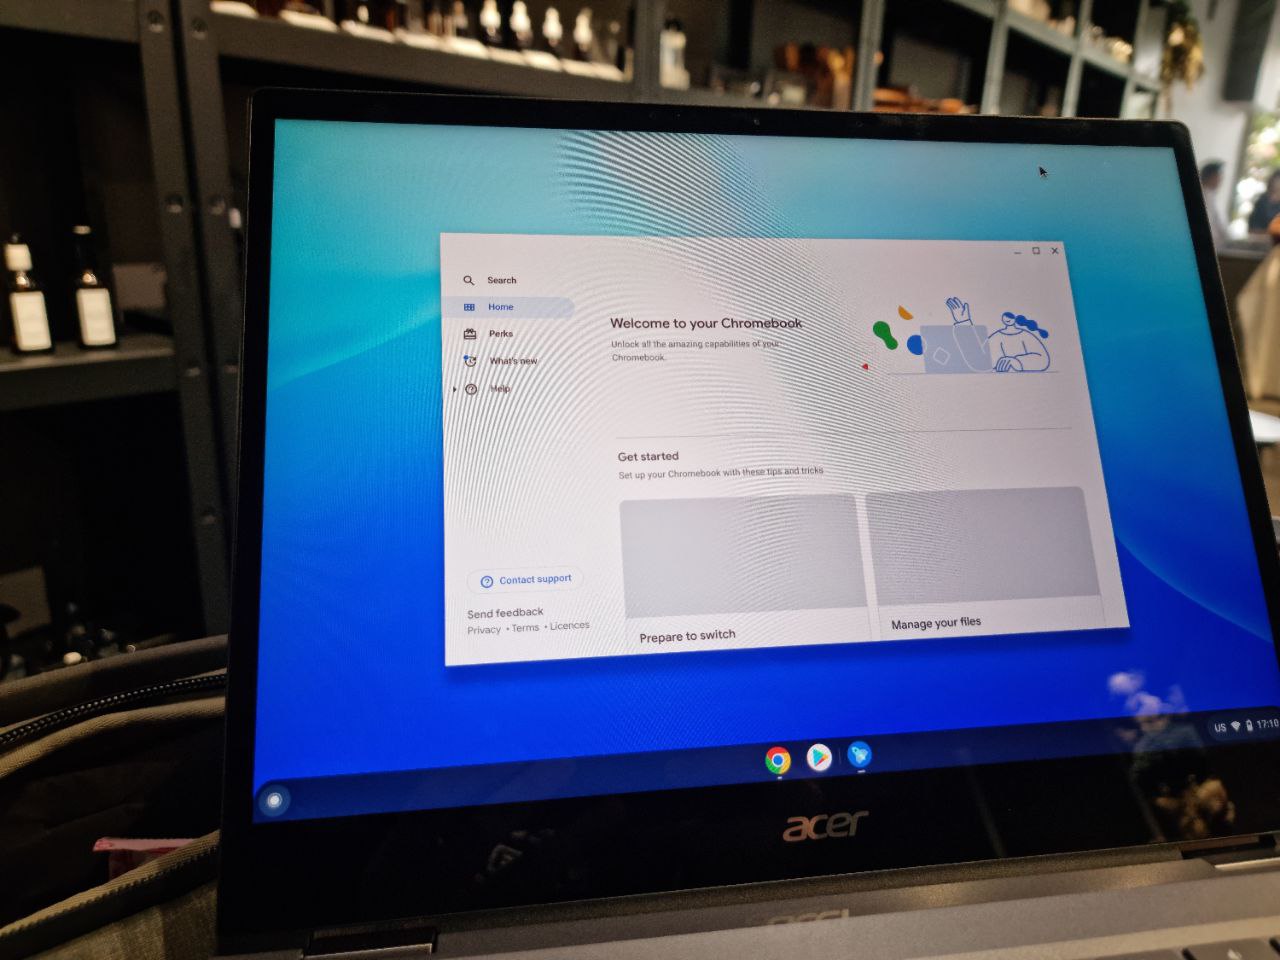
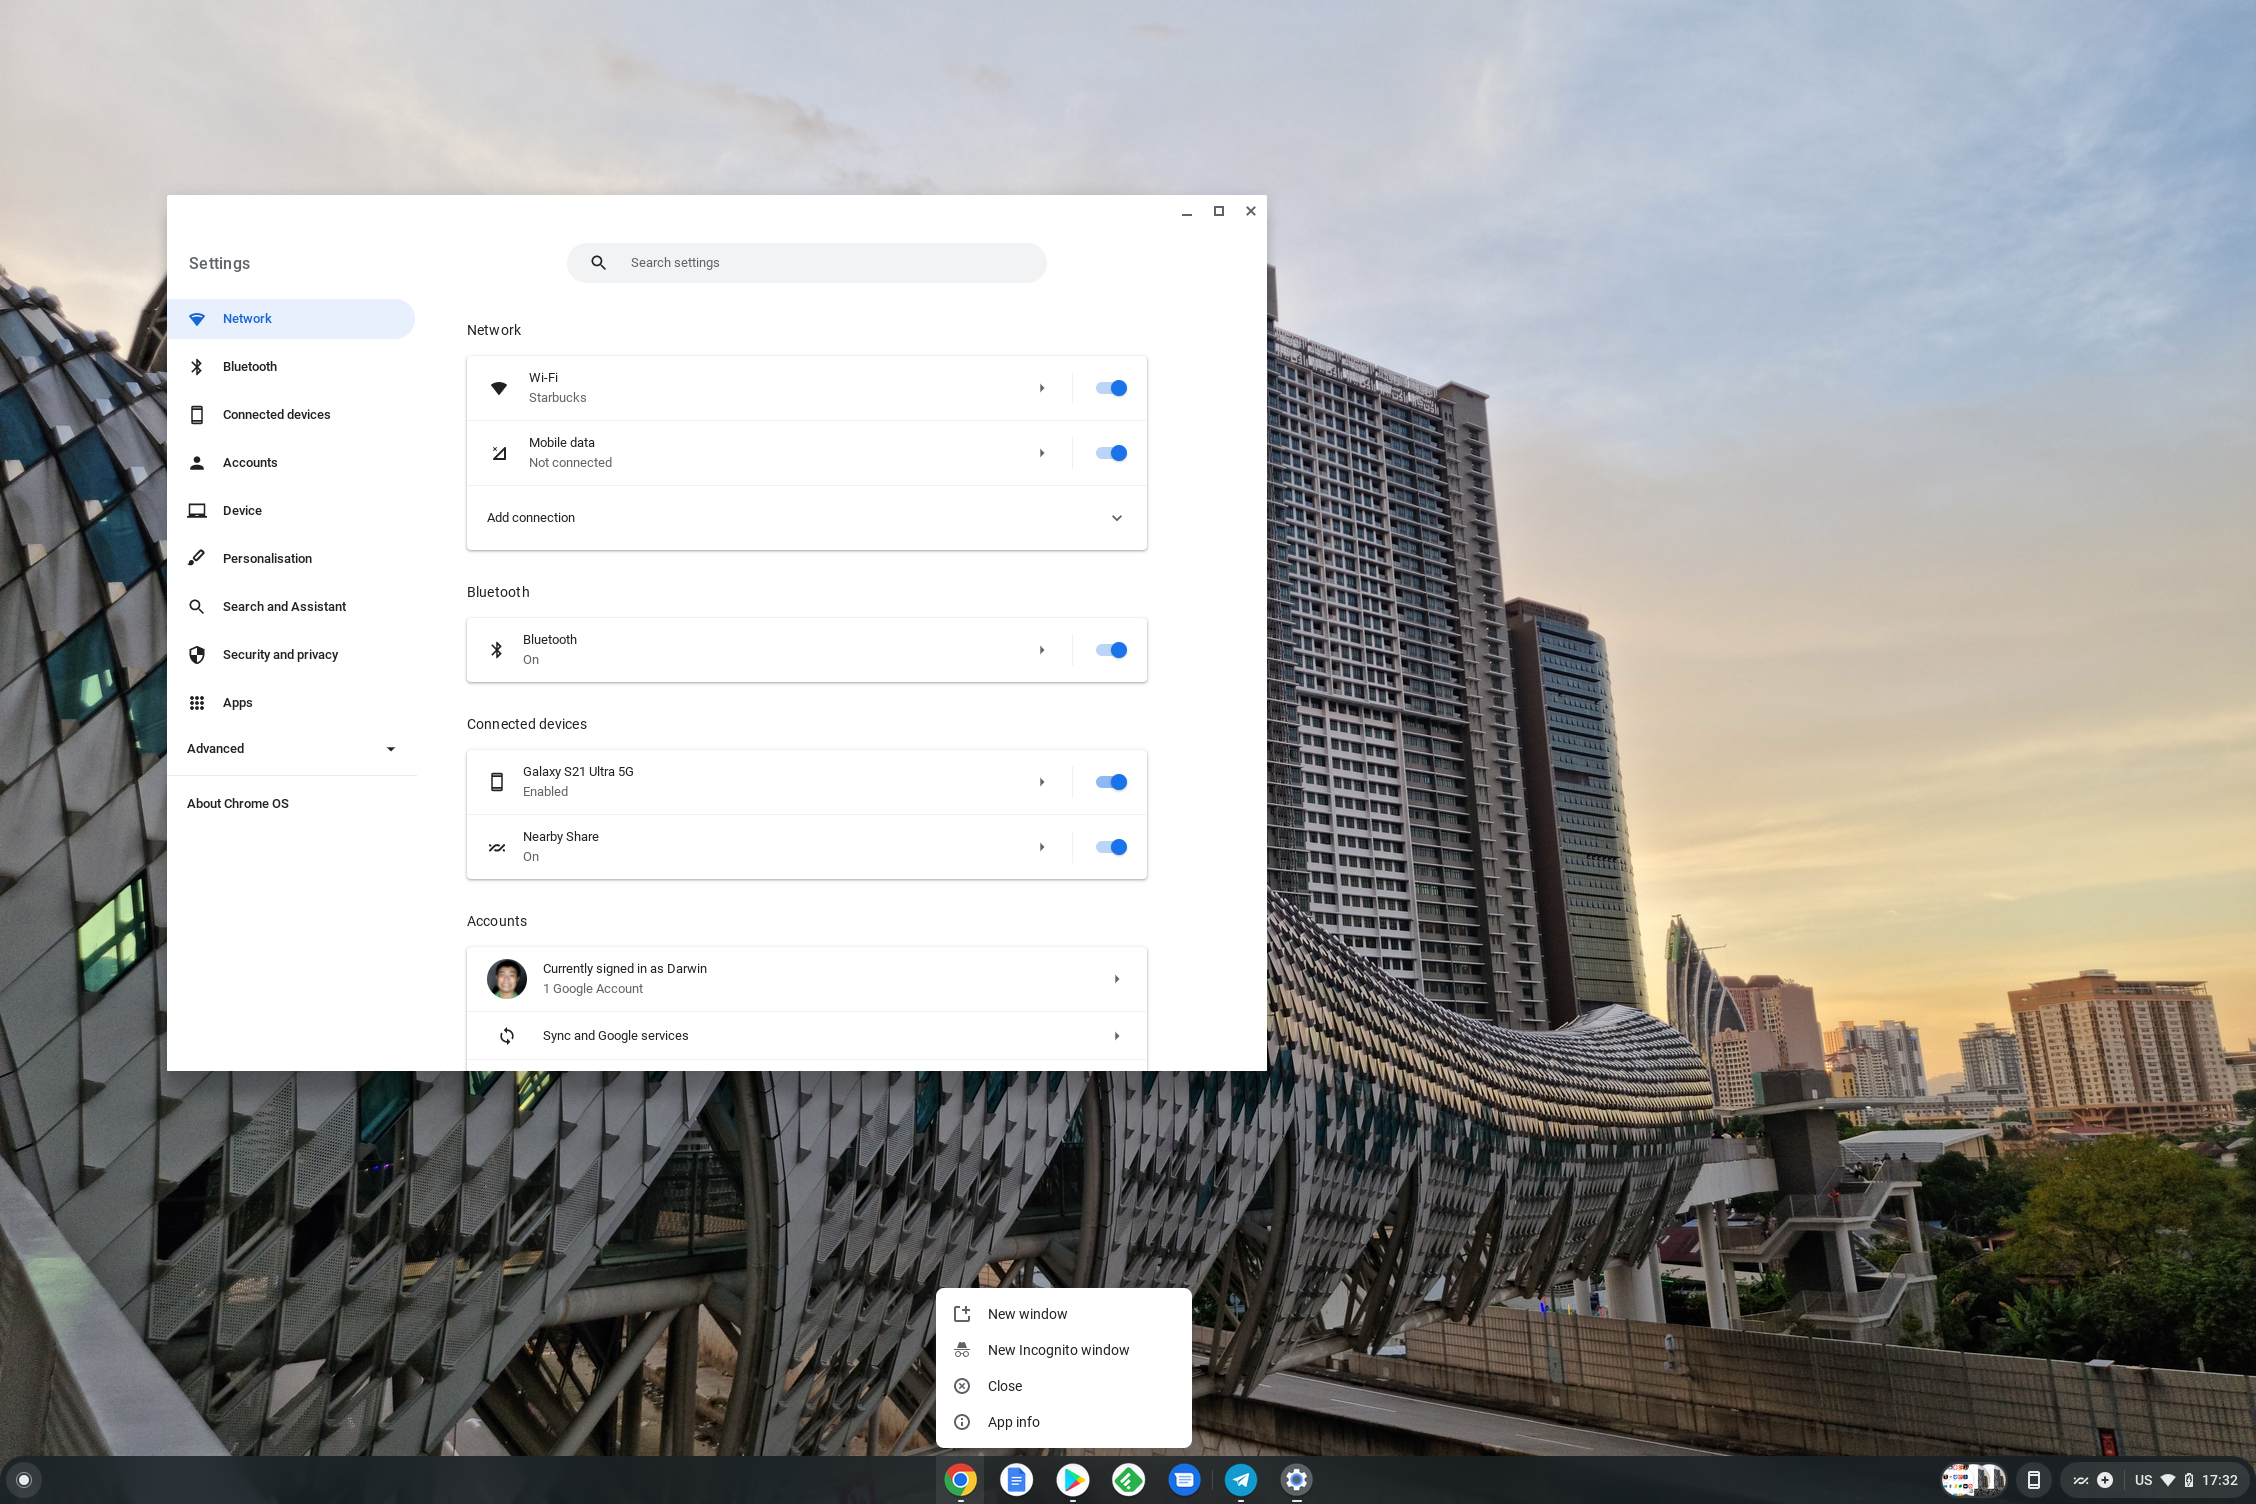
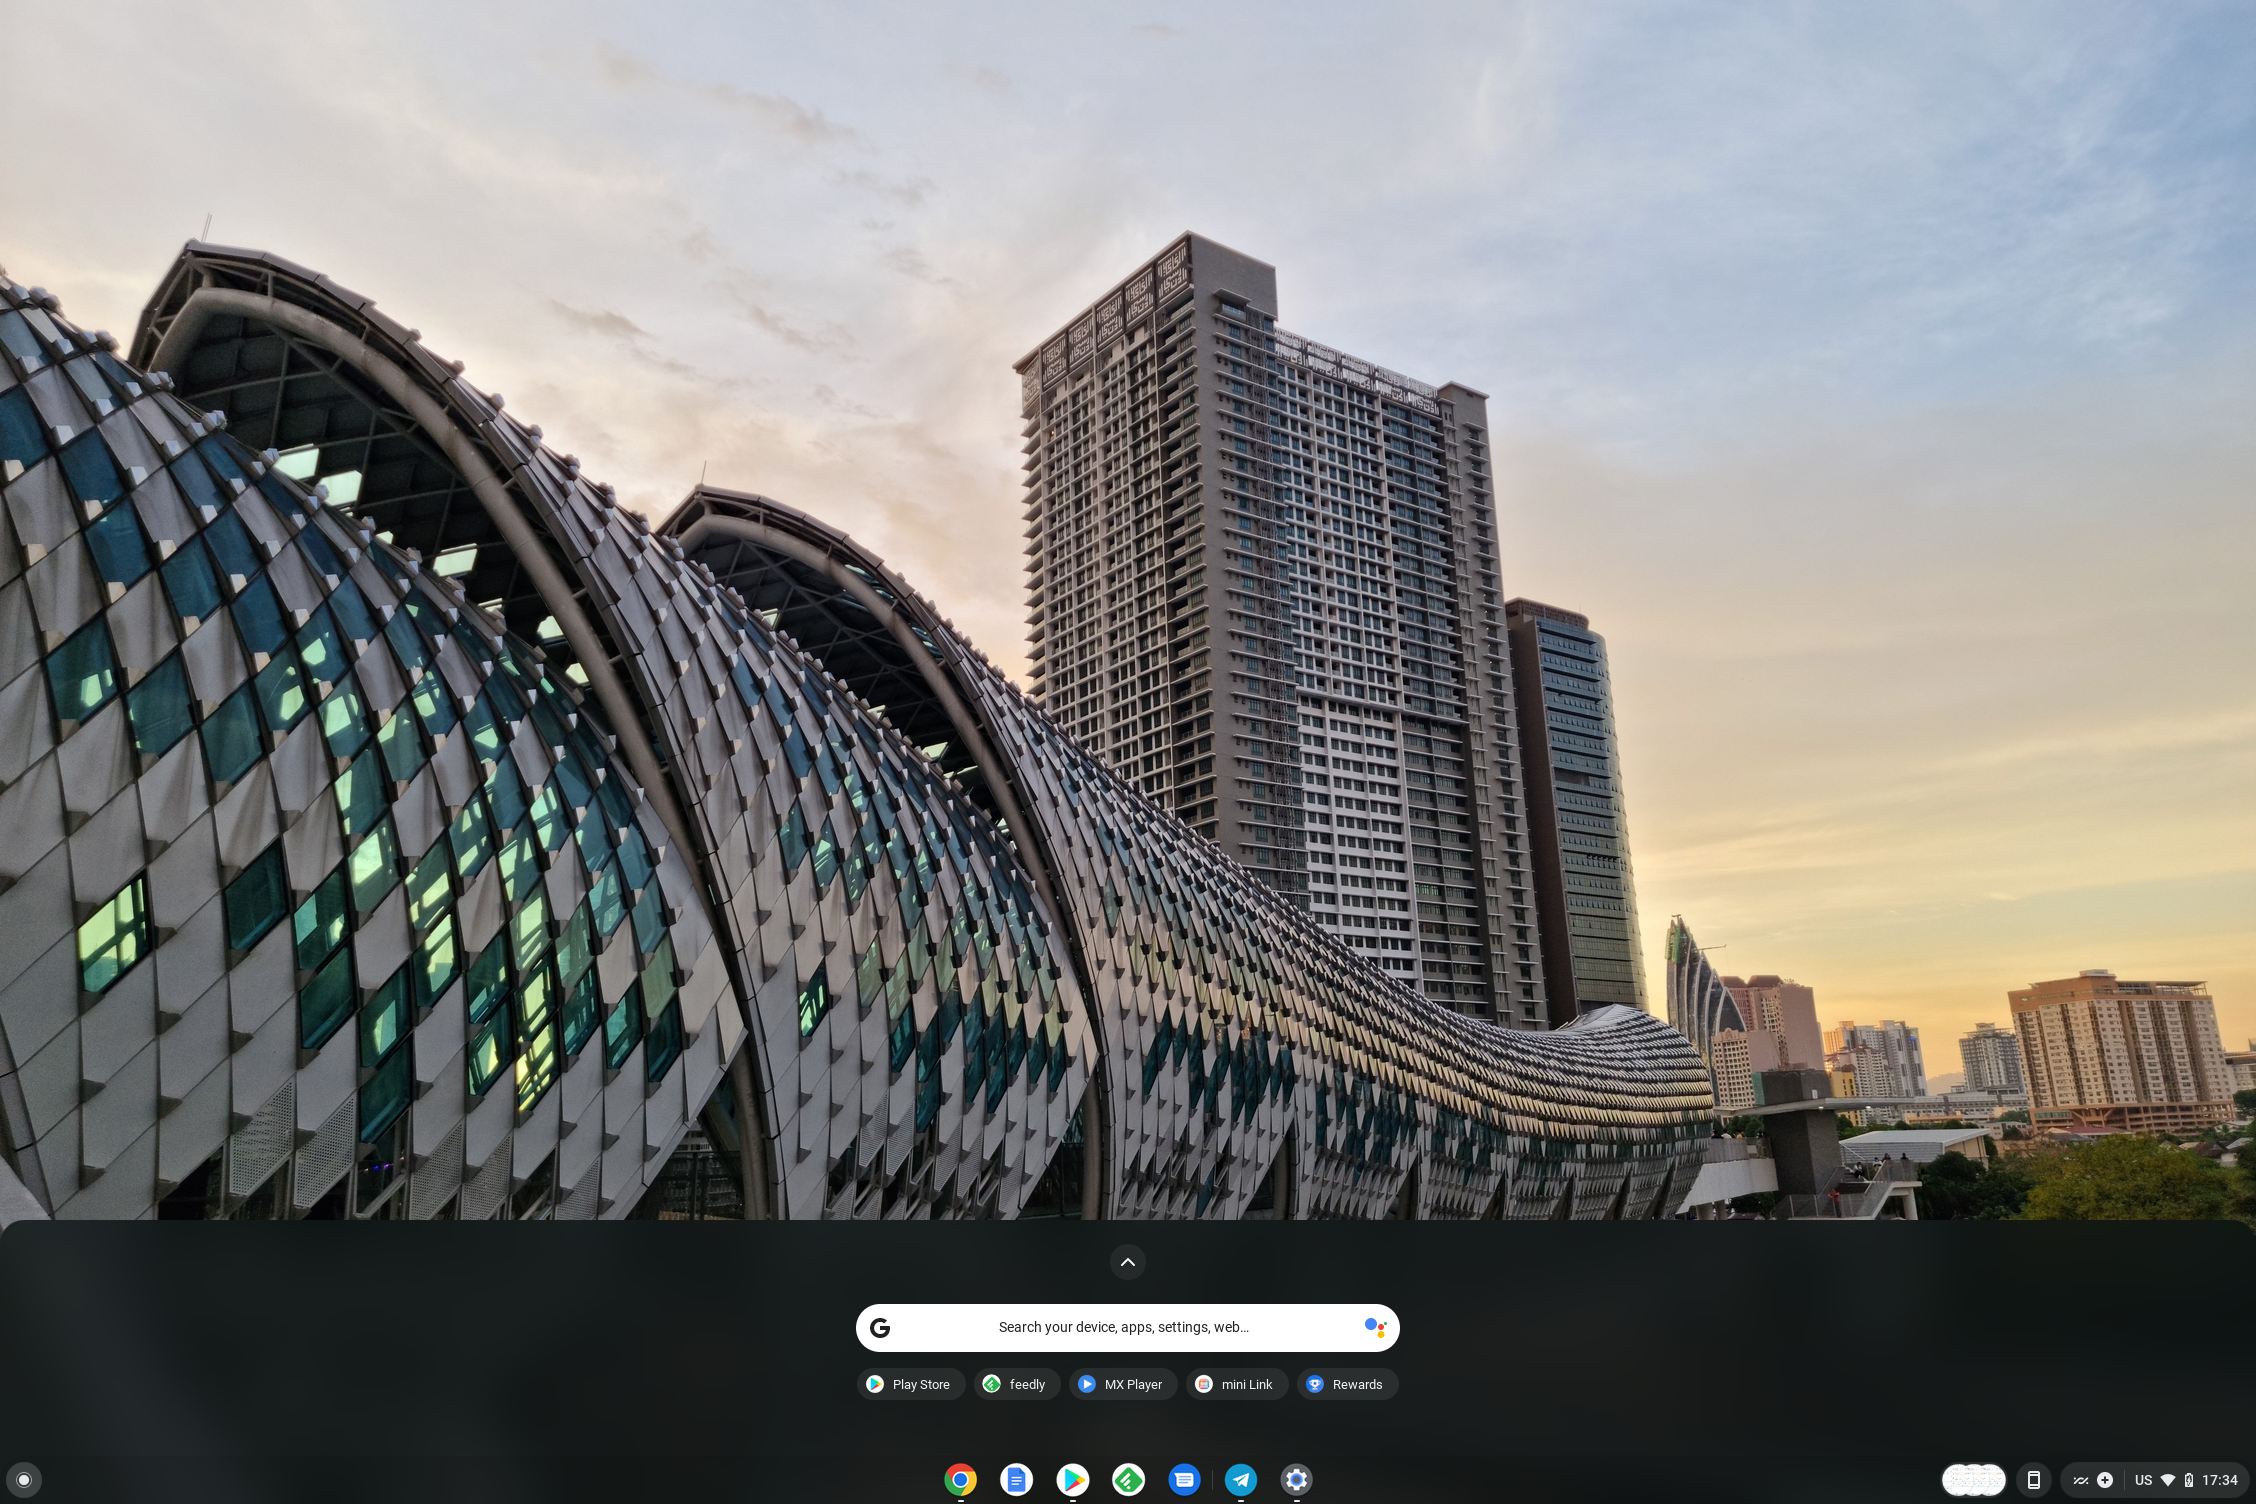
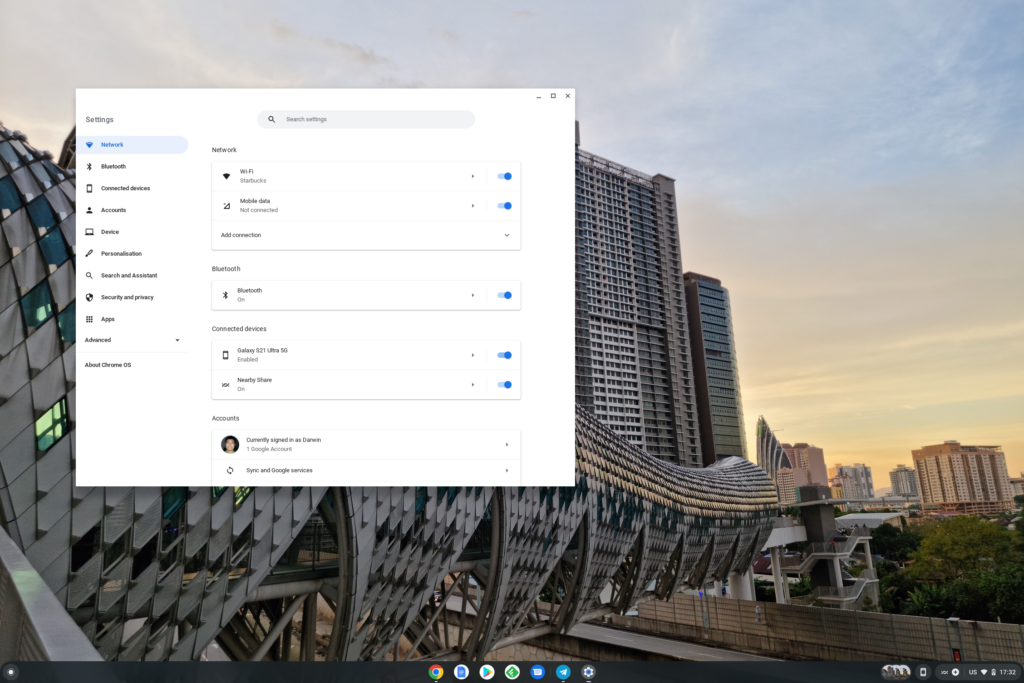
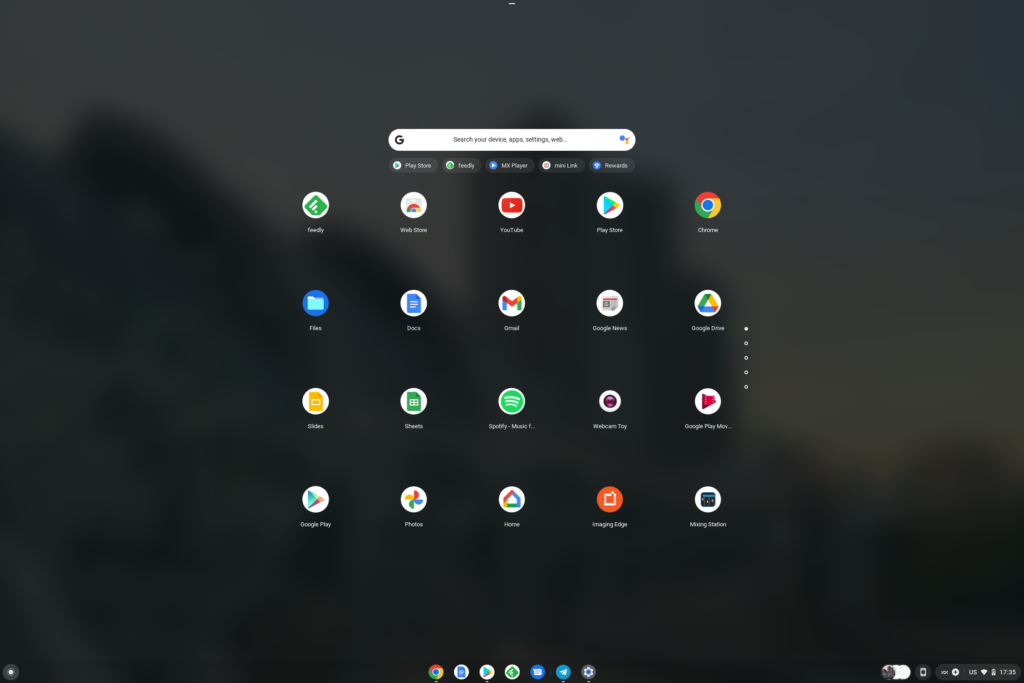
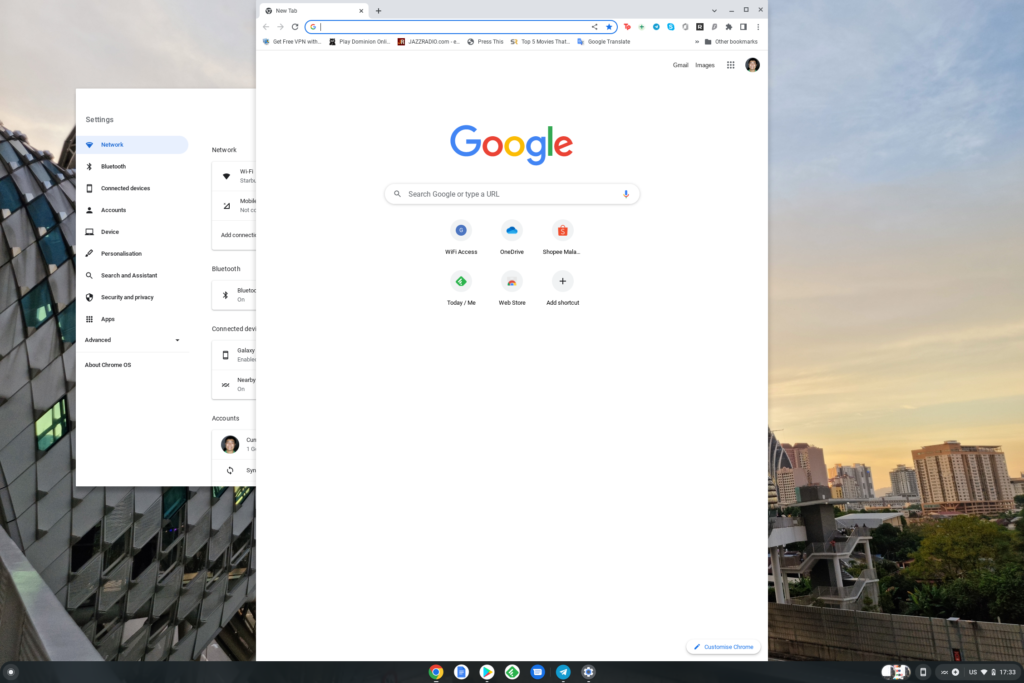
We see a familiar desktop home screen, a welcome at least coming from the Windows ecosystem. Except, we were a little disappointed when we found out that we cannot put anything on the home screen. You can only change the wallpaper of your home screen. We sort of expected a more Android like experience, especially with widgets. Sadly, it is what it is.

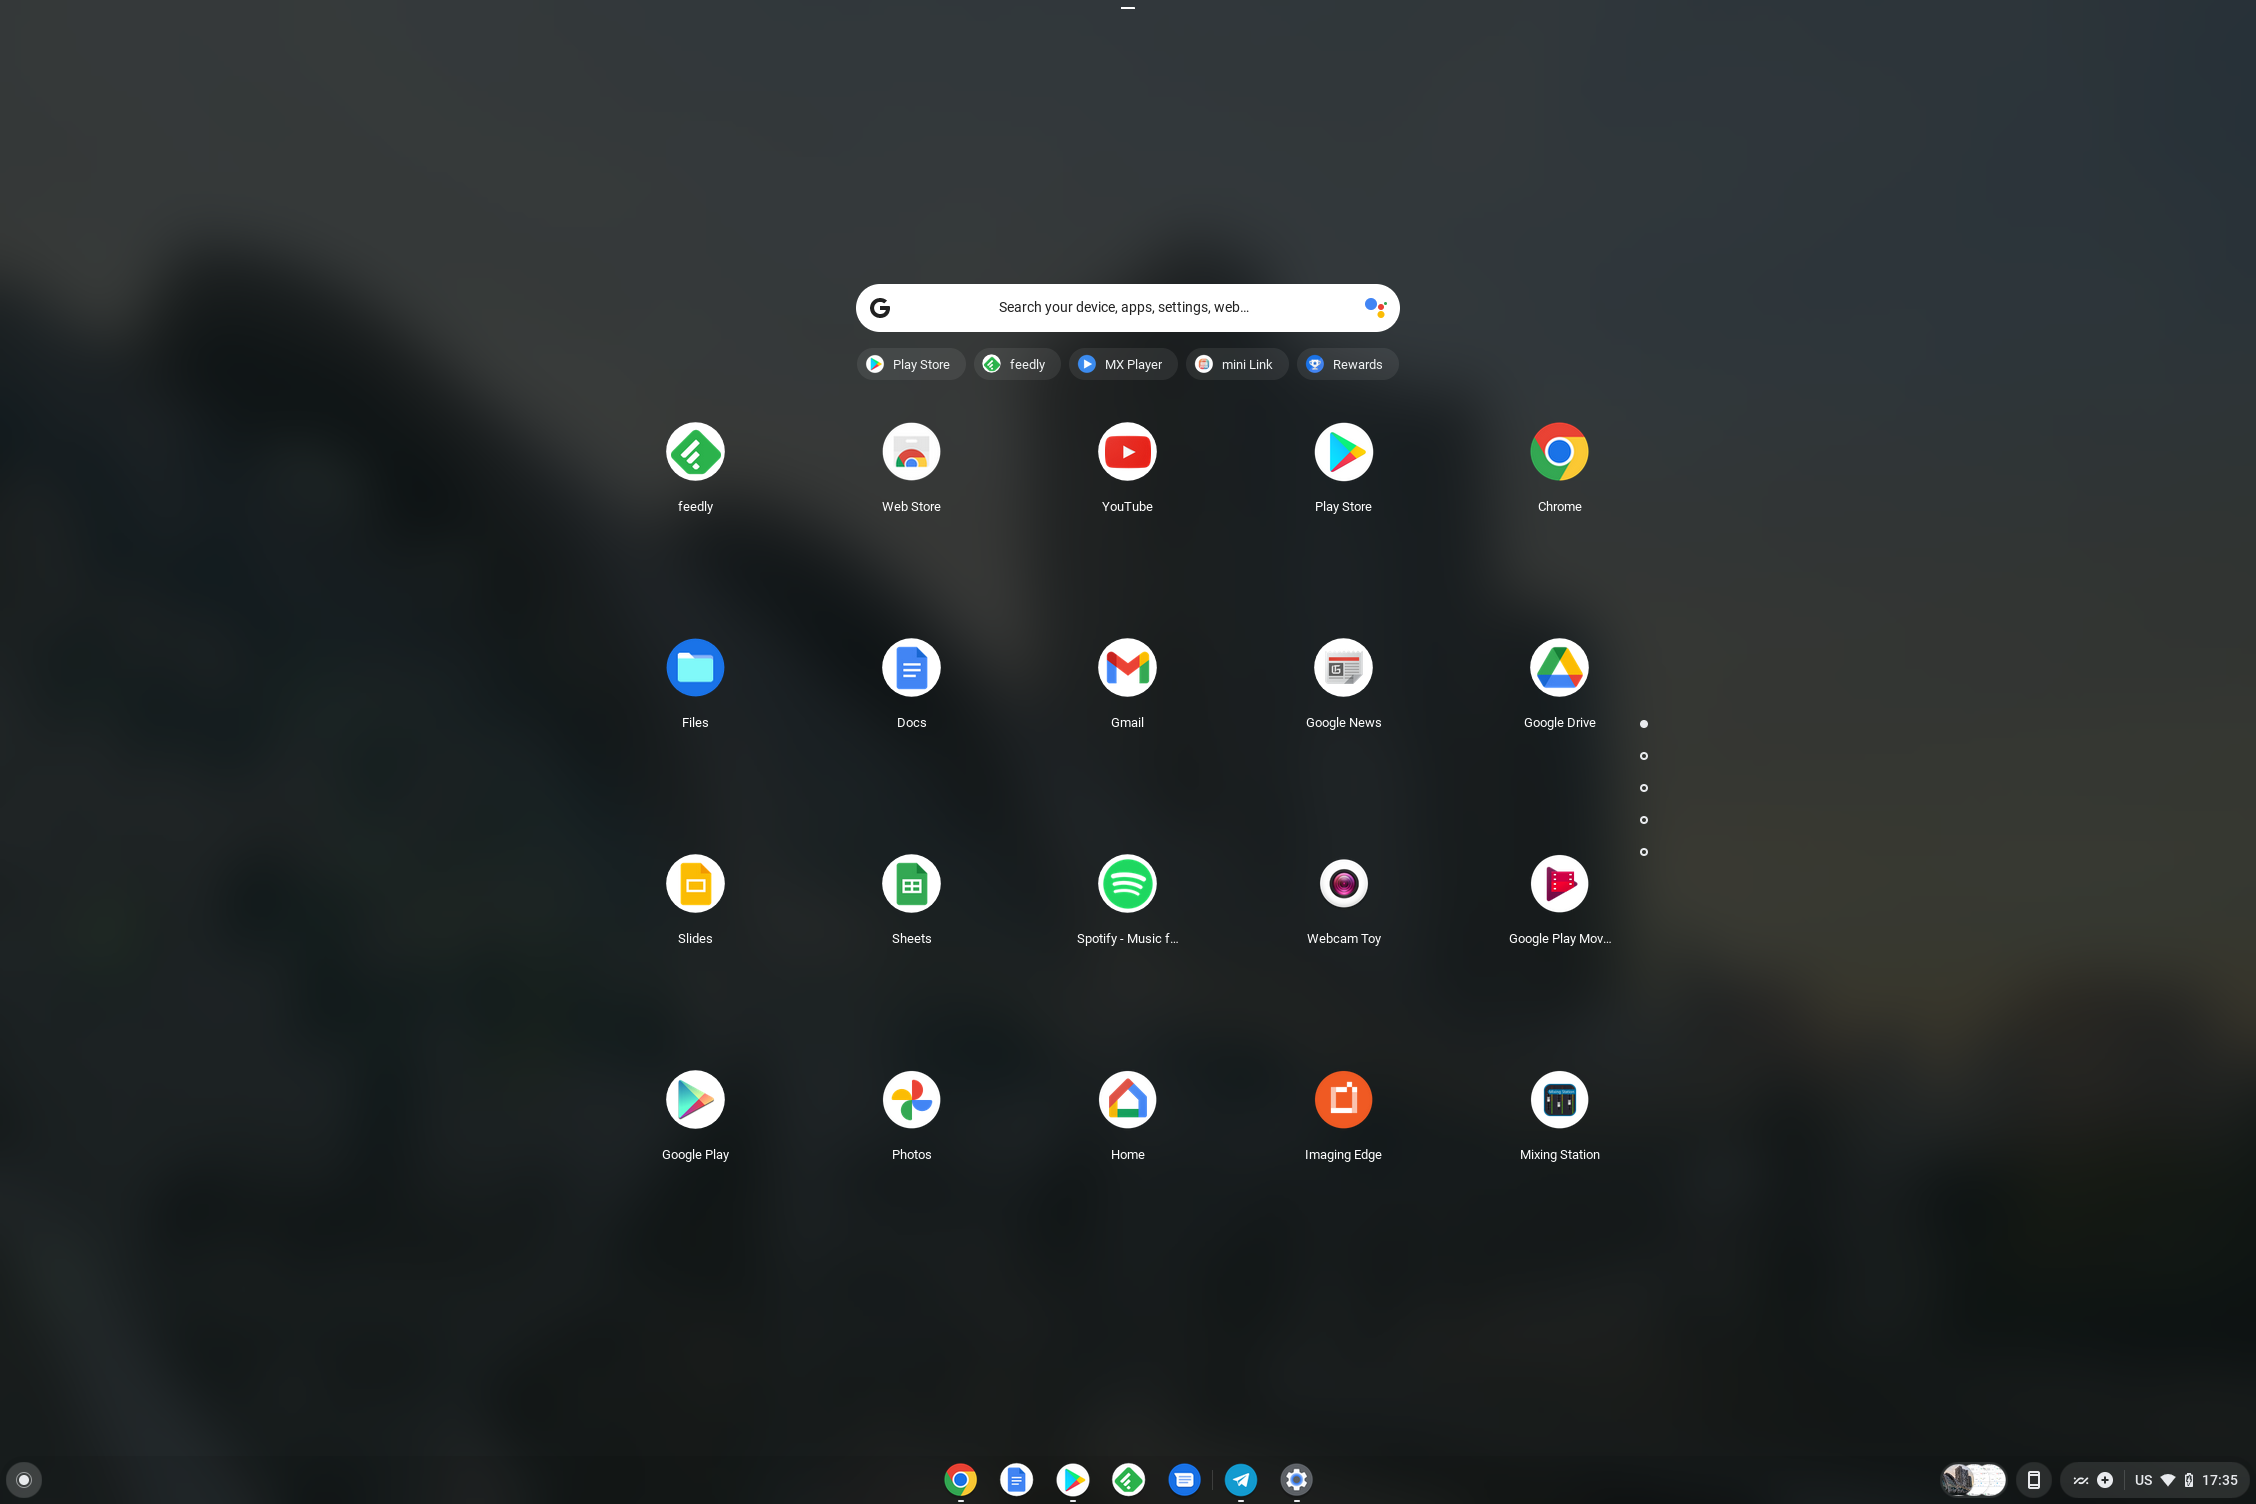
The icon on the interface is digitally enlarged to fit eh 13.5-inch display by default. The resizing is clearly a nod to optimising the touch interface for users. We changed the icon sizing to smallest the system allows us to, just because.

Touch Optimised, Simple, Clean

Screenshot 2022 04 22 17.32.25

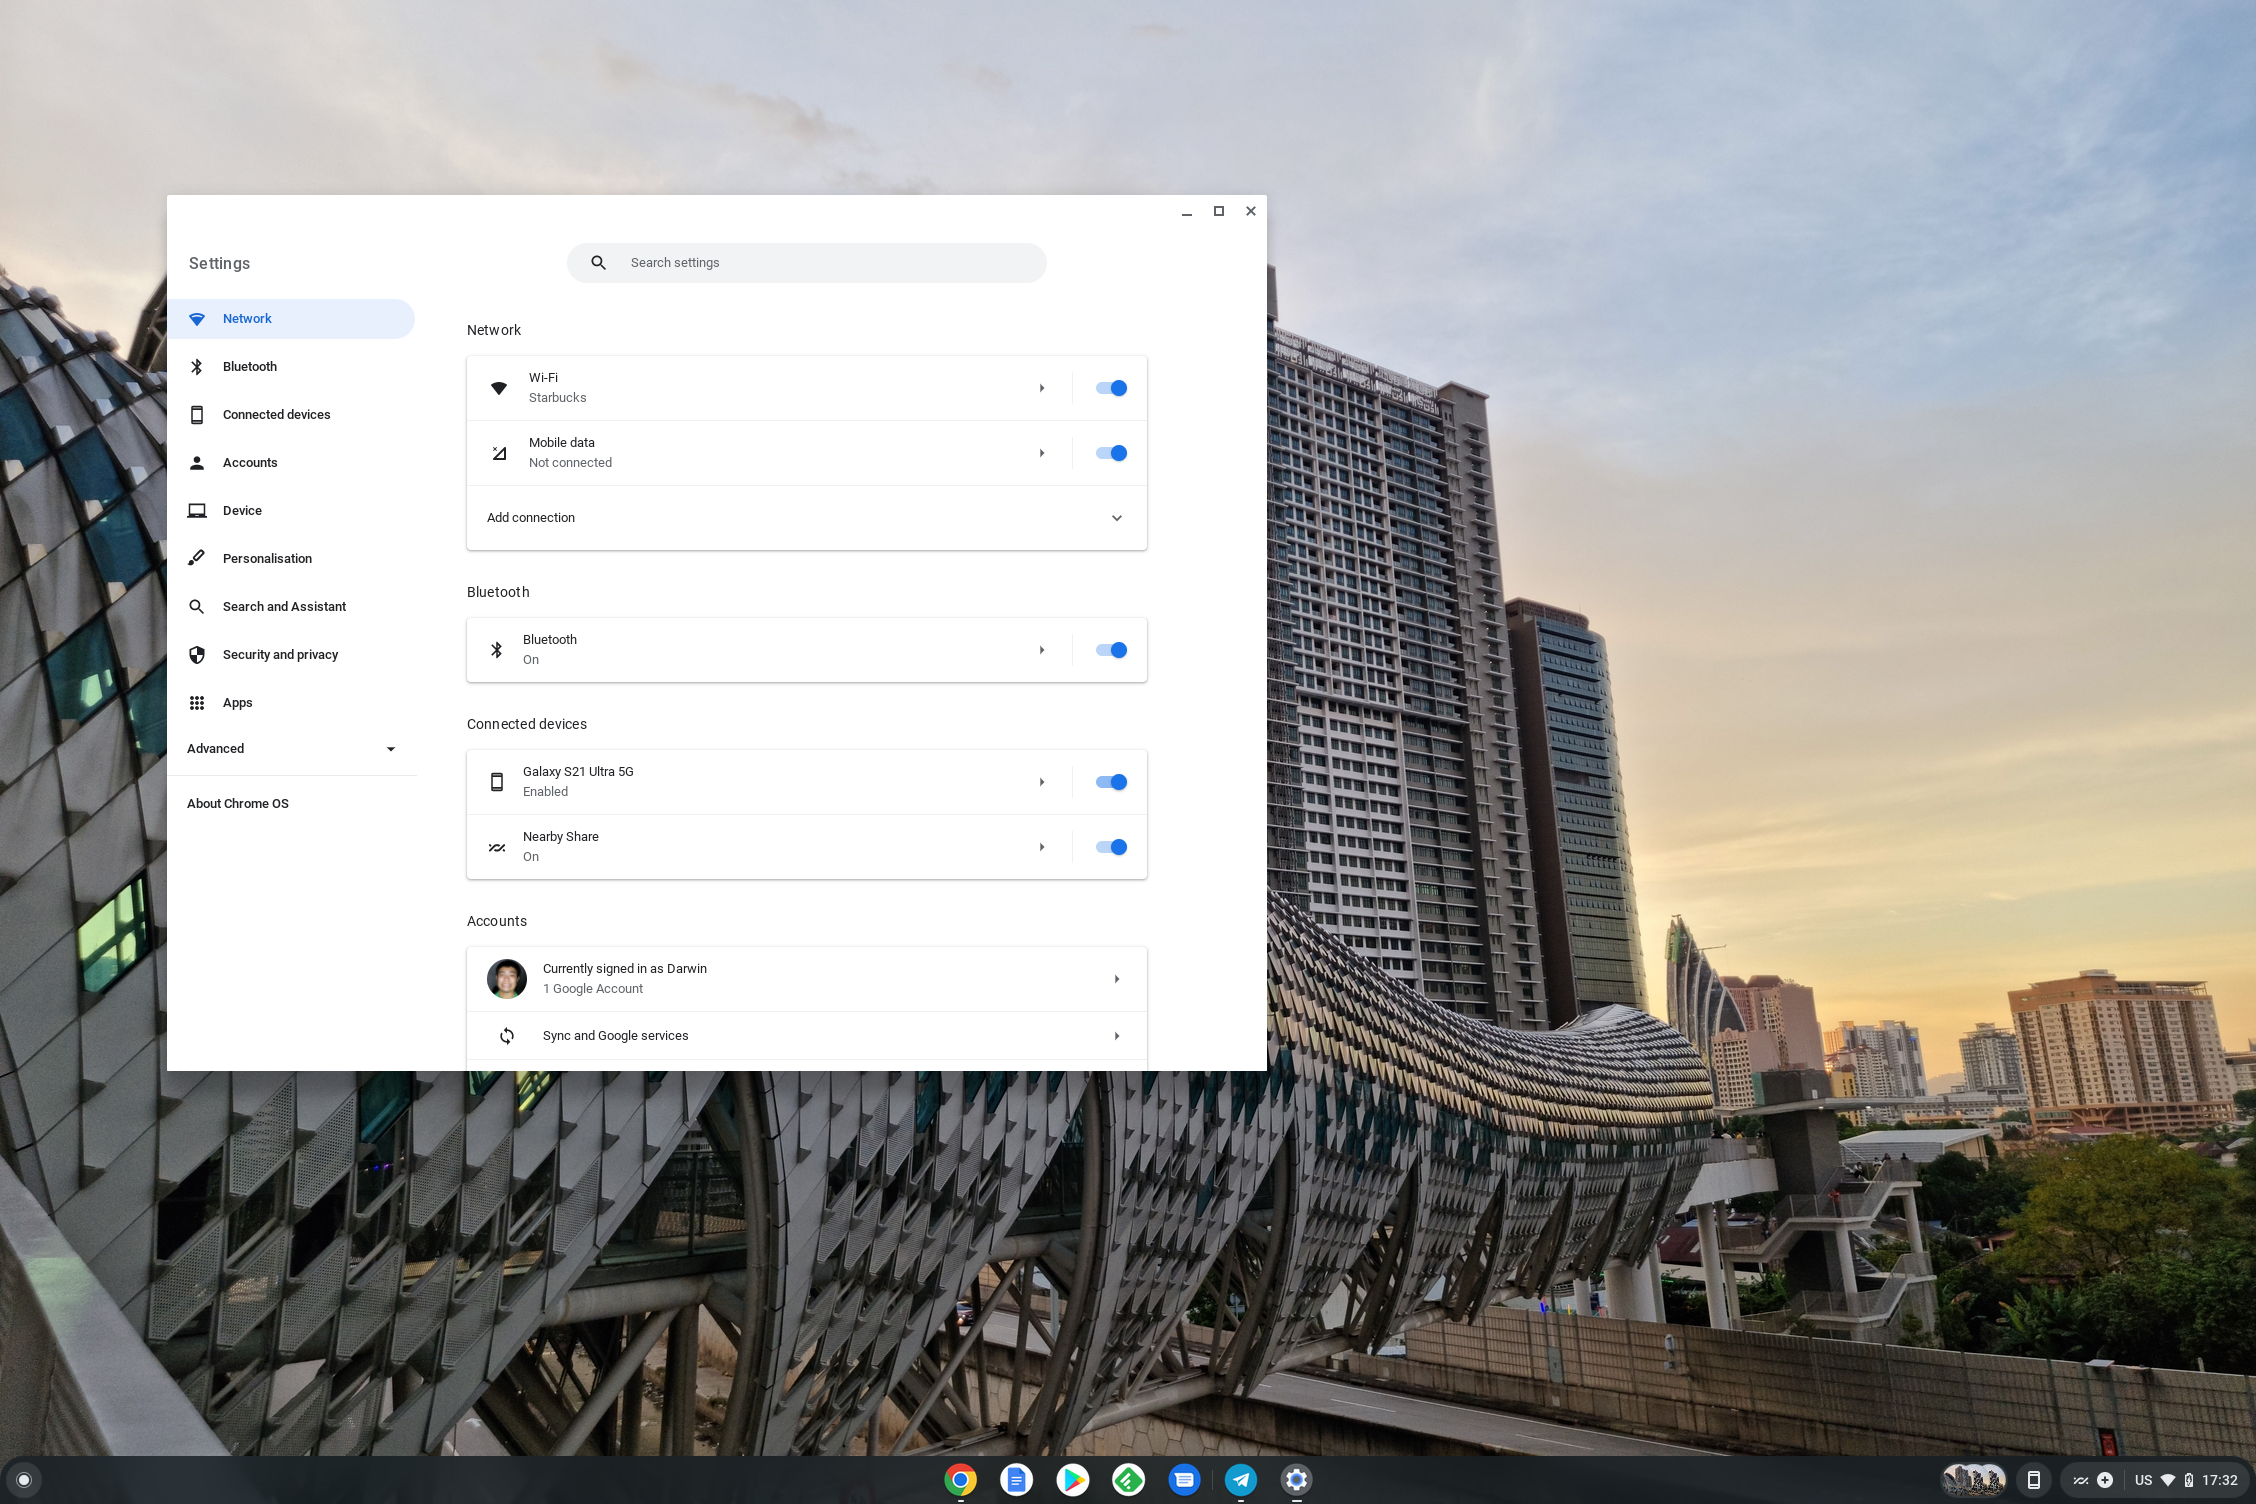
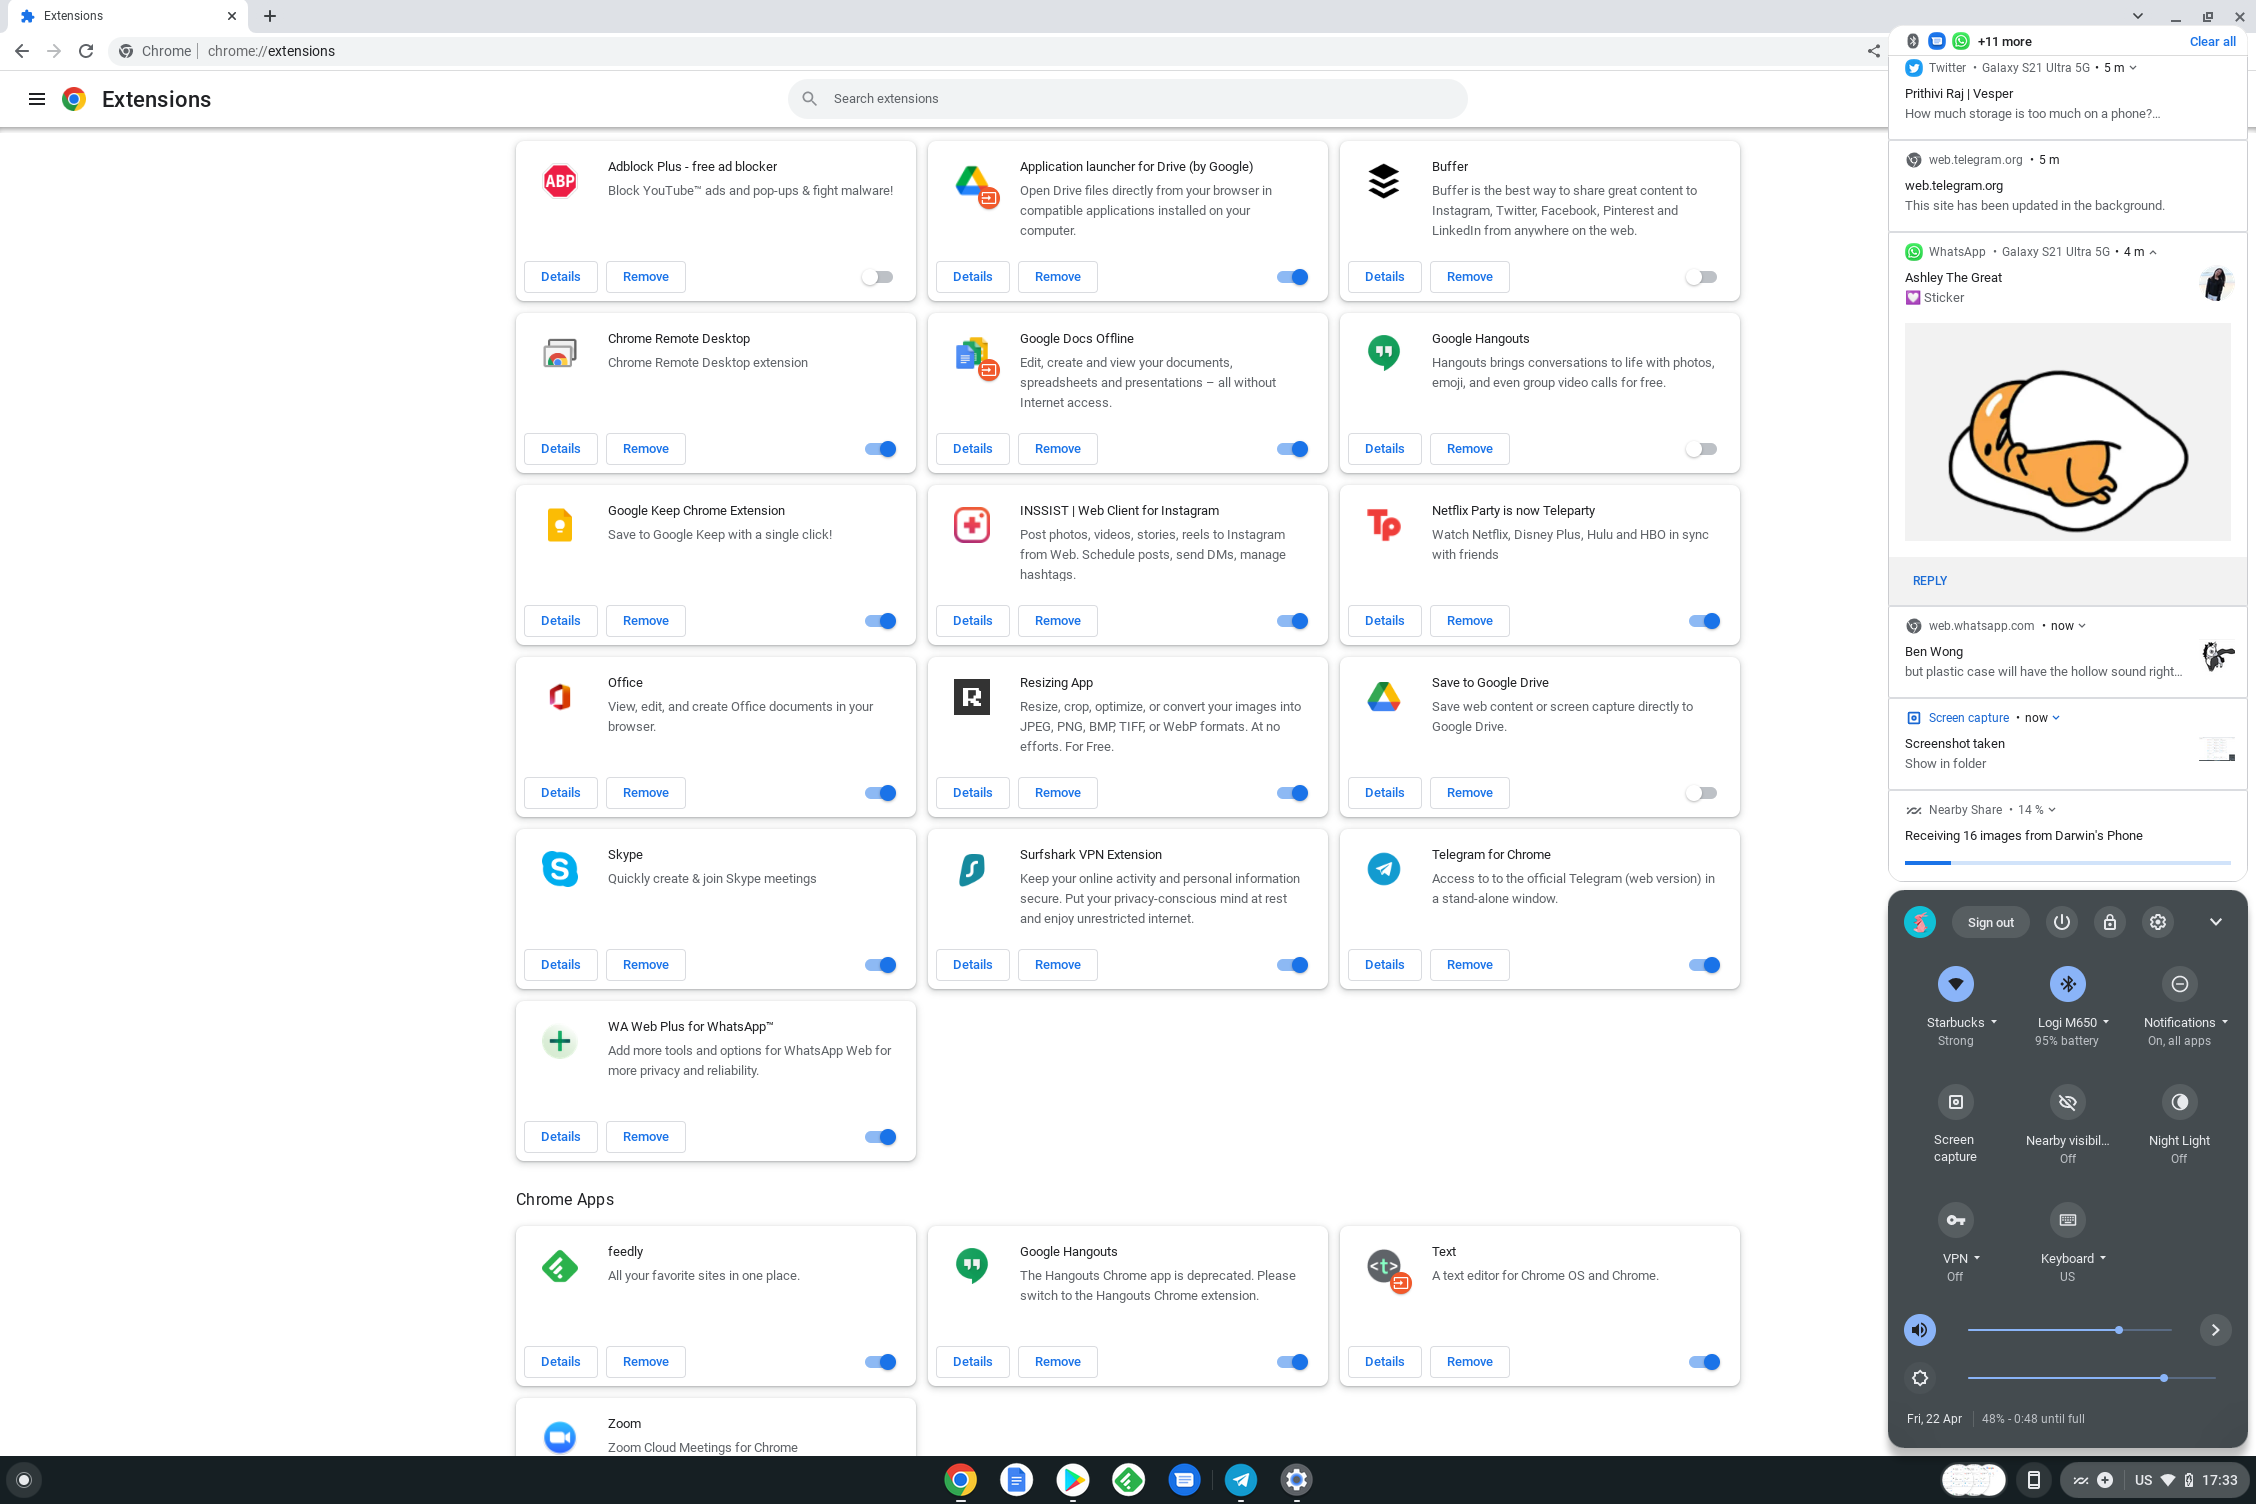
While it is a touch sensitive display, Android gesture controls do not work with Chrome OS, at least not when you are in laptop mode anyway. I must remind myself that I am not using an Android tablet here, just plain ol’ Chrome OS with no overlays. At the same time, you are going to get the same Chrome OS from any Chromebooks you pick up off the shelf. You get different specifications, sure, but they are essentially still the same interface with no extra bloatware.

Apps Matters

Screenshot 2022 04 22 17.35.08

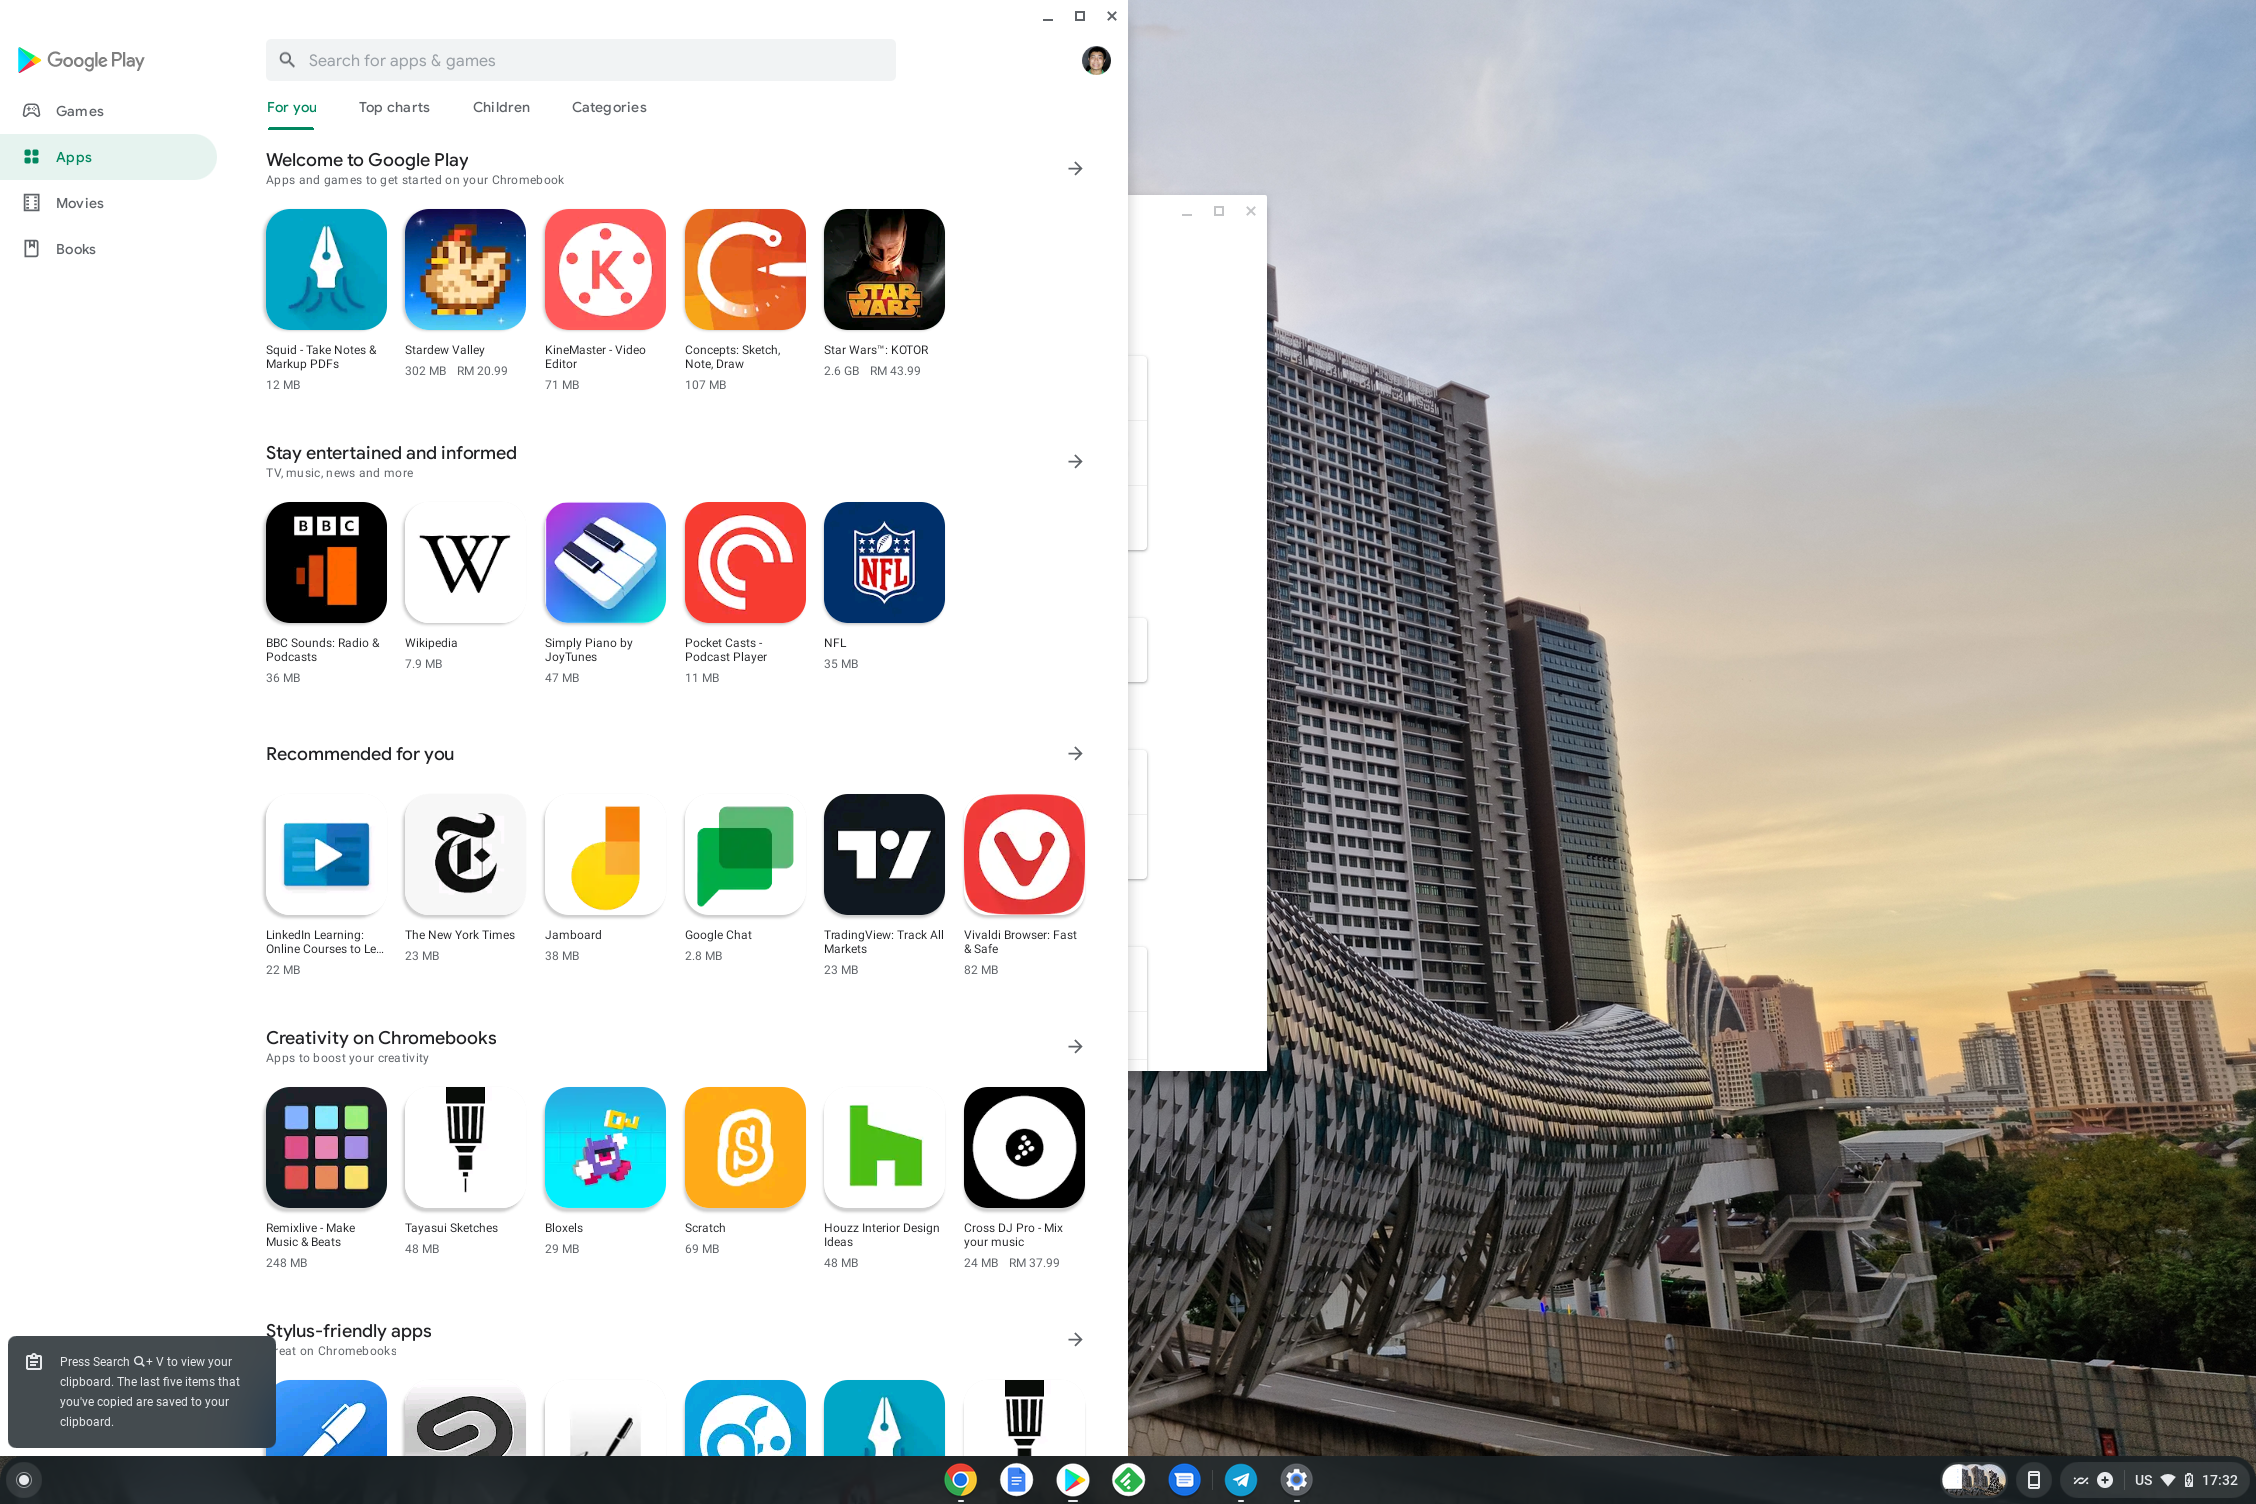
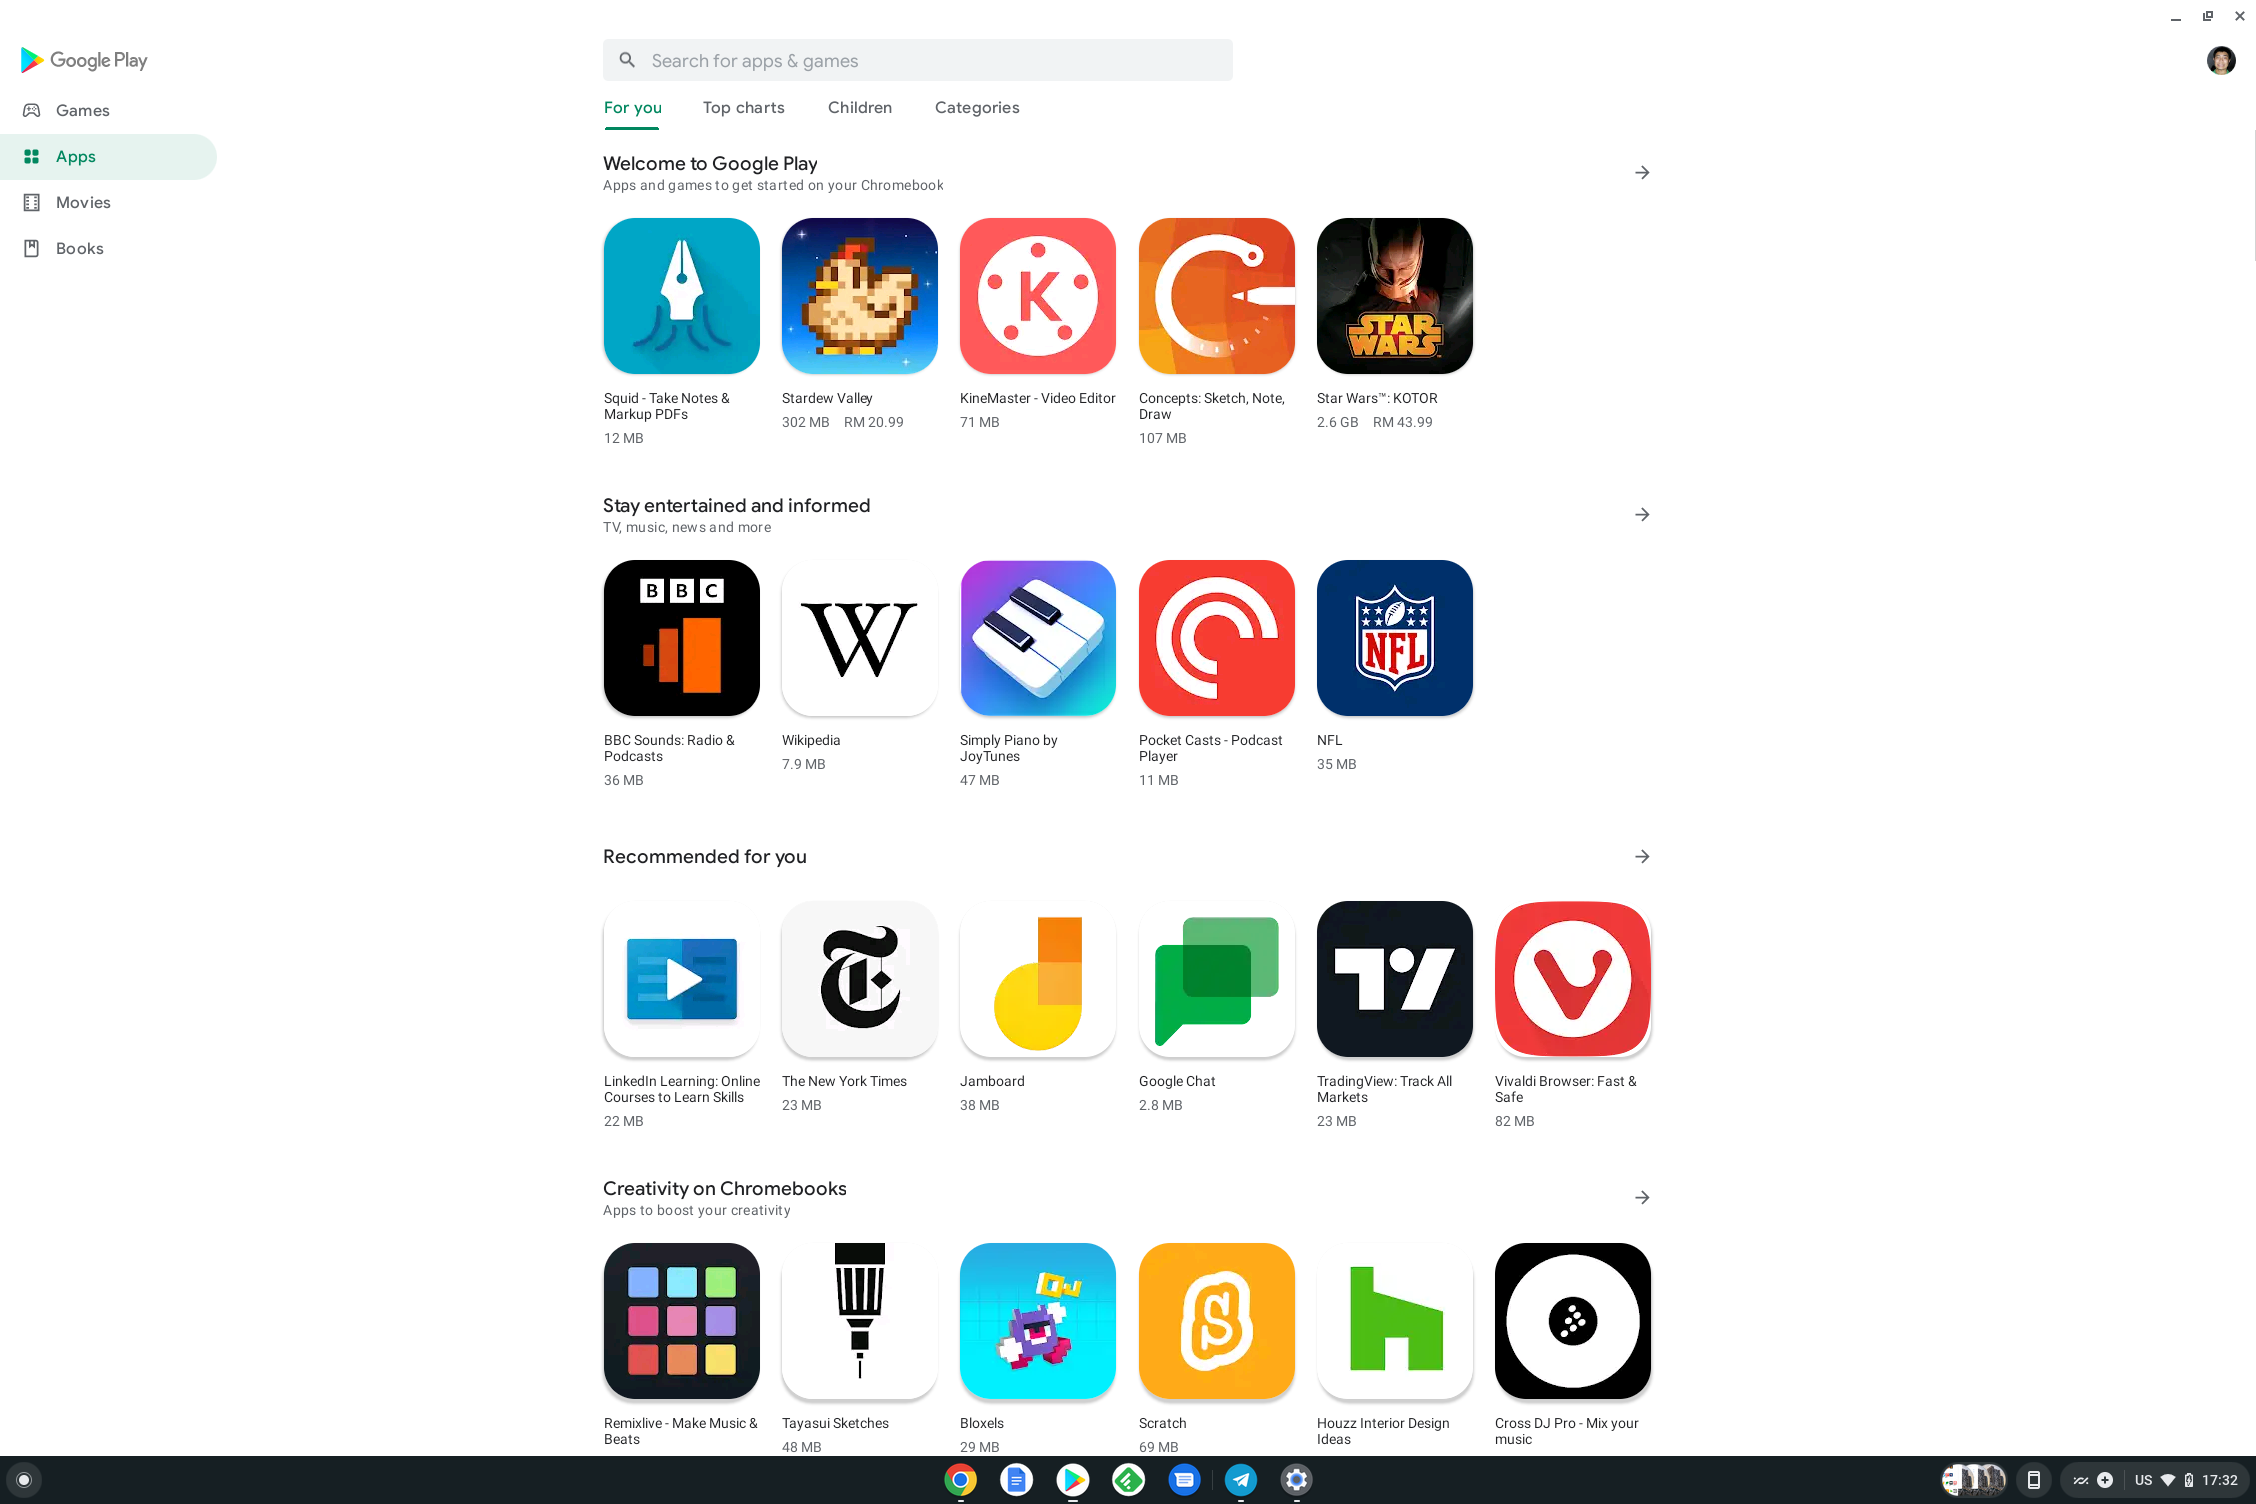
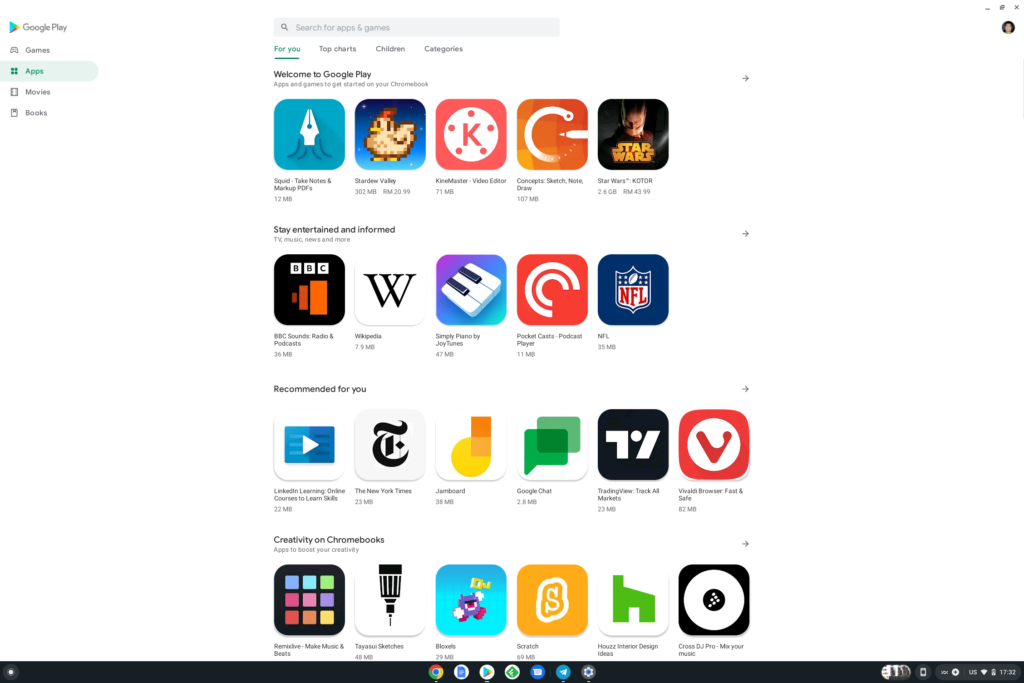
We were excited to look through Google Play Store for app downloads and were not too disappointed with it. Most apps made for the smartphone and tablet works. Some of them even allows you to pick between a smartphone or tablet interface, and even change the window size on the fly. The Chrome OS allows you to fully multitask in differently sized windows with the help of a mouse and keyboard.

Like Android, But Unlike Android

Screenshot 2022 04 22 17.32.43

Very much like Android tablets, not all the apps that is made for the smartphone works or is available to download. Not all the Android apps that is available for the Chrome OS works flawlessly too, sadly.

The Chrome OS is naturally always on standby. That also means that, by default at least, you only need to unfold your Chromebook and Chrome OS is ready for you instantly.

While there is no special arrangement for the keyboard, there are a few subtle differences between the keyboard on a Chromebook and a Windows laptop. For one, there is no Caps Lock key on the Chrome OS. In its place is a large ‘start’ button to launch the ‘shelf’. There are no function row keys (F1-F12) to be found on the Chromebook either, you hardly ever need them anyway.

Chrome on Chrome OS

Screenshot 2022 04 22 17.33.05

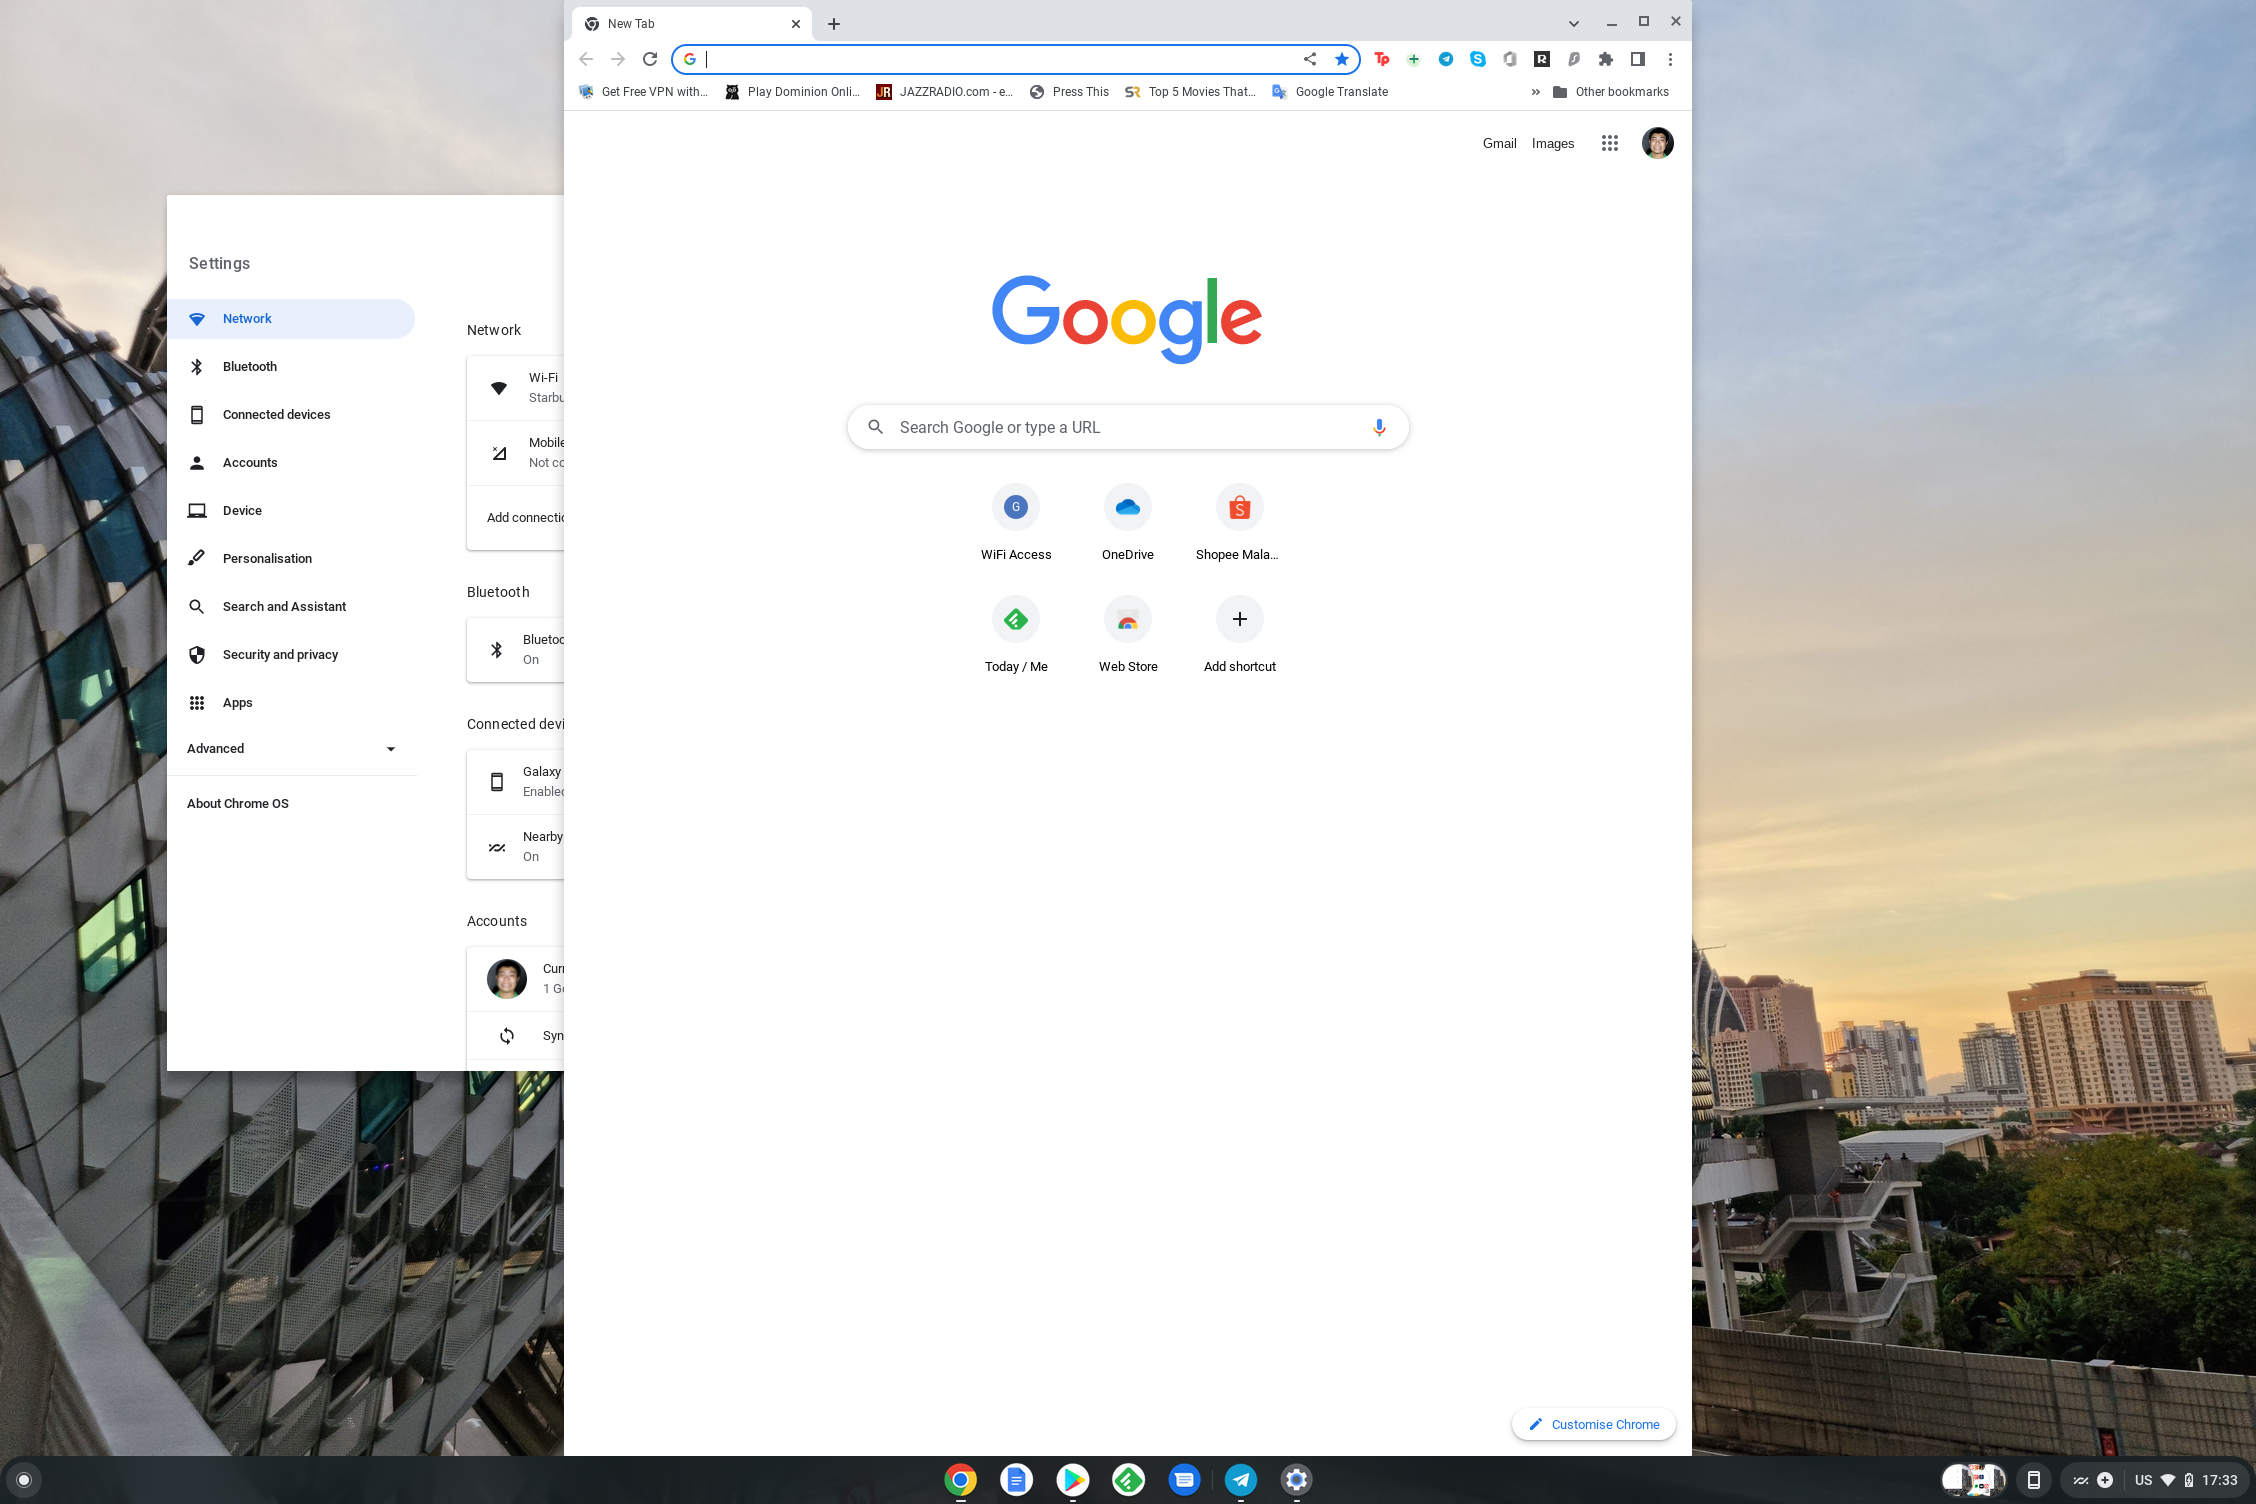
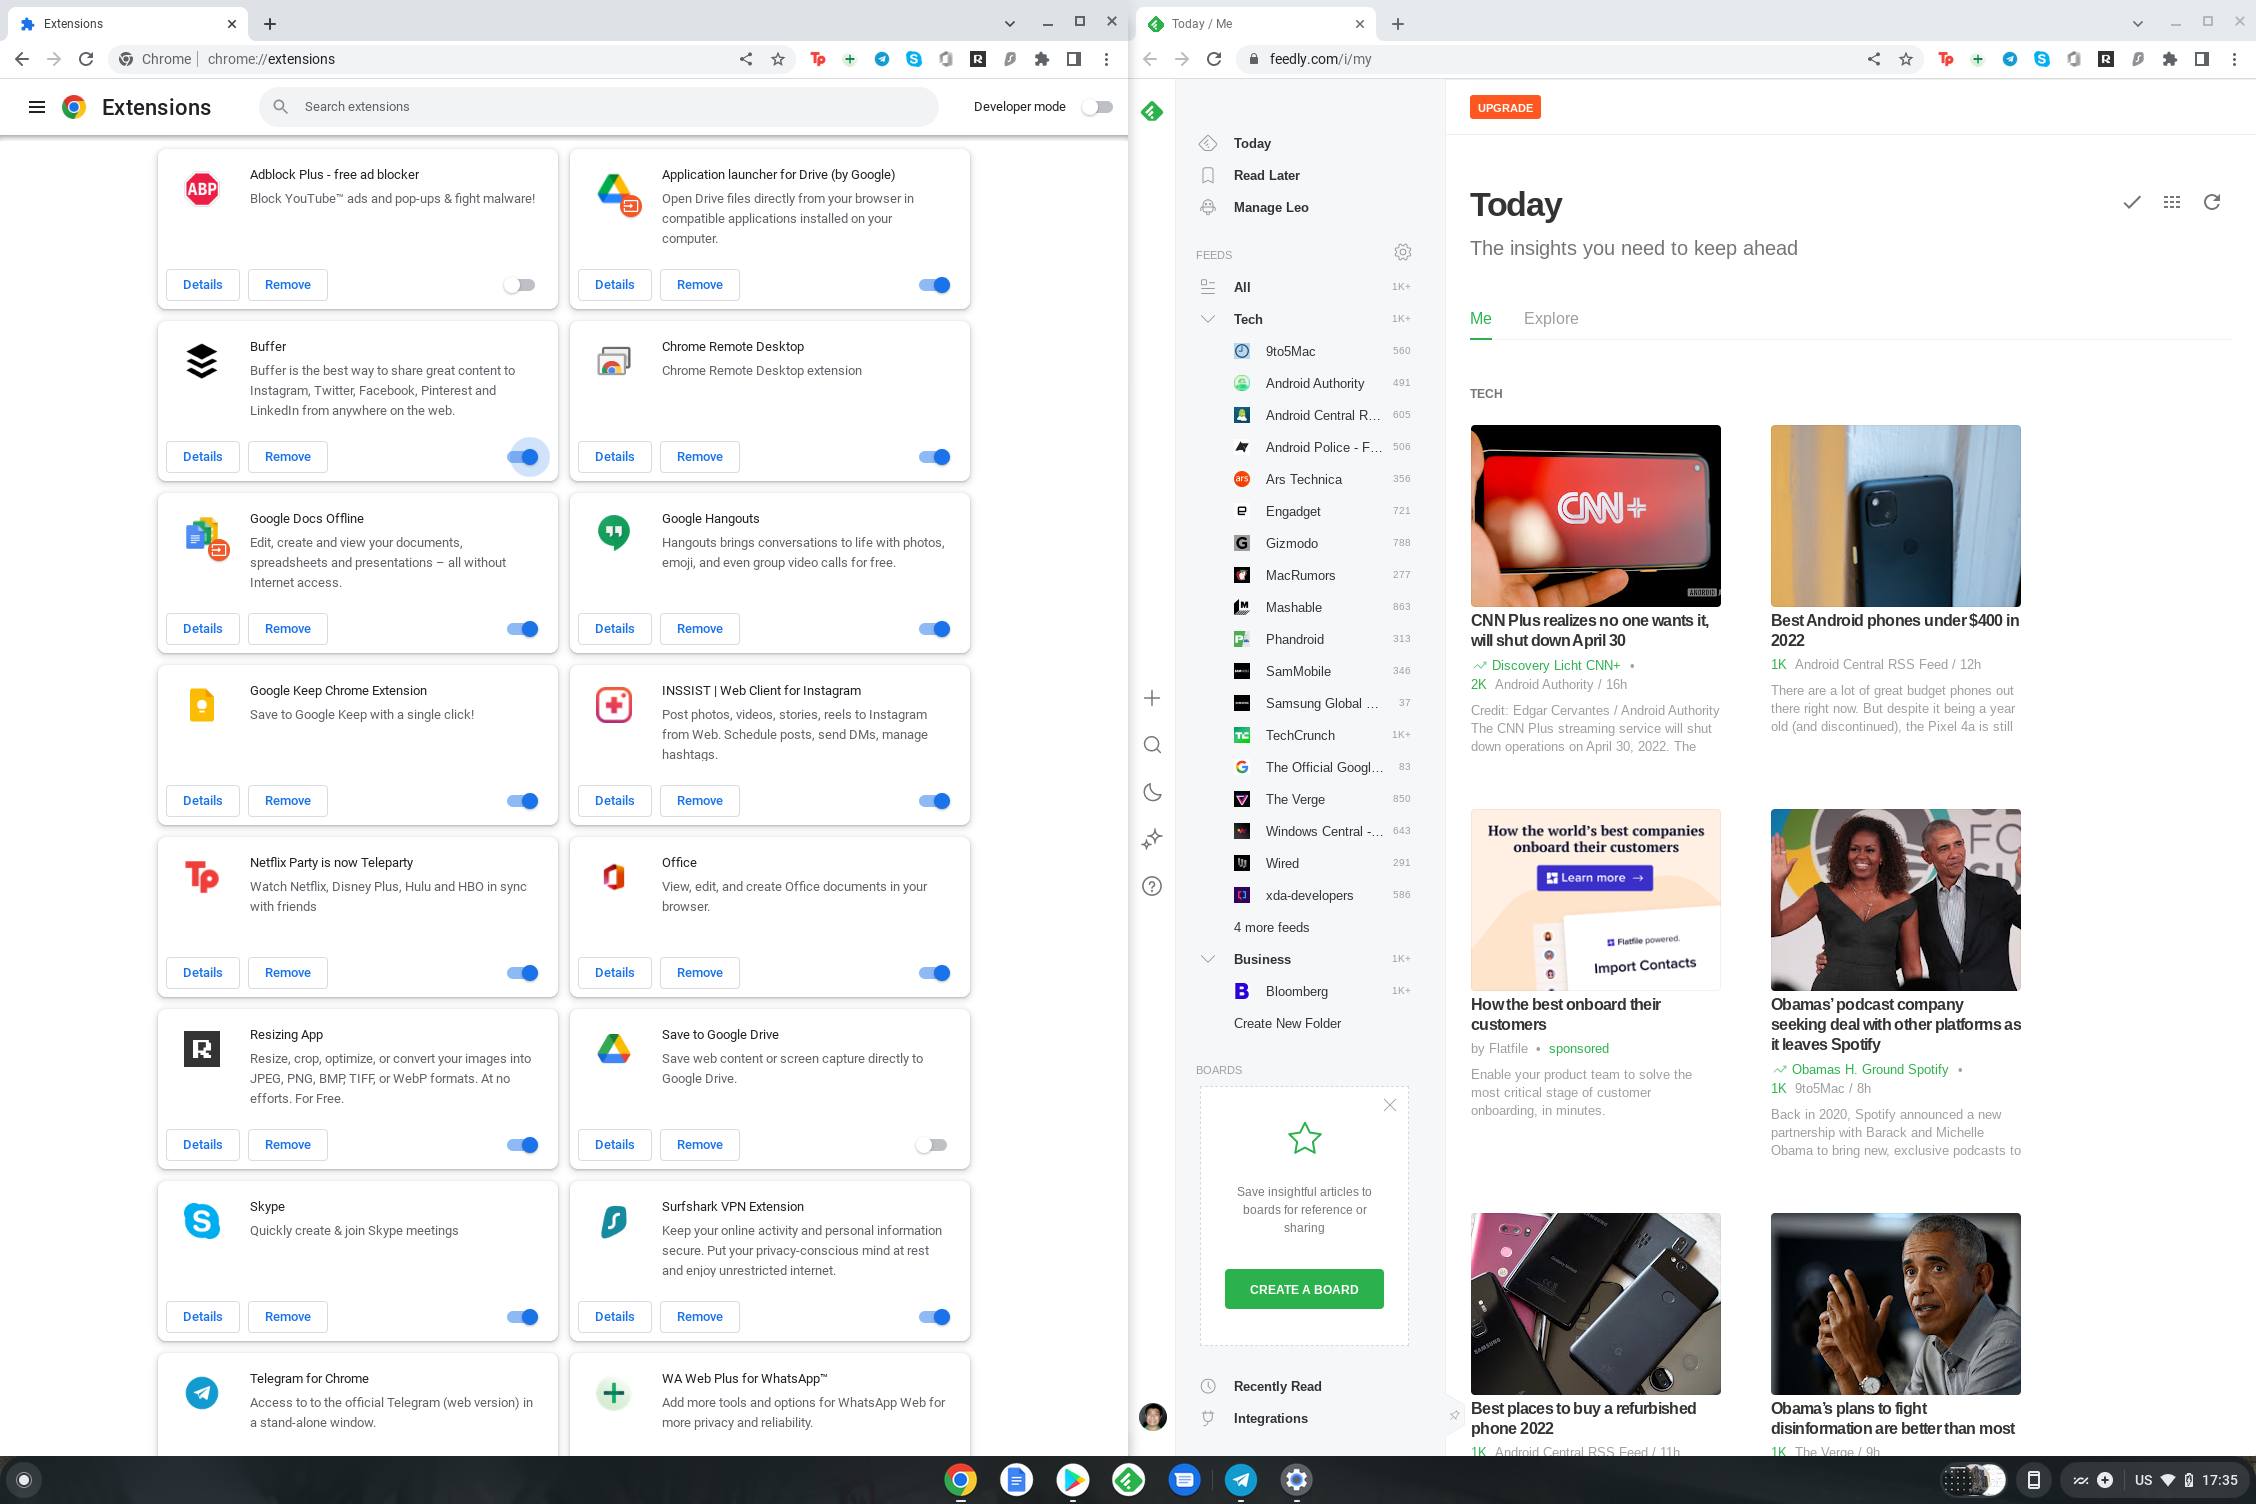
Plenty of the apps you may not find on the Google Play Store on the Chromebook can be used on the browser. Obviously, the apps need to have the browser variants of their apps to work. Some of the ‘apps’ on your Chromebook will still lead you to the webpage. Apps like YouTube, for example, can only be used on the web. We will talk about working with Microsoft 365 a bit more in the coming weeks.

This effectively means that two sorts of app store are at your disposal. You have the Google Play Store, which we have already talked about. Then there is the Google Chrome Web Store for you to install plugins on Chrome itself.

More On Part 2

Chromebook713 2

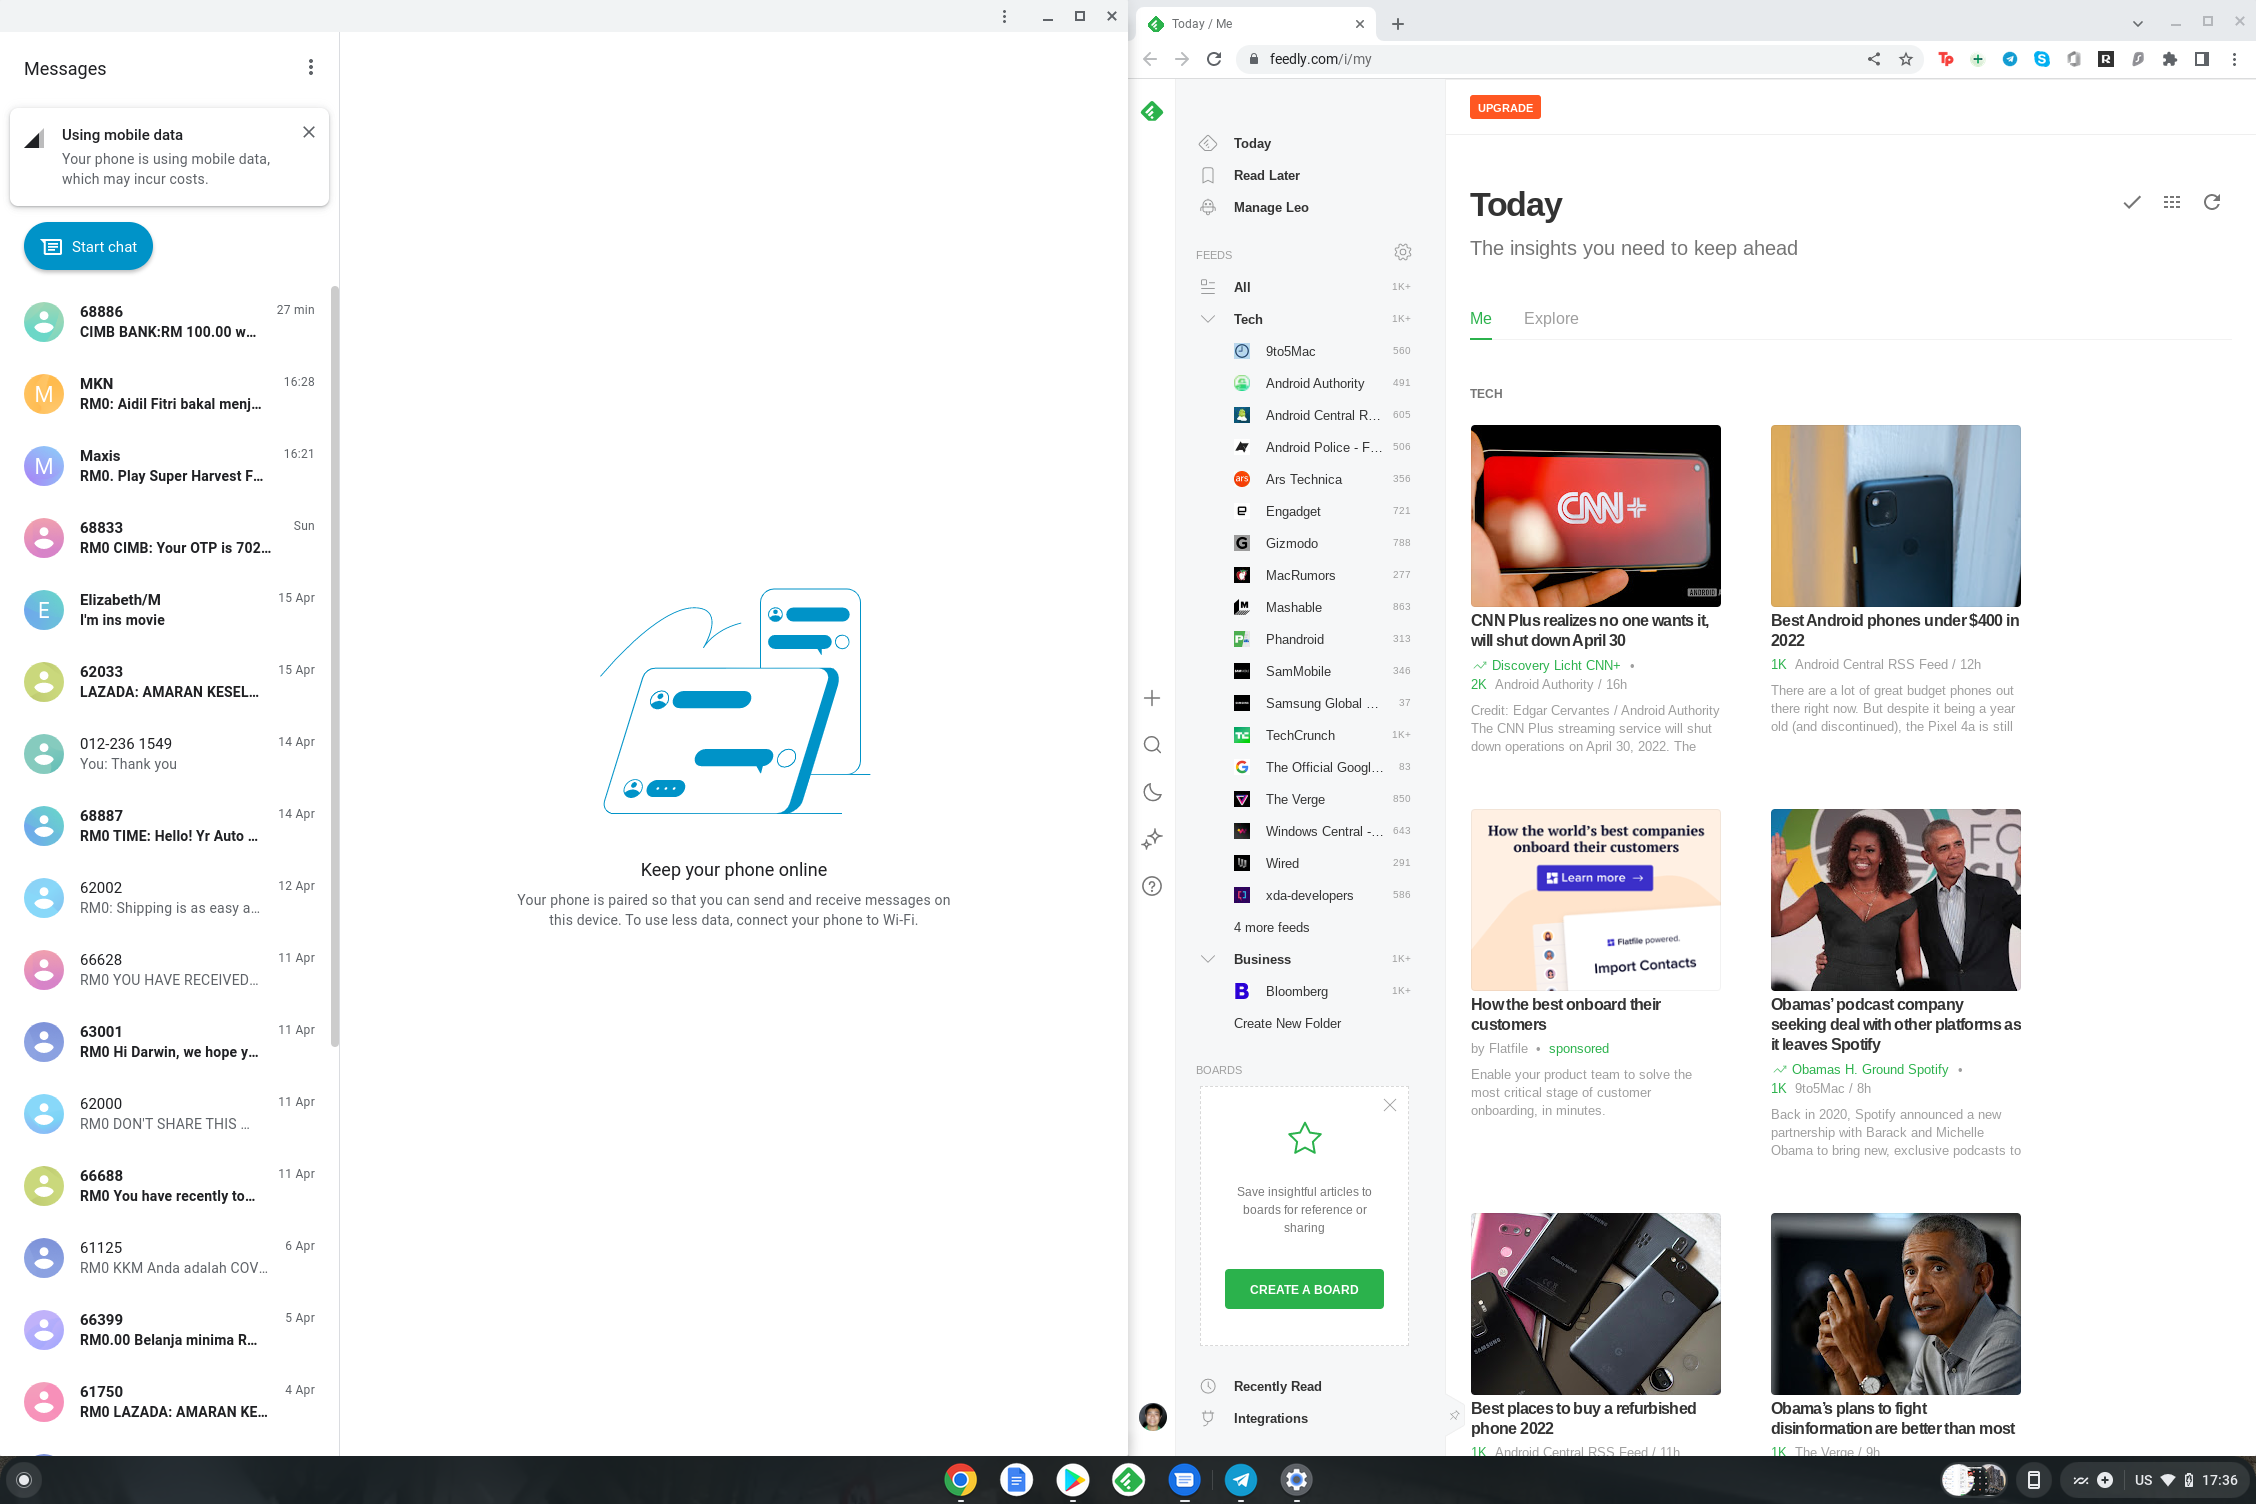
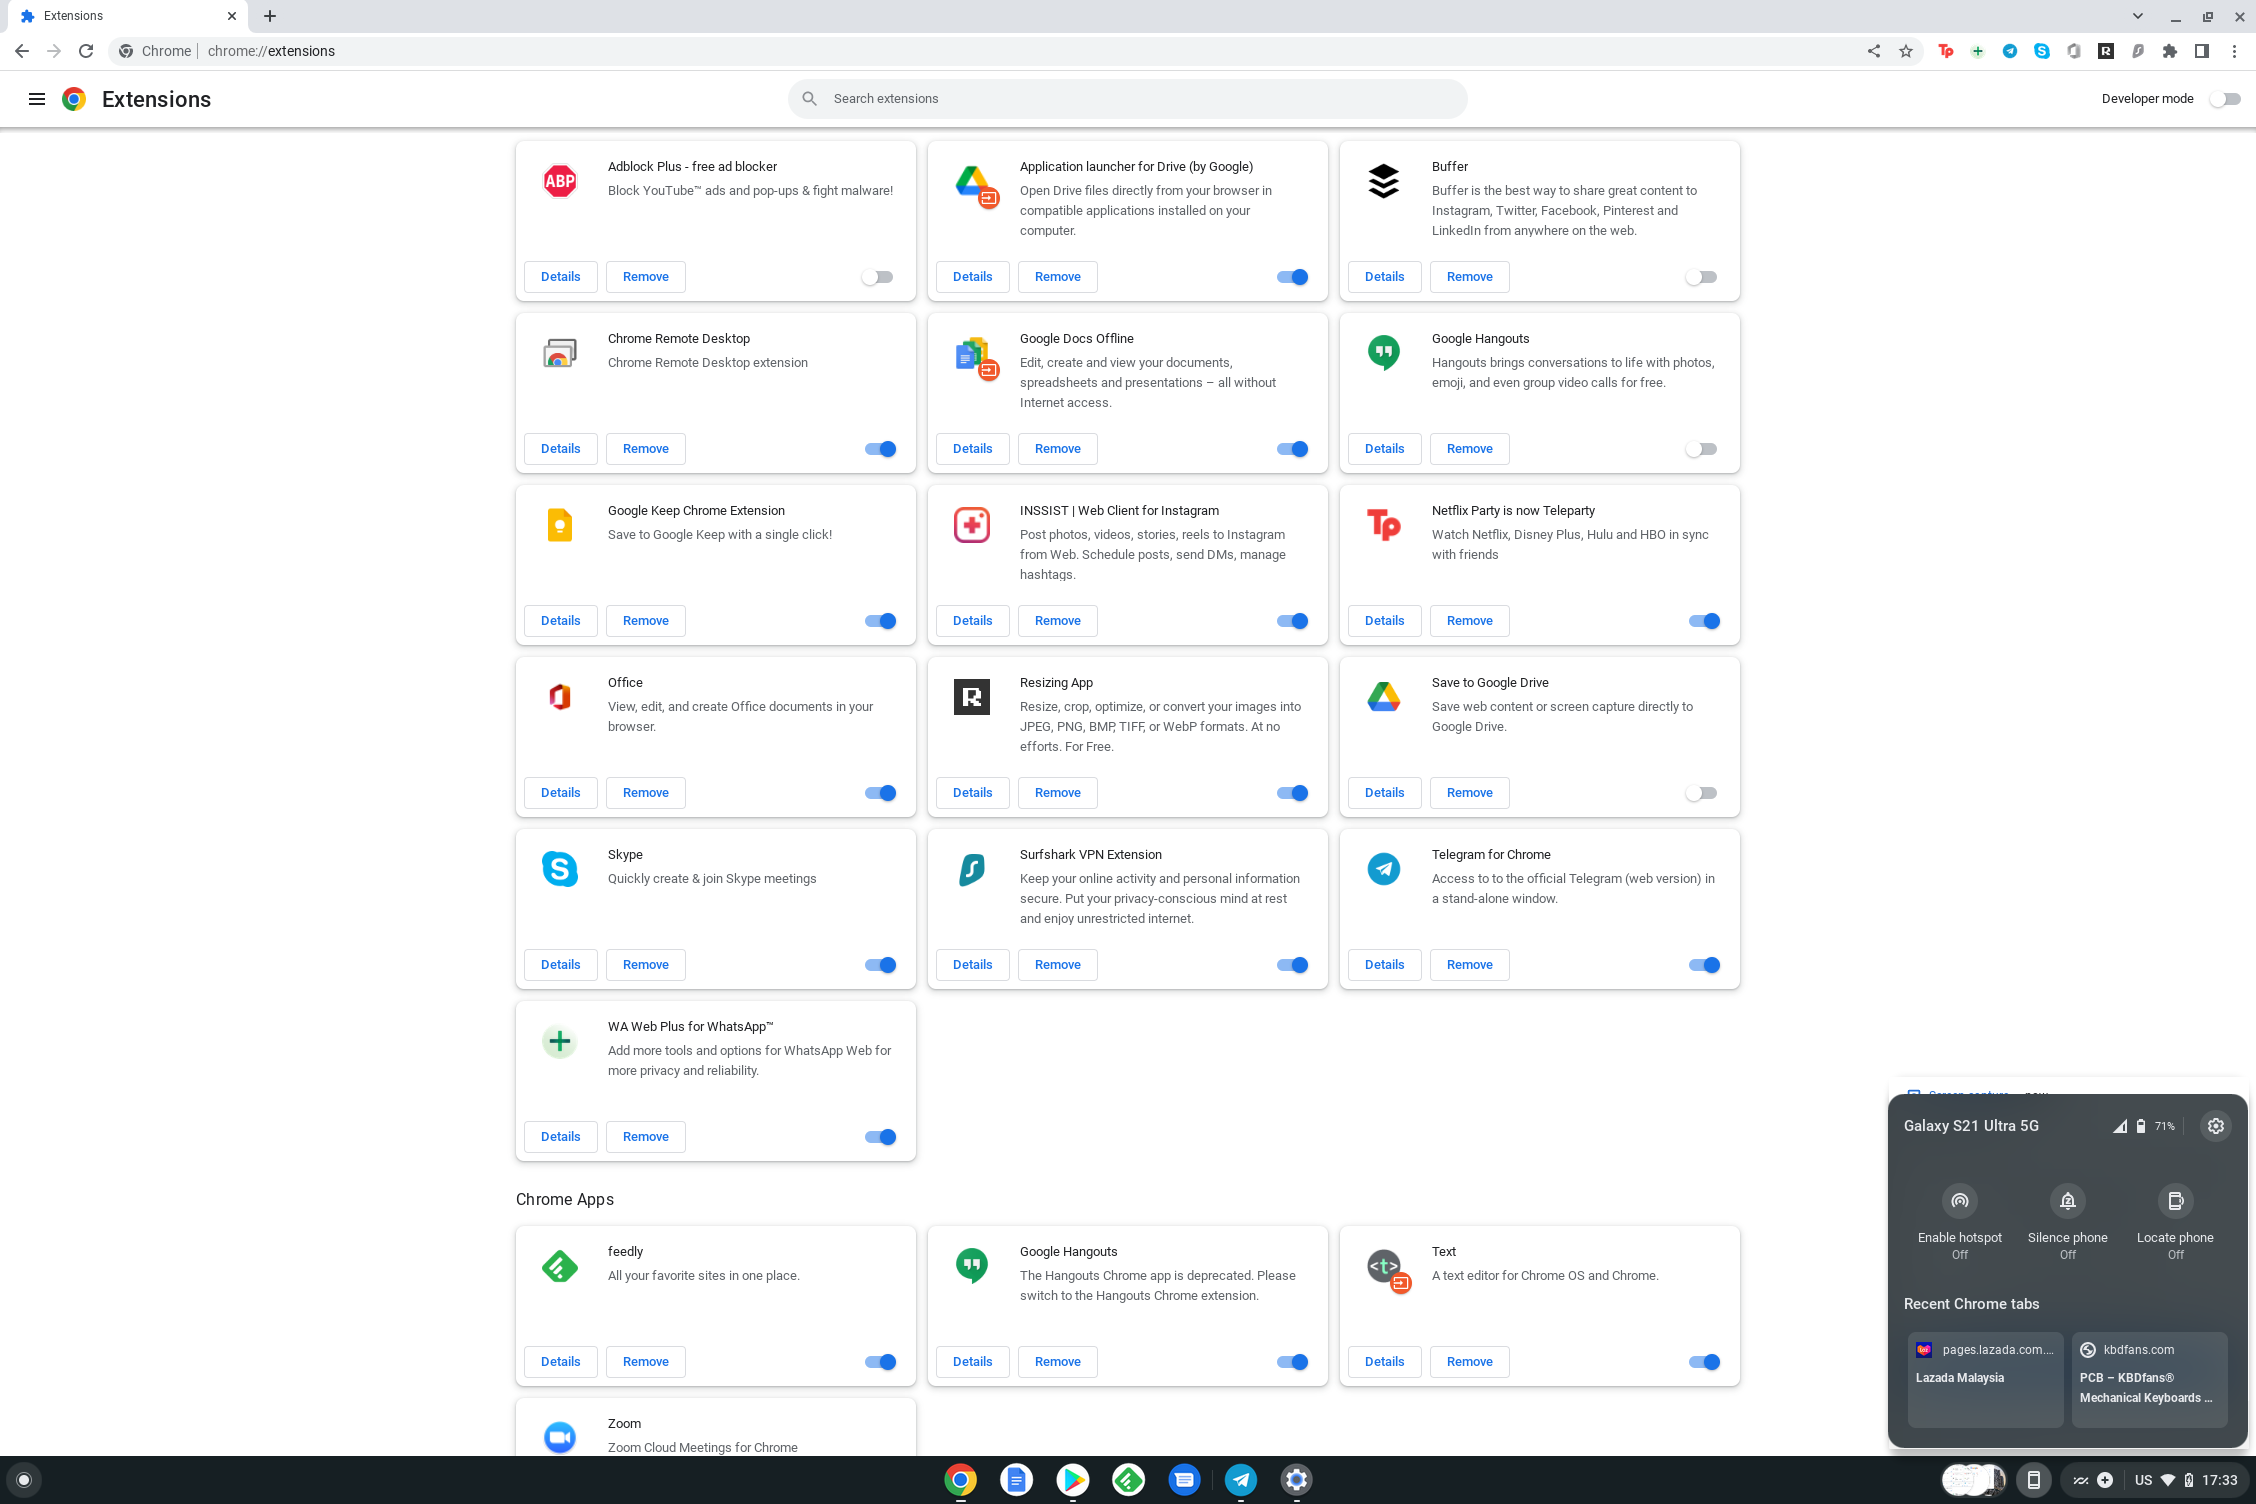
We are also still exploring Chrome OS and still getting to know the system. In the coming parts we will also be talking about updating your Chrome OS and its development support in the future. A lot of things we have covered today are rather on the surface and introductory.

There are still plenty to explore on the Chrome OS. Phone Hub for example, has more to be explored. We have not even started on the stylus experience on the Chromebook.

Getting it up and running was not just simple, it was quick. We did not install everything we wanted nor did a deep search of what we wanted to install on the device, but there is plenty on offer with the device. We think that the plugins on Chrome browser could be a lot of help in making the Chromebook feels like a regular working PC. Gaming is one thing we look forward to talk about in the coming weeks.

Do comment below if there is anything specific that you want to find out about the Chromebook. Of course, comment if there is anything you would like us to do or try on the Chromebook. We will do our best to accommodate and try out everything you recommend and suggest to us.

New Touch ‘n Go Card Will Link to your eWallet with a Touch!

The Touch ‘n Go eWallet has become one of the most ubiquitous eWallets in Malaysia right now. Nearly everyone has the app on their phone and an increasing number of merchants and outlets are accepting the eWallet as a means of payment. That said, even with its increasing number of functions, the eWallet has had a huge handicap when it comes to Touch ‘n Go’s cards. Today’s announcement makes that a thing of the past.

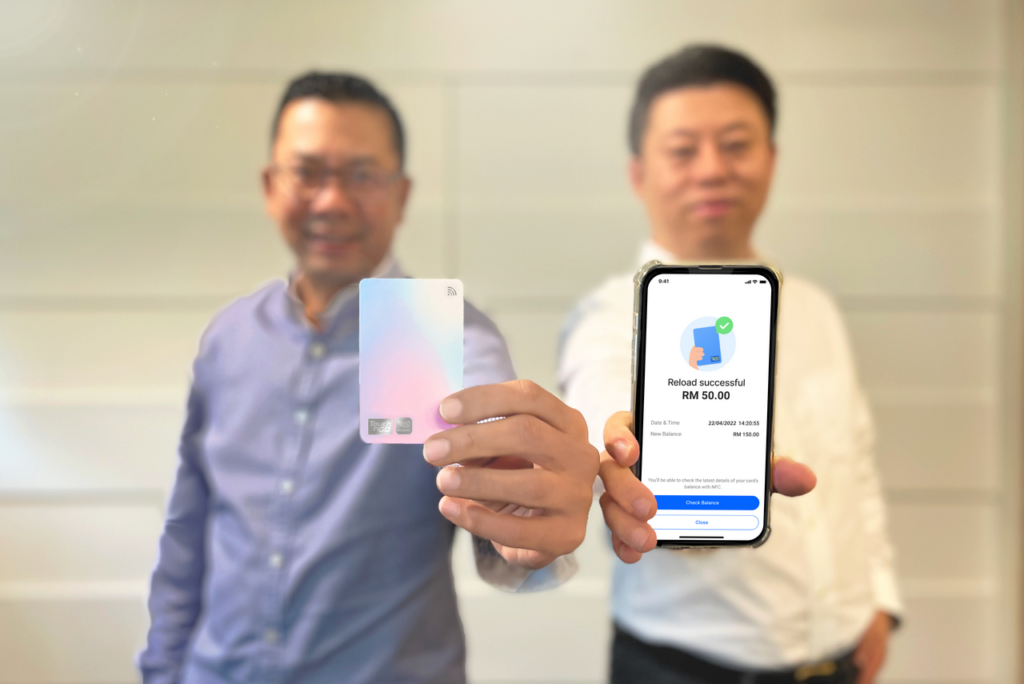
Yeah, you’ve probably already guessed it and let out an elated squeal. Touch N’ Go group has officially announced a new card that links up to the eWallet in every way! You’ll be able to top up and manage your credit on the card directly on the eWallet. No need to go top-up from a Touch N’ Go kiosk and no surcharges! Just take out your smartphone and top up via the eWallet. It can even be used for all existing Touch ‘N Go card functionality.

Touch n Go eWallet Card

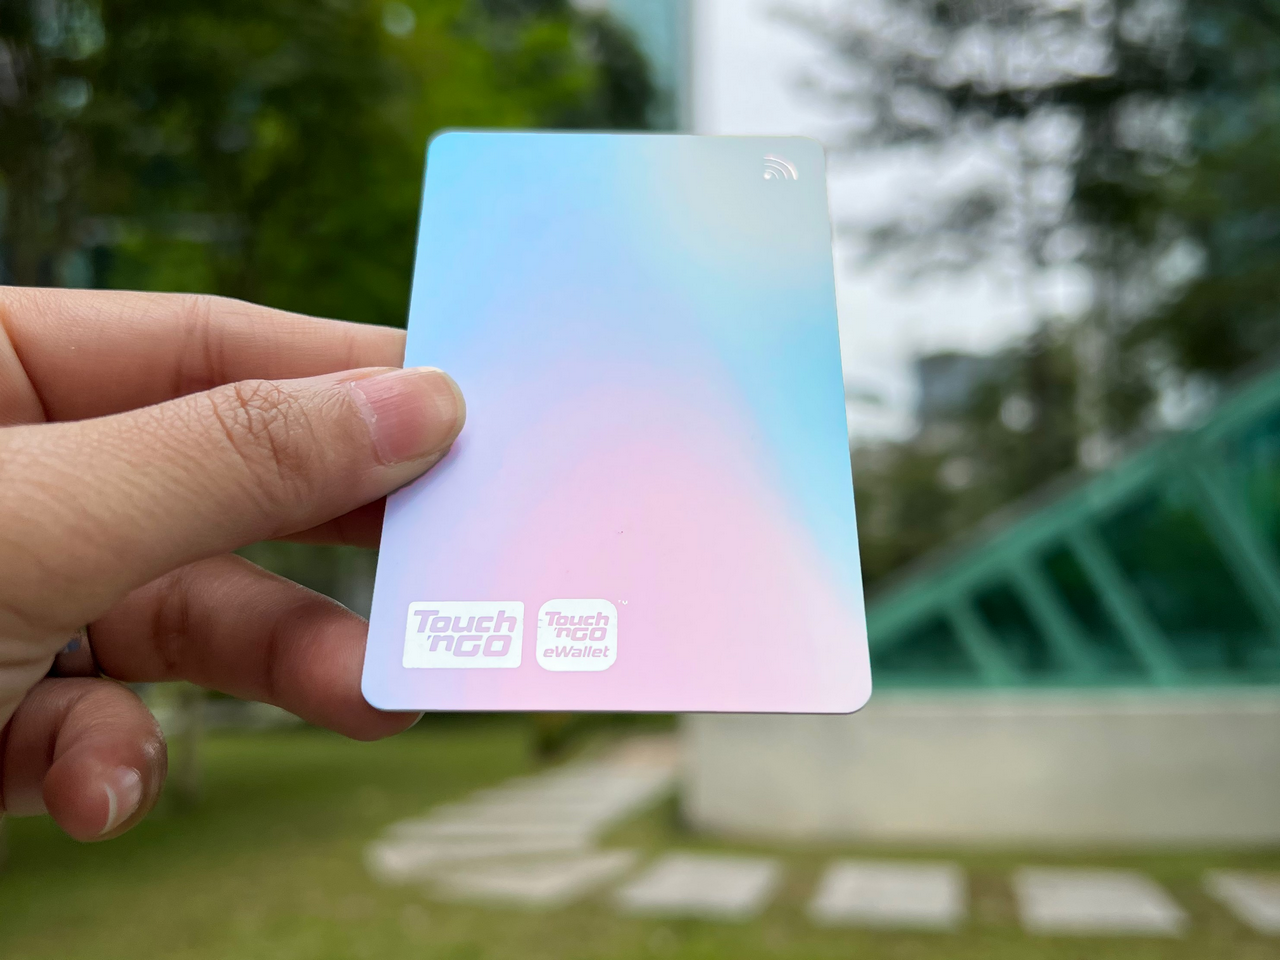
The new card comes in a minimalist, pastel pink and pastel blue gradient design and is available for RM10. You can get the new card at one of Touch ‘N Go’s selected retail partners across Malaysia or simply order one on the eWallet. Once you have your new card, you’ll just have to link it to your eWallet via NFC. – Yes, the NFC functionality works on both Android and iOS devices. – You’ll be able to have five Touch ‘n Go cards linked to your eWallet. Linking is as simple as touching the card to your phone’s NFC sensor and it’ll be automatically added to your eWallet.

Touch ‘N Go anticipates that there may be a shortage of the new cards as demand for them is high. This is exacerbated by the global chip shortage. However, you will still be able to register your interest for the card on the Touch ‘n Go eWallet. When you do, you will get a notification when the card is in stock again.

Users can transfer balances from their existing cards into the new card by requesting a refund on the Touch ‘N Go portal and selecting their eWallet as their preferred method.