Tag Archives: SEM

ChipMOS REPORTS AUGUST 2022 REVENUE

HSINCHU, Sept. 8, 2022  /PRNewswire-FirstCall/ — ChipMOS TECHNOLOGIES INC. (“ChipMOS” or the “Company”) (Taiwan Stock Exchange: 8150 and NASDAQ: IMOS), an industry leading provider of outsourced semiconductor assembly and test services (“OSAT”), today reported its unaudited consolidated revenue for the month of August 2022.  All U.S. dollar figures cited in this press release are based on the exchange rate of NT$30.38 to US$1.00 as of August 31, 2022.

Revenue for the month of August 2022 was NT$1,715.1 million or US$56.5 million, a decrease of 12.0% compared to July 2022 and a decrease of 28.5% compared to August 2021. The Company noted that the sequential and year over year declines in its August revenue are consistent with the near-term demand and inventory adjustments impacting the broader semiconductor industry.

Consolidated Monthly Revenues (Unaudited)

August 2022

July 2022

August 2021

MoM Change

YoY Change

Revenues

(NT$ million)

1,715.1

1,948.0

2,399.3

-12.0 %

-28.5 %

Revenues

(US$ million)

56.5

64.1

79.0

-12.0 %

-28.5 %

About ChipMOS TECHNOLOGIES INC.:

ChipMOS TECHNOLOGIES INC. (“ChipMOS” or the “Company”) (Taiwan Stock Exchange: 8150 and NASDAQ: IMOS) (www.chipmos.com) is an industry leading provider of outsourced semiconductor assembly and test services. With advanced facilities in Hsinchu Science Park, Hsinchu Industrial Park and Southern Taiwan Science Park in Taiwan, ChipMOS is known for its track record of excellence and history of innovation. The Company provides end-to-end assembly and test services to leading fabless semiconductor companies, integrated device manufacturers and independent semiconductor foundries serving virtually all end markets worldwide.

Forward-Looking Statements

This press release may contain certain forward-looking statements. These forward-looking statements may be identified by words such as ‘believes,’ ‘expects,’ ‘anticipates,’ ‘projects,’ ‘intends,’ ‘should,’ ‘seeks,’ ‘estimates,’ ‘future’ or similar expressions or by discussion of, among other things, strategies, goals, plans or intentions. These statements may include financial projections and estimates and their underlying assumptions, statements regarding plans, objectives and expectations with respect to future operations, products and services, and statements regarding future performance. Actual results may differ materially in the future from those reflected in forward-looking statements contained in this document, due to various factors. Further information regarding these risks, uncertainties and other factors are included in the Company’s most recent Annual Report on Form 20-F filed with the U.S. Securities and Exchange Commission (the “SEC”) and in the Company’s other filings with the SEC.

Contacts:

In Taiwan

Jesse Huang

ChipMOS TECHNOLOGIES INC.

+886-6-5052388 ext. 7715

IR@chipmos.com

In the U.S.

David Pasquale

Global IR Partners

+1-914-337-8801

dpasquale@globalirpartners.com

Cision View original content:https://www.prnewswire.com/news-releases/chipmos-reports-august-2022-revenue-301619998.html

Source: ChipMOS TECHNOLOGIES INC.

Arasan refreshes its Total USB IP Solution with its next generation of USB 2.0 PHY IP

Arasan, a leading provider of semiconductor IP for all things mobile, including automobiles announces its 2’nd generation of USB PHY with an extremely small area.

SAN JOSE, Calif., Aug. 11, 2022 /PRNewswire/ — Arasan announces the immediate availability of its 2nd generation of USB PHY for the USB 2.0 Specification. Arasan 2nd generation USB PHY is a result of its continual evolution over decades, resulting in this generation with ultra-low area and power specifically targeting IoT and Mobile Devices. Highest Priority has been paid to area optimization with the goal to offer the industries smallest USB 2.0 PHY. The USB 2.0 PHY was originally acquired by Arasan from Mentor Graphics as part of our corporate objective to offer a Total IP™ solution across our entire product line, including USB. 

Arasan is among the industry’s first providers of USB IP with the launch of its USB 1.1 Device IP in 1996 and the industries ONLY provider to offer a Total USB 2.0 IP Solution which includes its USB 2.0 Host IP Core, USB 2.0 Device IP Core, USB 2.0 Hub IP, USB 2.0 OTG IP, the USB 2.0 PHY IP and software for multiple OS. Arasan’s USB 2.0 PHY also supports all the additional features required by the USB 2.0 Hub Specifications and is seamlessly integrated with its USB controller IP, including the USB 2.0 Hub IP. 

Over decades, Arasan’s USB IP has been used in a varied range of applications including the defense sector on mission critical projects. 

Arasan’s 2nd Gen USB 2.0 IP is available on nodes 28nm to 5nm immediately. The legacy USB 2.0 PHY is available from 180nm to 40nm on multiple foundries.  

Arasan’s USB 2.0 PHY is also offered as a crystal-less PHY saving on the BoM. 

For more: https://www.arasan.com/products/usb/usb-2-0/usb-2-0-phy/ 

About Arasan 

Arasan is at the forefront of this evolution of “Mobile” with its standards-based IP at the heart of Mobile SoCs. Arasan’s high-quality, silicon-proven, Total IP Solutions include digital IP, AMS PHY IP, Verification IP, HDK, and Software. Arasan has a focused product portfolio targeting mobile SoCs to Automobiles, Drones, and IoT. Arasan Chip Systems, a contributing member of the MIPI Association since 2005 for mobile storage and mobile connectivity interfaces with over a billion chips shipped with our MIPI IP. 

Contact: 
Dr. Sam Beal 
Mktg1@arasan.com 

Source: Arasan Chip Systems, Inc.

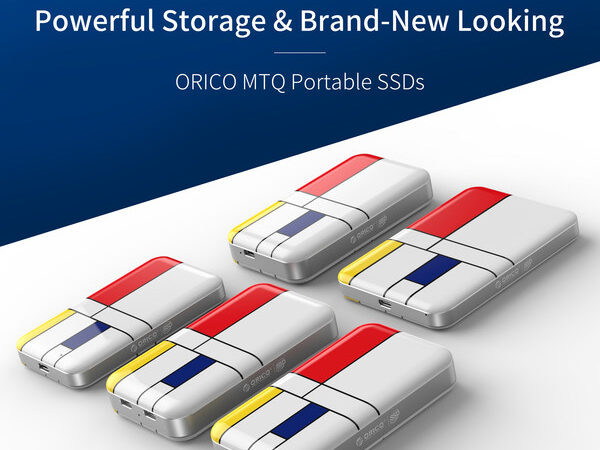
ORICO Launches High-Performing Portable SSD Inspired by Mondrian

The bold design encases an ultra-high performing solid-state drive that can achieve up to a 3,126MB/s reading speed

SHENZHEN, China, July 26, 2022 /PRNewswire/ — ORICOShenzhen-based innovative enterprise focusing on high-performance solutions for USB data transmission and charging – is proud to unveil the ORICO USB4 High Speed Portable SSD Montage 40Gbps series, with a striking and durable design inspired Dutch painter Piet Mondrian.


The bold and bright aesthetic draws from Mondrian’s famous work Composition with Red, Blue and Yellow, incorporating the thick black lines and blocks of color that immediately distinguish the device from the monochrome alternatives on the market. Loud, but not lurid, the design is applied with the durable in-mold labeling technique also found in automobile manufacturing for its resistance to corrosion.

However, the product engineers at ORICO do not pursue form over function and have invested in the right technology to make the Montage 40Gbps series one of the best-performing SSDs available. During performance testing, the drive achieved 3,126MB/s reading speed, a 2,832MB/s writing speed, and transferred 3GB files in just one second, matching, and even surpassing, many leading products currently on the market.

Accompanied by a versatile 2-in-1 data cable for USB type A and type C connections, the drive is widely compatible and able to be used with Mac OS, Windows, Android, and Linux operating systems without requiring a driver. Depending on user requirements, the Montage series offers capacity options ranging from 512GB to 2TB.

“We are so excited to launch the eye-catching Montage series, serving superior performance and carrying a timeless aesthetic that really transcends style trends,” commented Xu Yeyou, CEO of ORICO. “We had in mind on-the-go creatives, such as photographers and video editors, when designing the product.”

About ORICO

Shenzhen ORICO Technologies Co., Ltd. was established in 2009, and its brand ORICO is an innovative national high-tech enterprise focusing on USB data transmission and USB charging technology.

To learn more about the ORICO SSD Montage 40Gbps Series, click here.

Connect with ORICO

Website | Youtube | Instagram | Twitter | Facebook | LinkedIn | Amazon

Cision View original content to download multimedia:https://www.prnewswire.com/news-releases/orico-launches-high-performing-portable-ssd-inspired-by-mondrian-301592025.html

S2C Shines at DAC 2022 with its New Prodigy Player Pro-7 Prototyping Software, Multi-FPGA Prototype Hardware Platforms, and Complete Prototyping Solutions

Stand-Out Veteran Provider of FPGA Prototyping Solutions

SAN JOSE, Calif., July 23, 2022 /PRNewswire/ — The 59th Design Automation Conference returned to San Francisco’s Moscone Center this year to notch almost six decades of week-long immersion in EDA technology and market trends, combining keynote presentations by industry luminaries with the “DAC Engineering Track” technical presentations and the EDA tool-provider exhibits for in-person exchanges of EDA user-needs and the latest EDA solutions.  Attendance by exhibitors, and EDA tool end-users alike, was noticeably improved from last year’s conference but still below pre-COVID levels.  The Moscone Center neighborhood provided a less than inviting convention venue as San Francisco recovers from COVID’s decimation of the convention-generated commerce around the Center marred by heavily littered streets, a very noticeable presence of “street people”, and the closure of many name-brand businesses that are normally sustained by the “collateral business” generated by convention attendees.

Despite the lower DAC attendance, S2C saw a marked improvement in the quantity and quality of visitors to the S2C booth.  S2C highlighted its latest hardware and software and provided interactive demonstrations of its Prodigy MDM Pro multi-FPGA debug tools and its Prodigy ProtoBridge high-throughput channel for the transfer of large amounts of transaction-level data between the FPGA prototype and a host computer – both demonstrations running on S2C’s Quad Logic System prototyping hardware featuring Intel’s massive Stratix GX 10M FPGAs.

S2C took the opportunity at DAC to roll out its newest version of its prototyping software Prodigy Player Pro-7.  The new software suite includes Player Pro-RunTime, for prototype platform control and hardware test; Player Pro-CompileTime, with enhanced automation of multi-FPGA partitioning and pre/post-partition timing analysis; and Player Pro-DebugTime, for multi-FPGA debug probing and trace viewing with S2C’s class-leading MDM Pro debug tools.

With an emphasis on large-scale SoC design prototyping, Player Pro-7 offers enhanced support for multi-FPGA implementations, including:

  • RTL Partitioning and Module Replication to support Parallel Design Compilation and reduce Time-to-Implementation
  • Pre/Post-Partition System-Level Timing Analysis for Increased Prototyping Productivity
  • SerDes TDM Mode for Optimal Multi-FPGA Partition Interconnect and Higher Prototype Performance

S2C displayed a number of its latest prototyping products in its DAC booth this year, including the Prodigy Logic System 10M based on the industry’s largest FPGA, Intel’s Stratix 10 GX 10M. Also on display were S2C’s Xilinx-based prototyping hardware, the Prodigy S7-19P Logic System, and the S7-9P Logic System, both getting their fair share of DAC attendee attention.

The highlight of the S2C booth was the new Prodigy Logic Matrix LX2.  Based on Xilinx’s largest Virtex Ultrascale+ FPGA, the LX2 boasts eight VU19P;for expansion beyond eight FPGAs, up to eight LX2s can be housed in a single standard server rack, extending prototyping gate-capacity up to sixty-four VU19P FPGAs. For expansion beyond eight FPGAs, the LX2 architecture is designed for prototyping with up to eight LX2’s in a single standard server rack, extending prototyping gate-capacity up to sixty-four VU19P FPGAs.  At this level of FPGA prototyping density, hardware quality and reliability become first-order considerations, and S2C’s 18+ year proven track record of delivering high-quality prototyping hardware sets a high bar for other prototyping solutions.

To enable users to configure prototyping platforms quickly and reliably, S2C displayed a sampling of its Prototype Ready IP in the booth.  Prototype Ready IP are off-the-shelf daughter cards designed by S2C to plug-and-play with S2C prototyping hardware platforms.  The daughter cards are designed to attach reliably to the FPGA prototype hardware and compose a rich collection of prototyping functions, including High-Speed GT Peripherals (Ethernet, PCIe, MIPI, SATA, high-performance cables, etc.), General Peripherals (GPIO, USB, mini-SAS, JTAG, RS232, etc.), Memory Modules (EMMC, DDR, SRAM, etc.), ARM Processor Interface Modules, Embedded and Multimedia modules (DVI, HDMI, MIPI, etc.), and Expansion and Accessories modules (FMC-HPC Converters, Level Shifters, I/O Test Modules, DDR Memory Modules for user-supplied external memory, Interconnect Cables, Clock Modules, etc.).

The Prodigy MDM Pro demonstrations at the booth showcased the implementation of S2C’s multi-FPGA debug tools for prototyping with a combination of external hardware, soft IP implemented in the FPGA, high-speed FPGA I/O, and debug configuration software (Player Pro-DebugTime)MDM Pro was designed specifically to support multi-FPGA prototype implementations – with support for high probe-counts, deep-trace debug data storage, optimization of debugging reconfiguration compiles, and with the ability to choose debug configuration tradeoffs to optimize prototype performance.  The Player Pro-DebugTime software supports user-friendly debug configuration, complex trace-data capture triggering, and single-window viewing on the user console of simultaneous streams of trace-data from multiple FPGAs.  MDM Pro hardware supports high-performance deep-trace debug data storage without consuming internal FPGA storage resources.

S2C also demonstrated its Prodigy ProtoBridge in the DAC booth to showcase its off-the-shelf solution for a high-throughput channel (4GB/second) between the FPGA prototype and a host computer for the application of large amounts of transaction-level test data to the FPGA prototype – such as processor bus transactions, video data streams, communications channel transactions, etc.  ProtoBridge uses a PCI-to-AXI interface implemented in the FPGA and connected to the user’s RTL as an AXI-4 bus.  ProtoBridge includes a set of C-API function calls to perform AXI bus transactions in the FPGA prototype, a PCIe3 driver for Linux or Windows operating systems to control Logic System operations, C-API reference operations with sample access to FPGA internal memory, and an integration guide on how to connect the user’s RTL code to the ProtoBridge AXI-4 bus module.

Overall, DAC 2022 was a successful conference for S2C, firmly establishing S2C as the leading independent FPGA prototyping supplier, with the strongest track record of delivering complete prototyping solutions worldwide.

The FPGA prototyping hardware and software displayed at DAC are available now. For more information, please contact your local S2C sales representative, or visit www.s2cinc.com

Cision View original content:https://www.prnewswire.com/news-releases/s2c-shines-at-dac-2022-with-its-new-prodigy-player-pro-7-prototyping-software-multi-fpga-prototype-hardware-platforms-and-complete-prototyping-solutions-301591581.html

Macronix OctaBus™ Flash Memory Selected for Renesas VC4 Automotive Computing Development Platform

Macronix OctaBus MX25UW51245G NOR Flash Provides Boot Memory to Renesas R-CAR S4 SoC-based VC4 Vehicle Computer Reference Designs

TAIPEI, July 7, 2022 /PRNewswire/ — Macronix International Co., Ltd. (TSE: 2337), a leading integrated device manufacturer in the non-volatile memory (NVM) market, today announced that its MX25UW51245G Serial NOR Flash memory has been selected by Renesas Electronics Corporation for reference designs based on the Vehicle Computer Generation 4 (VC4) chipset. The high-performance MX25UW51245G will provide the VC4 platform, based on Renesas R-Car S4 system on a chip (SoC), with critical memory that enables fast boot-up times in automotive-computing designs.

Fast, reliable flash memory is essential to rapidly booting VC4-based systems, allowing them to adhere to real-time computing requirements. The MX25UW51245G, which can achieve up to 400MB/s read throughput and features low random latency, provides VC4 reference boards the flash storage needed for initial boot of the R-Car S4 SoC.

“Macronix and Renesas continue to enjoy a collaborative relationship, and we’re once again joining forces to bring our respective technologies together and empowering designers with advance automotive-electronics solutions,” said Macronix Vice President of Marketing F.L. Ni. “The VC4 evaluation platform featuring our MX25UW51245G will help unleash the power of the R-Car S4 SoC and VC4 in next-generation automotive systems.”

“The Renesas VC4 evaluation platform streamlines the development of automotive gateway and zone controller systems that can leverage the performance and safety features in both R-Car S4 SoC and MX25UW51245G,” said Takashi Yasumasu, Vice President of Automotive Core Technology Development Division at Renesas.

A core member of Macronix’s highly efficient NOR flash memory line featuring its OctaBus™ interface, the MX25UW51245G features 512Mb density, an Automotive Grade 1 temperature range of -40 ℃ to +125 ℃ and provides functional safety up to Automotive Safety Integrity Level D (ASIL D). The memory’s quality and performance are enhanced substantially by Macronix’s high efficient technology and know how.

The VC4 system is based on a complete Renesas chipset, the centerpiece of which is the R-Car S4 with 8x Cortex®A55 cores which features 8MB of SRAM, advanced cybersecurity and a rich selection of automotive interfaces. The VC4 provides functional safety up to ASIL D, along with the capability for simulating a wide range of connectivity inside the vehicle thereby allowing developers a rich environment for rapid prototyping. It offers an three-port Gigabit Ethernet switch and an integrated RH850 MCU functionality, which drastically reduces the customer’s bill of material.

Macronix and Renesas have a rich history of complementary products and evaluation solutions. Macronix is also a member of Renesas RZ Partner Ecosystem Solutions program and the R-Car Consortium, and a broad range of its flash memory products are represented in several Renesas RZ evaluation boards, including the OctaBus, ArmorFlash™ and e.MMC™ families.

For more information on the Macronix MX25UW51245G, please go to https://www.macronix.com/en-us/products/NOR-Flash/Serial-NOR-Flash/Pages/spec.aspx. For more information on the Renesas Vehicle Computer Generation 4, please go to www.renesas.com/eu/en/application/automotive/gateway-domain-control/vehicle-computer-generation-4#overview.

About Macronix

Macronix, a leading integrated device manufacturer in the non-volatile memory (NVM) market, provides a full range of NOR Flash, NAND Flash, and ROM products. With its world-class R&D and manufacturing capability, Macronix continues to deliver high-quality, innovative and performance-driven products to its customers in the consumer, communication, computing, automotive, networking and other market segments. Find out more at www.macronix.com.

OctaBus, ArmorFlash and e.MMC are trademarks of Macronix International Co., Ltd. All other trademarks are the property of their respective holders.

Editorial contacts

Macronix HQ:
Michelle Chang
Director, Corporate Communication Office
Macronix International Co., LTD.
Tel: +886-3-578-6688 ext. 71233
Fax: +886-3-666-3169
Email: michellechang@mxic.com.tw

US:
Jerry Steach
CommonGround Communications (for Macronix)
Tel: +1-415.222.9996
Email: jsteach-cgc@att.net

Cision View original content:https://www.prnewswire.com/news-releases/macronix-octabus-flash-memory-selected-for-renesas-vc4-automotive-computing-development-platform-301580099.html

AP Memory Joins the UCIe Industry Consortium to Promote AP Memory’s VHM(TM) and Contribute to Global Chiplet Ecosystem

HSINCHU, June 17, 2022 /PRNewswire/ — The global leading customized memory solution provider AP Memory (TSE: 6531) announces today to officially join the Universal Chiplet Interconnect Express (UCIe) industry consortium. As the first among Taiwan’s IC design houses to join the consortium, AP Memory will actively participate in UCIe in collaboration with other members to contribute to the research and application of the UCIe 1.0 standard specification, helping to build a more robust chiplet ecosystem.

The Universal Chiplet Interconnect Express (UCIe) consortium is comprised of leading vendors of the semiconductor industry, including international companies such as Google Cloud, Intel, Meta, Microsoft, AMD, Qualcomm, Samsung and Taiwanese companies including TSMC and ASE. These 10 companies established the UCIe in March 2022, aiming to standardize the technology of chiplet interconnection. UCIe has already released UCIe 1.0 standard, which specifies the basic structure for the interconnect of chiplets, and which is expected to foster the standardization of the chiplet interface. As an open standard for interconnection, UCIe is expected to facilitate the establishment of the chiplet ecosystem at the packaging level, aiming to break the limit of the Moore’s law.

In recent years, 5G communication, high-performance computing (HPC) and Internet of Things (IOT) are driving the needs for new technology of the semiconductor industry. More specifically, the fast-growing applications like artificial intelligence (AI) and HPC require more advanced packaging technology. The semiconductor industry is gradually paying more attention on new technology such as heterogeneous integration and chiplet. AP Memory’s VHMTM (Very High-Bandwidth Memory) has successfully gone into mass production in 2021. With the heterogeneous integration technology for 3D packaging, AP Memory’s VHMTM can support chiplet-based designs. AP Memory’s VHMTM offering includes customized DRAM design and the VHMLInKTM IP which provides the interface for DRAM-logic integration. By pioneering wafer-on-wafer (WoW) stacking, AP Memory is leading the industry in logic-memory integration technology.

 “AP Memory has been very active in exploring new end applications and markets and enabling the ecosystem for 3D packaging. Applications such as edge computing, HPC, AI can all benefit from wide adoption of chiplet technology. As the leading company providing customized memory solutions, AP Memory plays a unique role. We have successfully realized the mass production of the Wafer-on-wafer (WoW) technology. We look forward to collaborating with other industry leaders to build a brand new chiplet ecosystem,” says Chris Liu, Vice President and General Manager of AI Business Unit of AP Memory.

Cision View original content:https://www.prnewswire.com/news-releases/ap-memory-joins-the-ucie-industry-consortium-to-promote-ap-memorys-vhmtm-and-contribute-to-global-chiplet-ecosystem-301570325.html

Source: AP Memory Technology Corp.

ChipMOS SHAREHOLDERS APPROVE CASH DIVIDEND DISTRIBUTION OF NT$4.30 PER COMMON SHARE OR APPROXIMATELY US$2.92 PER ADS; COMPANY SETS DIVIDEND RECORD & DISTRIBUTION DATES

HSINCHU, , May 28, 2022 /PRNewswire-FirstCall/ — ChipMOS TECHNOLOGIES INC. (“ChipMOS” or the “Company”) (Taiwan Stock Exchange: 8150 and NASDAQ: IMOS), an industry leading provider of outsourced semiconductor assembly and test services (“OSAT”), announced its shareholders have approved a cash dividend distribution of NT$4.30 per common share or approximately US$2.92 per ADS at the Company’s AGM on May 26, 2022.  The dividend, which the Company’s Board earlier resolved on February 24, 2022, will be distributed from earnings.  The Company has submitted a dividend/distribution form to NASDAQ, as notification of the below actions for the Company’s American Depositary Shares (“ADRs”).

  • Type of Distribution: Cash Dividend
  • Declaration Date: May 27, 2022
  • Ex-Dividend Date: June 29, 2022
  • ADR Dividend Record Date: June 30, 2022
  • ADR Dividend Distribution Date: July 27, 2022
  • ADR books will be closed from June 28 to July 5, 2022
  • The final dividend amount to be distributed in the U.S. Dollars will be determined by the Depositary, Citibank NA, once it receives the distribution from the Company on July 20, 2022, converts the amount from New Taiwan Dollars into U.S. Dollars and deducts appropriate taxes and fees.

Questions regarding the dividend distribution may be directed to Citibank, N.A.’s Tiffany Ma (Tel: +1-973-461-5734 or tiffany.ma@citi.com).

About ChipMOS TECHNOLOGIES INC.:

ChipMOS TECHNOLOGIES INC. (“ChipMOS” or the “Company”) (Taiwan Stock Exchange: 8150 and NASDAQ: IMOS) (https://www.chipmos.com) is an industry leading provider of outsourced semiconductor assembly and test services. With advanced facilities in Hsinchu Science Park, Hsinchu Industrial Park and Southern Taiwan Science Park in Taiwan, ChipMOS is known for its track record of excellence and history of innovation. The Company provides end-to-end assembly and test services to a broad range of customers, including leading fabless semiconductor companies, integrated device manufacturers and independent semiconductor foundries.

Forward-Looking Statements

This press release may contain certain forward-looking statements. These forward-looking statements may be identified by words such as ‘believes,’ ‘expects,’ ‘anticipates,’ ‘projects,’ ‘intends,’ ‘should,’ ‘seeks,’ ‘estimates,’ ‘future’ or similar expressions or by discussion of, among other things, strategies, goals, plans or intentions. These statements may include financial projections and estimates and their underlying assumptions, statements regarding plans, objectives and expectations with respect to future operations, products and services, and statements regarding future performance. Actual results may differ materially in the future from those reflected in forward-looking statements contained in this document, due to various factors, including the ongoing impact of COVID-19. Further information regarding these risks, uncertainties and other factors are included in the Company’s most recent Annual Report on Form 20-F filed with the U.S. Securities and Exchange Commission (the “SEC”) and in the Company’s other filings with the SEC.

Cision View original content:https://www.prnewswire.com/news-releases/chipmos-shareholders-approve-cash-dividend-distribution-of-nt4-30-per-common-share-or-approximately-us2-92-per-ads-company-sets-dividend-record–distribution-dates-301556757.html

Source: ChipMOS TECHNOLOGIES INC.

Roan Holdings Group Co., Ltd. Reports 2021 Financial Year Results

BEIJING and HANGZHOU, China, April 23, 2022 /PRNewswire/ — Roan Holdings Group Co., Ltd. (“Roan” or the “Company”) (OTC Pink Sheets: RAHGF and RONWF), a comprehensive solution provider for industrial operation and capital market services, today reported its financial results for the fiscal year ended December 31, 2021. All amounts are in U.S. dollars.

Fiscal year 2021 Highlights:

  • Net income increased to $0.76 million for the year ended December 31, 2021 from a net loss of $0.85 million for the year ended December 31, 2020.
  • Net earnings per share increased to $0.01 for the year ended December 31, 2021 from a net loss per share of $0.07 for the year ended December 31, 2020.
  • Net commission and fees on financial guarantee services was $0.40 million for the year ended December 31, 2021, as compared to $0.29 million for fiscal year 2020, reflecting an increase of 37.93% for business development.
  • Operating expenses in total decreased by $0.81 million, to $3.30 million for year ended December 31, 2021 compared to $4.11 million for the year ended December 31, 2020. The decreases were primarily the result of the Company’s cost control strategies.

For fiscal years ended December 31

($ millions, except per share data, differences
due to rounding)

2021

2020


Change

Net revenues of services

$0.79

$2.13

(62.91%)

Net commission and fees on financial guarantee
services

$0.40

$0.29

37.93%

Total interest and fees income

$2.41

$2.48

(2.82%)

Operating income

$3.61

$4.90

(26.33%)

Net income

$0.76

($0.85)

N/A

Net earnings per share – Basic and Diluted

$0.01

($0.07)

N/A

Mr. Junfeng Wang, Chairman of the Board commented, “We are pleased to conclude fiscal year 2021 with sound financial performance. Although the external environment is full of challenges, through our service and extensive cooperation experience and resources accumulated over the past 10 years and with more than 500 customers and partners in various industries, the Company further optimized its strategic planning and business layout in 2021, and is in process of reforming operation structure, optimization of management team, integration of market resources, establishment of new business entities, and upgrading of our business services and products to meet Roan’s future development needs. As a result, the Company not only achieved substantial improvement in financial performance in 2021, but also turned from a net loss of $0.85 million in fiscal year 2020 to a net profit of $0.76 million in fiscal year 2021. At the same time, Roan has successfully expanded its business into the field of new energy, new materials, and semiconductor related industries, and we obtained our first $0.14 million industrial operation service fee income.”

“In the future, through our strategic business layout in industrial operation and capital market services, the Company plans to obtain long-term operation rights for new-generation technologies, products, and services in the fields of new energy, new materials, semiconductors, culture, tourism, and health so as to position ourselves to generate income from our services and products in order to share further the upward trend of these industries,” Mr Wang said.

Mr. Wenhao Wang, Chief Financial Officer of Roan, commented: “In 2021, in line with our expectations, we became profitable, turning around from last year’s losses. We grew our annual net income by $1.61 million to $0.76 million. We boosted our business development by upgrading our business ecosystem, and we applied cost-efficient strategies that helped us save $0.81 million in operating expenses for the past year. We also have a positive working capital balance of $51.94 million as of December 31, 2021, which makes us believe that the efforts we put in place and the strategic development we are taking will bring us significant improvements to profitability, creating long-term value for our shareholders.”

Fiscal Year 2021 Financial Results

Services Revenues

The following table sets forth a breakdown of our revenue by services offered for the years ended December 31, 2021 and 2020:

($ millions, differences due to rounding) 

For the years
ended December
31,

Variance

2021

2020

Amount

%

Management and assessment service

$

0.44

$

0.02

$

0.42

2100%

Consulting services relating to debt collection

0.21

2.11

(1.90)

(90.05)%

Industrial operation services

0.14

0.14

100.00%

Revenues from services

$

0.79

$

2.13

$

(1.34)

(62.91)%

  • Management and assessment services

Revenue from management and assessment services was $0.44 million ended December 31, 2021, which was increased 0.42 million or 2100% compared with $0.02 million for the year ended December 31, 2020. The increase was caused by the new contracts of management and assessment services brought significant revenue and cashflow to the Company.

  • Consulting services relating to debt collection

Revenue from consulting services relating to debt collection was $0.21 million for the year ended December 31, 2021, a decrease of $1.90 million, or 90.05%, as compared to $2.11 million for the year ended December 31, 2020, which was mainly due to the negative impact of the COVID pandemic. We had less contracts for debt collection service during the year ended December 31, 2021.

  • Industrial operation services

On December 31, 2021, Hangzhou Zeshi investment partnership (“Zeshi investment”), a wholly-owned subsidiary of the Company, entered into an agreement with ZhongTan Future New Energy Industry Development (Zhejiang) Co., Ltd. (“ZhongTan”). Revenue of $0.14 million was recognized during the year ended December 31, 2021 after the target customer was located, due diligence and initial negotiation was completed, and requirements of ZhongTan were met.

Revenue for commission and fees on financial guarantee services
Commission and fees on financial guarantee services was $0.46 million for the year ended December 31, 2021, an increase of $0.08 million, or 21.05% as compared to $0.38 million for fiscal year 2020, reflecting an increase for business development.
The provisions for financial guarantee services are related to financial guarantee service business as per the requirement of local government. Provisions for financial guarantee services was $0.06 million for the year ended December 31, 2021, as compared to $0.09 million for last fiscal year.

Interest and fee income
Interest and fee income primarily consisted of interest and fee income generated from loans due from third parties. Interest and fee income was $2.41 million, a decrease of $0.07 million, or 2.82% for the year ended December 31, 2021 as compared to $2.48 million for fiscal year 2020. The decrease was mainly due to a decrease of $0.02 million in interest income from loans due from third parties and a decrease of $0.05 million in interest income on provision deposits with banks.

Operating expenses
Operating expenses in total decreased by $0.81 million, or 19.70% to $3.30 million for year ended December 31, 2021 compared to $4.11 million for the year ended December 31, 2020. The decreases in these expenses were primarily the result of our cost control strategies.  

Net income
As a result of the foregoing, we had a net income of $0.76 million for the year ended December 31, 2021, as compared to a net loss of $0.85 million for the year ended December 31, 2020

Cash and cash equivalents
Cash and cash equivalents were $1.95 million as of December 31, 2021, reflecting a decrease of $2.98 million from $4.93 million as at December 31, 2020, primarily because of the repayment of bank loan of $2.94 million during the year ended December 31, 2021.

Working capital
Our working capital was $51.94 million as of December 31, 2021.

Recent developments

On February 28, 2022, the Company signed a five-year industrial operation cooperation agreement with Jiushang (Hangzhou) Semiconductor Technology Co., Ltd. (“Jiushang”). The Company will provide Jiushang with financing and operation services, and cooperate in the transformation and industrialization of Jiushang semiconductor’s new technological achievements in the Chinese market.

On December 16, 2021, Hangzhou Zeshi invested RMB 2 million (approximately $0.31 million) in Medium Carbon Future New Energy Industry Development (Zhejiang) Co., Ltd. (“Medium Carbon”), and held 2% its equity. Future New Energy invested RMB 20 million (approximately $3.10 million) and held 20% its equity. The registered capital of Medium Carbon is RMB 100 million (approximately $15.49 million).

On November 24, 2021, Hangzhou Zeshi, a wholly owned subsidiary of the Company invested RMB100,000 (approximately $0.02 million) in Hangzhou Future New Energy Enterprise Management Partnership (Limited Partnership) (“Future New Energy”) and held 1% of the equity of Future New Energy. The registered capital of Future New Energy is RMB 10 million (approximately $1.55 million).

About Roan Holdings Group Co., Ltd.

Founded in 2009, Roan Holdings Group Co., Ltd. (OTC Pink: RAHGF and RONWF) is a comprehensive solution provider for industrial operation and capital market services. Adhering to the platform strategy of “cross collaboration, technology empowerment, sustainability and stability, and combination of operation and finance resources”, the Company’s services focus on the  new energy, new materials, and semiconductor industries. At the same time, the Company focuses on the application of innovative technologies in the consumer industry with respect to financial consumption, cultural and tourism consumption, and great health ecosysystem. Roan aims to provide comprehensive solutions and supporting services for diversified institutuional and local government clients across the entire industry chain. Roan has offices in Hangzhou and Beijing and subsidiaries in Hangzhou, Ningbo, Shaoxing and Tianjin. For more information, please visit: www.roanholdingsgroup.com.

Safe Harbor Statement

This announcement contains forward-looking statements within the meaning of Section 21E of the Securities Exchange Act of 1934, as amended, and as defined in the U.S. Private Securities Litigation Reform Act of 1995. These forward-looking statements relate to, among others, the consummation of the proposed transaction, and can be identified by terminology such as “may,” “will,” “expect,” “anticipate,” “aim,” “estimate,” “intend,” “plan,” “believe,” “potential,” “continue,” “is/are likely to” or other similar expressions. Such statements are based upon management’s current expectations of the consummation of the proposed transaction, and relate to events that involve known or unknown risks, uncertainties and other factors, all of which are difficult to predict and many of which are beyond the Company’s control. Further information regarding these and other risks, uncertainties or factors are included in the Company’s filings with the U.S. Securities and Exchange Commission. The Company does not undertake any obligation to update any forward-looking statement as a result of new information, future events or otherwise, except as required under law.

IR Contact:
At the Company:
Katrina Wu
Email: xiaoqing.wu@roanholdingsgroup.com
Phone: +86-571-8662 1775

Investor Relations Firm:
Janice Wang
EverGreen Consulting Inc.
Email: IR@changqingconsulting.com
Phone: +1 571-464-9470 (from U.S.)
+86 13811768559 (from China)

ROAN HOLDINGS GROUP CO., LTD.

CONSOLIDATED BALANCE SHEETS

As of December 31, 2021 and 2020

(Expressed in U.S. dollar, except for the number of shares)

December 31,
2021

December 31,
2020

  ASSETS

Cash and cash equivalents

$

1,947,142

$

4,932,048

Restricted cash

29,693,689

25,875,556

Accounts receivable, net

6,929,529

6,939,352

Inventories

33,598

30,348

Loan receivables due from third parties, net

23,751,471

17,670,652

Due from related parties

5,941

94,023

Other current assets

70,910

3,502,550

Other receivables, net

656,835

3,545,753

   Total current assets

63,089,115

62,590,282

Pledged deposits

48,752

462,835

Property and equipment, net

77,073

65,073

Intangible assets, net

3,123,394

3,977,867

Right of use assets

37,313

346,017

Goodwill

267,331

261,087

   Total non-current assets

3,553,863

5,112,879

   Total Assets

$

66,642,978

$

67,703,161

LIABILITIES

Customer pledged deposits

$

7,846

$

7,664

Unearned income

72,523

130,772

Reserve for financial guarantee losses

651,341

579,364

Dividends payable

480,000

480,000

Tax payable

2,614,257

1,767,214

Due to related parties

123,117

281,369

Warrant liabilities

16,998

13,977

Operating lease liabilities, current portion

65,498

191,643

Accrued expenses and other liabilities

1,155,903

1,642,060

Bank loans

5,961,460

8,826,054

Total current liabilities

11,148,943

13,920,117

Operating lease liabilities, noncurrent portion

102,767

Deferred tax liabilities

544,355

793,848

Total non-current Liabilities

544,355

896,615

Total Liabilities

$

11,693,298

$

14,816,732

Commitments and Contingencies

Shareholders’ Equity

Ordinary Share, no par value, unlimited shares authorized; 25,287,851 and
   25,287,851 shares issued and outstanding as of December 31, 2021 and December 
   31, 2020, respectively

Class A convertible preferred shares, no par value, unlimited shares authorized; 
   715,000 and 715,000 shares issued and outstanding as of December 31, 2021 and
   December 31, 2020, respectively

$

11,711,727

$

11,025,327

Class B convertible preferred shares, no par value, unlimited shares authorized; 
   291,795,150 and 291,795,150 shares issued and outstanding as of December 31, 2021 and 
   December 31, 2020, respectively

31,087,732

31,087,732

Additional paid-in capital

3,312,189

3,312,189

Statutory reserve

362,797

202,592

Accumulated deficit

(14,805,802)

(14,330,288)

Accumulated other comprehensive income

3,128,086

2,310,369

Total Roan Holdings Group Co., Ltd.’s Shareholders’ Equity

$

34,796,729

$

33,607,921

Noncontrolling interests

20,152,951

19,278,508

Total Equity

54,949,680

52,886,429

Total Liabilities and Equity

$

66,642,978

$

67,703,161

ROAN HOLDINGS GROUP CO., LTD.

CONSOLIDATED STATEMENTS OF OPERATIONS AND COMPREHENSIVE INCOME (LOSS)

For the Years Ended December 31, 2021, 2020 and 2019

(Expressed in U.S. dollar, except for the number of shares)

For the Years Ended
December 31,

2021

2020

2019

Revenues from services

$

793,291

$

2,128,153

$

639,220

Revenues from healthcare service packages

55,301

Cost of revenues

(50,774)

(8,080)

Net revenues of services

793,291

2,132,680

631,140

Commissions and fees on financial guarantee services

456,944

375,471

8,797

Provision for financial guarantee services

(57,417)

(89,865)

(5,008)

Commission and fee income on guarantee services, net

399,527

285,606

3,789

Interest and fees income

Interest and fees on direct loans

1,153

Interest income on loans due from third parties

2,113,918

2,131,447

34,707

Interest income from factoring business

2,782,332

Interest income on deposits with banks

300,749

348,389

64,636

Total interest and fee income

2,414,667

2,479,836

2,882,828

Interest expense

Interest expenses and fees on secured loans

(2,218,815)

Net interest income

2,414,667

2,479,836

664,013

Provision for loan losses

(2,244,601)

Net interest income (loss) after provision for loan losses

2,414,667

2,479,836

(1,580,588)

Operating income (loss)

3,607,485

4,898,122

(945,659)

Total operating expenses

Salaries and employee surcharges

(1,054,509)

(1,116,482)

(512,314)

Other operating expenses

(2,241,069)

(2,995,098)

(1,385,259)

Changes in fair value of warrant liabilities

(3,021)

5,961

530,863

Total operating expenses

(3,298,599)

(4,105,619)

(1,366,710)

Other income (expenses)

Deconsolidation gain (loss)

490,283

(1,953,248)

Interest income (expenses), net

(267,184)

Other income (expense), net

554,167

76,406

Total other income (expenses)

777,266

(1,876,842)

Income (Loss) before income taxes

1,086,152

(1,084,339)

(2,312,369)

Income tax (expenses) recovery

(328,851)

229,733

(244,741)

Net income (loss) from continuing operations

757,301

(854,606)

(2,557,110)

Net income from discontinued operations, net of income tax

26,846,018

Net income (loss)

757,301

(854,606)

24,288,908

Dividend – convertible redeemable Class A preferred share

(686,400)

Net income attributable to noncontrolling interests

(386,210)

(838,048)

(76,108)

Net income (loss) attributable to Roan Holding Group Co., Ltd.’s
shareholders

$

371,091

$

(1,692,654)

$

23,526,400

Other comprehensive (loss) income

Foreign currency translation adjustment

1,308,444

3,461,980

1,435,262

Reclassified to net gain from discontinued operations

2,691,969

1,308,444

3,461,980

4,127,231

Comprehensive income

2,065,745

2,607,374

28,416,139

Other comprehensive income attributable to noncontrolling interests

(488,233)

(1,334,101)

(97,733)

Dividend – convertible redeemable Class A preferred share

(686,400)

Net income attributable to noncontrolling interests

(386,210)

(838,048)

(76,108)

Total comprehensive income attributable to Roan Holdings Group 
    Co., Ltd.’s shareholders

$

1,191,302

$

435,226

$

27,555,898

Weighted average number of ordinary share outstanding

Basic and Diluted*

25,287,887

25,287,887

25,287,887

Earnings (Loss) per share

Net earnings (loss) per share – Basic and Diluted

$

0.01

$

(0.07)

$

0.93

Net earnings (loss) per share from continuing operations – Basic and
Diluted

$

0.01

$

(0.07)

$

(0.13)

Net earnings per share from discontinued operations – Basic and Diluted

$

$

$

1.06

ROAN HOLDINGS GROUP CO., LTD.

CONSOLIDATED STATEMENTS OF CASH FLOWS

For the Years Ended December 31, 2021, 2020 and 2019

(Expressed in U.S. dollar, except for the number of shares)

For the Years Ended
December 31,

2021

2020

2019

Cash Flows from Operating Activities:

Net income (loss)

$

757,301

$

(854,606)

$

24,288,908

Less: Net loss from discontinued operations

26,846,018

Net loss from continuing operations

757,301

(854,606)

(2,557,110)

Adjustments to reconcile net income to net cash used in operating
activities:

Depreciation and amortization expenses

1,134,738

1,102,298

55,498

Provision for credit losses

48,518

316,014

Provision for loan losses

2,244,601

Provision for financial guarantee losses

57,417

89,865

5,008

Deferred tax expenses

(265,421)

(1,001,372)

57,674

Changes in fair value of warrant liabilities

3,021

(5,961)

(530,863)

Net gain from disposal of fixed assets

(33,246)

(136,682)

Gain from lease modification

(603)

22,257

Accretion of finance leases

7,605

14,757

Gain (loss) from deconsolidation of subsidiaries

(490,283)

1,953,248

Changes in operating assets and liabilities:

Accounts receivable

(7,495)

(3,116,533)

(206,442)

Inventory

(3,250)

(30,348)

Interest and fees receivable

(149,013)

Other current assets

3,431,640

(3,215,702)

(289,694)

Other receivables

2,425,003

(3,268,571)

Pledged deposits and other non-current assets

414,265

359,202

Advances from customers

(58,249)

7,915

(6,702)

Tax payable

847,043

1,029,919

273,589

Accrued expenses and other liabilities

449,971

(727,211)

28,875

Net Cash Provided by (Used in) Operating Activities from 
Continuing Operations

8,717,975

(7,461,511)

(1,074,579)

Net Cash Used in Operating Activities from Discontinued 
Operations

(26,564)

Net Cash Provided by (Used in) Operating Activities

8,717,975

(7,461,511)

(1,101,143)

Cash Flows from Investing Activities:

Repayment of loans from factoring customers

107,833,488

Proceeds of loans from third parties

20,499,442

Loans disbursement to third parties

(26,100,286)

(3,467,607)

Loans disbursement to factoring customers

(43,422,881)

Purchases of property and equipment

(54,569)

(833)

Acquisition of a subsidiary

(427,318)

Acquisition of cash from acquired subsidiary

21,442,122

Proceeds from disposal of discontinued operations

504,713

Net inflow related to deconsolidation of subsidiaries

788

61,121

Redemption of short-term investment

8,690,374

Due to (from) related party

(70,169)

210,774

Proceeds from sale of property and equipment

40,305

837,969

Net Cash (Used in) Provided by Investing Activities from Continuing 
Operations

(5,684,489)

6,332,631

85,929,291

Net Cash Provided by Investing Activities from Discontinued

Operations

35,765

Net Cash (Used in) Provided by Investing Activities

(5,684,489)

6,332,631

85,965,056

Cash Flows from Financing Activities:

Borrowing from a related party

279,020

Proceeds from bank loans

5,889,179

8,341,311

Repayment of bank loans

(8,927,555)

Proceeds from secured loans

43,422,881

Repayment of secured loans

(107,833,488)

Repayment of third-party loans

(280,268)

Repayment of lease liabilities

(76,102)

(207,891)

Net Cash (Used in) Provided by Financing Activities from 
Continuing Operations

(3,114,478)

7,853,152

(64,131,587)

Net Cash Used in Financing Activities from Discontinued
Operations

(7,251)

Net Cash (Used in) Provided by Financing Activities

(3,114,478)

7,853,152

(64,138,838)

Effect of exchange rate changes on cash, cash equivalents, and restricted
   cash in banks

914,219

1,937,807

119,326

Net increase in cash, cash equivalents, and restricted cash in banks

833,227

8,662,079

20,844,401

Cash, cash equivalents, and restricted cash in banks at beginning of year

30,807,604

22,145,525

1,301,124

Cash, cash equivalents, and restricted cash in banks at end of year

$

31,640,831

$

30,807,604

$

22,145,525

Supplemental Cash Flow Information

Cash paid for interest expense

$

269,400

$

$

Cash paid for income tax

$

$

$

Noncash investing activities

Acquisition of a subsidiary by issuance of Class B Preferred Shares

$

$

$

31,087,732

Receivable from disposal of discontinued operations

$

$

$

940,829

Right of use assets obtained in exchange for operating lease obligations

$

$

$

615,000

The following table provides a reconciliation of cash, cash equivalents and restricted cash reported within the
statement of financial position that sum to the total of the same amounts shown in the consolidated statements of cash
flows:

December 31,
2021

December 31,
2020

Cash and cash equivalents

$

1,947,142

$

4,932,048

Restricted cash in banks

29,693,689

25,875,556

Total cash, cash equivalents and restricted cash

$

31,640,831

$

30,807,604

Cision View original content:https://www.prnewswire.com/news-releases/roan-holdings-group-co-ltd-reports-2021-financial-year-results-301531269.html

Source: Roan Holdings Group Co., Ltd.

ChipMOS REPORTS 12.3% MoM INCREASE IN MARCH 2022 MONTHLY REVENUE; 4.0% YoY INCREASE IN 1Q22 QUARTERLY REVENUE

HSINCHU, April 8, 2022 /PRNewswire-FirstCall / — ChipMOS TECHNOLOGIES INC. (“ChipMOS” or the “Company”) (Taiwan Stock Exchange: 8150 and NASDAQ: IMOS), an industry leading provider of outsourced semiconductor assembly and test services (“OSAT”), today reported its unaudited consolidated revenue for the month of March 2022 and for the first quarter ended March 31, 2022. All U.S. dollar figures cited in this press release are based on the exchange rate of NT$28.62 to US$1.00 as of March 31, 2022.

Revenue for the first quarter of 2022 was NT$6,725.2 million or US$235.0 million, representing a slight decrease of 1.0% from the fourth quarter of 2021, and an increase of 4.0% from the first quarter of 2021. The Company noted its continued strong results reflect full utilization of its DDIC high-end test capacity. Q1 is typically a seasonally slower period for the industry with fewer working days than Q4.

Revenue for the month of March 2022 was NT$2,355.3 million or US$82.3 million, representing an increase of 12.3% from February 2022, and an increase of 0.5% from March 2021. 

Consolidated Monthly Revenues (Unaudited)

March 2022

February 2022

March 2021

MoM Change

YoY Change

Revenues

(NT$ million)

2,355.3

2,096.9

2,344.6

12.3%

0.5%

Revenues

(US$ million)

82.3

73.3

81.9

12.3%

0.5%

Consolidated Quarterly Revenues (Unaudited)

First Quarter

2022

Fourth Quarter

2021

First Quarter

2021

QoQ Change

YoY Change

Revenues

(NT$ million)

6,725.2

6,791.4

6,465.3

-1.0%

4.0%

Revenues

(US$ million)

235.0

237.3

225.9

-1.0%

4.0%

About ChipMOS TECHNOLOGIES INC.:

ChipMOS TECHNOLOGIES INC. (“ChipMOS” or the “Company”) (Taiwan Stock Exchange: 8150 and NASDAQ: IMOS) (https://www.chipmos.com) is an industry leading provider of outsourced semiconductor assembly and test services. With advanced facilities in Hsinchu Science Park, Hsinchu Industrial Park and Southern Taiwan Science Park in Taiwan, ChipMOS is known for its track record of excellence and history of innovation. The Company provides end-to-end assembly and test services to a broad range of customers, including leading fabless semiconductor companies, integrated device manufacturers and independent semiconductor foundries.

Forward-Looking Statements

This press release may contain certain forward-looking statements. These forward-looking statements may be identified by words such as ‘believes,’ ‘expects,’ ‘anticipates,’ ‘projects,’ ‘intends,’ ‘should,’ ‘seeks,’ ‘estimates,’ ‘future’ or similar expressions or by discussion of, among other things, strategies, goals, plans or intentions. These statements may include financial projections and estimates and their underlying assumptions, statements regarding plans, objectives and expectations with respect to future operations, products and services, and statements regarding future performance. Actual results may differ materially in the future from those reflected in forward-looking statements contained in this document, due to various factors, including the ongoing impact of COVID-19. Further information regarding these risks, uncertainties and other factors are included in the Company’s most recent Annual Report on Form 20-F filed with the U.S. Securities and Exchange commission (the “SEC”) and in the Company’s other filings with the SEC.

Contact s :

In Taiwan

Jesse Huang

ChipMOS TECHNOLOGIES INC.

+886-6-5052388 ext. 7715

IR@chipmos.com

In the U.S.

David Pasquale

Global IR Partners

+1-914-337-8801

dpasquale@globalirpartners.com 

Cision View original content:https://www.prnewswire.com/news-releases/chipmos-reports-12-3-mom-increase-in-march-2022-monthly-revenue-4-0-yoy-increase-in-1q22-quarterly-revenue-301520619.html

Source: ChipMOS TECHNOLOGIES INC.

ERS electronic unveils the Next-Generation of its ADM330 with a new design and advanced features


MUNICH, Germany, March 30, 2022 /PRNewswire/ — ERS electronic, the industry leader in the market of thermal management solutions for semiconductor manufacturing, reveals the details of its third-generation flagship thermal debond machine, ADM330. The machine was introduced to the market in 2007 as the first-of-its-kind. Since then, it has become an industry-favourite and can be found on the production floors of most semiconductor manufacturers and OSATs involved in Advanced Packaging worldwide.
Earlier this month, the company was recognized for its continuous innovation and contribution to heterogeneous integration technologies with a 3D InCites “Equipment Supplier of the Year” award.

ERS is now giving a first look at the next-generation ADM330, which has changed its previously matte metallic appearance to a clean, white surface matching most equipment found in a cleanroom. In addition, the machine is now fully compliant with the GEM300 SEMI standards, thus allowing seamless integration into automated fabs and Industry 4.0 architectures. Warpage adjustment performance has also been improved thanks to a unique thermal chuck design that enables a strong vacuum performance three times better than its predecessor. Lastly, the new ADM330 offers an implemented add-on software feature allowing stand-alone laser marking for improved wafer traceability.

“We are very excited to reveal the latest upgrade of our flagship machine. With these improvements, we continue to deliver a robust system that meets the ever-changing process requirements of Advanced Packaging,” says Debbie-Claire Sanchez, FO Equipment Business Unit manager at ERS electronic.

“Fan-out packaging market value is expected to reach more than US$3.4 billion by 2026 at a 14% CAGR 1, mainly driven by 5G, HPC and IoT applications2“, announces Gabriela Pereira, Technology & Market Analyst, Semiconductor, Memory & Computing at Yole Développement (Yole). “In this dynamic context, one of the main technical challenges is the warpage of the reconstituted wafers due to CTE mismatch between the different materials applied. Next-generation of ERS ADM330 debonding equipment announced today by ERS electronic will be a solution to enable warpage adjustment improvement and contribute to reducing yield losses.”

1 Between 2021 and 2026 
2 Source: Advanced Packaging Quarterly Market Monitor, Q4 2021, Yole Développement (Yole)

About ERS:

ERS electronic GmbH has gained an outstanding reputation in the semiconductor industry with its fast and accurate air cool-based thermal chuck systems for wafer probing and its thermal debonding and warpage adjustment tools for FOWLP/PLP.

www.ers-gmbh.com

ERS’s Next-Generation ADM330 comes with a sleek new look and improved features