[Google I/O 2023] Google Bard – What is That?

After Google I/O 2023 last week, you might have noticed that your Android smartphone pushing a notification to you. It is a prompt for you to try Google’s updated Bard. Most of you on Google’s email platform (Gmail) might also get an email asking you to try Bard today. If you are familiar with AI (artificial intelligence) news, you might already be familiar with Google’s Bard alongside OpenAI’s ChatGPT. To those, it might sound like a foreign object.

In simple terms, Google Bard is really the Google version of ChatGPT. While ChatGPT is developed by OpenAI, Bard is completely Google. You want to keep in mind that both ChatGPT and Bard are two separate platforms altogether though before jumping to conclusions and say that they are the same things. They are both categorised as generative AI, but they are both different from one another.

Unlike ChatGPT which has existed for some time, and is in its fourth iteration, Google Bard is fresh out of the oven; two months out of the oven, to be fair. Like ChatGPT, Google Bard was launched as an experiment. Like ChatGPT as well, the technology for Google Bard is not exactly new.

What is Google Bard?

Screenshot 2023 05 15 162043
Source: Google

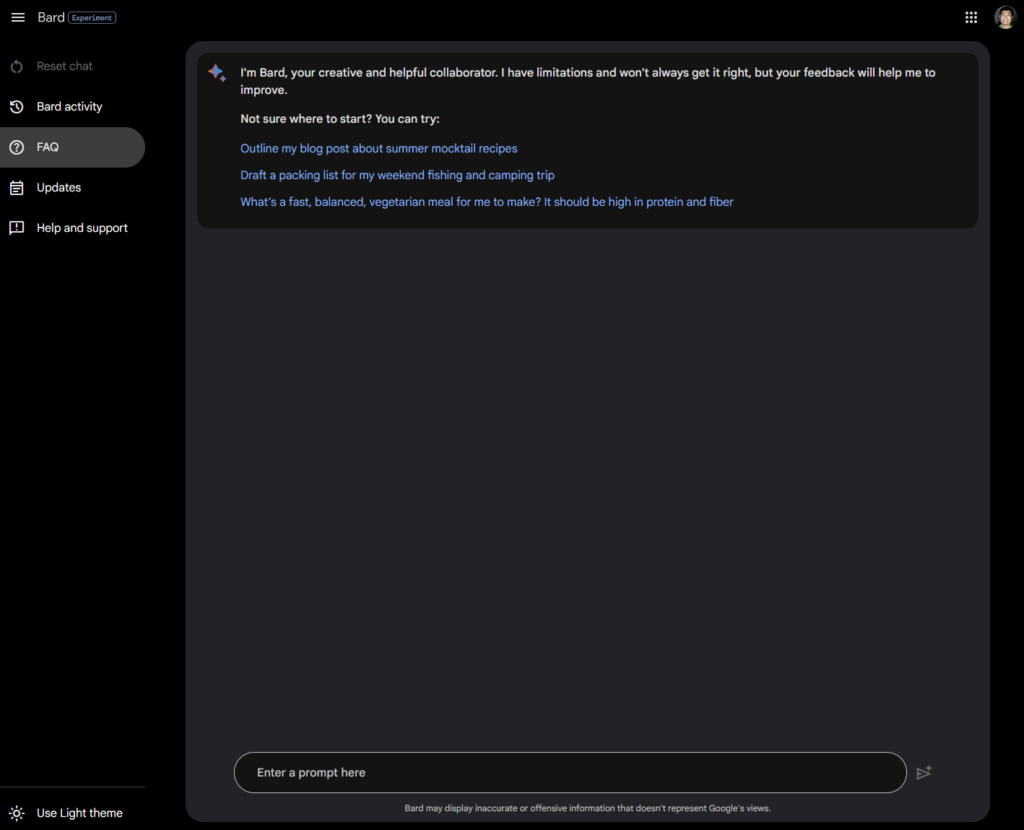
As mentioned, Google Bard is a generative and creative AI by Google. Instead of overcomplicating the explanation, Google’s FAQ says that Google Bard is technically based on their LaMDA (Language Model for Dialogue Applications) AI model, Google’s very own linguistics program written for conversational purposes. When we say conversational, we do not mean that it will be like a regular conversation with a human being, but LaMDA aims to make it close.

To be fair, Google’s conversational AI is not something you have not seen before, you see it with Google Assistant whenever you call out “Hey, Google,” or “Okay, Google”. You can even use Google’s clever Assistant to get you a booking for a restaurant by having Google Assistant make the call and get the booking done, instead of you calling the restaurant yourself. In their demo a few years ago, Google’s Voice Assistant sounded so natural that the other person on the other end of the line could not even tell that they are speaking to an artificial person. This proves that LaMDA works, and has a place in the world. But our many use case of the Google Assistant even with Google Nest systems is prove enough that conversational AI has many uses in the current world.

Bard is not just a conversationalist though. It is more than that, a generative AI of sorts. It still has its roots in LaMDA, but it is a lot more than that now. It is made as a collaborative tool, for you to basically generate ideas, tabulate and make sense of data, help you plan things, help you design tools and steps, collate your calendars, and even use it as a learning tool.

According to Google, Bard is made to create original contents at the request and behest of individual users. Meaning that the algorithm could be different are results can be different from one person to another. Because it is Google, any request or question you post to Bard might prompt Bard to look into hundred or thousands of sources and draw conclusions, or present result in a way the does not infringe copyright or plagiarism laws. In the case that it does take up contents from another source, Bard will acknowledge and cite its sources. Google Bard is not built to write your college essay though, it is built to be a collaborator to manage your work and your life, to make it more seamless somehow over just Googling things. They do actually have a ‘Google It’ button for you to make full use of Google’s search engine though.

It is not a 100% solution for your own research and use case though. Google has mentioned and stressed that Google Bard is an experiment. It is an opportunity for their AI engines to learn even more at an accelerated pace with public input and use. Google Bard is meant to be iterated, which also means that the current form of Google Bard will not be final. They also mention that Google Bard, at its current form will not be 100% accurate at all times; hence, the ‘Google It’ button on Bard. While it is open source, Google also says that Bard is not meant to be used commercially or for advertising purposes at this time.

Why Bard?

Screenshot 2023 05 15 162312
Source: Google

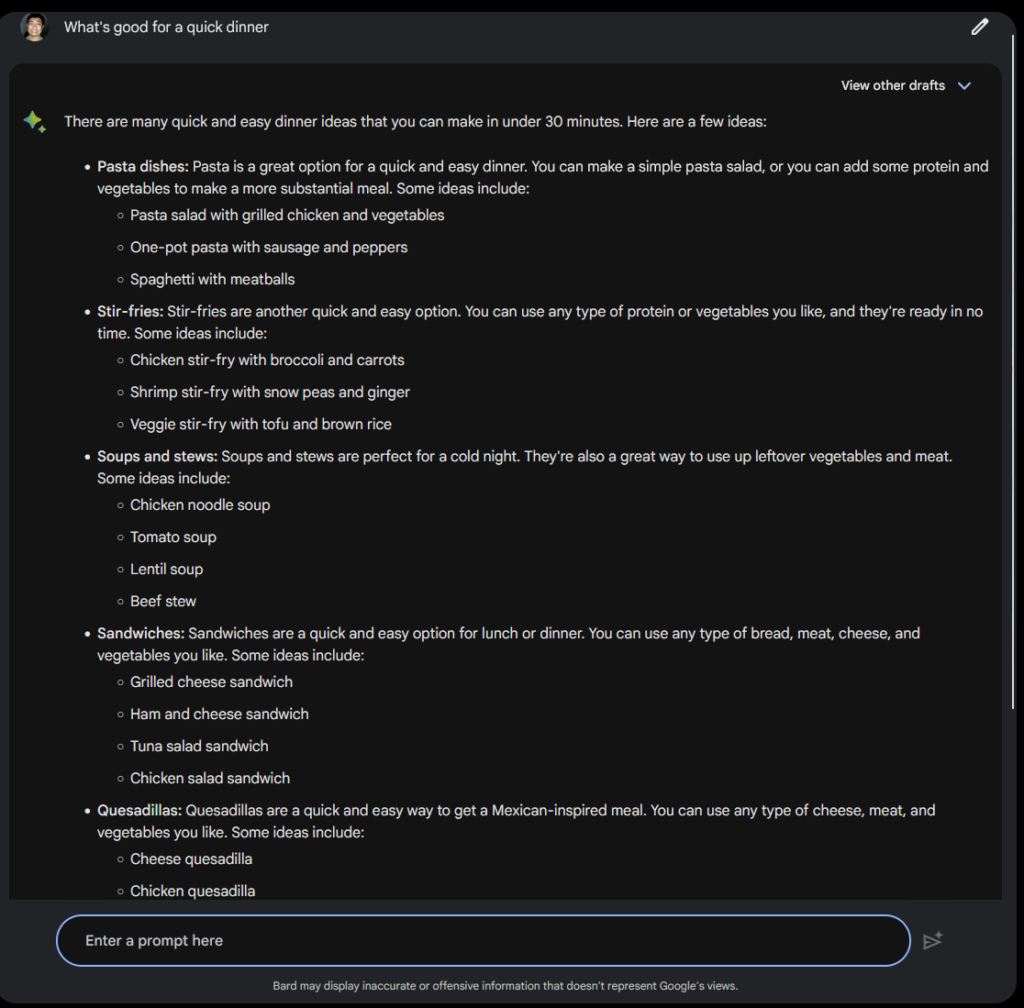
The entire existence of Bard could be a sharp response to OpenAI’s ChatGPT. The success of the open-source AI platform has sort of forced Google to quickly introduce their own AI tool for use to the public. If they are to be believed, Google could offer the most powerful AI tool for the masses.

In the recent Google I/O 2023, Google has officially embraced Bard and announced that they have moved Bard to PaLM 2, an improved language model that offers more capabilities of Google Bard compared to just conversational based on LaMDA model. PaLM 2 now offers Bard the ability to code and program. It also allows Bard to solve even more complex mathematical problems and process through more complex reasoning models that offers Bard the ability to make better decisions over time.

As of Google I/O 2023, Google has opened the Bard experiment to more than 180 countries as of writing and is available in Japanese and Korean. As things go, Google is planning to open the experiment to more regions and make Bard available in about 40 languages. On top of more languages and regions, where the older Google Bard was mostly just conversational via text, the new improvement at Google I/O 2023 adds some visual flavours to your conversations with Bard. They have integrated Goole Lens into Bard and allow you to now scan photos of your things at home and let Bard come up with whatever captions you might want. You can even add photo references to your Google Bard generated itinerary when you travel.

But it is not just the surface updates for Google Bard. For Google I/O 2023, they have announced that Bard is not just a tool that is isolated from any other systems. Google is making the Bard available with an “export” button for collaboration purposes in the form of exporting and running codes on Python. You could directly copy email responses into your Gmail or Google Docs, if you want. If you want more out of Bard, you can even expect Adobe Firefly integration in the coming future for even more powerful generative tools like complete poster designs based on both Google’s and Adobe’s combined algorithms. They have also announced that they are working with more partners like Kayak, OpenTable, ZipRecruiter, Instacart, Wolfram and Khan Academy to get their Google Bard project integrated into their services and products.

In this case, where OpenAI is allowing you to plug its API anywhere and get it working with minor tweaks, Google is not looking to just do that. Google is offering deep integration with their partners to create even more, to become an even more powerful tool in your toolkit for the future. They look to open up even more opportunities and applications for the average user with deeper and more curated collaborations with partnering brands. While that may not necessarily be the best thing to do for some, it is a way forward for more integrated services and solutions to serve individuals and businesses better. It even allows partnering companies to understand their users and customers better in some cases.

USI Launches PCle Gen.5 Mass Production Testing Platform Solution To Boost The Solid-State Drive Industry

SHANGHAI, May 15, 2023 /PRNewswire/ — With the accelerating popularity of PCIe Gen.5 technology, high-speed data transfer and low latency have become essential application requirements for industries such as gaming, data centers and cloud computing, high-performance computing, artificial intelligence and machine learning, as well as automotive and aerospace. To meet the urgent need of these industries to build product ecosystems supporting this interface, USI has launched its self-developed PCIe Gen.5 mass production test platform solution. As a well-known enterprise with 17 years of expertise in solid-state drive (SSD) products, USI provides end-to-end services from R&D, validation to mass production, and is renowned for its top product quality in the industry. The launch of the PCIe Gen.5 mass production test platform solution demonstrates USI’ technical strength and innovative capabilities in this field.

The transfer rate of PCIe Gen.5 doubles to 32GT/s compared to the previous generation, which requires more stringent signal transmission and the technology supporting ecosystem is not yet complete. The mass production test platform must have stricter design and validation for the controller, PCB material, wire length, signal path, connector, and software settings, resulting in significantly increased development cycle time, technical risk, and cost. Currently, there are just few solutions in the market that support PCIe Gen.5 testing, which are costly, with long lead time, and the supply from foreign manufacturers is limited. USI launches its self-developed mass production test platform solution to address these challenges.

USI’s SSD generic production testing solution has many advantages. The platform is deployed in a standard rack and has a modular design, with testing port modules added or removed as needed. A single cabinet supports testing for 80 U.2 drives or 40 AIC drives, with a single port supporting up to 150W power consumption. The platform also supports all ports running at full PCIe Gen.5 speed simultaneously, with voltage and current measurement and protection, skew testing, hot-swapping, unified platform software management, software upgrades, platform self-verification, flexible capacity configuration options, and affordable total operating costs for the testing platform. These features will provide customers with a more efficient, stable, and flexible testing solution.

Jaguar Meng, PM of Storage Array & Interconnect PLM of USI, said “USI’s self-developed mass production testing platform solution will provide efficient, stable, and flexible testing support for the PCIe Gen.5 industry. In addition, USI also provides customized support based on a generic testing plan. With its intellectual property in the product, we can provide customized PCIe Gen.5 interface product mass production support such as custom interfaces, temperature variation environments, and mass production testing program development based on customers’ specific needs. This will greatly improve users’ production efficiency, reduce technical risks, and enhance product competitiveness.”

This solution showcases USI’s technical strength and innovation in the solid-state drive (SSD) industry and is a testament to the company’s continuous exploration of technology bottlenecks and innovative solutions. With USI’s generic testing solution and customized support, the company will become a reliable partner for PCIe Gen.5 interface production testing, making an important contribution to the development of the entire industry.

About USI (SSE: 601231)

USI, Universal Scientific Industrial (Shanghai) Co., Ltd., is a global leader in electronic design and manufacturing as well as a leader in the field of SiP (System-in-Package) modules. USI provides D(MS)2 product services: Design, Manufacturing, Miniaturization, Industrial software and hardware Solutions, and material procurement, logistics and maintenance Services. With Asteelflash, USI has 28 sales, production and service locations across four continents of Asia, Europe, Americas and Africa, and offers customer diversified products in the sectors of wireless communication, computer and storage, consumer, industrial, medical and automotive electronics worldwide. USI is a subsidiary of ASE Technology Holding Co., Ltd. (TWSE: 3711, NYSE: ASX). To learn more, please visit www.usiglobal.com and engage with us on LinkedIn and YouTube.

CCTV+: Stories of Xi and his mother: a parent’s lifelong influence on her son

BEIJING, May 14, 2023 /PRNewswire/ — For Chinese President Xi Jinping, his mother Qi Xin has set an outstanding example in many ways for her son and played a crucial role in shaping the values and priorities of a future leader of the country.

Qi, who was born in 1926, joined the Communist Party of China (CPC) in 1943 at the age of 17, becoming a staunch supporter of the Party’s values and beliefs.

“Parents and seniors should pass on good morals to their children when they are little, helping them build moral integrity and a sense of goodwill, so that they can grow into a person who can contribute to the country and the general public,” she once said.

Qi led a simple life, which became a tradition for the family. Despite many difficulties, she managed to balance taking care of the family and her work.

Xi has cherished a lifelong goal in his heart based on his memories of illustrated story books his mother bought him about Yue Fei, a legendary Chinese general who fought against invaders to protect his people during the Southern Song Dynasty (1127-1279).

Qi told Xi, who was then around five years old, how Yue Fei’s mother tattooed her son’s back with four Chinese characters “jing zhong bao guo”, which literally translates as “serve the country with the utmost loyalty,”, so that Yue would never forget the responsibilities placed on his shoulders.

Being a loyal and loving son, Xi used to chat and take a walk with his mother whenever he had time. But to Qi, the greatest display of filial love was Xi doing his best on his job and serving the people wholeheartedly.

Over the years, Xi’s political career has taken him from Shaanxi in the country’s northwest, to Hebei Province in the north, Fujian, Zhejiang and Shanghai in the east, and eventually Beijing. In all those places, his work and contributions have been fondly remembered and applauded by the local people.

For Xi, family and family traditions have become a solid foundation in the process of state administration. Many years later, he still remembers his mother’s wisdom and firmly follows his original aspirations that she helped shape.

Link: https://youtu.be/-akHTtQ25Ew

Brigii Launches A Powerful MX30 Mini Vacuum Cleaner To Keep Kitchens Crumb-free

SHENZHEN, China, May 13, 2023 /PRNewswire/ — Brigii, a premier, innovative technology brand dedicated to the research, development, and production of smart hardware for homes has launched the MX30 mini vacuum cleaner. With a brushless DC motor, the MX30 vacuum has a powerful suction. Its compact size allows users to clean up small messes as they go and make daily cleaning a breeze.

Brigii MX30 Handheld vacuum

With busy family life and a bustling kitchen, cleaning up crumbs can be a daily chore. Food debris often gets trapped under kitchen appliances, between cabinets, at the edges of countertops, etc. This makes it a breeding ground for bacteria and an eyesore. However, with the Brigii MX30 handheld vacuum’s crevice tool and compact design, you can quickly and easily clean the gap to prevent any food particles from becoming wedged deep inside. Say goodbye to those hard-to-reach crumbs and hello to a cleaner, more hygienic kitchen with the mini vacuum.

The brushless DC motor of the Brigii MX30 vacuum cleaner has many advantages over ordinary vacuum cleaners. Firstly, brushless motors are more powerful and durable than traditional brush motors, this helps the MX30 to effectively pick up crumbs and other debris. Secondly, brushless motors are more energy efficient, leading to longer battery life. Finally, brushless motors are quieter and produce less vibration than traditional brush motors, making MX30 much more pleasant to use.

In addition to the crevice tool, the Brigii MX30 handheld vacuum also comes with a multi-surface tool that makes it easy to clean your sofa, stairs, and car interiors of dust, hair, particles, etc. The vacuum cleaner is also equipped with a washable HEPA filter that captures 99.97% of dust and allergens, ensuring that the air in your home remains clean and healthy. The filter is easy to remove and clean, making maintenance simple.

Compared to Brigii’s other mini vacuums, the MX30 vacuum cleaner with a base makes it an extra bonus. It can store the MX30 vacuum cleaner and accessories, making them easily accessible when you need them. You can also easily charge your device without worrying about running out of power.  In addition, it supports Type-c charging.

So far, Brigii MX30 has elicited rave reviews from its Amazon users. One reviewer gave it five stars for its portability: “The MX30 cordless vacuum is so handy for cleaning crevices in corners, especially in hard-to-reach places like between appliances.” Another reviewer said: “This is the perfect gadget for quick cleanups in the kitchen – perfect for small messes and spills that would otherwise require a big clean-up job.”

“With the fast-paced lifestyles that many people live nowadays, the MX30 mini vacuum is the perfect gift for anyone who wants to keep their kitchen clean and tidy without spending hours on cleaning,” said a spokesperson for Brigii. “It is a powerful and efficient tool that is perfect for cleaning up small messes as you go. Whether you’re cooking in the kitchen, working at your desk, or playing with your pet, the Brigii MX30 mini vacuum allows you to clean up any mess quickly and easily”

For more information: https://www.brigii.com/
MX30 Amazon US: https://amzn.to/41VkM7v
MX30 Amazon UK: https://bit.ly/3GUR9uI

Connect with Brigii
Facebook: https://www.facebook.com/brigii.fans
Instagram: https://www.instagram.com/brigii.official
TikTok: https://www.tiktok.com/@brigii.official

About Brigii

Founded in 2019, Brigii is an innovative technology brand dedicated to the research, development, and production of smart hardware for homes.

With the motto “Serving all families anytime, anywhere”, Brigii is proving to be a comprehensive business dedicated to researching, refining, and producing products that ease consumers’ day-to-day activities.

TD Holdings, Inc. Reports First Quarter 2023 Financial Results

SHENZHEN, China, May 13, 2023 /PRNewswire/ — TD Holdings, Inc. (Nasdaq: GLG) (the “Company”), a commodities trading service provider in China, today announced its unaudited financial results for the first quarter ended March 31, 2023.

Ms. Renmei Ouyang, the Chief Executive Officer of the Company, stated, “We continued to provide unparalleled services to our clients and explore new partnerships to address the market opportunities in the first quarter of fiscal year 2023. In the remaining of 2023, we will continue to execute our development plan to expand our business scale and improve our brand awareness. We will remain focus on the optimization of our commodities trading business and supply chain service business to expand our client base. We believe our dedicated and experienced team is our foundation to separate us from other competitors and enhance our competitive market position. With the rapid resumption of business activities, we expect to actively explore new corporations, provide high-quality services to best serve our clients’ demand and generate additional revenue sources. In addition to the growth plan, we expect to improve our efficiency by implementing necessary measures. We remain confident about our future prospects with our long-term development strategy on seeking growth opportunities in our business.”

First Quarter 2023 Financial Highlights

Total revenue was $34.58 million, consisting of $34.57 million from sales of commodity products, and $0.01 million from supply chain management services for the quarter ended March 31, 2023, a decrease of 28% from $48.16 million for the same quarter ended March 31, 2022.

Net income was $0.45 million for the quarter ended March 31, 2023, compared with $1.59 million for the same quarter ended March 31, 2022.

Basic and diluted earnings per share were $0.00 respectively, for the quarter ended March 31, 2023, compared with $0.04 for the same quarter ended March 31, 2022.

First Quarter 2023 Financial Results

Revenues

For the quarter ended March 31, 2023, the Company sold non-ferrous metals to 14 third-party customers at fixed prices, and earned revenues when the product ownership was transferred to its customers. The Company earned revenues of $34.57 million from sales of commodity products for the quarter ended March 31, 2023, compared with $47.58 million for the same quarter ended March 31, 2022.

For the quarter ended March 31, 2023, the Company recorded revenue of $0.01 million from supply chain management services to third-party customers, compared with $0.58 million to third-party vendors for the same quarter ended March 31, 2022.

Cost of Revenue

Cost of revenue primarily includes cost of revenue associated with commodity product sales and cost of revenue associated with management services of supply chain. Total cost of revenue decreased by $12.95 million, or 27% to $34.65 million for the quarter ended March 31, 2023, from $47.60 million for the same quarter ended March 31, 2022, primarily due to the decrease in the cost of revenue associated with commodity product sales.

Selling, General, and Administrative Expenses

Selling, general and administrative expenses increased by $0.50 million or 22%, to $2.74 million for the quarter ended March 31, 2023, from $2.25 million for the same quarter ended March 31, 2022. Selling, general and administrative expenses primarily consisted of salary and employee benefits, office rental expenses, amortizations of intangible assets and convertible promissory notes, professional service fees and finance offering related fees. The increase was mainly attributable to the amortization of intangible assets of $2.05 million, as the company acquired a software copyright of the original amount of RMB300 million in connection with the contractual arrangement with Shenzhen Tongdow Internet Technology Co., Ltd. on October 25, 2022, which contributed $1.10 million to selling, general, and administrative expenses for the three months ended March 31, 2022.

Interest Income

Interest income was primarily generated from loans made to third parties and related parties. Interest income increased by $0.06 million or 1%, to $4.45 million for the quarter ended March 31, 2023, from $4.39 million for the same quarter ended March 31, 2022.

Amortization of Beneficial Conversion Feature and Relative Fair Value of Warrants Relating to the Issuance of Convertible Promissory Notes  

For the quarter ended March 31, 2023, the item represented the amortization of beneficial conversion feature of $0.22 million of two convertible promissory notes issued on May 6, 2022 and March 13, 2023.

For the same quarter ended March 31, 2022, the item represented the amortization of beneficial conversion feature of $0.21 million of three convertible promissory notes issued on January 6, 2021, March 4, 2021 and October 4, 2021.

Net Income

Net income was $0.45 million for the quarter ended March 31, 2023, compared with $1.59 million for the same quarter ended March 31, 2022.

Three Months Ended March 31, 2023 Cash Flows

As of March 31, 2023, the Company had cash and cash equivalents of $1.98 million, as compared with $0.89 million as of December 31, 2022.

Net cash provided by operating activities was $2.77 million for the quarter ended March 31, 2023, compared with $3.75 million for the same quarter ended March 31, 2022.

Net cash used in investing activities was $46.69 million for the quarter ended March 31, 2023, compared with $50.00 million for the same quarter ended March 31, 2022.

Net cash provided by financing activities was $45.91 million for the quarter ended March 31, 2023, compared with $45.50 million for the same quarter ended March 31, 2022.

About TD Holdings, Inc.

TD Holdings, Inc. is a service provider currently engaging in the commodities trading business and supply chain service business in China. Its commodities trading business primarily involves purchasing non-ferrous metal products from upstream metal and mineral suppliers and then selling to downstream customers. Its supply chain service business primarily has served as a one-stop commodity supply chain service and digital intelligence supply chain platform integrating upstream and downstream enterprises, warehouses, logistics, information, and futures trading. For more information, please visit http://ir.tdglg.com.

Safe Harbor Statement

This press release may contain certain “forward-looking statements” relating to the business of TD Holdings, Inc. and its subsidiary companies. All statements, other than statements of historical fact included herein are “forward-looking statements.” These forward-looking statements are often identified by the use of forward-looking terminology such as “believes,” “expects” or similar expressions, involve known and unknown risks and uncertainties. Although the Company believes that the expectations reflected in these forward-looking statements are reasonable, they do involve assumptions, risks and uncertainties, and these expectations may prove to be incorrect. The following factors, among others, could cause actual results to differ materially from those described in these forward-looking statements: there is uncertainty about the spread of the COVID-19 virus and the impact it will have on the Company’s operations, the demand for the Company’s products and services, global supply chains and economic activity in general. Investors should not place undue reliance on these forward-looking statements, which speak only as of the date of this press release. The Company’s actual results could differ materially from those anticipated in these forward-looking statements as a result of a variety of factors, including those discussed in the Company’s periodic reports that are filed with the Securities and Exchange Commission and available on its website at http://www.sec.gov. All forward-looking statements attributable to the Company or persons acting on its behalf are expressly qualified in their entirety by these factors. Other than as required under the securities laws, the Company does not assume a duty to update these forward-looking statements.

For more information, please contact:

Ascent Investor Relations LLC
Ms. Tina Xiao
Email:tina.xiao@ascent-ir.com 
Tel: +1 917 609 0333

TD HOLDINGS, INC.

UNAUDITED CONDENSED CONSOLIDATED BALANCE SHEETS

As of March 31, 2023 and December 31, 2022

(Expressed in U.S. dollars, except for the number of shares)

March 31,

December 31,

2023

2022

ASSETS

Current Assets

Cash and cash equivalents

$

1,981,012

$

893,057

Loans receivable from third parties

191,630,240

143,174,634

Other current assets

4,991,860

4,040,477

Inventories, net

415,718

458,157

Total current assets

199,018,830

148,566,325

Non-Current Assets

Plant and equipment, net

5,239

6,370

Goodwill

162,379,512

160,213,550

Intangible assets, net

52,803,772

54,114,727

Right-of-use assets, net

168,458

196,826

Total non-current assets

215,356,981

214,531,473

Total Assets

$

414,375,811

$

363,097,798

LIABILITIES AND EQUITY

Current Liabilities

Accounts payable

$

$

1,269

Bank borrowings

1,018,671

1,005,083

Third party loans payable

472,842

460,587

Contract liabilities

18,395

437,148

Income tax payable

12,835,992

11,634,987

Lease liabilities

109,977

116,170

Other current liabilities

5,654,669

5,348,646

Convertible promissory notes

4,635,456

4,208,141

Total current liabilities

24,746,002

23,212,031

Non-Current Liabilities

Due to related party

39,291,587

38,767,481

Deferred tax liabilities

2,907,489

3,059,953

Lease liabilities

62,396

84,164

Total non-current liabilities

42,261,472

41,911,598

Total liabilities

67,007,474

65,123,629

Commitments and Contingencies (Note 16)

Equity

Common stock (par value $0.001 per share, 600,000,000 shares authorized;
144,841,328 and 106,742,117 shares issued and outstanding as of March 31, 2023
and December 31, 2022, respectively)*

144,841

106,742

Additional paid-in capital

390,154,966

344,295,992

Statutory surplus reserve

2,602,667

2,602,667

Accumulated deficit

(37,950,132)

(38,800,375)

Accumulated other comprehensive income

(5,939,107)

(8,984,925)

Total TD Shareholders’ Equity

349,013,235

299,220,101

Non-controlling interest

(1,644,898)

(1,245,932)

Total Equity

347,368,337

297,974,169

Total Liabilities and Equity

$

414,375,811

$

363,097,798

* Retrospectively restated due to five for one Reverse Stock Split, see Note 12 – Reverse stock split of common stock.

TD HOLDINGS, INC.

UNAUDITED CONDENSED CONSOLIDATED STATEMENTS OF OPERATIONS AND

COMPREHENSIVE INCOME (LOSS)

For the Three Months Ended March 31, 2023 and 2022

(Expressed in U.S. dollars, except for the number of shares)

For the Three Months
Ended
March 31,

2023

2022

Revenues

    - Sales of commodity products – third parties

$

34,571,288

$

47,583,965

    - Supply chain management services – third parties

6,350

575,151

Total revenue

34,577,638

48,159,116

Cost of revenues

    - Commodity product sales-third parties

(34,653,239)

(47,590,576)

    - Supply chain management services-third parties

(40)

(11,602)

Total operating costs

(34,653,279)

(47,602,178)

Gross (loss)/profit

(75,641)

556,938

Operating expenses

Selling, general, and administrative expenses

(2,743,061)

(2,247,707)

Total operating expenses

(2,743,061)

(2,247,707)

Net Operating Loss

(2,818,702)

(1,690,769)

Other income (expenses), net

Interest income

4,449,000

4,390,341

Interest expenses

(109,987)

(110,326)

Amortization of beneficial conversion feature relating to issuance of convertible
promissory notes

(220,652)

(213,367)

Other income, net

4,523

95,709

Total other income, net

4,122,884

4,162,357

Net income before income taxes

1,304,182

2,471,588

Income tax expenses

(852,905)

(877,731)

Net income

451,277

1,593,857

Less: Net loss attributable to non-controlling interests

(398,966)

Net income attributable to TD Holdings, Inc.’s Stockholders

850,243

1,593,857

Comprehensive Income

Net income

451,277

1,593,857

Foreign currency translation adjustments

3,045,818

881,196

Comprehensive Income

$

3,497,095

$

2,475,053

Less: Total comprehensive loss attributable to non-controlling interests

(398,966)

Comprehensive income attributable to TD Holdings, Inc.’s Stockholders

$

3,896,061

$

2,475,053

Income per share – basic and diluted

Continuing Operation- income per share – basic*

$

0.00

$

0.04

Continuing Operation- income per share –diluted*

$

0.00

$

0.04

Weighted Average Shares Outstanding-Basic*

140,045,132

39,688,232

Weighted Average Shares Outstanding- Diluted*

148,121,900

42,710,590

*  Retrospectively restated due to five for one Reverse Stock Split, see Note 12 – Reverse stock split of common stock


TD HOLDINGS, INC.

UNAUDITED CONDENSED CONSOLIDATED STATEMENTS OF CASH FLOWS

For the Three Months Ended March 31, 2023 and 2022

(Expressed in U.S. dollar)

For the Three Months

Ended March 31,

2023

2022

Cash Flows from Operating Activities:

Net income

$

451,277

$

1,593,857

Adjustments to reconcile net income to net cash used in operating activities:

Depreciation of plant and equipment

1,215

3,217

Amortization of intangible assets

2,049,732

1,029,186

Amortization of right of use assets

30,846

76,983

Amortization of discount on convertible promissory notes

93,333

111,000

Interest expense for convertible promissory notes

101,330

93,285

Amortization of beneficial conversion feature of convertible promissory notes

220,652

213,367

Monitoring fee relating to convertible promissory notes

69,685

Deferred tax liabilities

(194,515)

(209,744)

Inventories impairment

(17,229)

Escrow account receivable

(54,985)

Inventories

66,033

(133,810)

Other current assets

(24,222)

(29,775)

Prepayments

447,960

(1,891,842)

Contract liabilities

(426,158)

1,900,456

Due to related parties

(21,259)

Due from third parties

(628,474)

(481,816)

Due from related parties

(685,488)

28,897

Accounts payable

(1,291)

(116,078)

Income tax payable

1,047,382

1,085,694

Other current liabilities

259,083

499,661

Lease liabilities

(30,476)

(19,734)

Due to third party loans payable

6,050

6,523

Net cash provided by operating activities

2,767,040

3,752,768

Cash Flows from Investing Activities:

Purchases of plant and equipment

(5,039)

Purchases of operating lease assets

(58,617)

Loans made to third parties

(46,678,620)

(60,177,853)

Collection of loans from related parties

11,066,822

Investments in other investing activities

(10,707)

(828,601)

Net cash used in investing activities

(46,689,327)

(50,003,288)

Cash Flows from Financing Activities:

Proceeds from issuance of common stock under ATM transaction

559,073

Proceeds from issuance of common stock under private placement transactions

42,350,000

45,500,000

Proceeds from convertible promissory notes

3,000,000

Net cash provided by financing activities

45,909,073

45,500,000

Effect of exchange rate changes on cash and cash equivalents

(898,831)

13,794

Net increase/(decrease) in cash and cash equivalents

1,087,955

(736,726)

Cash and cash equivalents at beginning of period

893,057

4,311,068

Cash and cash equivalents at end of period

$

1,981,012

$

3,574,342

Supplemental Cash Flow Information

Cash paid for interest expenses

$

19,934

$

22,109

Cash paid for income taxes

$

$

1,781

Supplemental disclosure of Non-cash investing and financing activities

Right-of-use assets obtained in exchange for operating lease obligations

$

$

58,617

Issuance of common stocks in connection with conversion of convertible promissory
    notes

$

2,988,000

$

1,804,820

Source: TD Holdings, Inc.

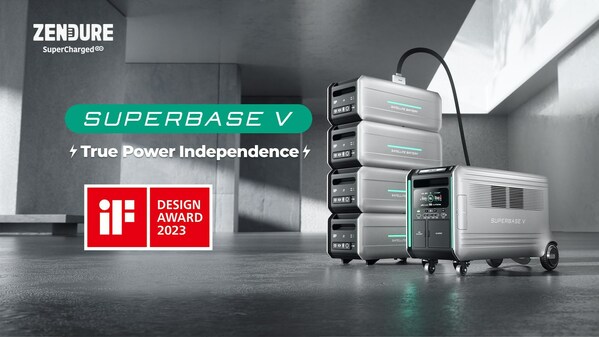
Zendure SuperBase V Named Winner of Four iF DESIGN AWARDS

Zendure’s Flagship SuperBase V, Plus Satellite Battery, Home Panel and Packaging, Win iF DESIGN AWARDS Amid 11,000 Entries

PALO ALTO, Calif., May 13, 2023 /PRNewswire/ — Zendure, one of the fastest-growing global energy tech start-ups, was named a winner of four of this year’s iF DESIGN AWARDS, the world-renowned design prize. The company’s SuperBase V, as well as the satellite battery, home panel and packaging, were all recognized with this highly coveted award.


Each year, the world’s oldest independent design organization, Hannover-based iF International Forum Design GmbH, organizes the iF DESIGN AWARD. In several instances, Zendure won over the 133-member jury, made up of independent experts from all over the world, with their innovative designs. The competition was steep: almost 11,000 entries were submitted from 56 countries in hopes of receiving the seal of quality.

SuperBase V is the first modular, portable power station with semi-solid state batteries to provide more reliable, safer, cleaner energy when and where users need it most. With up to 64kWh of expandable power and dual voltage output, SuperBase V stands out as true innovation. It is an ideal and clean option for RV and off-grid living, trade professionals, EV charging, whole-home power needs and as emergency back-up when sudden outages occur.

“We are honored to have our design recognized by such a renowned organization,” said Jolene Shang, Chief Marketing Officer at Zendure, “We strive to deliver reliable and affordable clean energy for households worldwide by popularizing the latest EnergyTech, with a key focus on user-centric and innovative design. By putting the needs of our users first, we can create products that not only look sleek and modern but also enhance the user experience. By prioritizing innovation and design, we are confident that we can provide our customers with the best possible clean energy solutions that are both practical and stylish.”

More information about Zendure’s winning entries can be found at https://ifdesign.com/en/brands-creatives/company/zendure-usa-inc/17765.

ABOUT ZENDURE

Founded in 2017, Zendure is one of the fastest-growing EnergyTech start-ups located in the technology hubs of Silicon Valley, USA, and the Greater Bay Area, China, Japan, and Germany. Our purpose is to accelerate a sustainable future. Our mission is to deliver reliable and affordable clean energy for households worldwide by popularizing the latest EnergyTech. We envision being a Clean EnergyTech platform that sustains communities and families. Our successes include SuperBase M, SuperBase Pro and the first Plug & Play Home Energy Storage System – SuperBase V, along with our line of Satellite Batteries, Smart Home Panel, Smart Plug, EV Charger and Remote Energy Management App. Our revolutionary Balcony Energy Storage System SolarFlow turns sunlight into a safe, reliable and resilient source of energy to power our daily life.

To learn more visit Zendure.com and follow Zendure on Facebook, Instagram, Twitter, and LinkedIn.

ABOUT THE iF DESIGN AWARD

Since 1954, the iF DESIGN AWARD has been recognized as an arbiter of quality for excellent design. The iF Design brand is renowned worldwide for outstanding design services, and the iF DESIGN AWARD is one of the most important design prizes in the world. It honors design achievements in all disciplines: product, packaging, communication and service design, architecture and interior architecture as well as professional concept, user experience (UX) and user interface (UI). All award-winning entries are featured on www.ifdesign.com.

Source: Zendure USA Inc.

J&T Express and SF Express reach agreement to acquire 100% share rights of Fengwang Express for RMB 1.183 billion


SHANGHAI, May 12, 2023 /PRNewswire/ — Global logistics service provider, J&T Express today announced that it has entered into a Share Transfer Agreement with Shenzhen Fengwang Holdings Co., Ltd. (“Fengwang Holdings”), a subsidiary of S.F. Holding Co., Ltd. (002352.SZ). J&T Express’ subsidiary J&T Express (Shenzhen) Supply Chain Co., Ltd. will acquire 100% share rights of Fengwang Holding’s wholly-owned subsidiary, Shenzhen Fengwang Information Technology Co., Ltd. (“Fengwang Information”), for RMB 1.183 billion. This transaction is subject to several prerequisites, the Examination of Concentrations of Undertakings by the State Administration for Market Regulation, and the transaction consideration being settled in a timely manner according to the Share Transfer Agreement.

J&T Express has been making significant strides in the e-commerce express delivery sector since its entry into the Chinese market in 2020. The company has successfully acquired Best Inc.’s express business in China in late 2021. Shenzhen Fengwang Express Co., Ltd. (“Fengwang Express”) is a wholly-owned subsidiary of Fengwang Information. Fengwang Express’ network currently covers 27 provinces, municipalities and autonomous regions across China, providing high quality services to e-commerce customers. In 2022, Fengwang’s revenue exceeded RMB 3.2 billion. The overall network service quality is stable.

J&T Express has expressed its commitment to continuously optimizing the service experience as part of its focus on the e-commerce express delivery service industry. This acquisition will enhance the integrated service capabilities of J&T Express. This move is expected to foster high-quality development of the industry allowing it to further increase its competitive advantage in the e-commerce delivery sector and contribute to the high-quality development of the industry.

S.F. said that the resources of two sides are complementary, this will help ensure the smooth transition of the transaction. Looking forward, S.F. can focus more on the development of its core businesses such as domestic mid-to-high-end express, international express, global supply chain services and digital supply chain services. Meanwhile, S.F. will continue to build e-commerce express delivery products and services and meet the diversified needs of customers in the high-end express delivery market.

About J&T Express

J&T Express is a global logistics service provider with leading express delivery businesses in Southeast Asia and China, the largest and fastest-growing market in the world. Founded in 2015, J&T Express’ network spans thirteen countries, including Indonesia, Vietnam, Malaysia, the Philippines, Thailand, Cambodia, Singapore, China, Saudi Arabia, the UAE, Mexico, Brazil and Egypt. Adhering to its “customer-oriented and efficiency-based” mission, J&T Express is committed to providing customers with integrated logistics solutions through intelligent infrastructure and digital logistics network, as part of its global strategy to connect the world with greater efficiency and bring logistical benefits to all.

About S.F.  

SF is the largest integrated logistics service provider in China, and the fourth largest express delivery enterprise in the world, providing domestic and international end-to-end one-stop supply chain services. At the same time, relying on leading scientific and technological research and development capabilities, SF is committed to building the digital supply chain ecology and becoming a leader in the global intelligent supply chain. After years of dedicated operation, SF has earned considerable reputation and popularity in the industry, and has established the “rapid, punctual and safe” brand image. It takes the lead in multiple segments and continues to lead in the industry.

Infobird Co., Ltd Announces 1-for-5 Share Consolidation

BEIJING, May 12, 2023 /PRNewswire/ — Infobird Co., Ltd (NASDAQ: IFBD) (“Infobird” or the “Company”), a software-as-a-service provider of AI-powered customer engagement solutions in China, today announced that it plans to implement a 1-for-5 share consolidation of its ordinary shares (the “Share Consolidation”), effective on May 15, 2023.

Beginning with the opening of trading on May 15, 2023, the Company’s ordinary shares will begin trading on a post-Share Consolidation basis on the Nasdaq Capital Market under the same symbol “IFBD”, but under a new CUSIP number of G47724110. The objective of the Share Consolidation is to enable the Company to regain compliance with Nasdaq Marketplace Rule 5550(a)(2) and maintain its listing on the Nasdaq Capital Market.

Upon the effectiveness of the Share Consolidation, every five issued and outstanding ordinary shares of a par value of US$0.005 each will automatically be converted into one issued and outstanding ordinary share of a par value of US$0.025 each. No fractional shares will be issued as a result of the Share Consolidation. Instead, any fractional shares that would have resulted from the Share Consolidation will be rounded up to the next whole number. The Share Consolidation affects all shareholders uniformly and will not alter any shareholder’s percentage interest in the Company’s outstanding ordinary shares, except for adjustments that may result from the treatment of fractional shares.

The Share Consolidation was approved by the Company’s board of directors on April 26, 2023 and its shareholders on May 12, 2023. The Company has filed a Fourth Amended and Restated Memorandum and Articles of Association with the Cayman Islands Registrar of Companies.

About Infobird Co., Ltd

Infobird, headquartered in Beijing, China, is a software-as-a-service provider of innovative AI-powered, or artificial intelligence enabled, customer engagement solutions in China. For more information, visit Infobird’s website at www.Infobird.com.

Forward-Looking Statements

This press release contains certain forward-looking statements within the meaning of the Private Securities Litigation Reform Act of 1995. Words such as “plans”, “will,” “future,” “expects,” “believes,” and “intends,” or similar expressions, are intended to identify forward-looking statements. Statements that are not historical facts, including statements about the Company’s beliefs and expectations, are forward-looking statements. All forward-looking statements are inherently uncertain as they are based on current expectations and assumptions concerning future events, results, conditions or performance of the Company. Readers are cautioned not to place undue reliance on these forward-looking statements, which are only predictions and speak only as of the date they are made. In evaluating such statements, investors and prospective investors should review carefully various risks and uncertainties and other matters identified in the Company’s filings with the U.S. Securities and Exchange Commission. These risks and uncertainties could cause the Company’s actual results to differ materially from those indicated in the forward-looking statements. The Company undertakes no obligation to publicly update or revise any forward-looking statements, whether as a result of new information, future events or otherwise, except as may be required by law.

Dingdong (Cayman) Limited Announces First Quarter 2023 Financial Results

SHANGHAI, May 12, 2023 /PRNewswire/ — Dingdong (Cayman) Limited (“Dingdong” or the “Company”) (NYSE: DDL), a leading fresh grocery e-commerce company in China, with advanced supply chain capabilities, today announced its unaudited financial results for the quarter ended March 31, 2023.

First Quarter 2023 Highlights:

  • GMV for the first quarter of 2023 decreased by 6.8% year over year to RMB5,451.2 million (US$793.8 million) from RMB5,851.3 million in the same quarter of 2022, primarily due to decreased consumer demand in the first quarter of 2023, as most of the pandemic restrictive measures were lifted. In contrast, consumer demand in the first quarter of 2022 was excessively high due to a series of restrictive measures implemented by local governments to contain the spread of the Omicron variant, in particular, during the city-wide lockdown in Shanghai last March. GMV in the first quarter of 2023 was also adversely affected by the Company’s withdrawal from several cities in 2022, due to difficulties in attaining profitability in these markets in the short term. Furthermore, the company reduced using subsidies and discounted pricing to attract and retain customers, which caused a temporary decrease in GMV.  Excluding March, GMV generated in January and February 2023 increased by 5.3% year over year to RMB3,600.9 million (US$524.3 million) from RMB3,420.7 million in the same period of 2022.
  • Fulfillment expenses for the first quarter of 2023 were RMB1,196.1 million (US$174.2 million), a decrease of 19.4% from RMB1,484.1 million in the same quarter of 2022. Fulfillment expenses as a percentage of total revenues decreased to 23.9% from 27.3% in the same quarter of 2022.
  • Non-GAAP net income for the first quarter of 2023 was RMB6.1 million (US$0.9 million), compared with non-GAAP net loss of RMB422.2 million in the same quarter of 2022.

Mr. Changlin Liang, Founder and Chief Executive Officer of Dingdong, stated,

“During the first quarter of 2023, there was reduced consumer demand for our products as China lifted its dynamic zero-COVID policy and people were traveling during the Chinese New Year and engaging in spring outings. We also incurred additional expenses and labor costs to ensure timely order fulfillment during the holiday. Despite these setbacks, we are proud that we were still able to achieve our expected non-GAAP breakeven this quarter.

Dingdong is a start-up dedicated to providing safe, healthy, and delicious food to users. Our mission is to innovate relentlessly for the betterment of people’s lives. We will leave no stone unturned to create value for consumers and society, while adhering to our roots and maintaining strict discipline. Our beliefs extend far beyond mere profitability, fueling our passion and drive to achieve success both now and in the future.”

Ms. Le Yu, Chief Strategy Officer of Dingdong, stated,

“In the first quarter of 2023, we recorded RMB5.45 billion GMV, with a year-over-year decrease of 6.8%, meanwhile our revenue was RMB5.0 billion, with a year-over-year decrease of 8.2%. To break it down, our GMV in January and February increased by 5.3% as compared to the same period of last year, and the decline in March was a comparison with the high base resulting from the lockdown in Shanghai last March. On a year-over-year basis, gross margin, fulfillment expense ratio, sales and marketing expense ratio, G&A expense ratio and product development expense ratio all were optimized. Our success in the first quarter adds confidence in our ability to achieve a full-year non-GAAP breakeven for 2023.”

First Quarter 2023 Financial Results

Total revenues were RMB4,997.5 million (US$727.7 million), representing a decrease of 8.2% from RMB5,443.7 million in the same quarter of 2022, which was primarily due to decreased consumer demand in the first quarter of 2023. In contrast, consumer demand in the first quarter of 2022 was excessively high due to a series of restrictive measures implemented by local governments to contain the spread of the Omicron variant, in particular, during the city-wide lockdown in Shanghai last March. Total revenues for the first quarter of 2023 was also adversely affected by the Company’s withdrawal from several cities in 2022, due to difficulties in attaining profitability in these markets in the short term. Total revenues for the first two months of 2023 increased by 5.2% year over year to RMB3,302.8 million (US$480.9 million) from RMB3,140.3 million in the same period of 2022.

  • Product Revenues were RMB4,937.8 million (US$719.0 million), a decrease of 8.1% from RMB5,375.1 million in the same quarter of 2022. Excluding March, total product revenues for the first two months of 2023 increased by 5.3% year over year to RMB3,261.8 million (US$475.0 million) from RMB3,096.2 million in the same period of 2022.
  • Service Revenues were RMB59.7 million (US$8.7 million), a decrease of 12.9% from RMB68.6 million in the same quarter of 2022, primarily because the Company was proactively optimizing its membership structure.

Total operating costs and expenses were RMB5,043.3 million (US$734.4 million), a decrease of 14.4% from RMB5,892.3 million in the same quarter of 2022, with a detailed breakdown as below.  

  • Cost of goods sold was RMB3,462.3 million (US$504.2 million), a decrease of 10.7% from RMB3,879.3 million in the same quarter of 2022. Cost of goods sold as a percentage of revenues decreased to 69.3% from 71.3% in the same quarter of 2022, primarily due to improvements in product development capabilities. Gross margin was 30.7%, a significant improvement from 28.7% in the same quarter of 2022.
  • Fulfillment expenses were RMB1,196.1 million (US$174.2 million), a decrease of 19.4% from RMB1,484.1 million in the same quarter of 2022. Fulfillment expenses as a percentage of total revenues decreased to 23.9% from 27.3% in the same quarter of 2022, mainly driven by the increase in average order value and improved frontline fulfillment labor efficiency.
  • Sales and marketing expenses were RMB87.5 million (US$12.7 million), a decrease of 50.3% from RMB176.1 million in the same quarter of 2022, as user acquisition cost per new transacting user decreased due to the Company’s improved product development capabilities and increasingly established brand image.
  • General and administrative expenses were RMB86.8 million (US$12.6 million), a decrease of 26.9% from RMB118.7 million in the same quarter of 2022, mainly due to the improved efficiency of our staff.
  • Product development expenses were RMB210.6 million (US$30.7 million), a decrease of 10.0% from RMB233.9 million in the same quarter of 2022, primarily due to the Company’s improved R&D efficiency. While advocating on energy and resource saving, the Company will continue its investments in product development capabilities, agricultural technology, data algorithms, and other technology infrastructure, to further enhance its competitiveness.

Loss from operations was narrowed to RMB50.1 million (US$7.3 million), compared with operating loss of RMB461.7 million in the same quarter of 2022.

Net loss was narrowed to RMB52.4 million (US$7.6 million), compared with net loss of RMB477.4 million in the same quarter of 2022.

Non-GAAP net income, which is a non-GAAP measure that excludes share-based compensation expenses, was RMB6.1 million (US$0.9 million), a significant improvement from non-GAAP net loss of RMB422.2 million in the same quarter of 2022. In addition, non-GAAP net margin, which is the Company’s non-GAAP net income / (loss) as a percentage of revenues, improved to 0.1% from negative 7.8% in the same quarter of 2022.

Basic and diluted net loss per share were RMB0.17 (US$0.02), compared with net loss per share of RMB1.48 in the same quarter of 2022. Non-GAAP net income per share, basic and diluted, was RMB0.01 (US$0.00), compared with non-GAAP net loss per share of RMB1.31 in the same quarter of 2022.

Cash and cash equivalents and short-term investments were RMB5,700.2 million (US$830.0 million) as of March 31, 2023, compared with RMB6,493.0 million as of December 31, 2022.

Conference Call

The Company’s management will hold an earnings conference call at 8:00 A.M. Eastern Time on Friday, May 12, 2023 (8:00 P.M. Beijing Time on the same day) to discuss the financial results. The presentation and question and answer session will be presented in both Mandarin and English. Listeners may access the call by dialing the following numbers:

International:

1-412-317-6061

United States Toll Free:

1-888-317-6003

Mainland China Toll Free:

4001-206115

Hong Kong Toll Free:

800-963976

Conference ID:

7302404

The replay will be accessible through May 19, 2023 by dialing the following numbers:

International:

1-412-317-0088

United States:

1-877-344-7529

Access Code:

5972888

A live and archived webcast of the conference call will also be available at the Company’s investor relations website at https://ir.100.me.

About Dingdong (Cayman) Limited

We are a leading fresh grocery e-commerce company in China, with sustainable long-term growth. We directly provide users and households with fresh produce, prepared food, and other food products through a convenient and excellent shopping experience supported by an extensive self-operated frontline fulfillment grid. Leveraging our deep insights into consumers’ evolving needs and our strong food innovation capabilities, we have successfully launched a series of private label products spanning a variety of food categories. Many of our private label products are produced at our Dingdong production plants, allowing us to more efficiently produce and offer safe and high-quality food products. We aim to be Chinese families’ first choice for food shopping.

For more information, please visit: https://ir.100.me.

Use of Non-GAAP Financial Measures

The Company uses non-GAAP measures, such as non-GAAP net (loss)/income, non-GAAP net margin, non-GAAP net (loss)/income attributable to ordinary shareholders and non-GAAP net (loss)/income per share, basic and diluted, in evaluating its operating results and for financial and operational decision-making purposes. The Company believes that the non-GAAP financial measures help identify underlying trends in its business by excluding the impact of share-based compensation expenses, which are non-cash charges and do not correlate to any operating activity trends. The Company believes that the non-GAAP financial measures provide useful information about the Company’s results of operations, enhance the overall understanding of the Company’s past performance and future prospects and allow for greater visibility with respect to key metrics used by the Company’s management in its financial and operational decision-making.

The non-GAAP financial measures are not defined under U.S. GAAP and are not presented in accordance with U.S. GAAP. The non-GAAP financial measures have limitations as analytical tools, and when assessing the Company’s operating performance, cash flows or liquidity, investors should not consider them in isolation, or as a substitute for net loss, cash flows provided by operating activities or other consolidated statements of operations and cash flows data prepared in accordance with U.S. GAAP. The Company’s definition of non-GAAP financial measures may differ from those of industry peers and may not be comparable with their non-GAAP financial measures.

The Company mitigates these limitations by reconciling the non-GAAP financial measures to the most comparable U.S. GAAP performance measures, all of which should be considered when evaluating the Company’s performance.

For more information on the non-GAAP financial measures, please see the table captioned “Unaudited Reconciliation of GAAP and Non-GAAP Results” set forth at the end of this announcement.

Exchange Rate Information

This announcement contains translations of certain RMB amounts into U.S. dollars (“US$”) at specified rates solely for the convenience of the reader. Unless otherwise stated, all translations from RMB to US$ were made at the rate of RMB6.8676 to US$1.00, the exchange rate on March 31, 2023 set forth in the H.10 statistical release of the Federal Reserve Board. The Company makes no representation that the RMB or US$ amounts referred could be converted into US$ or RMB, as the case may be, at any particular rate or at all.

Safe Harbor Statement

This announcement contains forward-looking statements. These statements are made under the “safe harbor” provisions of the U.S. Private Securities Litigation Reform Act of 1995. These forward-looking statements can be identified by terminology such as “will,” “expects,” “anticipates,” “aims,” “future,” “intends,” “plans,” “believes,” “estimates,” “confident,” “potential,” “continue,” or other similar expressions. Among other things, business outlook and quotations from management in this announcement, as well as Dingdong’s strategic and operational plans, contain forward-looking statements. Dingdong may also make written or oral forward-looking statements in its periodic reports to the U.S. Securities and Exchange Commission (the “SEC”), in its interim and annual reports to shareholders, in press releases and other written materials and in oral statements made by its officers, directors or employees to third parties. Statements that are not historical facts, including but not limited to statements about Dingdong’s beliefs and expectations, are forward-looking statements. Forward-looking statements involve inherent risks and uncertainties. A number of factors could cause actual results to differ materially from those contained in any forward-looking statement, including but not limited to the following: Dingdong’s goals and strategies; Dingdong’s future business development, financial conditions, and results of operations; the expected outlook of the fresh grocery ecommerce market in China; Dingdong’s expectations regarding demand for and market acceptance of its products and services; Dingdong’s expectations regarding its relationships with its users, clients, business partners, and other stakeholders; competition in Dingdong’s industry; and relevant government policies and regulations relating to Dingdong’s industry, and general economic and business conditions globally and in China and assumptions underlying or related to any of the foregoing. Further information regarding these and other risks is included in the Company’s filings with the SEC. All information provided in this announcement and in the attachments is as of the date of the announcement, and the Company undertakes no duty to update such information, except as required under applicable law.

For investor inquiries, please contact:

Dingdong Fresh
ir@100.me

DINGDONG (CAYMAN) LIMITED
UNAUDITED CONDENSED CONSOLIDATED BALANCE SHEETS
(Amounts in thousands of RMB and US$)

As of

December 31,

2022

March 31,

2023

March 31,

2023

RMB

RMB

US$

(Unaudited)

ASSETS

Current assets:

Cash and cash equivalents

1,856,187

1,778,127

258,915

Restricted cash

2,763

7,714

1,123

Short-term investments

4,636,774

3,922,041

571,093

Accounts receivable, net

141,468

103,933

15,134

Inventories

604,884

478,763

69,713

Advance to suppliers

83,835

72,262

10,522

Prepayments and other current assets

170,336

181,256

26,394

Total current assets

7,496,247

6,544,096

952,894

Non-current assets:

Property and equipment, net

314,980

277,907

40,466

Operating lease right-of-use assets

1,425,117

1,362,000

198,323

Other non-current assets

145,563

145,815

21,232

Total non-current assets

1,885,660

1,785,722

260,021

TOTAL ASSETS

9,381,907

8,329,818

1,212,915

LIABILITIES, MEZZANINE EQUITY AND

SHAREHOLDERS’ EQUITY

Current liabilities:

Accounts payable

1,886,689

1,464,798

213,291

Customer advances and deferred revenue

253,010

241,289

35,134

Accrued expenses and other current
     liabilities

810,963

653,309

95,129

Salary and welfare payable

329,104

334,438

48,698

Operating lease liabilities, current

693,496

704,286

102,552

Short-term borrowings

4,237,978

3,803,576

553,844

Total current liabilities

8,211,240

7,201,696

1,048,648

Non-current liabilities:

Operating lease liabilities, non-current

678,000

615,025

89,555

Other non-current liabilities

75,000

115,067

16,755

Total non-current liabilities

753,000

730,092

106,310

TOTAL LIABILITIES

8,964,240

7,931,788

1,154,958

DINGDONG (CAYMAN) LIMITED
UNAUDITED CONDENSED CONSOLIDATED BALANCE SHEETS (CONTINUED)
(Amounts in thousands of RMB and US$)

As of

December 31,

2022

March 31,

2023

March 31,

2023

RMB

RMB

US$

(Unaudited)

LIABILITIES, MEZZANINE EQUITY AND

SHAREHOLDERS’ EQUITY (CONTINUED)

Mezzanine Equity:

Redeemable noncontrolling interests

107,490

109,550

15,952

TOTAL MEZZANINE EQUITY

107,490

109,550

15,952

Shareholders’ equity

Ordinary shares

4

4

1

Additional paid-in capital

13,922,811

13,982,043

2,035,943

Treasury stock

(20,666)

(20,666)

(3,010)

Accumulated deficit

(13,580,086)

(13,634,537)

(1,985,343)

Accumulated other comprehensive loss

(11,886)

(38,364)

(5,586)

TOTAL SHAREHOLDERS’ EQUITY

310,177

288,480

42,005

TOTAL LIABILITIES, MEZZANINE EQUITY
    AND SHAREHOLDERS’ EQUITY

9,381,907

8,329,818

1,212,915

DINGDONG (CAYMAN) LIMITED
UNAUDITED CONDENSED CONSOLIDATED STATEMENTS OF COMPREHENSIVE LOSS
(Amounts in thousands of RMB and US$, except for number of shares and per share data)

For the three months ended

March 31,

2022

2023

2023

RMB

RMB

US$

(Unaudited)

Revenues:

Product revenues

5,375,090

4,937,763

718,994

Service revenues

68,582

59,715

8,695

Total revenues

5,443,672

4,997,478

727,689

Operating costs and expenses:

Cost of goods sold

(3,879,328)

(3,462,337)

(504,155)

Fulfillment expenses

(1,484,142)

(1,196,059)

(174,160)

Sales and marketing expenses

(176,116)

(87,464)

(12,736)

Product development expenses

(233,915)

(210,635)

(30,671)

General and administrative expenses

(118,771)

(86,842)

(12,645)

Total operating costs and expenses

(5,892,272)

(5,043,337)

(734,367)

Other operating expenses, net

(13,066)

(4,197)

(611)

Loss from operations

(461,666)

(50,056)

(7,289)

Interest income

13,234

33,751

4,915

Interest expenses

(30,708)

(28,876)

(4,205)

Other income, net

1,757

2,866

417

Loss before income tax

(477,383)

(42,315)

(6,162)

Income tax expenses

(10,076)

(1,467)

Net loss

(477,383)

(52,391)

(7,629)

Accretion of redeemable noncontrolling interests

(1,435)

(2,060)

(300)

Net loss attributable to ordinary shareholders

(478,818)

(54,451)

(7,929)

DINGDONG (CAYMAN) LIMITED
UNAUDITED CONDENSED CONSOLIDATED STATEMENTS OF COMPREHENSIVE LOSS
(CONTINUED)
(Amounts in thousands of RMB and US$, except for number of shares and per share data)

For the three months ended

March 31,

2022

2023

2023

RMB

RMB

US$

(Unaudited)

Net loss per Class A and Class B ordinary share:

Basic and diluted

(1.48)

(0.17)

(0.02)

Shares used in net loss per Class A and Class B
    ordinary share computation:

Basic and diluted

324,443,234

324,539,178

324,539,178

Other comprehensive loss, net of tax of nil:

Foreign currency translation adjustments

(24,959)

(26,478)

(3,855)

Comprehensive loss

(502,342)

(78,869)

(11,484)

Accretion of redeemable noncontrolling interests

(1,435)

(2,060)

(300)

Comprehensive loss attributable to ordinary
    shareholders

(503,777)

(80,929)

(11,784)

DINGDONG (CAYMAN) LIMITED
UNAUDITED CONDENSED CONSOLIDATED STATEMENTS OF CASH FLOWS
(Amounts in thousands of RMB and US$)

For the three months ended

March 31,

2022

2023

2023

RMB

RMB

US$

(Unaudited)

Net cash used in operating activities

(385,203)

(306,839)

(44,679)

Net cash generated from investing activities

885,907

669,811

97,532

Net cash generated from / (used in) financing activities

98,991

(432,873)

(63,031)

Effect of exchange rate changes on cash and cash
   equivalents and restricted cash

(3,560)

(3,209)

(468)

Net increase / (decrease) in cash and cash equivalents
and restricted cash

596,135

(73,110)

(10,646)

Cash and cash equivalents and restricted cash at the
    beginning of the period

670,432

1,858,951

270,684

Cash and cash equivalents and restricted cash at the
    end of the period

1,266,567

1,785,841

260,038

DINGDONG (CAYMAN) LIMITED 
UNAUDITED RECONCILIATION OF GAAP AND NON-GAAP RESULTS 
(Amounts in thousands of RMB and US$, except for number of shares and per share data)

For the three months ended

March 31,

2022

2023

2023

RMB

RMB

US$

(Unaudited)

Net loss

(477,383)

(52,391)

(7,629)

Add: share-based compensation expenses (1)

55,174

58,462

8,513

Non-GAAP net (loss) / income

(422,209)

6,071

884

Net loss margin

(8.8 %)

(1.1 %)

(1.1 %)

Add: share-based compensation expenses

1.0 %

1.2 %

1.2 %

Non-GAAP net (loss) / income margin

(7.8 %)

0.1 %

0.1 %

Net loss attributable to ordinary shareholders

(478,818)

(54,451)

(7,929)

Add: share-based compensation expenses (1)

55,174

58,462

8,513

Non-GAAP net (loss) / income attributable to ordinary
    shareholders

(423,644)

4,011

584

Net loss per Class A and Class B ordinary share:

Basic and diluted

(1.48)

(0.17)

(0.02)

Add: share-based compensation expenses

0.17

0.18

0.02

Non-GAAP net (loss) / income per Class A and Class B
    ordinary share:

       Basic and diluted

(1.31)

0.01

0.00

(1) Share-based compensation expenses are recognized as follows:

For the three months ended

March 31,

2022

2023

2023

RMB

RMB

US$

(Unaudited)

Fulfillment expenses

12,116

11,970

1,743

Sales and marketing expenses

(255)

789

115

Product development expenses

26,037

28,424

4,139

General and administrative expenses

17,276

17,279

2,516

Total

55,174

58,462

8,513

The Sony Xperia 1V is Here – Mark V, Not Vee, Coming Soon for MYR 6,399 Onward

Sony’s Xperia flagships is always something we look forward to. Since its rebirth, the Xperia 1 brand is a household name for those who wants a unique flagship that is completely different from the ones you see in the regular stores. If you noticed, the Xperia 1 smartphone has never really been sold via the network carriers. They are sold almost exclusively by retail partners and Sony flagship stores. That is only one reason why the Xperia 1 series smartphones are so unique.

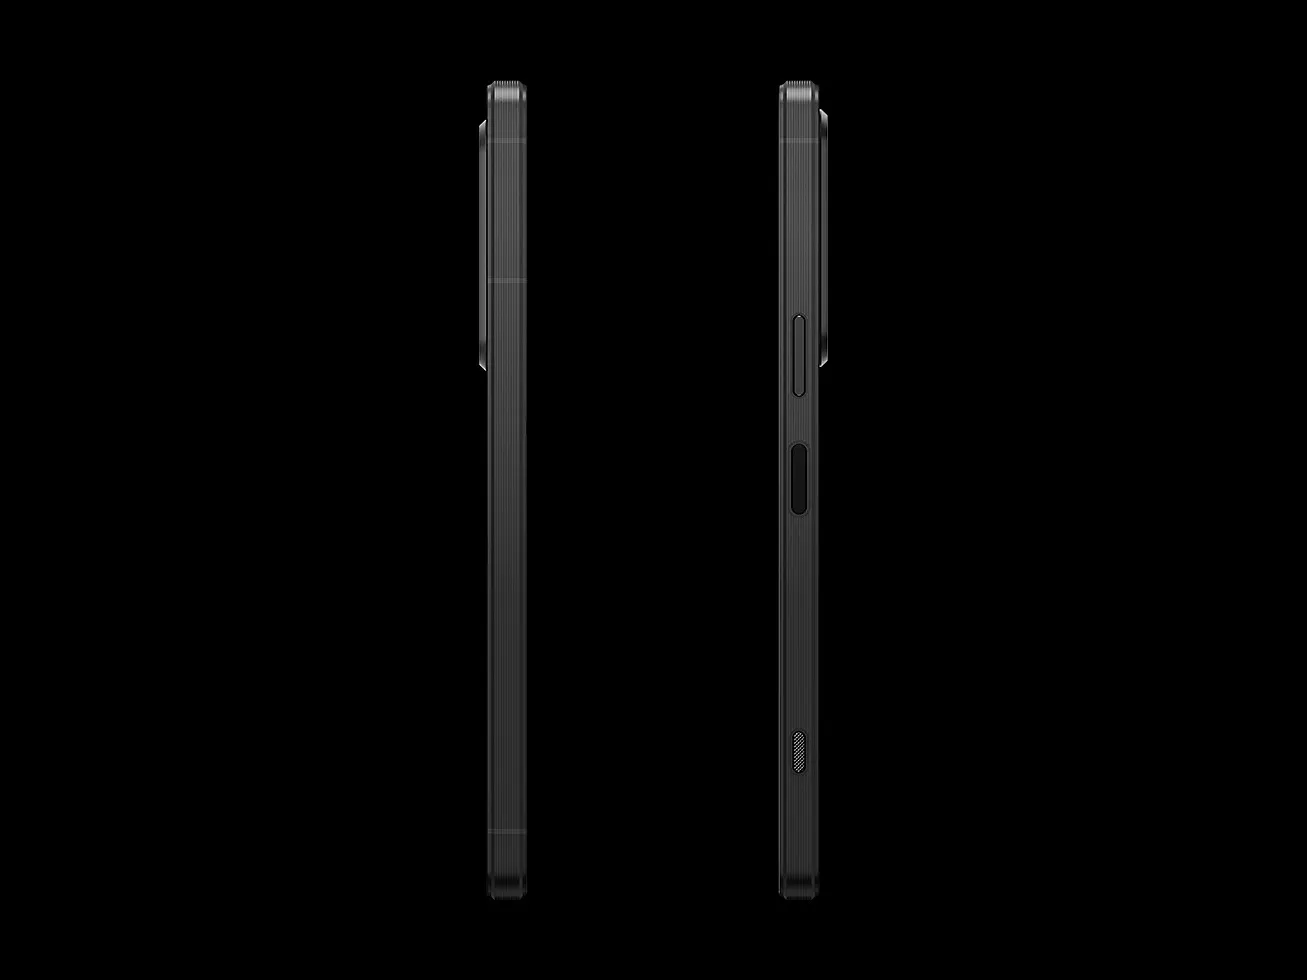
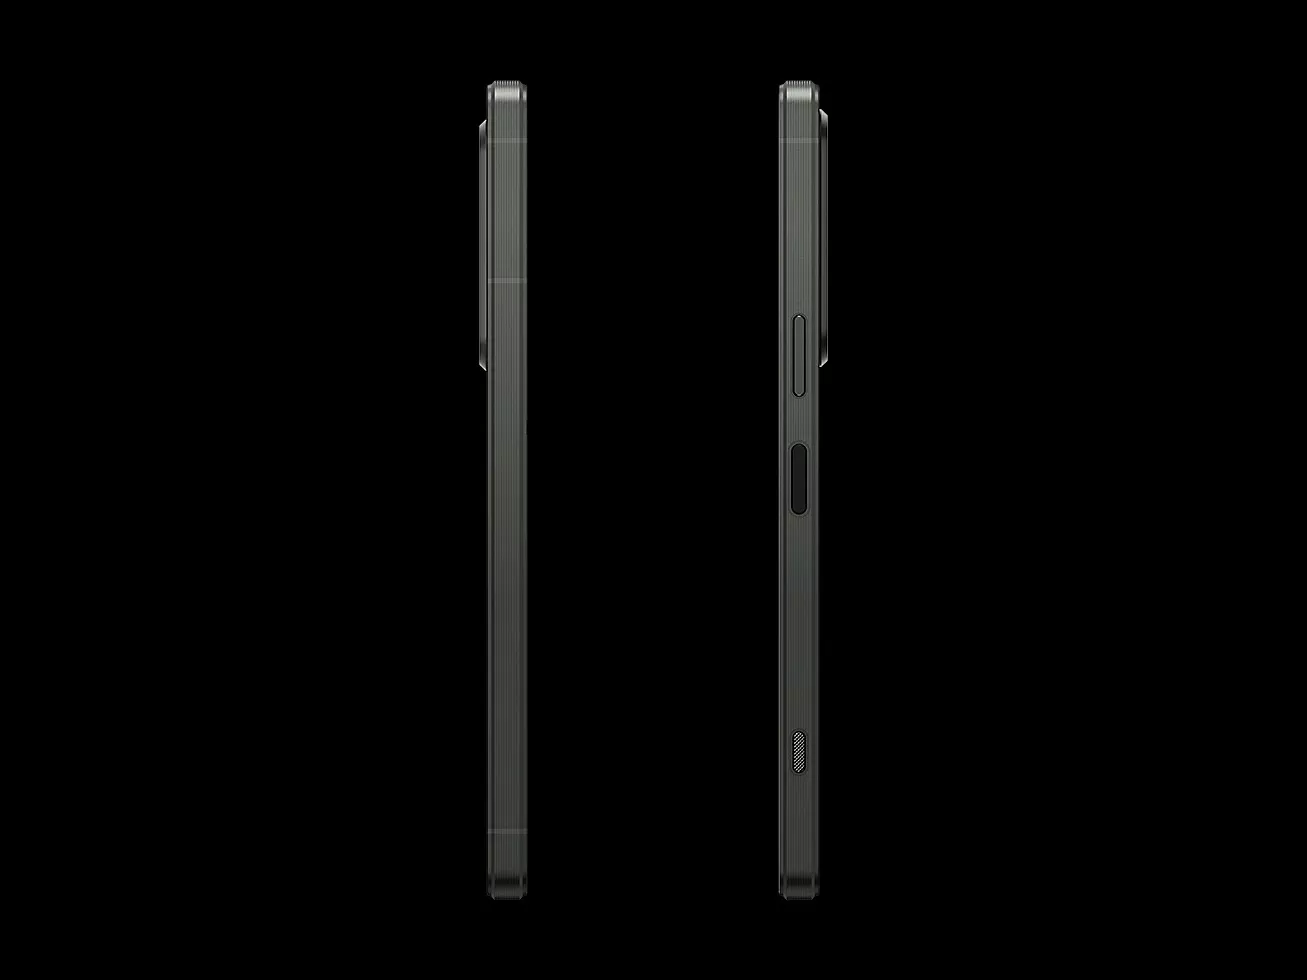
Another thing that really sets the Xperia 1 series devices is also its design. It is a very distinctive and classic design; one that has not changed over its 5 generation of flagship smartphone. Yes, it is in its 5th generation now, hence the ‘V’ in its name. The design is not only classic though, but also functional, timeless, and rather unique for a market that focuses so much on curved and rounded edges. While it might look like an uncomfortable piece of slab in your hands, it is surprisingly one of the most intuitive shapes you might find in the industry. It also feels industrial, we admit.

As industrial as it feels, the device does come packing a lot of power. It is not built for the masses though; you can feel it when you first pick up the device. The device is made for those who are in the know, who wants function over form, who wants their smartphone to be a complete extension of themselves and their lifestyle. It is made for content creators and professionals. The new one, the mark V, might just be another game changer.

Xperia 1 V | Official Product Video - Next-gen sensor. Next-gen imaging.​

Same Old Shell, But Better Internals

  • 747 Product intro 02 Black D
  • 747 Product intro 03 Black D
  • 747 Product intro 05 Black D
  • 747 Product intro 04 Black D
  • 747 Product intro 06 Black D
  • 747 Product intro 12 Khaki D
  • 747 Product intro 13 Khaki D
  • 747 Product intro 14 Khaki D
  • 747 Product intro 15 Khaki D

The Xperia 1V, as we might have expected, shares mostly the same look as the older Xperia 1 devices. It is a rectangular slab with hard edges all around. The design, as we mentioned as well, is timeless, classic. But for Sony, looks is rather secondary; it is function over form and that is where the Sony Xperia 1V might appeal to you, it does to us anyway.

We do have to start with the boring stuff though. It comes with Qualcomm’s latest Snapdragon 8 Gen2 platform, the most powerful mobile integrated chip you can find on an Android smartphone today. Of course, it goes without saying that the Sony Xperia 1V also comes with 5G thanks to the platform. Alongside the powerful System on a Chip (SoC) is 12GB RAM for better multitasking experience. You get up to 512GB of storage too, for all the photos and videos you are going to be taking with the Xperia 1V. If that is not enough, the Xperia 1V also comes with a dedicated MicroSD expansion slot, a pleasant welcome for modern flagships.

Out the front though is an Xperia special. This is still one of the only flagship smartphones in the industry to pack a 4K resolution display. Measuring in at 6.5-inch, you get an OLED panel that refreshes at 120Hz for that extra smooth feel on your interface and games. Entertainment is in Sony’s blood, so they also outfitted the Xperia 1V with some low-noise speakers for the best-in-class audio performance. They even have a “Game Enhancer” mode that is supposed to improve gaming performance on the device itself and even allow players to stream their games on YouTube without additional hardware.

The Exmor T for Mobile – The Game Changer

  • Picture3
  • Picture2

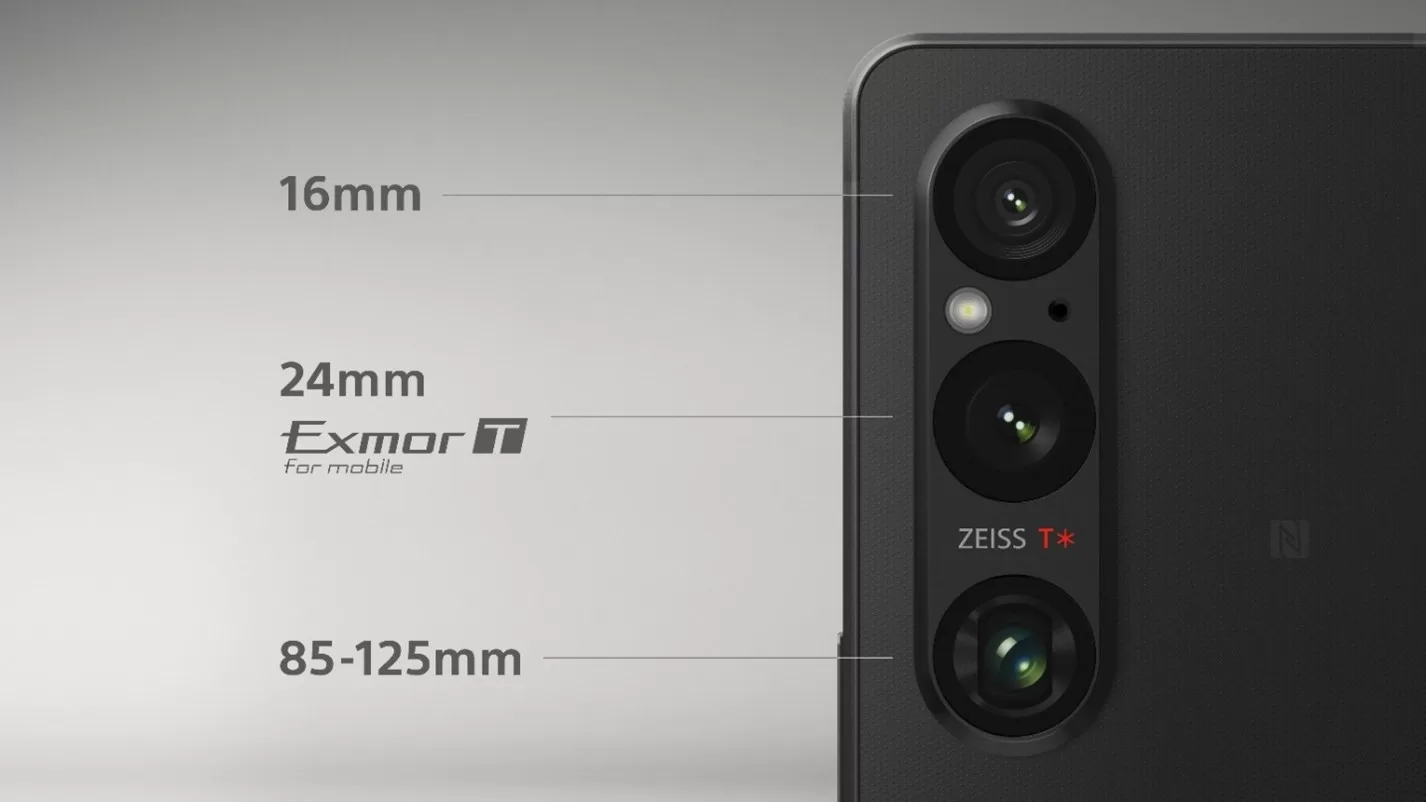
This device is made for the content creators though. It packs a brand-new innovation from the camera division. It packs Sony’s latest Exmor T sensor for mobile. While it is not quite a 1-inch sensor, the newly developed sensor for mobile platforms is clever. It is a stacked CMOS image sensor with 2-layer Transistor Pixel. What that means for users is that the newly developed sensor is supposed to offer better low-light performance than ever before. It is also a much faster sensor offering higher levels of detail than older mobile camera sensor technologies. They also claim that the new sensor offers photos with less noise and dynamic range closer to what you can get out of a full-frame system. On top of the Exmor T for mobile 48-Megapixels sensor is a 24mm Zeiss lens with T* coating for less distortion and better clarity. There is also a 16mm 12-Megapixel ultra-wide shooter and another telephoto lens with 12-Megapixel sensor behind it. The unique thing about the telephoto lens though is that it offers an optical zoom between 85-125mm (3.5x-5.2x).

One big thing about the Xperia 1V is also the improvement of the S-Cinetone colour gamut. The S-Cinetone colour gamut can be considered a cinematographer favourite when it comes to shooting contents. With the Xperia 1V, S-Cinetone for mobile has been improved to offer better skin tones and offer more cinematic footages even before a comprehensive colour grading work. Since the new sensor offers better colour and detail performance, you also get enhanced saturation over the older smartphone. Of course, the low-light performance of the sensors helps with S-Cinetone too.

Thanks to Real-time tracking and Eye AF functions, the Sony Xperia 1V is a powerful tool for video and photo work when you really have nothing else to work with. If you are too lazy to post process your photos or videos, the smartphone also offers colour presets in Creative Look mode. When you need it to, the Sony Xperia 1V can capture photos at up 30 frames per second while tracking moving objects rather accurately. For vloggers reviewing products, there is a Product Showcase setting that forces the camera to focus more on the product on hand over the reviewer’s face. There is also a new voice priority mic within the camera that ensures that the creator’s voice is clearly heard in every situation.

Battery – Still As Big, But Better and Longer-Lasting

Picture1
Source: Sony

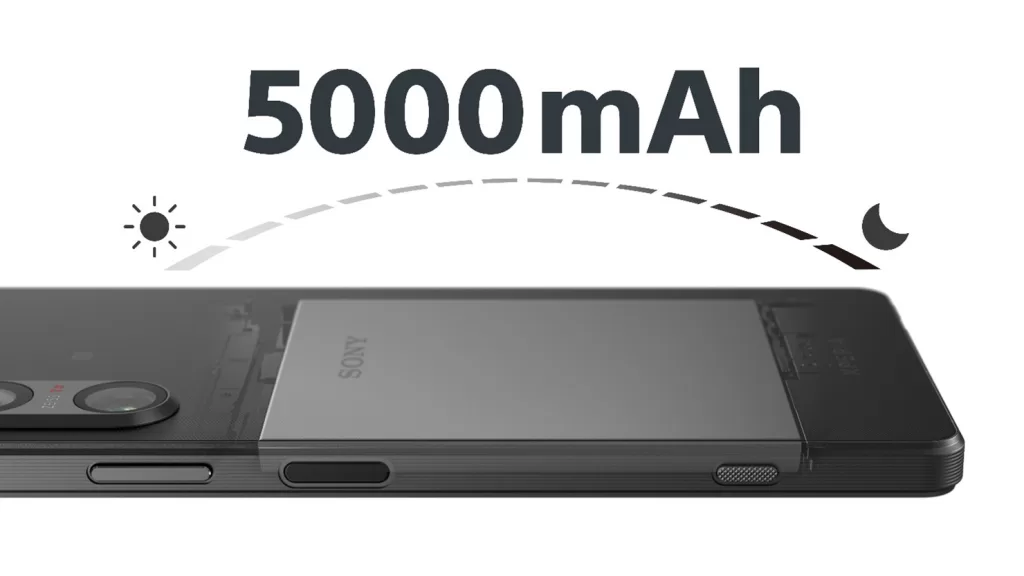
Of course, for the Xperia 1V to be an extension of yourself, you need it to work an entire day and probably even more. The 5,000mAh battery within the classic body ensures that you have at least 20 hours of battery life even when you play videos at 4K the entire time. It also supports fast-charging technology so you can fully charge your device in just about an hour. With some new technologies and know-how, Sony has managed to improve the battery lifespan of the battery, which means that battery life anxiety might not be a thing for the Xperia 1V for years to come.

Price and Availability

The Sony Xperia 1V is not known for its colour options. It comes in three colour options still – Black, Khaki Green, and Platinum Silver. While some markets are getting the device in June, Sony Malaysia has confirmed that Malaysia will get the Sony Xperia 1V treatment on the 3rd of July 2023 onward. Sony Malaysia has also confirmed that the Sony Xperia 1V will be priced at MYR 6,399 onward. More on the Sony Xperia 1V can be found on their website.