Tata Communications a ‘Leader’ for 10th consecutive year in Gartner Magic Quadrant

MUMBAI, India, Feb. 24, 2023 /PRNewswire/ — Tata Communications, a global digital ecosystem enabler, is recognised as a ‘Leader‘ for the tenth consecutive year in the 2023 Gartner® Magic Quadrant™ for Network Services, Global for ‘Completeness of Vision’ and ‘Ability to Execute’.

Throughout the year, Tata Communications has enhanced its offering by improving cloud application performance and agility for enterprises to adapt in a rapidly evolving business environment; empowering customers with instant contactless access to orders, services, requests, reports and support via a unified self-service portal; and a network-on-demand to support short-term interim bandwidth requirements for specific use cases such as eCommerce and retail giants during annual or periodic ‘big’ sales days campaigns.

“We celebrate this recognition with our customers and thank them for their continued trust in us. This continued recognition, we believe, is a testimony of our commitment in ensuring their success,” said, Genius Wong, Executive Vice President – Core and Next-Gen Connectivity Services & Chief Technology Officer. Further adding, “The next generation of networking will be immensely intent based for a highly immersive and personalised experience. As organisations accelerate digital adoption, we remain focused to deliver smarter networks for delightful customer experiences.”

According to Gartner, “Providers in the Leaders quadrant are performing well and maintaining a stable organization, with a clear vision of market direction. They deliver comprehensive portfolios of quality network services across the broadest geographies. They address the global networking needs of a broad range of enterprises in terms of size, geographic distribution and vertical industry. Leaders shape the direction of the market by extending their coverage, developing new class-leading capabilities and commercial models, and deploying them at scale.”

Note to Editors/Customer testimonials: 

  • Tata Starbucks Private Limited: “We were facing a lot of challenges related to network availability and looking for a solution that could offer network resiliency and also enable us to track consumer behaviours in our stores. IZOTM SDWAN looked as a perfect solution with promising benefits. Having previously worked with Tata Communications, we know about their customer centric culture, technological capabilities, market reach (especially in tier-2, tier-3 cities) and chose them as our preferred partner to implement IZOTM SDWAN. Since they already knew our business well, the time-to-market is much faster compared to other service providers. It’s been close to an year since we have been working together on this project and we are delighted with project approach, technical strength and customer centricity. Once this project is successful, we will be able to reap the benefits with a more efficient and dynamic network in place.” – Vipin Gupta, Head – Technology and Digital Transformation, Starbucks India
  • Archroma: “We are a specialty chemicals company committed to innovation, quality, service, cost-efficiency, and sustainability. We have our presence in 31 countries with 25 production sites and, for over three years now, Tata Communications has been our sole provider across the globe for Internet Access Services, covering these production sites as well as our IT Offices. Their MPLS and IZO™ Internet WAN is highly reliable and ensures stability. Adding to this is the exceptional service and support extended to us by their Customer Success Teams. Overall, I’m happy to say that Tata Communications has been a great partner to work with.” – Ivan Moronta, Global Telecommunications Manager, Archroma

Gartner Disclaimer

Gartner, Magic Quadrant for Network Services, Global, By Danellie YoungKaren BrownGaspar Valdivia, 22 February 2023.

Gartner does not endorse any vendor, product or service depicted in its research publications, and does not advise technology users to select only those vendors with the highest ratings or other designation. Gartner research publications consist of the opinions of Gartner’s research organization and should not be construed as statements of fact. Gartner disclaims all warranties, expressed or implied, with respect to this research, including any warranties of merchantability or fitness for a particular purpose.

Gartner and Magic Quadrant are registered trademarks of Gartner, Inc. and/or its affiliates in the U.S. and internationally and is used herein with permission. All rights reserved.

About Tata Communications

A part of the Tata Group, Tata Communications (NSE: TATACOMM; BSE: 500483) is a global digital ecosystem enabler powering today’s fast-growing digital economy in more than 190 countries and territories. Leading with trust, it enables digital transformation of enterprises globally with collaboration and connected solutions, core and next gen connectivity, cloud hosting and security solutions and media services. 300 of the Fortune 500 companies are its customers and the company connects businesses to 80% of the world’s cloud giants. For more information, please visit www.tatacommunications.com 

Forward-looking and cautionary statements

Certain words and statements in this release concerning Tata Communications and its prospects, and other statements, including those relating to Tata Communications’ expected financial position, business strategy, the future development of Tata Communications’ operations, and the general economy in India, are forward-looking statements. Such statements involve known and unknown risks, uncertainties and other factors, including financial, regulatory and environmental, as well as those relating to industry growth and trend projections, which may cause actual results, performance or achievements of Tata Communications, or industry results, to differ materially from those expressed or implied by such forward-looking statements. The important factors that could cause actual results, performance or achievements to differ materially from such forward-looking statements include, among others, failure to increase the volume of traffic on Tata Communications’ network; failure to develop new products and services that meet customer demands and generate acceptable margins; failure to successfully complete commercial testing of new technology and information systems to support new products and services, including voice transmission services; failure to stabilize or reduce the rate of price compression on certain of the company’s communications services; failure to integrate strategic acquisitions and changes in government policies or regulations of India and, in particular, changes relating to the administration of Tata Communications’ industry; and, in general, the economic, business and credit conditions in India. Additional factors that could cause actual results, performance or achievements to differ materially from such forward-looking statements, many of which are not in Tata Communications’ control, include, but are not limited to, those risk factors discussed in Tata Communications Limited’s Annual Reports. 

The Annual Reports of Tata Communications Limited are available at www.tatacommunications.com. Tata Communications is under no obligation to, and expressly disclaims any obligation to, update or alter its forward-looking statements.

TATA COMMUNICATIONS and TATA are trademarks or registered trademarks of Tata Sons Private Limited in India and certain countries.

Honor X9A 5G In Depth Review – An all-rounder with a flagship-like display

IMG 20230224 WA0006
The Honor X9a 5G is a mid-range offering with a more than mid-range display.

Any new smartphone owner has had nightmares of their shiny new screens cracking on day one from the slightest of drops. Well, Honor has gone to great lengths to allay those fears with their new midrange entry, the Honor X9A 5G. You probably have already seen ads for the toughest 120Hz display on the market and videos of people smashing the display into various surfaces or nuts. But is that all it has to offer? We spent 30 days putting the device through its paces and the results may surprise you.

Display

Let’s start off with the main selling point of the device; its nigh-indestructible display. The idea Honor had here was clear; bring a flagship grade display to a more accessible and affordable device. And I believe they have achieved that. The Honor X9a 5G sports a 6.67-inch OLED curved display with a 120Hz screen refresh rate. The refresh rate makes the visuals snappy, be it the MagicUI 6.1 interface, a video on YouTube and especially when gaming. It has good brightness too with a rating of 800 nits. Walking under the hot afternoon sun, I was still able to see what’s on the screen, though admittedly I had to turn up the brightness to near maximum. Videos were crisp and colours were vibrant whether from YouTube or Netflix. I found it both comfortable and enjoyable watching videos at long length on this device.

IMG 20230224 WA0002
Is an incredibly tough 120Hz display all it has to offer? Or is there more to reveal?

Protecting this display is Honor’s own answer to Corning’s Gorilla Glass and Huawei’s Kunlun glass. Though it remains nameless, Honor’s protecting glass does a fantastic job of securing the display. After more than a month of using the phone without any kind of protection, I have not seen a single scratch on this display, even from the keys in my pocket. There are probably hundreds of videos online of people dropping or hitting the phone with a variety of items and I could not resist doing so myself. From walnuts to groundnuts to M&M’s, nothing seems to damage this screen. I did accidentally drop the device face down on a tiled floor from waist height and no visible damage either. Without venturing into more dangerous stress tests, I did feel that the display glass is definitely sturdier than expected of a mid-range device.

Design

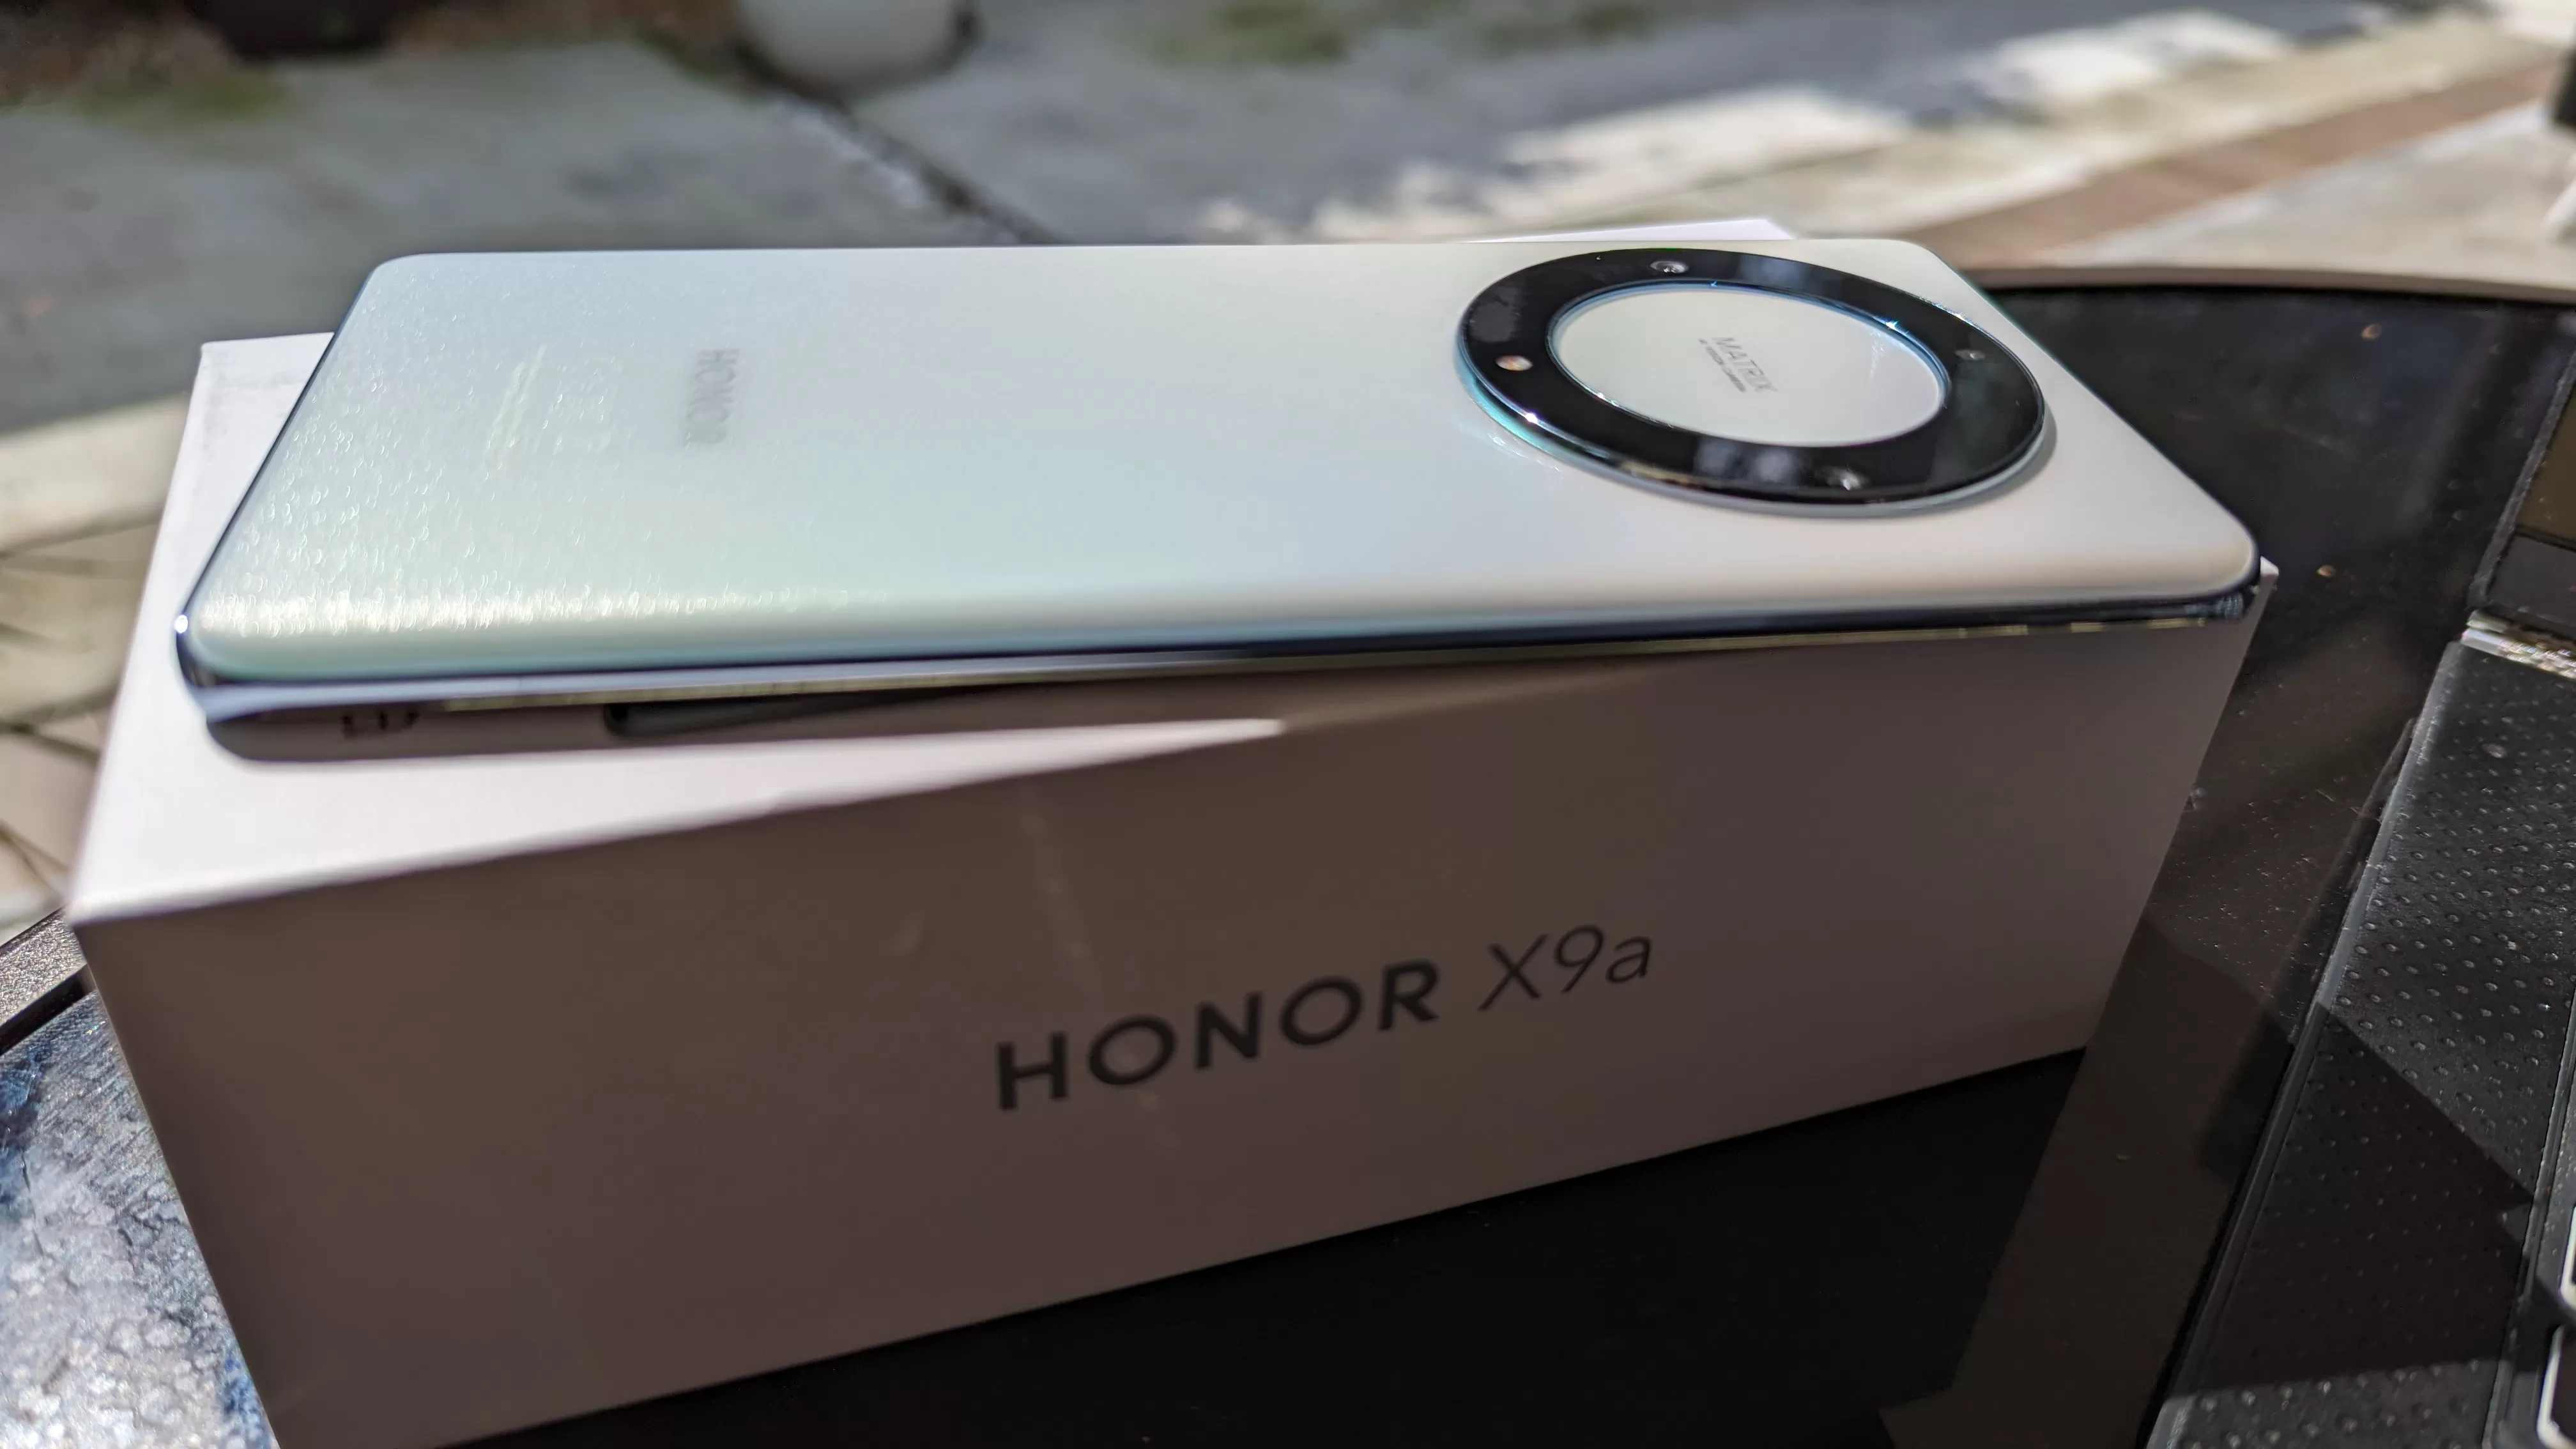
The signature design feature of the Honor X9a 5G is the raised circular rear camera housing, dubbed the star ring matrix design by Honor. Personally, I was not a fan of this particular design and the height is apparent enough to make it wobble very slightly on the table if used without a case. However, those are the only two complaints I have design wise and there is a lot to like.

IMG 20230224 WA0008
The polarizing design of the star ring matrix rear camera housing.

The build quality of the phone is great. The tough display on the front is only punctuated by the small camera hole cutout, which does not distract you from what’s on the display. The back of the phone had a textured material that feels great to hold. The material feels premium and the Titanium Silver colour was pleasing to the eye, which is one of the main reasons why I did not use a case. It is also very lightweight, which coupled with the textured back, feels good to hold for a long time.

IMG 20230224 WA0013
Volume rocker and lock button wrapped with metal trimming on the edges.

Despite being a curved display device that I used without a case, I did not experience any accidental touches along the edges. This is probably thanks to the AI Anti Mistouch feature. Lining the edges of the phone is metal trimming painted with a metallic sky blue colour that was also very appealing. On the right-hand side is the volume rocker and lock button. The buttons feels great to the touch, is tactile and does not wobble in place.

Overall, the device feels very premium with a robust build quality and apart from the star ring matrix design, has nice aesthetics.

Camera

The camera experience for the Honor X9A 5G did not receive as much emphasis as the display nor its build quality. It sports a triple sensor set up of a 64MP main shooter, 5MP ultrawide and 2MP macro camera. The main shooter does a decent job of snapping photos in daylight and good lighting conditions. Images were sharp and colours leaned towards a more subdued, natural palette. However, performance takes a dip in low light conditions, with images appearing a little grainy and colours appear a little washed out. To compensate for this, there is a Night mode that seemingly is able to address both these issues. The only catch is that there is a long 3 to 4 second timer before image capture and you need to have steady hands in this time for a clear image. That being said, the Night mode images do have good clarity, colors and no obvious noise.

While the main shooter performs well enough for daily use, the other shooting modes did miss the mark. The 2MP macro shooter suffered from a lack of sharpness due to the low resolution and had some fuzziness to it even in daylight. The 5MP ultrawide shooter also suffered from the low resolution and had rather obvious graininess that got worse with low lighting conditions. The saving grace is the Portrait mode, which showed good performance in both daylight and lighted indoor situations. There was good level of detail captured and bokeh was well done. Performance was similarly good when using the 16MP selfie camera, with Portrait shots appearing clear and well detailed. There is also a beauty filter to help iron out facial imperfections which helped make the photos social media ready.

The camera experience for the Honor X9A 5G is rather average; a serviceable main shooter with no true standout features and lackluster alternative shooting modes.

Performance

Key Specifications

The Honor X9A 5G is powered by a Snapdragon 695 SoC, which is not the latest in chipsets but it does pack a punch. For its price point, it comes with a rather healthy memory capacity of 8GB of RAM and 256GB of storage. The battery is also a plus point with 5100mAh capacity and 40W wired charging with the included charger. The hardware on board is good value for money and I found the performance takes full advantage of them.

User Interface

Out of the box, it runs MagicUI 6.1 that is based on Android 12. Long-time Honor users will be very familiar with the design and aesthetics of MagicUI but for first time users, the user interface appears rather dated.

With large blocky icons with designs reminiscent of iOS and Android from the mid 2010’s, the dated design feels out of place in such a premium display in 2023. There is a dedicated Themes app preinstalled on the device that can help alleviate this to some degree. But functionally, the user interface works fine, with no obvious flaws. There is also both the Google Play Store and Honor App market preinstalled for all your app needs.

Productivity and multitasking

Multitasking was a breeze on this device as I was able to run Google Chrome, the Gallery app in Multi Window mode and Netflix in mini player mode without a hitch. I did not experience any significant lag or stutters and no overheating after about an hour with this set up. Granted that is not a realistic scenario but it shows that there is a lot of headroom for productivity in this device. For the 30-day review period, I very frequently used messaging apps WhatsApp and Messenger while simultaneously using Chrome or YouTube and did not experience any significant lag or stuttering. Productivity is helped by the large RAM capacity of 8GB and additional 5GB virtual RAM for handling multiple running apps. The 256GB of storage is also handy to help store large amounts of photos and files on the go.

Call Quality and Connectivity

PXL 20230224 113853552
Connectivity was good on all fronts including a stable Bluetooth audio connection.

I used the device primarily over 4G LTE networks and did not experience any major disruptions to the connection, be it in Kuala Lumpur city or the smaller towns of Johor. Call quality was clear, had sufficient volume and no issues hearing the person on the other end. Similarly, the call recipients had no complaints on call quality when receiving calls from this device. While capable of 5G connectivity, testing was restricted by the limited connectivity of 5G in Malaysia. Support for WiFi is up to WiFi 5 mainly due to the older chipset but I did not experience any connection dropouts for the review period. Streaming on YouTube and Netflix was seamless and online gaming connections were good too. I tested out the Bluetooth by pairing with my Samsung Galaxy Watch 4 and Sony WF-1000XM4 earbuds. In both cases, I did not experience any unexpected disconnects while the pairing was quick and trouble-free. I found that the transferring of files to the Galaxy Watch 4 was smooth and there were no audio cutouts for the Sony earbuds during long sessions of music. Even pairing with my Honda car’s Bluetooth Audio went smoothly with no issues. All-in-all connectivity was stable on all fronts.

Gaming

I found the device very pleasant to use for long periods of watching videos on YouTube and Netflix. But I also found it very pleasant to use for gaming as well. I primarily tested on Mobile Legends oh High settings and PUBG Mobile with HD graphics and High frame rate. I found both games ran smoothly and surprisingly, even after about 2 consecutive hours of gaming, I did not feel overheating. Granted, I used the device predominantly without a case which helps ventilation slightly, and I was not pushing the games to their maximum settings. For a mid-range device the performance was really good.

PXL 20230224 113126331.NIGHT
Gaming performance was great with the Honor X9a 5G.

When pushing the graphics to the maximum settings (Ultra for Mobile Legends and Ultra HD for PUBG Mobile), the performance was still surprisingly good, with only slight choppiness observed for PUBG Mobile with some overheating past the 1-hour mark. The fantastic display adds to the gaming immersion; everything was snappy due to the 120Hz refresh rate and colours were vibrant. One minor complaint for the gaming immersion would be the mono speakers on board instead of stereo speakers. This of course was not a dealbreaker as the use of earbuds quickly solved this problem.

The gaming performance of the Honor X9a 5G is a definite happy surprise. The GPU performance, ergonomics of the design and decent thermals helps make gaming a pleasant experience.

Battery life

Battery life is another strong point, with the device being powered by a large 5100 mAh battery. Throughout the review period, I found myself charging the device once every two days with regular use. Most of the screen on time was spent using YouTube or Netflix, Google Chrome, Facebook, WhatsApp and Messenger. It was only with heavy use of gaming and photography that I found myself needing to charge the phone on a daily basis. Charging is a breeze too with the included 40W charger juicing up from 20% to 100% in about 90 minutes.

The Verdict: A solid all-rounder headlined by a flagship display

IMG 20230224 WA0004
The Honor X9a 5G is a solid, well-rounded mid-range device.

After an in-depth hands-on experience, the Honor X9a 5G was a pleasant surprise in how it performed. Its strengths lie in its flagship-quality display, premium build quality and excellent battery life. For weaknesses, there is no particular department that is truly a deal breaker. Even the camera which has a weak macro and ultrawide performance, does a more than serviceable job in the main shooter and selfie cameras. Conversely, apart from the display, there is no other truly standout feature of the device when compared to the other devices in its price range. Retailing for RM1499, the Honor X9a 5G is up against the likes of Samsung’s A53 5G, which we reviewed not too long ago, and the recently released Poco X5 series. While these other devices have their own clear strengths and weaknesses, the Honor X9a 5G is good across the board, making it an all-rounder device. If you want a mid-range device that is value for money, can do the essentials and has a robust build quality, then this is the device for you.

You can get the Honor X9a 5G, available now from the HiHonor website, retailing for RM1499. Honor is also bundling a free pair of noise-cancelling Honor CHOICE Earbuds X3 and 180 Days of Screen Crack Protection if you purchase now.

And here is the obligatory video of nut crushing with the Honor X9a 5G.

February 24, 2023

WiMi Hologram Cloud Launches WIMI-MR System to Explore AI Real-Time Holographic Display

BEIJING, Feb. 24, 2023 /PRNewswire/ — WiMi Hologram Cloud Inc. (NASDAQ: WIMI) (“WiMi” or the “Company”), a leading global Hologram Augmented Reality (“AR”) Technology provider, today announced that it has developed its WIMI-MR system that enables users to edit and display holographic AR content and create their customized visual effects. The R&D team of WIMI-MR is currently exploring CGH (Computer-Generated Holograms) technology that allows artificial intelligence to generate holograms and display them in real-time quickly.

Whereas traditional photographs present an actual physical image, holograms contain information about the recorded object’s size, shape, brightness, and contrast. Holograms also own the ability to deliver 3D scenes with a continuous sense of depth and have a profound impact on VR and AR, human-computer interaction, education, and training. CGH enables 3D projection at high spatial angles through diffraction and interference numerical simulation. CGH uses a computer to generate a digital hologram using specific algorithms to reproduce the light field. As light waves can be described by parameters such as phase and amplitude, the computer solves the phase or amplitude of the light to produce a digital hologram, which is then fed into an optical modulation device called an SLM (Spatial Light Modulator), which modulates the phase or amplitude of the light (equivalent to put a zoom-able lens and a screen into the SLM). The SLM is then irradiated with coherent light to create a refreshable light field, resulting in a dynamic holographic 3D image that can be freely changed.

The application of CGH in AR systems allows the user to focus naturally on the content displayed across multiple depth planes. This advantage addresses many of the shortcomings of current AR devices, allowing users to interact with AR objects more easily at short distances. In addition, it can further improve user comfort by solving the problem of VAC (Vergence-Accommodation Conflict), a widespread concern in AR wearable device design.

At present, CGH is in its infancy and faces many challenges. Firstly, it is computationally intensive and requires high computing power. The second is the SLM’s low resolution and small size, and the overall imaging quality still needs improvement. WiMi’s R&D team is still exploring the CGH acceleration algorithm to achieve faster computational holograms through acceleration technology or to realize holographic displays with different depths of field in the SLM with visual tracking technology.

CGH displays are considered a transformative technology, with applications in fields ranging from VR to 3D printing, where the new technology can help immerse AR viewers in a more realistic landscape while eliminating eye strain and other side effects associated with prolonged viewing. With the development and application of CGH technology, the WIMI-MR system will enable future applications in a wide range of systems, including direct vision, VR, AR, and in-car HUD displays, further contributing to the growth of WiMi’s business.

About WIMI Hologram Cloud

WIMI Hologram Cloud, Inc. (NASDAQ:WIMI), whose commercial operations began in 2015, is a holographic cloud comprehensive technical solution provider that focuses on professional areas including holographic AR automotive HUD software, 3D holographic pulse LiDAR, head-mounted light field holographic equipment, holographic semiconductor, holographic cloud software, holographic car navigation and others. Its services and holographic AR technologies include holographic AR automotive application, 3D holographic pulse LiDAR technology, holographic vision semiconductor technology, holographic software development, holographic AR advertising technology, holographic AR entertainment technology, holographic ARSDK payment, interactive holographic communication and other holographic AR technologies.

Safe Harbor Statements

This press release contains “forward-looking statements” within the Private Securities Litigation Reform Act of 1995. These forward-looking statements can be identified by terminology such as “will,” “expects,” “anticipates,” “future,” “intends,” “plans,” “believes,” “estimates,” and similar statements. Statements that are not historical facts, including statements about the Company’s beliefs and expectations, are forward-looking statements. Among other things, the business outlook and quotations from management in this press release and the Company’s strategic and operational plans contain forward−looking statements. The Company may also make written or oral forward−looking statements in its periodic reports to the US Securities and Exchange Commission (“SEC”) on Forms 20−F and 6−K, in its annual report to shareholders, in press releases, and other written materials, and in oral statements made by its officers, directors or employees to third parties. Forward-looking statements involve inherent risks and uncertainties. Several factors could cause actual results to differ materially from those contained in any forward−looking statement, including but not limited to the following: the Company’s goals and strategies; the Company’s future business development, financial condition, and results of operations; the expected growth of the AR holographic industry; and the Company’s expectations regarding demand for and market acceptance of its products and services.

Further information regarding these and other risks is included in the Company’s annual report on Form 20-F and the current report on Form 6-K and other documents filed with the SEC. All information provided in this press release is as of the date of this press release. The Company does not undertake any obligation to update any forward-looking statement, except as required under applicable laws.

Cision View original content:https://www.prnewswire.com/news-releases/wimi-hologram-cloud-launches-wimi-mr-system-to-explore-ai-real-time-holographic-display-301755255.html

Source: WiMi Hologram Cloud Inc.

Razer Introduces the New Razer Blade 15 – The 2023 Baby Razer Blade

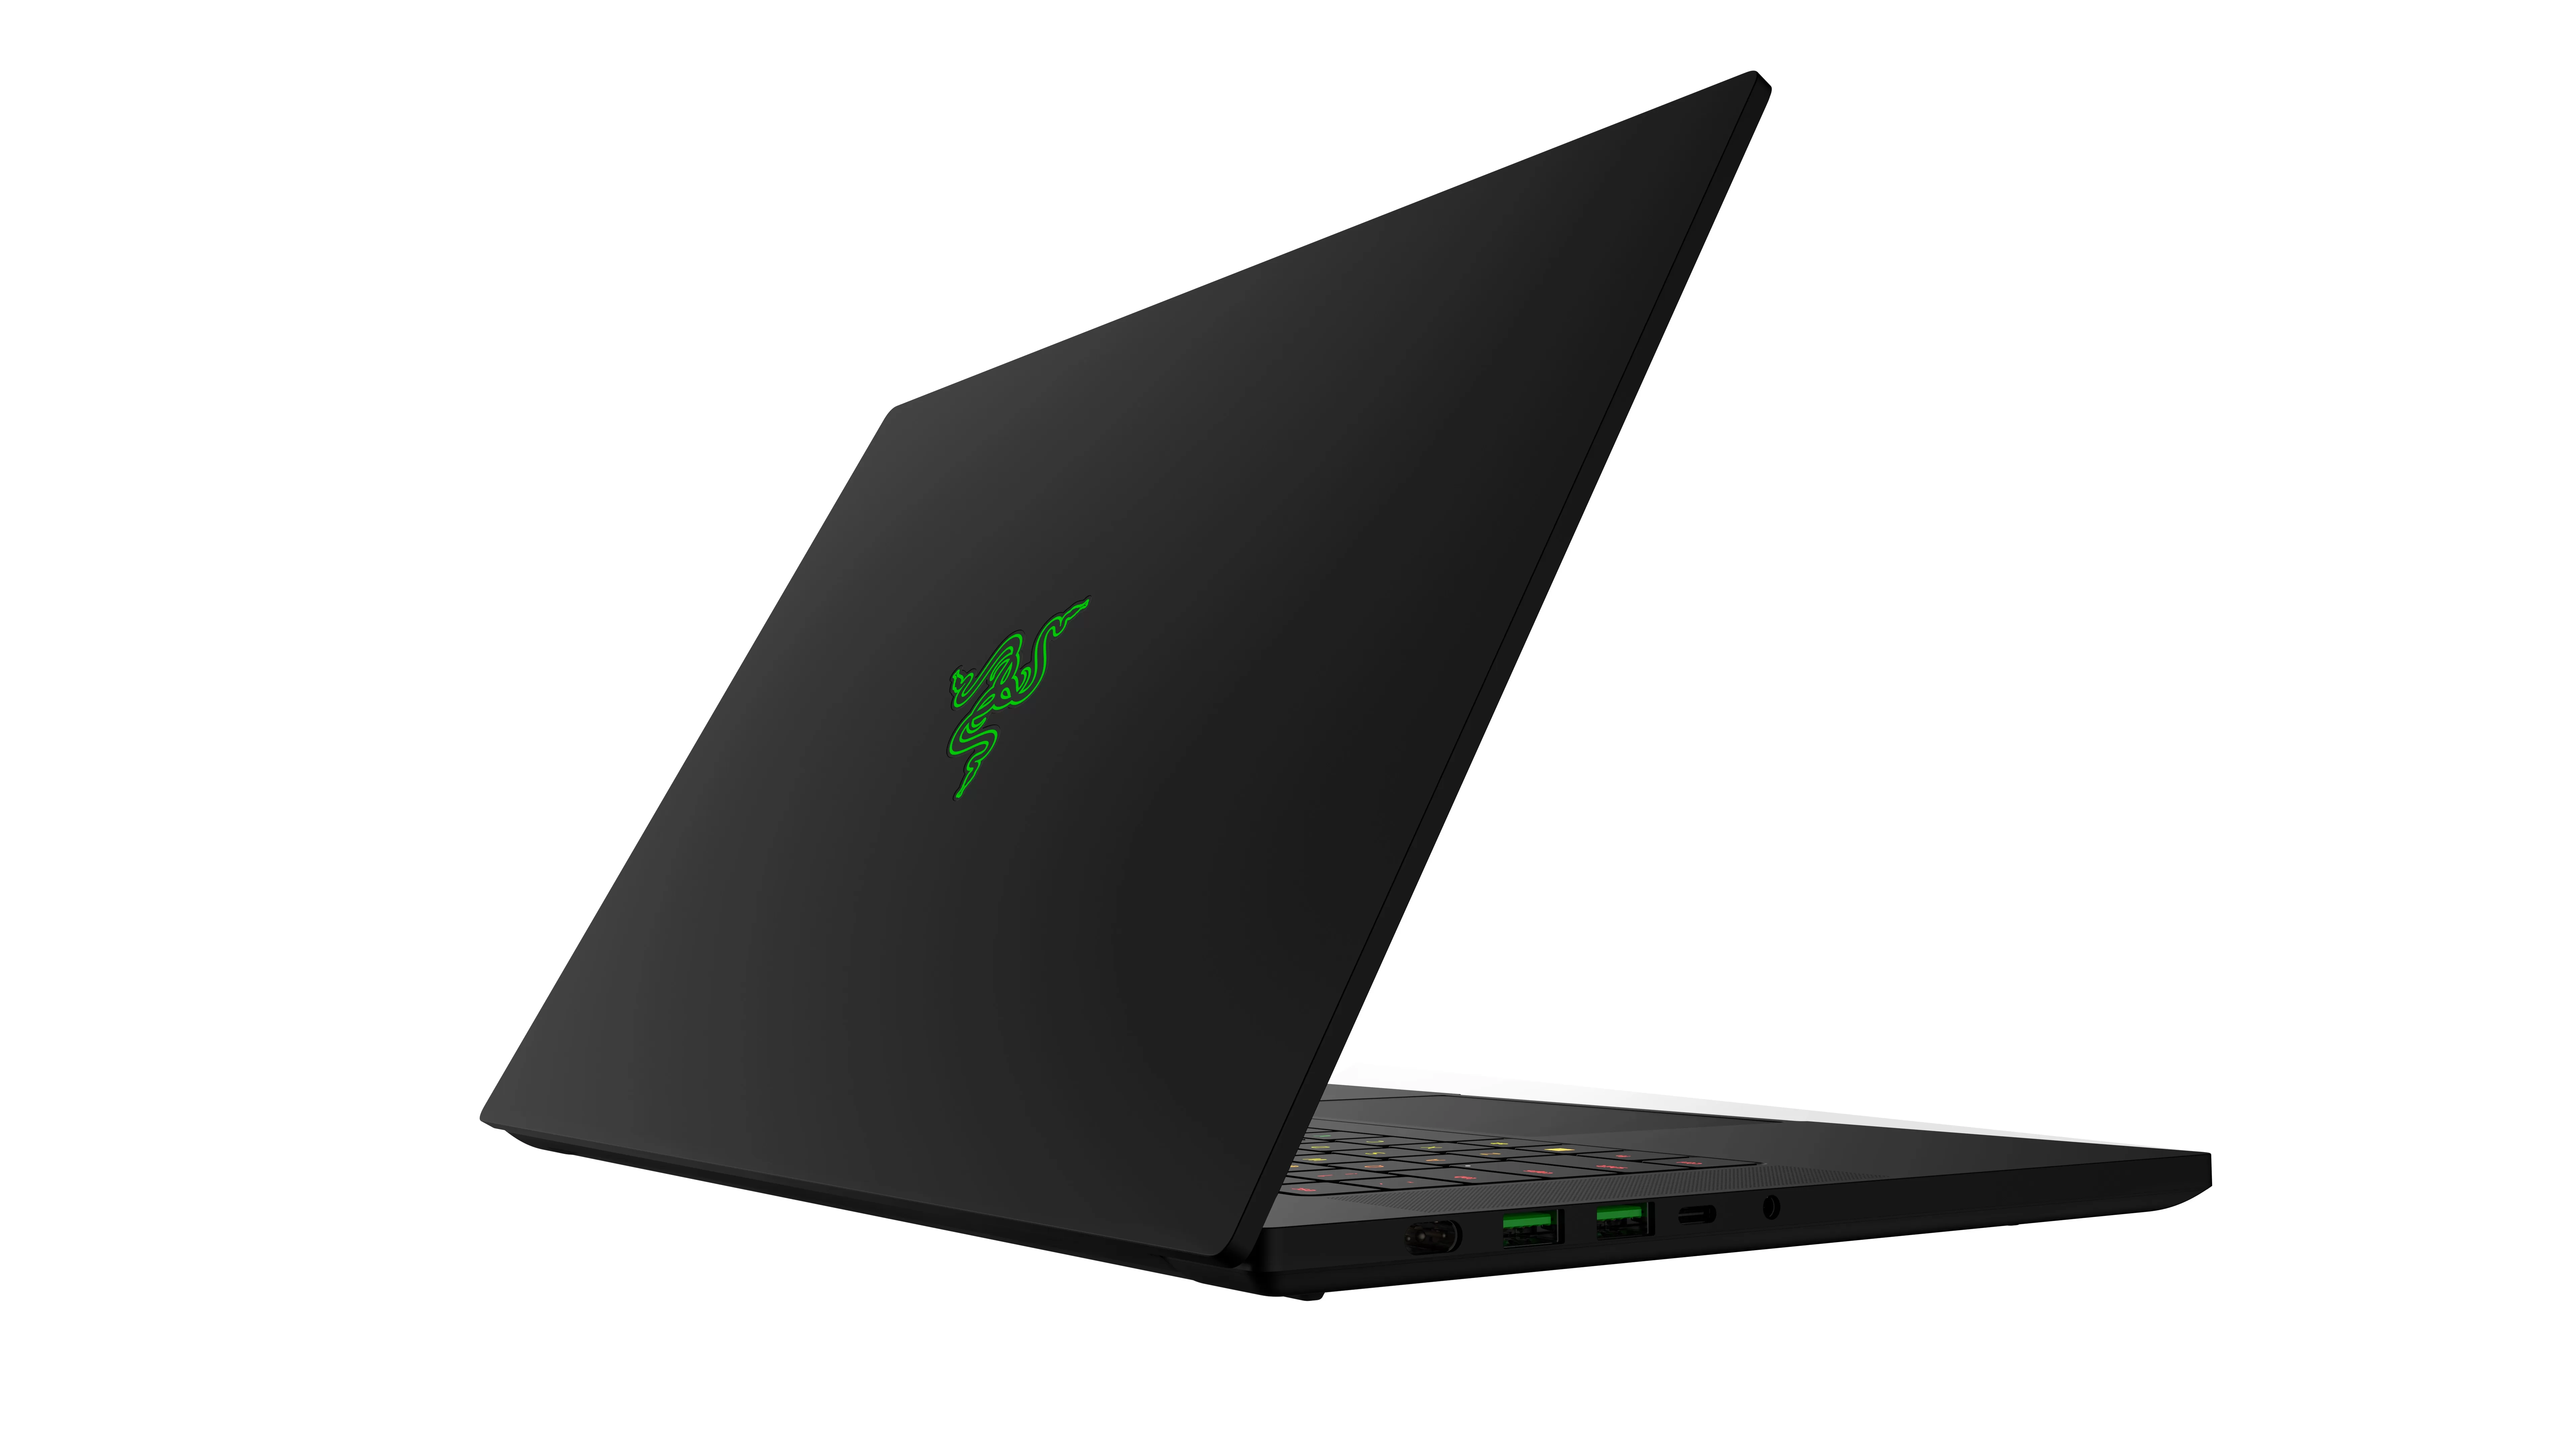
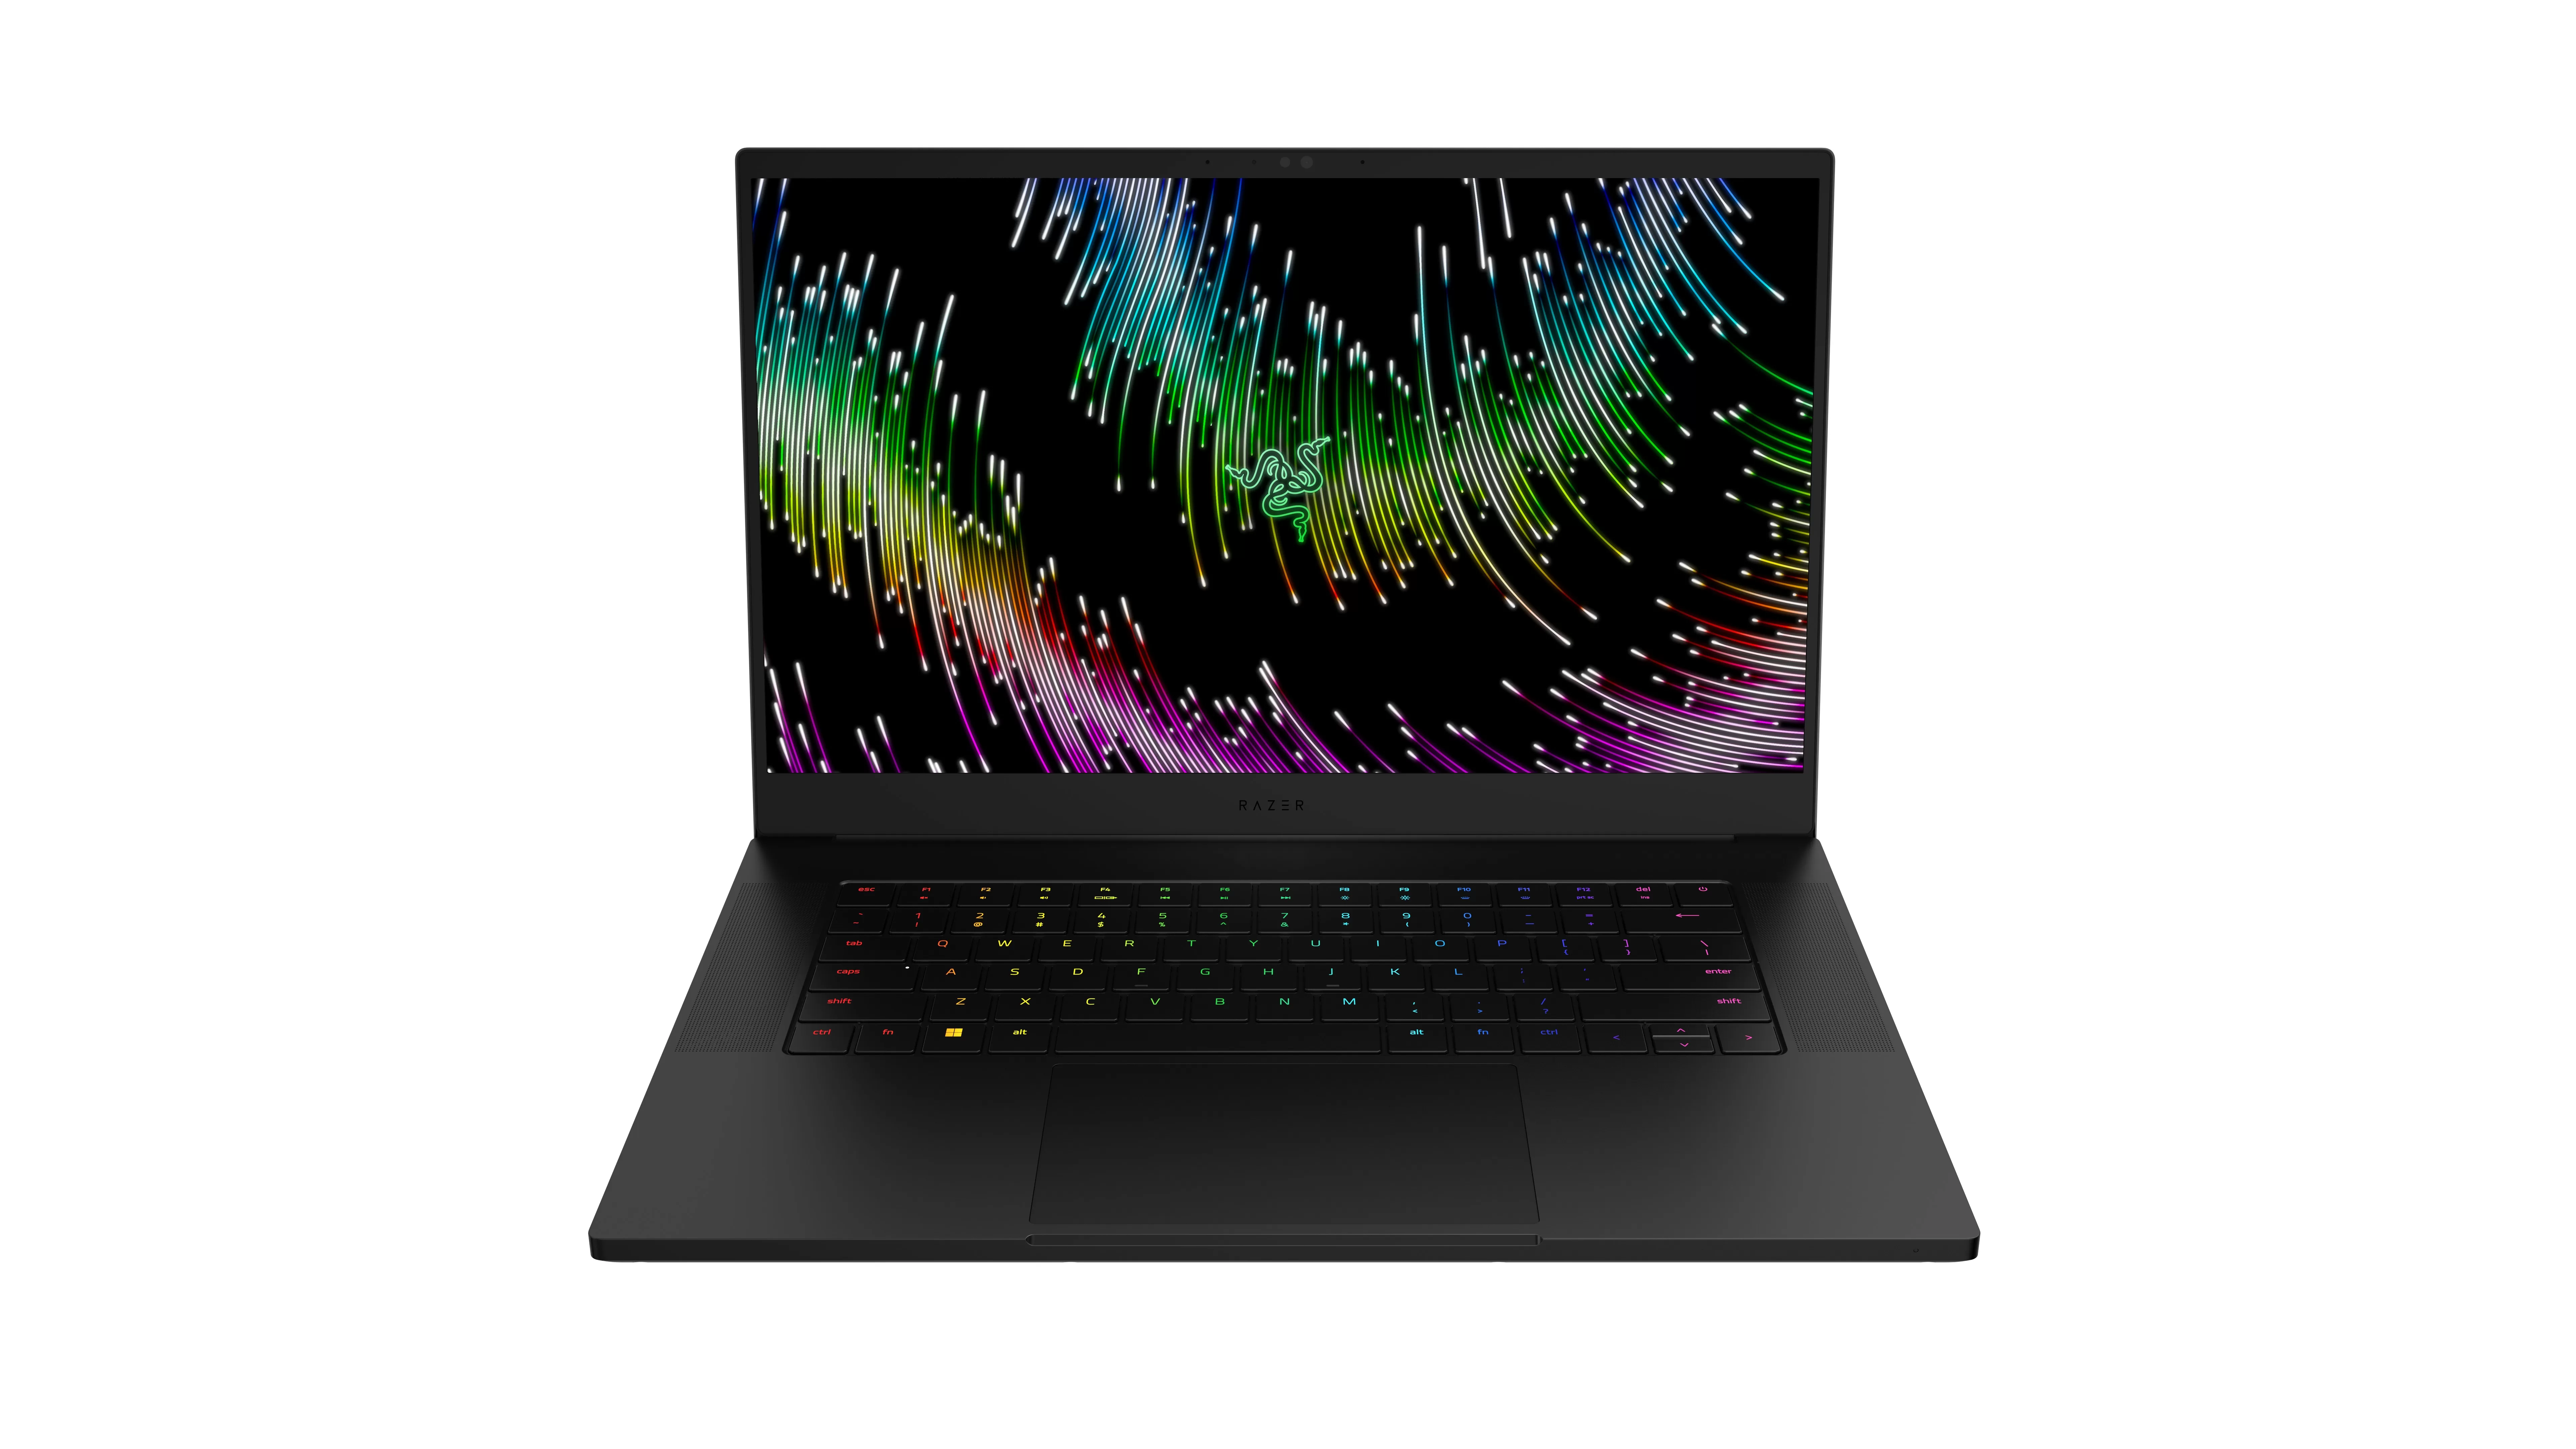
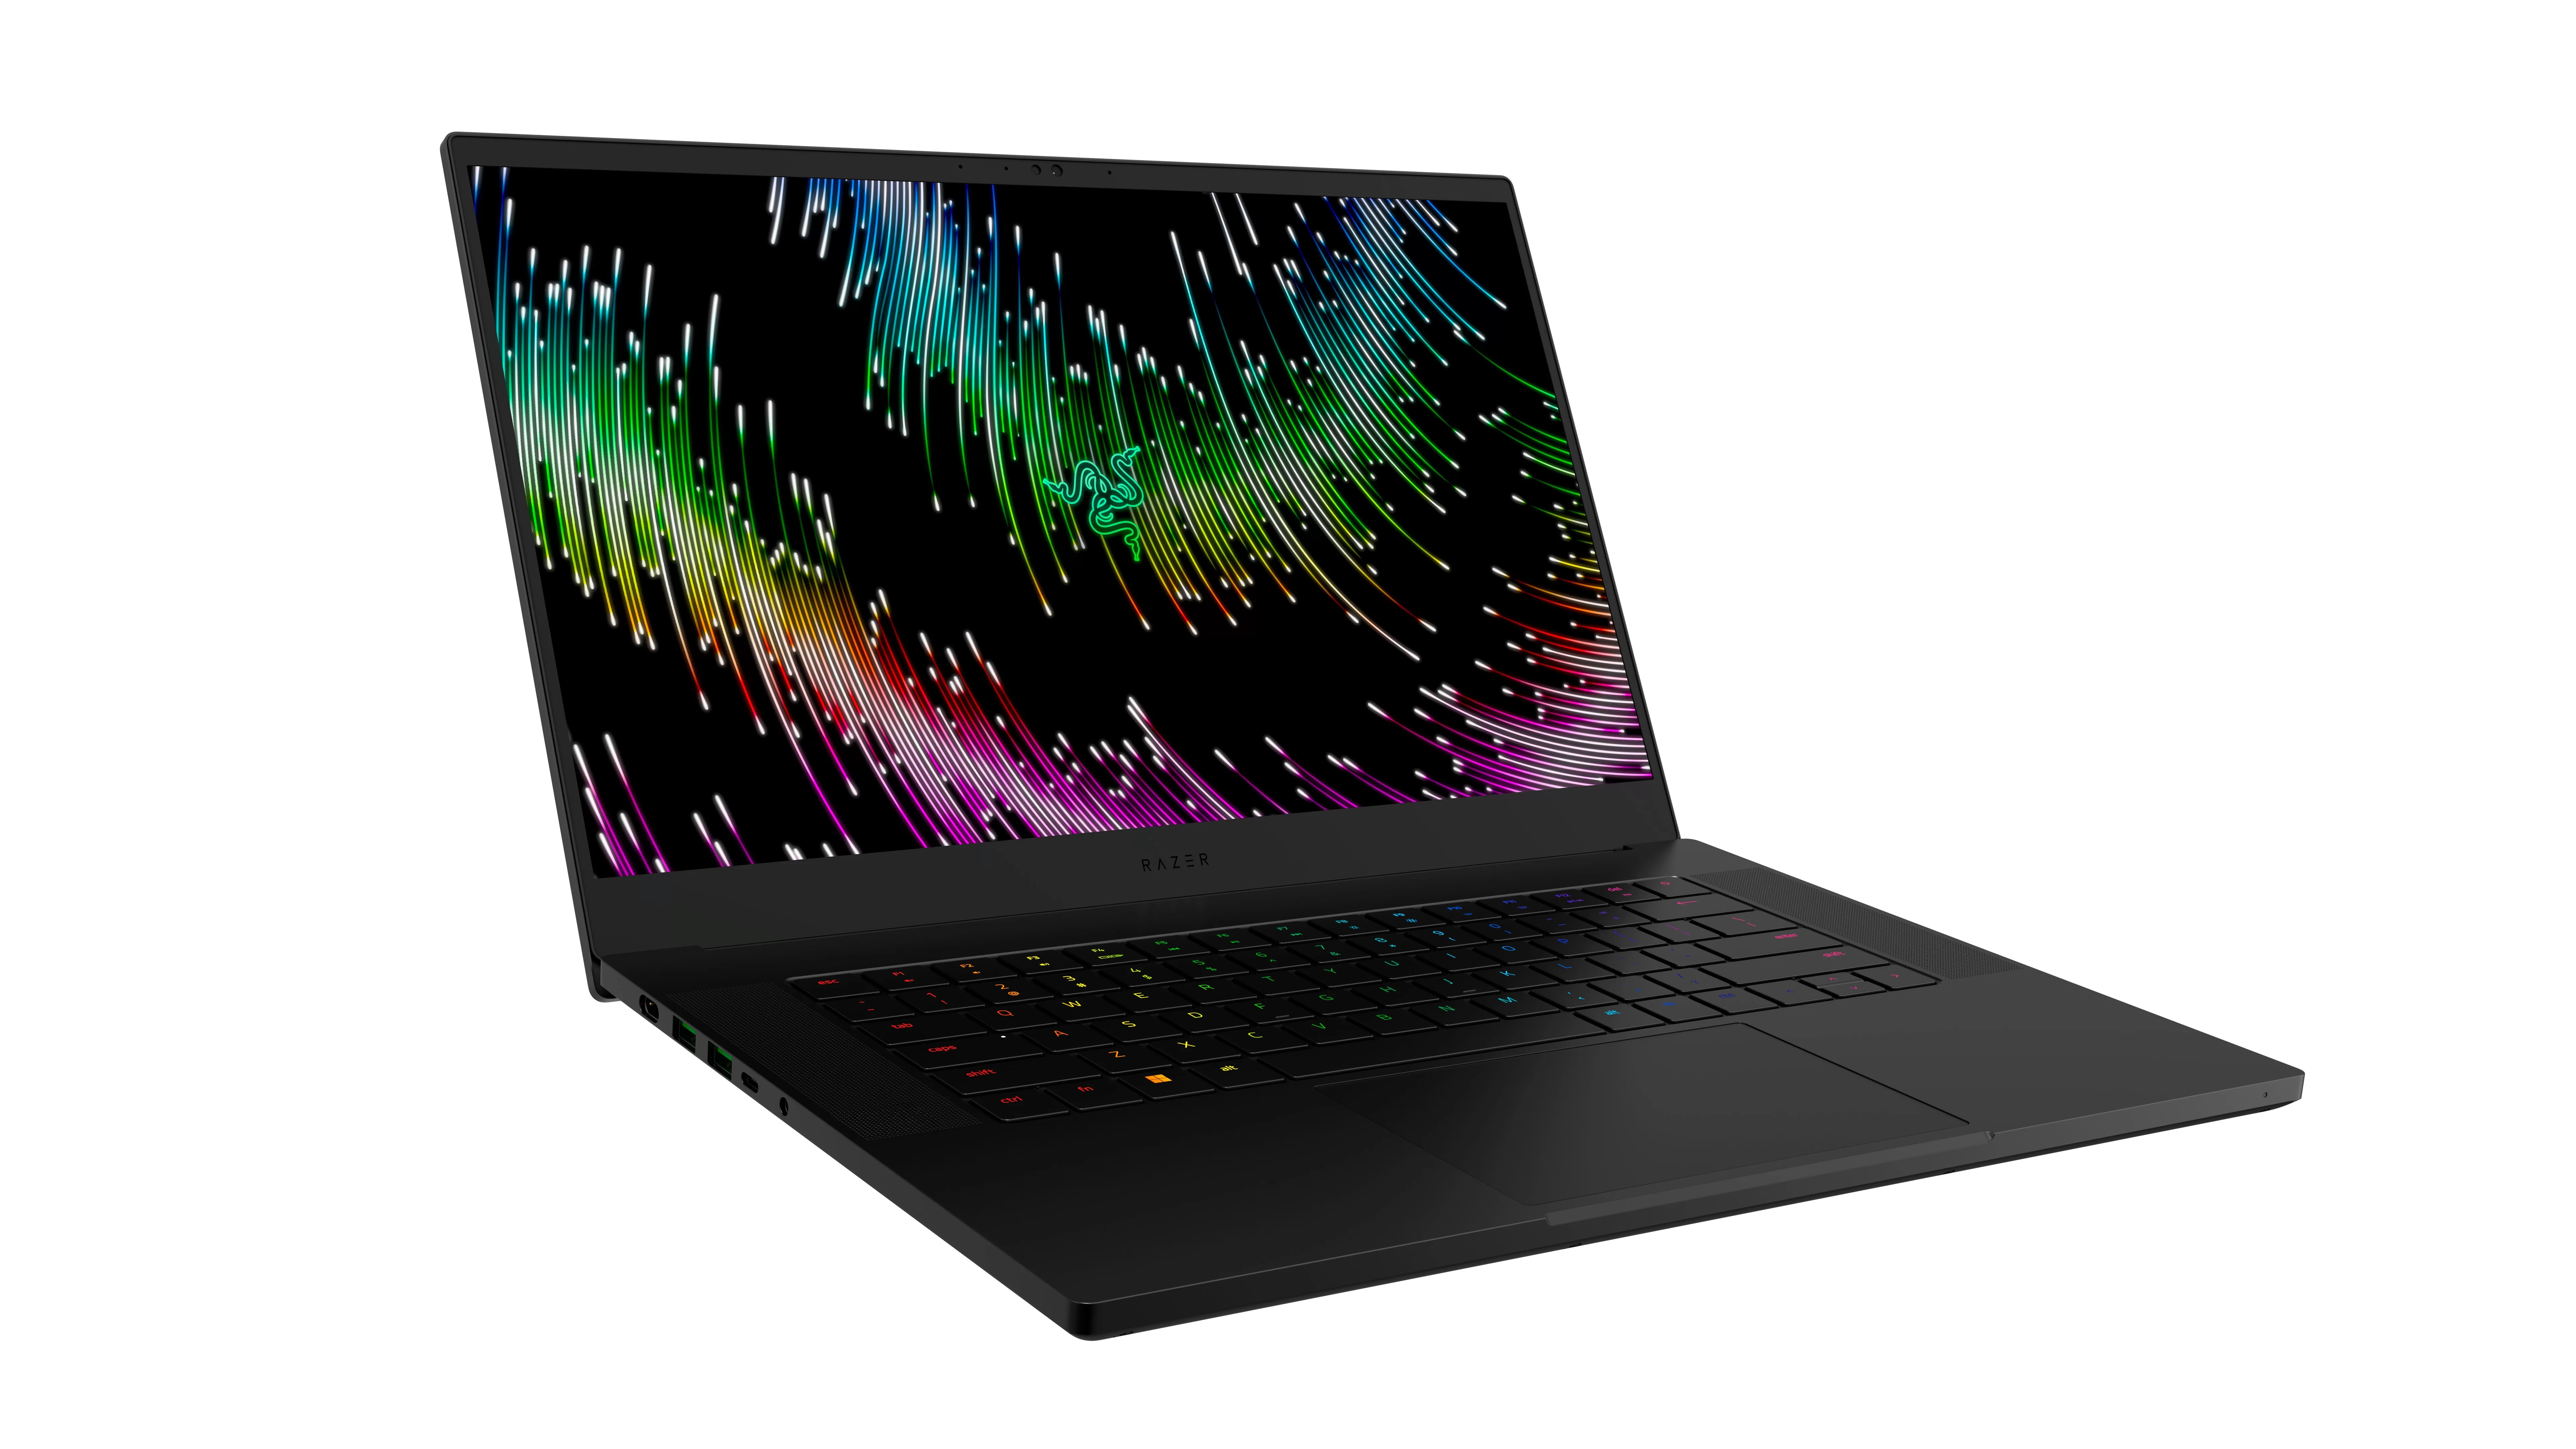
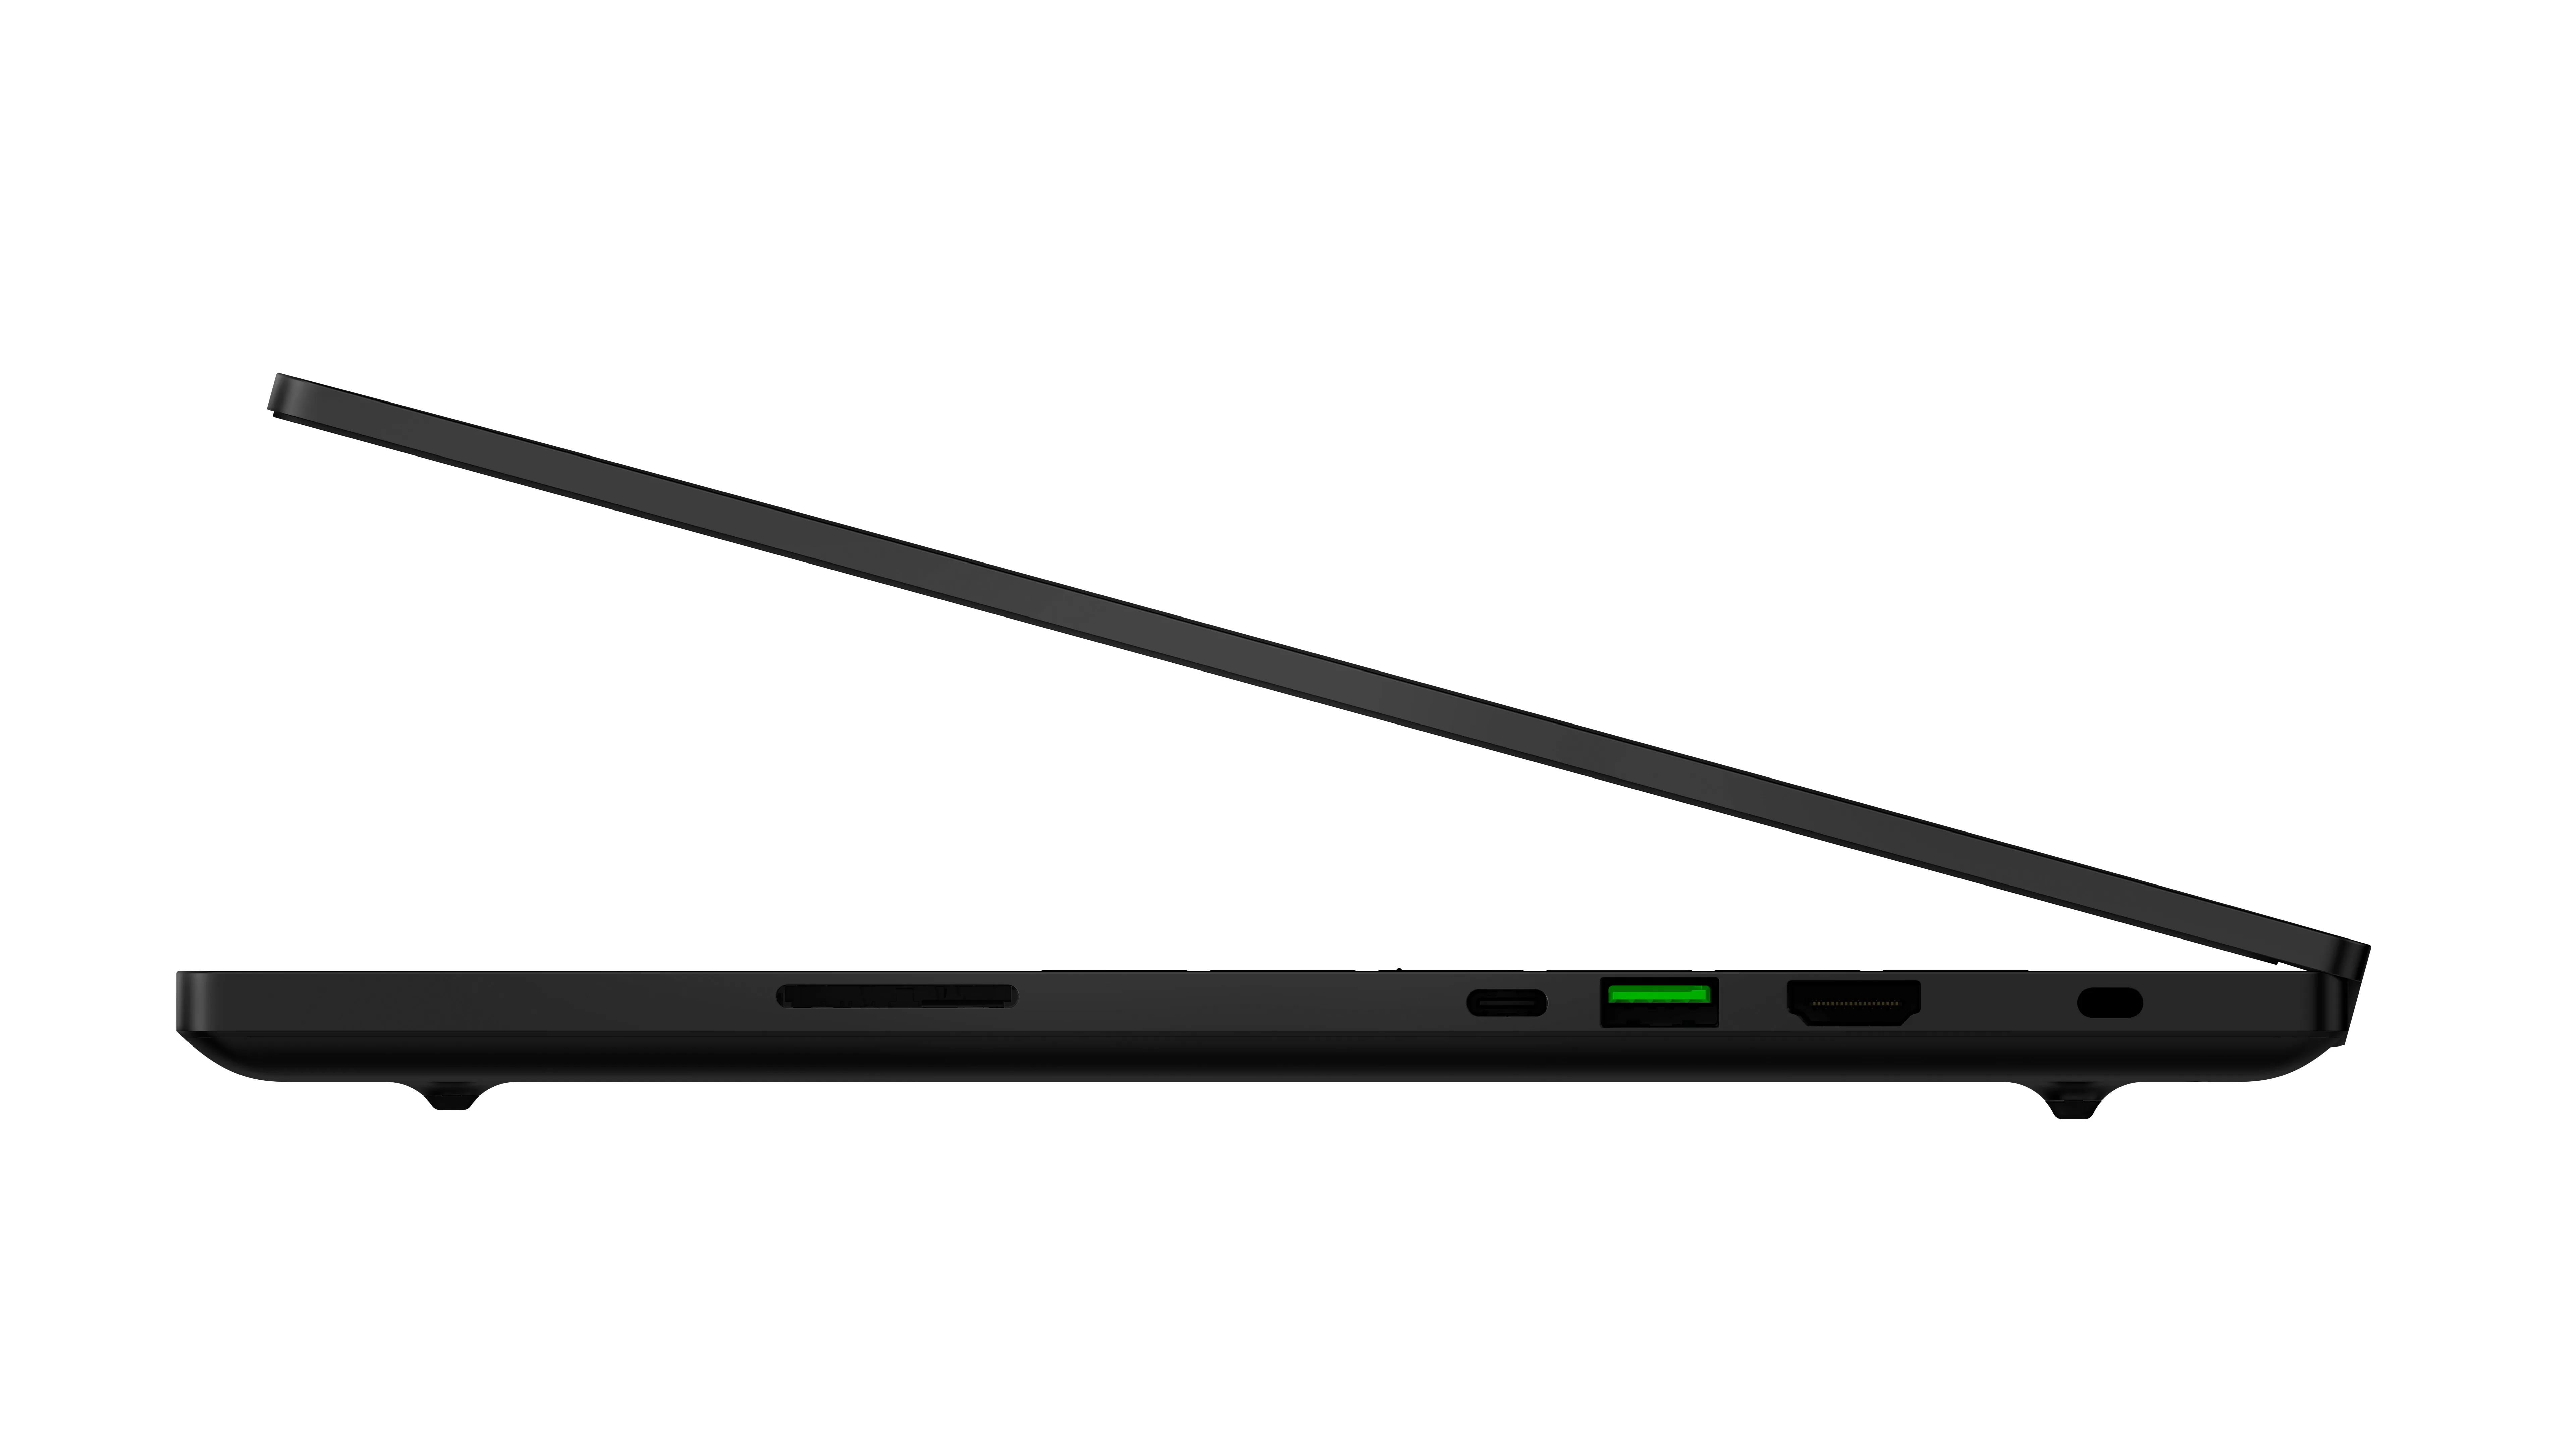
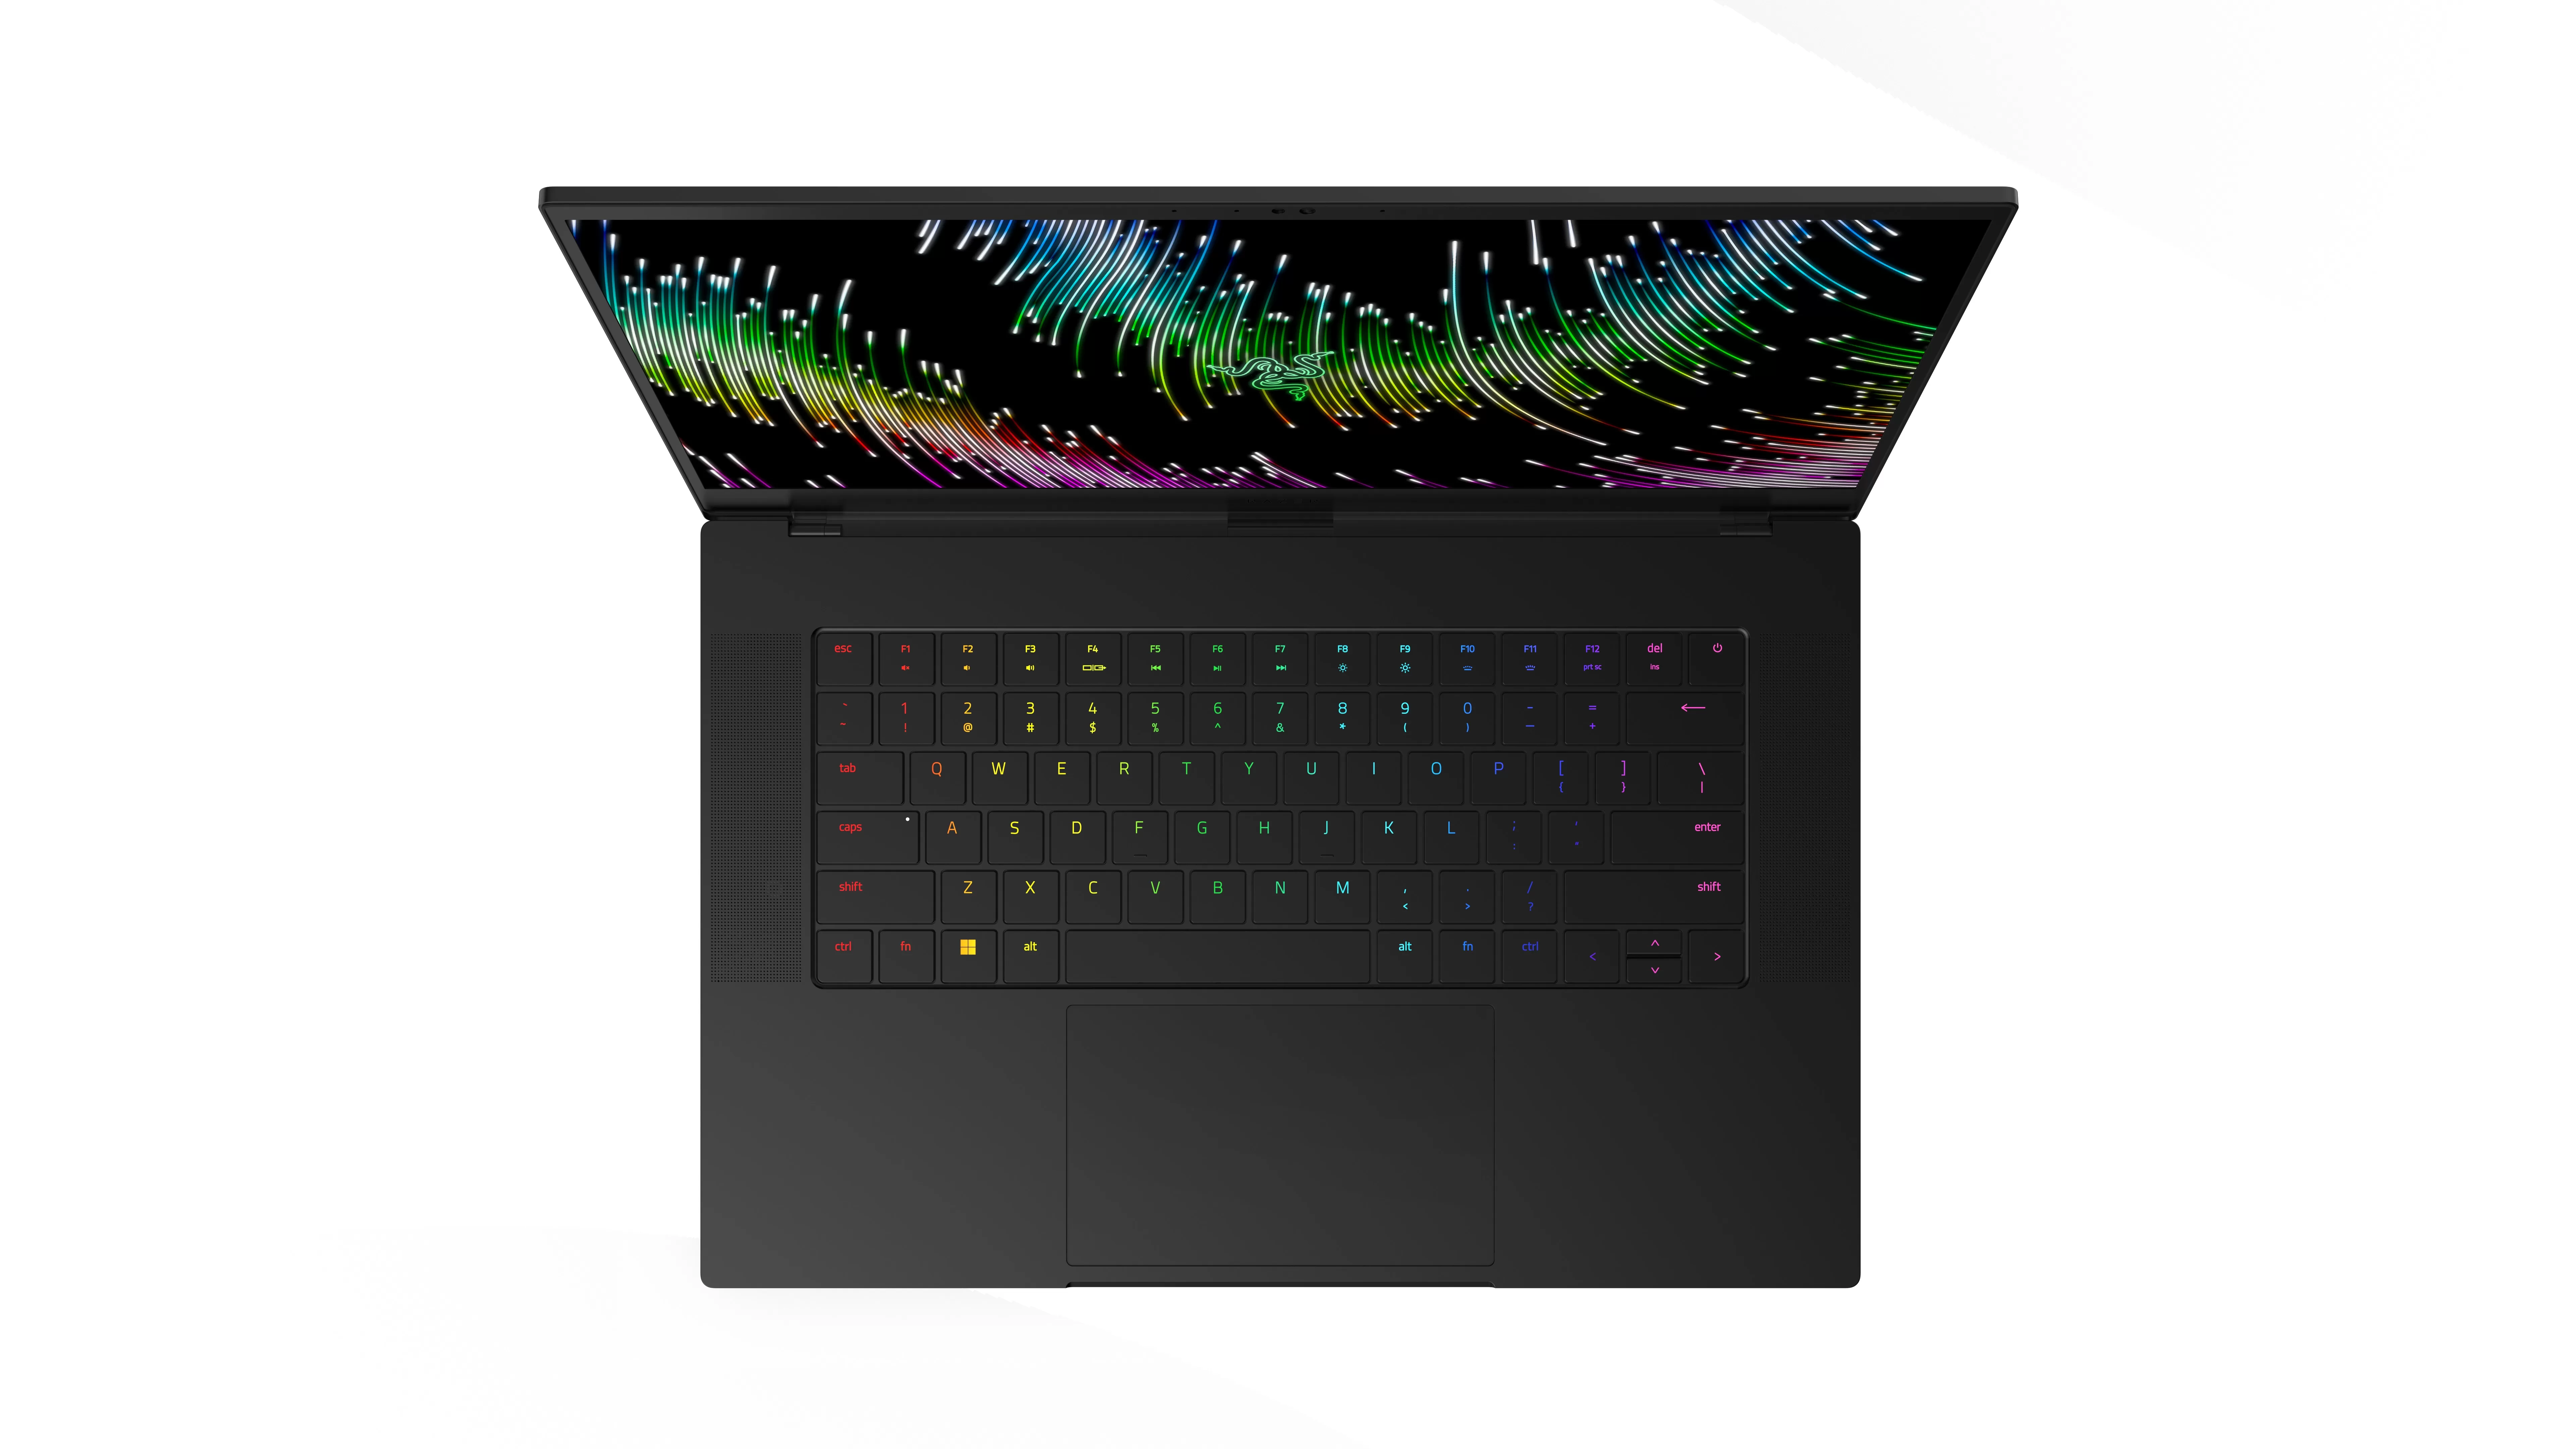
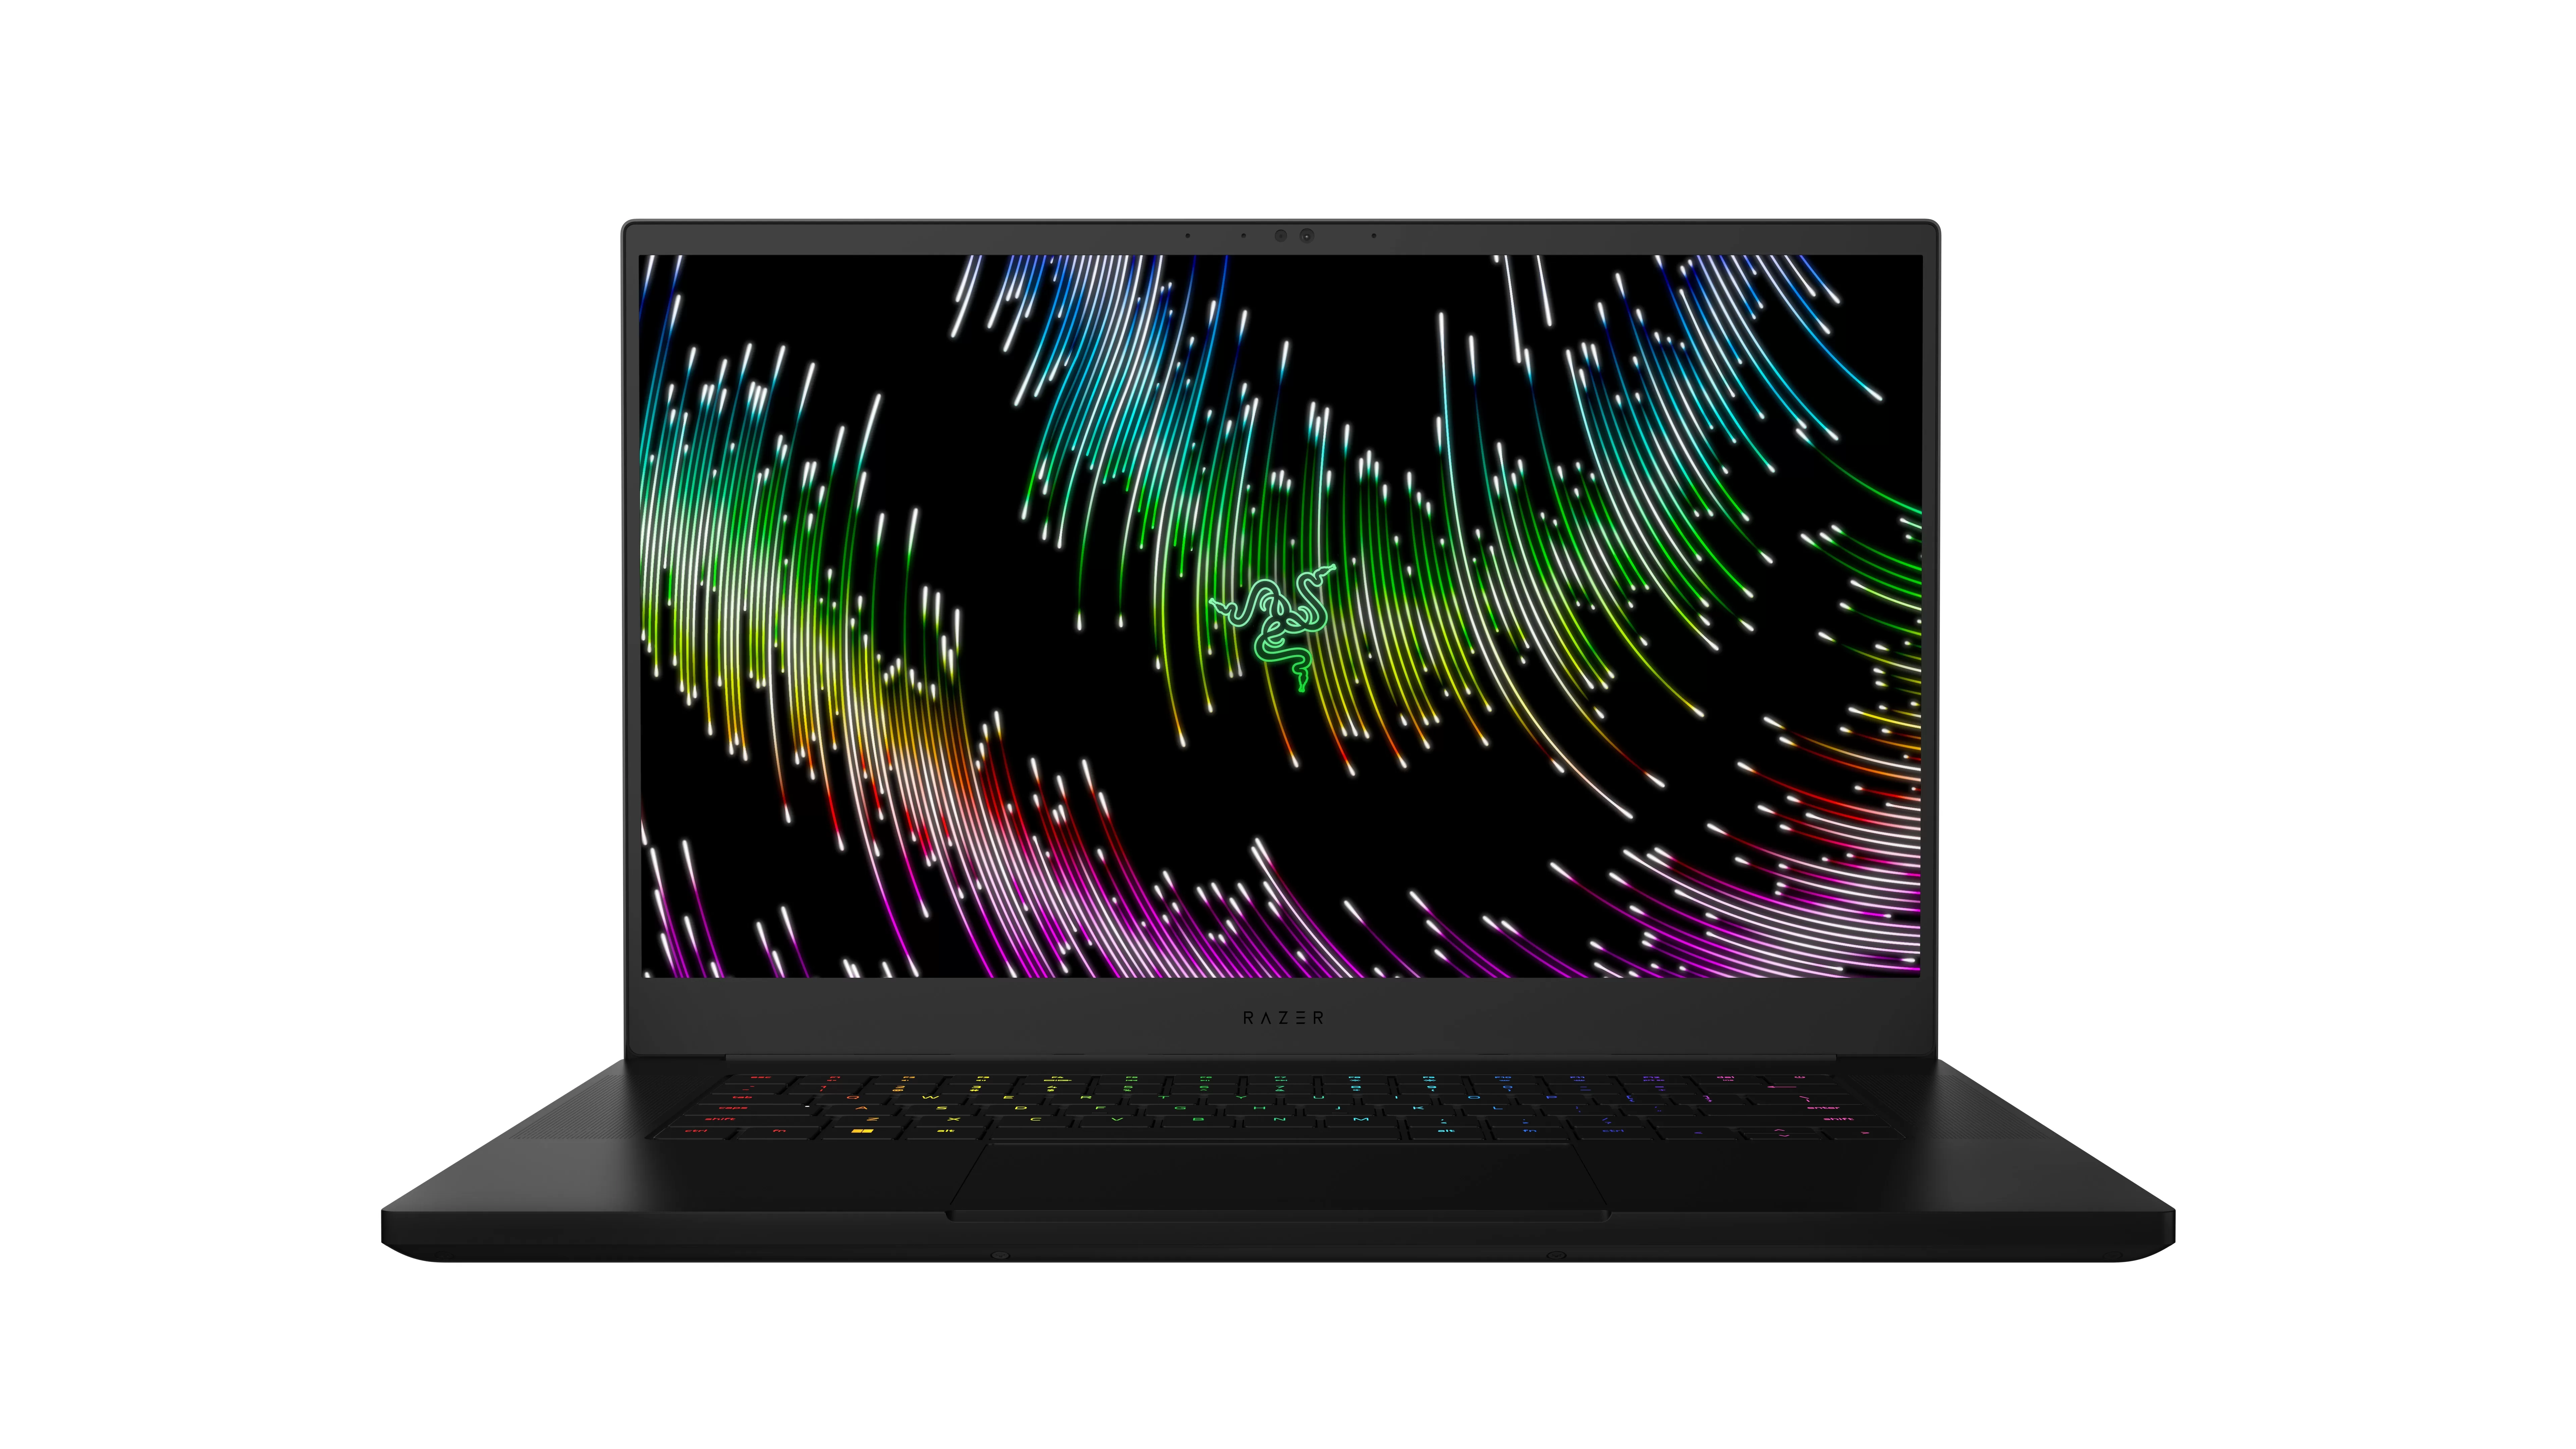
Technically, as screen sizes go, this is not the smaller Razer Blade you can buy. There is a Razer Blade 14 which featured a smaller 14-inch display. As far as we know, they have made no announcement of the Blade 14 laptop, so we are going to treat the new Razer Blade 15 as the 2023 baby Razer Blade.

Contrary to what the name of the naming scheme of the name suggests, the Razer Blade 15 is not what you want to call entry-level. Far from it in fact, the 15-inch gaming laptop is designed to be as powerful as 15-inch laptops of its class can be. They say that the Razer Blade 15 is designed for those who wants to take their AAA games anywhere in the world while remaining as thin as laptops of this class can be.

As their marketing blurb suggests, the Blade 15 is designed to be uncompromised while remaining as portable as your textbooks. It still weighs about 2kg though, which is not all that light for a laptop this size. Still, you might not be too alarmed by its weight when you know what is within the 17mm (16.99mm to be exact) thick body.

Inside you can find up to 64GB of DDR5-5200MHz RAM. That should be a good indication to what you can expect to find within the all-metal body of the Razer Blade 15. To ensure that the Windows 11 laptop can run DDR5 memory at that speeds, Razer installed Intel’s 13th Generation Core processor. You can opt for Intel’s Core i7-13800H high-performance CPU with up to 14 cores clocking at up to 5.2GHZ (turbo). Alongside a powerful CPU and high-performance RAM, you need a powerful GPU to match too. This one comes with NVIDIA’s GeForce RTX 4070 (up to) if you want.

Herein lies the problem. High-performance parts fitted into the Razer Blade 15 needs a lot of cooling. There is not a lot of space in the a body that is 25% smaller than the next best thing, the Razer Blade 16. They enhanced their vapor chamber cooling solution and put their exhaust fins on a diet to save space. That the same time, they made everything more efficient to ensure there is sufficient cooling within the svelte body of the Blade 15.

It is a laptop, so they need to ensure that it still has all the right qualities to make it as portable and mobile as possible. From its 80Wh battery, they say the Blade 15 can extract up to 6 hours of battery life. Its display offers a mobile viewing experience like no other with up to QHD in 16:10 aspect ratio goodness, and up to 240Hz in fluidity. When the mood takes you, 2.5ms in response time should keep you competitive no matter where you are seated. If cinematic games is what you care about, the 100% DCI-P3 colour gamut should take you to another world. You can kit your Razer Blade 15 with up t 4TB of storage too to ensure you have enough space for all your games, your movies, and your work documents as well.

  • Blade 15 2023 Render 1
  • Blade 15 2023 Render 10
  • Blade 15 2023 Render 9
  • Blade 15 2023 Render 8
  • Blade 15 2023 Render 7
  • Blade 15 2023 Render 6
  • Blade 15 2023 Render 5b
  • Blade 15 2023 Render 5a
  • Blade 15 2023 Render 5
  • Blade 15 2023 Render 4
  • Blade 15 2023 Render 3
  • Blade 15 2023 Render 2

The Razer Blade 15 is now available in select regions globally. There are no colour options for the Razer Blade 15, just the usual all-black. Alongside the Razer Blade 15, the Razer Blade 16 and Razer Blade 18 will also be available with NVIDIA’s latest GeForce RTX 40 series for laptops. The Razer Blade 15 will set you back US$ 2,499.99 (MYR 11,084*) onward. There are no confirmations as to whether the Razer Blade 15 will be available in Malaysia officially. It is available in Singapore though, so you can technically pop by and get your hands on one if you really want one. For more information on Razer’s latest Blade 15, you can visit their website.

*Approximately based on exchange rate of US$ 1 = MYR 4.43 as of 24/02/2023 on xe.com

Huntkey to Present at Hong Kong Global Sources Consumer Electronics Show 2023

SHENZHEN, China, Feb. 24, 2023 /PRNewswire/ — Huntkey, as a professional power solutions provider, is going to present at the Global Sources Consumer Electronics Show held in Hong Kong on April 11–14, 2023. This Show has attracted high-quality OEM/ODM manufacturers from mainland China and Asian countries to exhibit popular electronic products.

As a regular exhibitor who has participated in the exhibition for 7 years, Huntkey announced that it will exhibit its latest and hottest products at this exhibition, including fast chargers, laptop adapters, power strips, surge protectors, PC power supplies and monitors, and industrial power supplies this time.

In the field of consumer electronics, Huntkey hopes to rebuild a new height of safe and fast charging. In 2023, Huntkey released six leading safety technologies. In general, these technologies aim to improve security and user experience. The potting glue used in the charger is shock-proof and moisture-proof, so chargers can be used outdoors. The USB contact port is thickened with gold plating, which can reduce heat generation, and the charger can dissipate heat more evenly when in use. The mobile phone can guarantee its touch sensitivity even in charging mode, and users’ gaming experience is better. Huntkey’s patented fire protection technology is used to ensure that chargers will not be damaged in different abnormal environments exposed to sparks, ensuring the safety of products and users. The special design makes the internal structure more compact and orderly, and the volume of the charger is smaller and is to carry for travel.

Low-carbon is an important theme of Huntkey’s exhibition. “Huntkey has achieved energy-saving and environmental protection in design, manufacturing, environmentally friendly materials, scrap disposal, safe recycling and so on, so that every user is aware of his/her contribution to the environment in the process of using energy-saving products. Designers and planners can feel the value brought to users and society, and sellers can also have fun and be respected,” said Maoqi Liu, CEO of Huntkey Group.

Take PC peripherals for example, raw materials strictly implement RoHS standards to reduce pollution and be environmentally friendly. All power supply products are not excessively packaged, and use degradable materials to reduce carbon emissions and pollutant emissions in the packaging production process. Leading LLC resonance solution and high conversion efficiency provide efficient solutions.

Huntkey provides industrial power supplies and adapters

Welcome to visit Huntkey booth:
Date: April 11-14, 2023
Booth: 10K02
Address: AsiaWorld-Expo center, Hong Kong

About Huntkey

Founded in 1995, Huntkey is a leading provider of PC power supplies, power strips, surge protectors, laptop adapters, phone chargers, monitors and air purifiers. Huntkey is a member of Power Sources Manufacturers Association (PSMA) and China Power Supply Society (CPSS). Covering approximately 1,000,000 square meters added up from three industrial parks, Huntkey is one of the most famous brands and largest companies in mainland China. It is headquartered in Shenzhen. By 2022, Huntkey has been practicing low-carbon economy for more than ten years. Practicing a low-carbon lifestyle with Huntkey.

Website: http://www.huntkey.com
Facebook: https://www.facebook.com/HuntkeyGlobal
Instagram: https://www.instagram.com/huntkey_global
LinkedIn: https://www.linkedin.com/company/huntkey

Media Contact: Ms.Lava Huang, E-mail: marketing@huntkey.com
Business Contact: Ms.Ferris Liao, E-mail: huntkey@huntkey.com 

Cision View original content to download multimedia:https://www.prnewswire.com/news-releases/huntkey-to-present-at-hong-kong-global-sources-consumer-electronics-show-2023-301755097.html

The 6th Guangzhou Award Now Open for Application

GUANGZHOU, China, Feb. 24, 2023 /PRNewswire/ — On February 23, the launch ceremony of the 6th Guangzhou International Award for Urban Innovation (Guangzhou Award) was held in Barcelona, Spain during the 2023 United Cities and Local Governments (UCLG) Retreat and Campus. At the meeting, UCLG, World Association of the Major Metropolises (Metropolis) and Guangzhou City jointly announced the call for submissions of the 6th Guangzhou Award. Mr. Deng Changxiong, Deputy Director of the Office of Foreign Affairs Commission of the Guangzhou Municipal Committee, Ms. Emilia Saiz, Secretary General of UCLG, and Mr. Jordi Vaquer, Secretary General of Metropolis, attended the meeting and delivered speeches.


Mr. Deng read out a congratulatory message from the Chinese People’s Association for Friendship with Foreign Countries (CPAFFC) in his speech. “The CPAFFC is willing to work with the governments of all cities to support the UCLG and the Metropolis to play a greater role, and continues to make good use of international platforms such as the Global Mayors’ Forum and the Guangzhou Award to create opportunities for cooperation and development among global cities.” 

Ms. Emilia Saiz, and Mr. Jordi Vaquer highly appreciated the achievements and contributions made by Guangzhou in actively promoting international exchange and cooperation among cities and fostering the innovative development of global cities, and expressed their continued unwavering support for the development of Guangzhou Award.

Co-sponsored by the City of Guangzhou, the UCLG and the Metropolis, the Guangzhou Award aims to recognize innovation in improving social, economic, and environmental sustainability and good urban governance in cities and regions and, in doing so, to advance the prosperity and quality of life of their citizens. So far, five cycles have been held, attracting over 1,300 initiatives worldwide. It has become a global platform for city-to-city learning and the documentation, dissemination, and analysis of the local implementation of global agendas including SDGs and the New Urban Agenda (NUA).

The 6th Guangzhou Award is now calling for participation from all cities and local governments around the world with ongoing or recently completed initiatives, including those that are implemented in collaboration with private and civil society partners. Please learn more about the detailed guidelines on: http://www.guangzhouaward.org/The6thGuangzhouAward?lang=en

Vipshop Reports Unaudited Fourth Quarter and Full Year 2022 Financial Results

Conference Call to Be Held at 7:30 A.M. U.S. Eastern Time on February 23, 2023

GUANGZHOU, China, Feb. 23, 2023 /PRNewswire/ — Vipshop Holdings Limited (NYSE: VIPS), a leading online discount retailer for brands in China (“Vipshop” or the “Company”), today announced its unaudited financial results for the quarter and full year ended December 31, 2022.

Fourth Quarter and Full Year 2022 Highlights

  • Total net revenues for the fourth quarter of 2022 were RMB31.8 billion (US$4.6 billion), as compared with RMB34.1 billion in the prior year period. Total net revenues for the full year of 2022 were RMB103.2 billion (US$15.0 billion), as compared with RMB117.1 billion in the prior year.
  • GMV[1] for the fourth quarter of 2022 was RMB54.4 billion, as compared with RMB57.0 billion in the prior year period. GMV for the full year of 2022 was RMB175.2 billion, as compared with RMB191.5 billion in the prior year.
  • Gross profit for the fourth quarter of 2022 increased by 2.8% year over year to RMB6.9 billion (US$1.0 billion) from RMB6.7 billion in the prior year period. Gross profit for the full year of 2022 was RMB21.6 billion (US$3.1 billion), as compared with RMB23.1 billion in the prior year.
  • Net income attributable to Vipshop’s shareholders for the fourth quarter of 2022 increased by 57.9% year over year to RMB2.2 billion (US$323.9 million) from RMB1.4 billion in the prior year period. Net income attributable to Vipshop’s shareholders for the full year of 2022 increased by 34.6% year over year to RMB6.3 billion (US$913.2 million) from RMB4.7 billion in the prior year.
  • Non-GAAP net income attributable to Vipshop’s shareholders[2] for the fourth quarter of 2022 increased by 23.9% year over year to RMB2.2 billion (US$323.5 million) from RMB1.8 billion in the prior year period. Non-GAAP net income attributable to Vipshop’s shareholders for the full year of 2022 increased by 13.7% year over year to RMB6.8 billion (US$991.3 million) from RMB6.0 billion in the prior year.
  • The number of active customers[3] for the fourth quarter of 2022 was 47.7 million, as compared with 49.2 million in the prior year period. The number of active customers for the full year of 2022 was 84.8 million, as compared with 93.9 million in the prior year.
  • Total orders[4] for the fourth quarter of 2022 increased to 218.5 million from 216.9 million in the prior year period. Total orders for the full year of 2022 were 739.5 million, as compared with 786.6 million in the prior year.

Mr. Eric Shen, Chairman and Chief Executive Officer of Vipshop, stated, “We had another quarter of strong earnings to finish off an extremely challenging year. Our business fundamentals are now stronger with the capabilities that we have built in merchandising, operations, and technologies in the past year. We have gained momentum with brand partners, securing a consistent flow of quality merchandise at exceptional values to our platform. We have won loyalty from customers, growing the high-value customer base all year long. And we have stepped up efforts in sustainability that benefits all stakeholders. Our sharp execution in 2022 gives us confidence as we look ahead for the post-pandemic opportunities. We believe that we are now in a healthier position than before to achieve both growth and profitability.”

Mr. David Cui, Chief Financial Officer of Vipshop, further commented, “We are pleased to deliver the most profitable quarter in the past two years as we continued with topline recovery. For the full year, we achieved record-high net income with solid margin expansion through consistent efforts to optimize operating efficiency. In addition, we remain committed to delivering value to our shareholders, with a total of US$952 million of ADSs repurchased under our share buyback programs throughout 2022. Looking ahead into 2023, we are confident about regaining growth while sustaining healthy profitability.”  

Fourth Quarter 2022 Financial Results

REVENUES

Total net revenues for the fourth quarter of 2022 were RMB31.8 billion (US$4.6 billion), as compared with RMB34.1 billion in the prior year period, primarily attributable to short-term disruptions on economic activities from the surge of COVID-19 infections nationwide.

GROSS PROFIT

Gross profit for the fourth quarter of 2022 increased by 2.8% year over year to RMB6.9 billion (US$1.0 billion) from RMB6.7 billion in the prior year period. Gross margin for the fourth quarter of 2022 increased to 21.7% from 19.7% in the prior year period.

OPERATING EXPENSES

Total operating expenses for the fourth quarter of 2022 decreased by 6.5% year over year to RMB4.6 billion (US$673.9 million) from RMB5.0 billion in the prior year period. As a percentage of total net revenues, total operating expenses for the fourth quarter of 2022 was 14.6%, which stayed flat as compared with the prior year period.

  • Fulfillment expenses for the fourth quarter of 2022 were RMB2.2 billion (US$312.8 million), which largely stayed flat as compared with the prior year period. As a percentage of total net revenues, fulfillment expenses for the fourth quarter of 2022 was 6.8%, as compared with 6.4% in the prior year period.
  • Marketing expenses for the fourth quarter of 2022 decreased by 17.6% year over year to RMB944.1 million (US$136.9 million) from RMB1.1 billion in the prior year period. As a percentage of total net revenues, marketing expenses for the fourth quarter of 2022 decreased to 3.0% from 3.4% in the prior year period, primarily attributable to more prudent marketing strategy.
  • Technology and content expenses for the fourth quarter of 2022 decreased by 7.8% year over year to RMB408.5 million (US$59.2 million) from RMB443.0 million in the prior year period. As a percentage of total net revenues, technology and content expenses for the fourth quarter of 2022 was 1.3%, which stayed flat as compared with the prior year period.
  • General and administrative expenses for the fourth quarter of 2022 decreased by 5.2% year over year to RMB1.1 billion (US$165.0 million), as compared with RMB1.2 billion in the prior year period. As a percentage of total net revenues, general and administrative expenses for the fourth quarter of 2022 was 3.6%, as compared with 3.5% in the prior year period.

INCOME FROM OPERATIONS

Income from operations for the fourth quarter of 2022 increased by 37.1% year over year to RMB2.5 billion (US$363.8 million), as compared with RMB1.8 billion in the prior year period. Operating margin for the fourth quarter of 2022 increased to 7.9% from 5.4% in the prior year period.

Non-GAAP income from operations[5] for the fourth quarter of 2022, which excluded share-based compensation expenses and amortization of intangible assets resulting from business acquisitions, increased by 33.6% year over year to RMB2.8 billion (US$402.2 million) from RMB2.1 billion in the prior year period. Non-GAAP operating income margin[6] for the fourth quarter of 2022 increased to 8.7% from 6.1% in the prior year period.

NET INCOME

Net income attributable to Vipshop’s shareholders for the fourth quarter of 2022 increased by 57.9% year over year to RMB2.2 billion (US$323.9 million) from RMB1.4 billion in the prior year period. Net margin attributable to Vipshop’s shareholders for the fourth quarter of 2022 increased to 7.0% from 4.1% in the prior year period. Net income attributable to Vipshop’s shareholders per diluted ADS[7] for the fourth quarter of 2022 increased to RMB3.66 (US$0.53) from RMB2.07 in the prior year period.

Non-GAAP net income attributable to Vipshop’s shareholders for the fourth quarter of 2022, which excluded (i) share-based compensation expenses, (ii) impairment loss of investments, (iii) investment loss (gain) and revaluation of investments excluding dividends, (iv) reconciling items on the share of equity method investments, (v) amortization of intangible assets resulting from business acquisitions, and (vi) tax effects on non-GAAP adjustments, increased by 23.9% year over year to RMB2.2 billion (US$323.5 million) from RMB1.8 billion in the prior year period. Non-GAAP net margin attributable to Vipshop’s shareholders[8] for the fourth quarter of 2022 increased to 7.0% from 5.3% in the prior year period. Non-GAAP net income attributable to Vipshop’s shareholders per diluted ADS[9] for the fourth quarter of 2022 increased to RMB3.65 (US$0.53) from RMB2.64 in the prior year period.

For the quarter ended December 31, 2022, the Company’s weighted average number of ADSs used in computing diluted income per ADS was 610,448,180.

BALANCE SHEET AND CASH FLOW

As of December 31, 2022, the Company had cash and cash equivalents and restricted cash of RMB23.1 billion (US$3.3 billion) and short term investments of RMB1.6 billion (US$231.4 million).

For the quarter ended December 31, 2022, net cash generated from operating activities was RMB6.5 billion (US$946.1 million), and free cash flow[10], a non-GAAP measurement of liquidity, was as follows:

For the three months ended

Dec 31, 2021


Dec 31, 2022


Dec 31, 2022


RMB’000 

RMB’000 

US$’000

Net cash generated from operating activities

6,873,191

6,525,597

946,123

Reconciling items:

   Net impact from Internet financing activities[11]

(4,926)

243,833

35,352

   Capital expenditures

(1,204,433)

(587,100)

(85,121)

Free cash inflow

5,663,832

6,182,330

896,354

Full Year 2022 Financial Results

Total net revenues for the full year of 2022 were RMB103.2 billion (US$15.0 billion), as compared with RMB117.1 billion in the prior year.

Gross profit for the full year of 2022 was RMB21.6 billion (US$3.1 billion), as compared with RMB23.1 billion in the prior year. Gross margin for the full year of 2022 increased to 21.0% from 19.7% in the prior year.

Income from operations for the full year of 2022 increased by 11.0% year over year to RMB6.2 billion (US$898.5 million) from RMB5.6 billion in the prior year. Operating margin for the full year increased to 6.0% from 4.8% in the prior year.

Non-GAAP income from operations for the full year of 2022, which excluded share-based compensation expenses and amortization of intangible assets resulting from business acquisitions, increased by 12.1% year over year to RMB7.4 billion (US$1.1 billion) from RMB6.6 billion in the prior year. Non-GAAP operating income margin for the full year of 2022 increased to 7.2% from 5.6% in the prior year.

Net income attributable to Vipshop’s shareholders for the full year of 2022 increased by 34.6% year over year to RMB6.3 billion (US$913.2 million) from RMB4.7 billion in the prior year. Net margin attributable to Vipshop’s shareholders for the full year of 2022 increased to 6.1% from 4.0% in the prior year. Net income attributable to Vipshop’s shareholders per diluted ADS for the full year of 2022 increased to RMB9.83 (US$1.43) from RMB6.75 in the prior year.

Non-GAAP net income attributable to Vipshop’s shareholders for the full year of 2022, which excluded (i) share-based compensation expenses, (ii) impairment loss of investments, (iii) investment loss(gain) and revaluation of investments excluding dividends, (iv) reconciling items on the share of equity method investments, (v) amortization of intangible assets resulting from business acquisitions, and (vi) tax effects on non-GAAP adjustments, increased by 13.7% year over year to RMB6.8 billion (US$991.3 million) from RMB6.0 billion in the prior year. Non-GAAP net margin attributable to Vipshop’s shareholders for the full year of 2022 increased to 6.6% from 5.1% in the prior year. Non-GAAP net income attributable to Vipshop’s shareholders per diluted ADS for the full year of 2022 increased to RMB10.67(US$1.55) from RMB8.67 in the prior year.

For the full year of 2022, the Company’s weighted average number of ADSs used in computing diluted earnings per ADS was 640,786,520.

For the full year of 2022, net cash generated from operating activities was RMB10.5 billion (US$1.5 billion), and free cash flow, a non-GAAP measurement of liquidity, was as follows:

For the trailing twelve months ended

Dec 31, 2021


Dec 31, 2022


Dec 31, 2022


RMB’000 

RMB’000 

US$’000 

Net cash generated from operating activities

6,744,644

10,519,692

1,525,212

Reconciling items:

   Net impact from Internet financing activities[11]

(89,546)

408,550

59,234

   Capital expenditures

(3,578,645)

(3,102,589)

(449,833)

Free cash inflow

3,076,453

7,825,653

1,134,613

Share Repurchase Program

During the quarter ended December 31, 2022, the Company repurchased US$317.9 million of its ADSs under its current US$1 billion share repurchase program, which is effective through March 2024. As of December 31, 2022, the Company has an un-utilized amount of US$247.5 million under this program.

Business Outlook

For the first quarter of 2023, the Company expects its total net revenues to be between RMB25.2 billion and RMB26.5 billion, representing a year-over-year increase of approximately 0% to 5%. These forecasts reflect the Company’s current and preliminary view on the market and operational conditions, which is subject to change.

Exchange Rate

The Company’s business is primarily conducted in China and the significant majority of revenues generated are denominated in Renminbi. This announcement contains currency conversions of Renminbi amounts into U.S. dollars solely for the convenience of the reader. Unless otherwise noted, all translations from Renminbi to U.S. dollars are made at a rate of RMB6.8972 to US$1.00, the effective noon buying rate on December 30, 2022 as set forth in the H.10 statistical release of the Federal Reserve Board. No representation is made that the Renminbi amounts could have been, or could be, converted, realized or settled into U.S. dollars at that rate on December 30, 2022, or at any other rate.

Conference Call Information

The Company will hold a conference call on Thursday, February 23, 2023 at 7:30 am U.S. Eastern Time, 8:30 pm Beijing Time to discuss the financial results.

All participants wishing to join the conference call must pre-register online using the link provided below.

Registration Link: https://register.vevent.com/register/BI6984a3247975465ba30e29f8757ef611

Once pre-registration has been completed, each participant will receive dial-in numbers and a unique access PIN via email. To join the conference, participants should use the dial-in details followed by the PIN code.

A live webcast of the earnings conference call can be accessed at https://edge.media-server.com/mmc/p/wo4ejch9. An archived webcast will be available at the Company’s investor relations website at http://ir.vip.com.

About Vipshop Holdings Limited

Vipshop Holdings Limited is a leading online discount retailer for brands in China. Vipshop offers high quality and popular branded products to consumers throughout China at a significant discount to retail prices. Since it was founded in August 2008, the Company has rapidly built a sizeable and growing base of customers and brand partners. For more information, please visit https://ir.vip.com/.

Safe Harbor Statement

This announcement contains forward-looking statements. These statements are made under the “safe harbor” provisions of the U.S. Private Securities Litigation Reform Act of 1995. These forward-looking statements can be identified by terminology such as “will,” “expects,” “anticipates,” “future,” “intends,” “plans,” “believes,” “estimates” and similar statements. Among other things, the business outlook and quotations from management in this announcement, as well as Vipshop’s strategic and operational plans, contain forward-looking statements. Vipshop may also make written or oral forward-looking statements in its periodic reports to the U.S. Securities and Exchange Commission (the “SEC”), in its annual report to shareholders, in press releases and other written materials and in oral statements made by its officers, directors or employees to third parties. Statements that are not historical facts, including statements about Vipshop’s beliefs and expectations, are forward-looking statements. Forward-looking statements involve inherent risks and uncertainties. A number of factors could cause actual results to differ materially from those contained in any forward-looking statement, including but not limited to the following: Vipshop’s goals and strategies; Vipshop’s future business development, results of operations and financial condition; the expected growth of the online discount retail market in China; Vipshop’s ability to attract customers and brand partners and further enhance its brand recognition; Vipshop’s expectations regarding needs for and market acceptance of flash sales products and services; competition in the discount retail industry; the potential impact of the COVID-19 to Vipshop’s business operations and the economy in China and elsewhere generally; fluctuations in general economic and business conditions in China and assumptions underlying or related to any of the foregoing. Further information regarding these and other risks is included in Vipshop’s filings with the SEC. All information provided in this press release is as of the date of this press release, and Vipshop does not undertake any obligation to update any forward-looking statement, except as required under applicable law.

Use of Non-GAAP Financial Measures

The condensed consolidated financial information is derived from the Company’s unaudited interim condensed consolidated financial statements prepared in conformity with accounting principles generally accepted in the United States of America (“U.S. GAAP”), except that comparative consolidated statements of income and cash flows for the period presented and detailed footnote disclosures required by Accounting Standards Codification 270, Interim Reporting (“ASC270”), have been omitted. Vipshop uses non-GAAP net income attributable to Vipshop’s shareholders, non-GAAP net income attributable to Vipshop’s shareholders per diluted ADS, non-GAAP income from operations, non-GAAP operating income margin, non-GAAP net margin attributable to Vipshop’s shareholders, and free cash flow, each of which is a non-GAAP financial measure. Non-GAAP net income attributable to Vipshop’s shareholders is net income attributable to Vipshop’s shareholders excluding (i) share-based compensation expenses, (ii) impairment loss of investments, (iii) investment loss (gain) and revaluation of investments excluding dividends, (iv) reconciling items on the share of equity method investments, (v) amortization of intangible assets resulting from business acquisitions,and (vi) tax effects on non-GAAP adjustments. Non-GAAP net income attributable to Vipshop’s shareholders per diluted ADS is computed using non-GAAP net income attributable to Vipshop’s shareholders divided by weighted average number of diluted ADS outstanding for computing diluted earnings per ADS. Non-GAAP income from operations is income from operations excluding share-based compensation expenses and amortization of intangible assets resulting from business acquisitions. Non-GAAP operating income margin is non-GAAP income from operations as a percentage of total net revenues. Non-GAAP net margin attributable to Vipshop’s shareholders is non-GAAP net income attributable to Vipshop’s shareholders as a percentage of total net revenues. Free cash flow is net cash from operating activities adding back the impact from internet financing activities and less capital expenditures, which include purchase and deposits of property and equipment and land use rights. Impact from internet financing activities added back or deducted from free cash flow contains changes in the balances of financial products, which are primarily consumer financing and supplier financing that the Company provides to customers and suppliers. The Company believes that separate analysis and exclusion of the non-cash impact of (i) share-based compensation, (ii) impairment loss of investments, (iii) investment loss (gain) and revaluation of investments excluding dividends, (iv) reconciling items on the share of equity method investments, (v) amortization of intangible assets resulting from business acquisitions,and (vi) tax effects on non-GAAP adjustments add clarity to the constituent parts of its performance. The Company reviews these non-GAAP financial measures together with GAAP financial measures to obtain a better understanding of its operating performance. It uses these non-GAAP financial measures for planning, forecasting and measuring results against the forecast. The Company believes that non-GAAP financial measures are useful supplemental information for investors and analysts to assess its operating performance without the effect of (i) share-based compensation expenses, (ii) impairment loss of investments, (iii) investment loss (gain) and revaluation of investments excluding dividends, (iv) reconciling items on the share of equity method investments, (v) amortization of intangible assets resulting from business acquisitions, and (vi) tax effects on non-GAAP adjustments. Free cash flow enables the Company to assess liquidity and cash flow, taking into account the impact from internet financing activities and the financial resources needed for the expansion of fulfillment infrastructure, technology platform and Shan Shan Outlets. Share-based compensation expenses have been and will continue to be significant recurring expenses in its business. However, the use of non-GAAP financial measures has material limitations as an analytical tool. One of the limitations of using non-GAAP financial measures is that they do not include all items that impact the Company’s net income for the period. In addition, because non-GAAP financial measures are not measured in the same manner by all companies, they may not be comparable to other similar titled measures used by other companies. One of the key limitations of free cash flow is that it does not represent the residual cash flow available for discretionary expenditures.

The presentation of these non-GAAP financial measures is not intended to be considered in isolation from, or as a substitute for, the financial information prepared and presented in accordance with U.S. GAAP. For more information on these non-GAAP financial measures, please see the table captioned “Vipshop Holdings Limited Reconciliations of GAAP and Non-GAAP Results” at the end of this release.

Investor Relations Contact

Tel: +86 (20) 2233-0732
Email: IR@vipshop.com

[1] “Gross merchandise value (GMV)” is defined as the total Renminbi value of all products and services sold through the Company’s online sales business, online marketplace platform, Shan Shan Outlets, and other offline stores during the relevant period, including through the Company’s websites and mobile apps, third-party websites and mobile apps, Shan Shan Outlets, and other offline stores, which were fulfilled by either the Company or its third-party merchants, regardless of whether or not the goods were delivered or returned. GMV includes shipping charges paid by buyers to sellers. For prudent considerations, the Company does not consider products or services to be sold if the relevant orders were placed and canceled pre-shipment and only included orders that left the Company’s or other third-party vendors’ warehouses. 

[2] Non-GAAP net income attributable to Vipshop’s shareholders is a non-GAAP financial measure, which is defined as net income attributable to Vipshop’s shareholders excluding (i) share-based compensation expenses, (ii) impairment loss of investments, (iii) investment loss (gain) and revaluation of investments excluding dividends, (iv) reconciling items on the share of equity method investments, (v) amortization of intangible assets resulting from business acquisitions, and (vi) tax effects on non-GAAP adjustments.

[3] “Active customers” is defined as registered members who have purchased from the Company’s online sales business or the Company’s online marketplace platforms at least once during the relevant period.

[4] “Total orders” is defined as the total number of orders placed during the relevant period, including the orders for products and services sold through the Company’s online sales business and the Company’s online marketplace platforms (excluding, for the avoidance of doubt, orders from the Company’s offline stores and outlets), net of orders returned.

[5] Non-GAAP income from operations is a non-GAAP financial measure, which is defined as income from operations excluding share-based compensation expenses and amortization of intangible assets resulting from business acquisitions.

[6] Non-GAAP operating income margin is a non-GAAP financial measure, which is defined as non-GAAP income from operations as a percentage of total net revenues.

[7] “ADS” means American depositary share, each of which represents 0.2 Class A ordinary share.

[8] Non-GAAP net margin attributable to Vipshop’s shareholders is a non-GAAP financial measure, which is defined as non-GAAP net income attributable to Vipshop’s shareholders, as a percentage of total net revenues.

[9] Non-GAAP net income attributable to Vipshop’s shareholders per diluted ADS is a non-GAAP financial measure, which is defined as non-GAAP net income attributable to Vipshop’s shareholders, divided by the weighted average number of diluted ADS outstanding for computing diluted earnings per ADS.

[10] Free cash flow is a non-GAAP financial measure, which is defined as net cash from operating activities adding back the impact from Internet financing activities and less capital expenditures, which include purchase and deposits of property and equipment and land use rights.

[11] Net impact from Internet financing activities represents net cash flow relating to the Company’s financial products, which are primarily consumer financing and supplier financing that the Company provides to its customers and suppliers.

 Vipshop Holdings Limited 

 Unaudited Condensed Consolidated Statements of Income and Comprehensive Income  

 (In thousands, except for share and per share data) 

Three Months Ended

 Twelve Months Ended 

 Dec 31,2021 

Dec 31,2022

Dec 31,2022

 Dec 31,2021 

 Dec 31,2022 

 Dec 31,2022 

RMB’000

RMB’000

USD’000 

RMB’000

RMB’000

USD’000

Product revenues 

32,276,319

29,914,304

4,337,166

111,256,902

97,250,078

14,099,936

Other revenues (1)

1,855,354

1,843,456

267,276

5,802,776

5,902,411

855,769

 Total net revenues 

34,131,673

31,757,760

4,604,442

117,059,678

103,152,489

14,955,705

 Cost of revenues 

(27,418,277)

(24,857,565)

(3,604,008)

(93,953,121)

(81,536,409)

(11,821,668)

 Gross profit 

6,713,396

6,900,195

1,000,434

23,106,557

21,616,080

3,134,037

 Operating expenses: 

 Fulfillment expenses (2) 

(2,183,570)

(2,157,586)

(312,821)

(7,652,504)

(7,247,210)

(1,050,747)

 Marketing expenses 

(1,145,834)

(944,051)

(136,875)

(5,089,213)

(2,831,316)

(410,502)

 Technology and content expenses 

(443,011)

(408,543)

(59,233)

(1,517,307)

(1,605,422)

(232,764)

 General and administrative expenses 

(1,200,449)

(1,137,858)

(164,974)

(4,189,690)

(4,459,518)

(646,569)

 Total operating expenses 

(4,972,864)

(4,648,038)

(673,903)

(18,448,714)

(16,143,466)

(2,340,582)

 Other operating income 

89,183

257,062

37,270

924,579

724,832

105,091

 Income from operations 

1,829,715

2,509,219

363,801

5,582,422

6,197,446

898,546

 Investment gain and revaluation of investments 

92,232

257,064

37,271

85,685

546,031

79,167

 Impairment loss of investments 

(217,046)

(34,347)

(4,980)

(414,780)

(93,904)

(13,615)

 Interest expense 

(4,899)

(4,311)

(625)

(14,461)

(24,258)

(3,517)

 Interest income 

194,870

198,255

28,744

671,461

764,018

110,772

 Exchange (loss) gain 

(34,451)

160,542

23,276

(37,052)

687,871

99,732

 Income before income tax expense and share of  (loss) income of equity method investees 

1,860,421

3,086,422

447,487

5,873,275

8,077,204

1,171,085

 Income tax expenses

(390,691)

(903,839)

(131,044)

(1,222,704)

(1,758,810)

(255,003)

 Share of (loss) income of equity method investees 

(47,023)

59,176

8,580

42,303

(6,559)

(951)

 Net income 

1,422,707

2,241,759

325,023

4,692,874

6,311,835

915,131

Net income attributable to non-controlling interests

(7,938)

(7,998)

(1,160)

(11,801)

(13,019)

(1,888)

 Net income attributable to Vipshop’s shareholders 

1,414,769

2,233,761

323,863

4,681,073

6,298,816

913,243

 Shares used in calculating earnings per share (3): 

 Weighted average number of Class A and Class B ordinary shares: 

 —Basic 

135,695,489

121,010,371

121,010,371

136,175,112

127,235,048

127,235,048

 —Diluted 

136,631,560

122,089,636

122,089,636

138,745,022

128,157,304

128,157,304

 Net earnings per Class A and Class B ordinary share 

 Net income attributable to Vipshop’s shareholders——Basic 

10.43

18.46

2.68

34.38

49.51

7.18

 Net income attributable to Vipshop’s shareholders——Diluted 

10.35

18.30

2.65

33.74

49.15

7.13

 Net earnings per ADS (1 ordinary share equals to 5 ADSs) 

 Net income attributable to Vipshop’s shareholders——Basic 

2.09

3.69

0.54

6.88

9.90

1.44

 Net income attributable to Vipshop’s shareholders——Diluted 

2.07

3.66

0.53

6.75

9.83

1.43

(1) Other revenues primarily consist of product promotion and online advertising revenues, lease income mainly earned from the Shan
Shan Outlets ,fees charged to third-party merchants which the Company provides platform access for sales of their products, revenue from
third-party logistics services, loan facilitation service income and membership fee income.

(1) Other revenues primarily consist of product promotion
and online advertising revenues, lease income mainly
earned from the Shan Shan Outlets ,fees charged to third-
party merchants which the Company provides platform
access for sales of their products, revenue from third-party
logistics services, loan facilitation service income and
membership fee income.

 (2) Fulfillment expenses include shipping and handling expenses, which amounted RMB1.5 billion and RMB 1.5 billion in the three month
periods ended December 31,2021 and December 31,2022, respectively. 

 (2) Fulfillment expenses include shipping and handling
expenses, which amounted RMB5.2 billion and RMB 5.1
billion in the twelve month periods ended December
31,2021 and December 31,2022, respectively. 

(3) Authorized share capital is re-classified and re-designated into Class A ordinary shares and Class B ordinary shares, with each Class A
ordinary share being entitled to one vote and each Class B ordinary share being entitled to ten votes on all matters that are subject to
shareholder vote.

(3) Authorized share capital is re-classified and re-
designated into Class A ordinary shares and Class B
ordinary shares, with each Class A ordinary share being
entitled to one vote and each Class B ordinary share being
entitled to ten votes on all matters that are subject to
shareholder vote.

Three Months Ended

Twelve Months Ended 

 Dec 31,2021 

Dec 31,2022

Dec 31,2022

 Dec 31,2021 

 Dec 31,2022 

 Dec 31,2022 

 RMB’000 

 RMB’000 

 USD’000 

 RMB’000 

 RMB’000 

 USD’000 

 Share-based compensation expenses are included in the operating
expenses as follows: 

 Fulfillment expenses 

18,867

16,913

2,452

88,985

74,063

10,738

 Marketing expenses 

2,571

4,489

651

26,834

14,630

2,121

 Technology and content expenses 

59,809

52,588

7,625

252,730

242,714

35,190

 General and administrative expenses 

165,469

191,191

27,720

641,464

876,174

127,033

 Total 

246,716

265,181

38,448

1,010,013

1,207,581

175,082

 Vipshop Holdings Limited

 Unaudited Condensed Consolidated Balance Sheets

 (In thousands, except for share and per share data) 

 Dec 31,2021 

Dec 31,2022

Dec 31,2022

RMB’000

 RMB’000 

 USD’000 

ASSETS

CURRENT ASSETS

Cash and cash equivalents

16,297,410

21,938,653

3,180,806

Restricted cash 

873,859

1,164,748

168,873

Short term investments

5,381,618

1,595,904

231,384

Accounts receivable, net

459,128

567,730

82,313

Amounts due from related parties,net

637,825

670,187

97,168

Other receivables and prepayments,net

2,326,866

2,280,449

330,634

Loan receivables,net

131

882

128

Inventories

6,865,108

5,515,880

799,727

Total current assets

32,841,945

33,734,433

4,891,033

NON-CURRENT ASSETS

Property and equipment, net

14,376,712

16,225,589

2,352,489

Deposits for property and equipment

382,121

296,717

43,020

Land use rights, net

6,612,165

7,638,506

1,107,479

Intangible assets, net

320,943

336,599

48,802

Investment in equity method investees

2,476,868

2,162,872

313,587

Other investments

2,482,911

2,660,305

385,709

Other long-term assets

296,366

91,762

13,304

Goodwill

589,165

755,213

109,496

Deferred tax assets, net

760,023

681,770

98,847

Operating lease right-of-use assets

1,148,322

891,744

129,291

Total non-current assets

29,445,596

31,741,077

4,602,024

TOTAL ASSETS

62,287,541

65,475,510

9,493,057

 LIABILTIES AND  EQUITY  

 CURRENT LIABILITIES 

 Short term loans 

1,975,184

2,687,438

389,642

 Accounts payable 

13,144,935

15,018,138

2,177,425

 Advance from customers  

1,828,781

1,737,424

251,903

 Accrued expenses and other current liabilities  

7,658,677

8,394,742

1,217,121

 Amounts due to related parties  

429,088

151,736

22,000

 Deferred income  

449,693

400,207

58,025

 Operating lease liabilities 

284,659

136,435

19,781

Total current liabilities

25,771,017

28,526,120

4,135,897

 NON-CURRENT LIABILITIES 

Deferred tax liability 

437,202

573,734

83,184

Deferred income-non current 

1,026,155

1,469,685

213,084

 Operating lease liabilities 

952,813

832,928

120,763

 Other long term liabilities  

272,038

Total non-current liabilities

2,688,208

2,876,347

417,031

TOTAL LIABILITIES

28,459,225

31,402,467

4,552,928

EQUITY:

Class A ordinary shares (US$0.0001 par value, 483,489,642 shares
authorized,122,975,885 and 124,060,090 shares issued, of which
120,232,895 and 101,621,330 shares were outstanding as of December
31,2021 and December 31,2022, respectively) 

80

80

12

Class B ordinary shares (US$0.0001 par value, 16,510,358 shares
authorized, and 15,560,358 and 15,560,358 shares issued and outstanding
as of December 31, 2021 and December 31,2022, respectively) 

11

11

2

Treasury shares,at cost(2,742,990 and 22,438,760 Class A shares as of
December 31, 2021 and December 31,2022, respectively )

(1,927,719)

(8,352,511)

(1,211,000)

Additional paid-in capital

12,227,637

13,091,781

1,898,130

Retained earnings

22,421,488

28,720,304

4,164,053

Accumulated other comprehensive loss

(88,599)

(707,628)

(102,596)

Non-controlling interests

1,195,418

1,321,006

191,528

Total shareholders’ equity

33,828,316

34,073,043

4,940,129

TOTAL LIABILITIES AND SHAREHOLDERS’ EQUITY 

62,287,541

65,475,510

9,493,057

 Vipshop Holdings Limited

 Reconciliations of GAAP and Non-GAAP Results

Three Months Ended

Twelve Months Ended

 Dec 31,2021 

 Dec 31,2022 

 Dec 31,2022 

 Dec 31,2021 

 Dec 31,2022 

 Dec 31,2022 

 RMB’000 

 RMB’000 

 USD’000 

 RMB’000 

 RMB’000 

 USD’000 

 Income from operations 

1,829,715

2,509,219

363,801

5,582,422

6,197,446

898,545

 Share-based compensation expenses 

246,716

265,181

38,448

1,010,013

1,207,581

175,082

 Amortization of intangible assets resulting from business acquisitions  

11,792.00

 Non-GAAP income from operations 

2,076,431

2,774,400

402,249

6,604,227

7,405,027

1,073,627

 Net income attributable to Vipshop’s shareholders 

1,414,769

2,233,761

323,863

4,681,073

6,298,816

913,243

 Share-based compensation expenses 

246,716

265,181

38,448

1,010,013

1,207,581

175,082

 Impairment loss of investments 

217,046

34,347

4,980

414,780

93,904

13,615

 Investment loss (gain) and revaluation of investments excluding dividends 

984

(257,064)

(37,271)

116,567

(533,826)

(77,397)

 Reconciling items on the share of equity method investments(4) 

(77,608)

(46,430)

(6,732)

(120,621)

2,965

430

 Amortization of intangible assets resulting from business acquisitions  

11,792

0

 Tax effects on non-GAAP adjustments 

(1,029)

1,270

184

(101,925)

(232,532)

(33,714)

 Non-GAAP net income attributable to Vipshop’s shareholders 

1,800,878

2,231,065

323,472

6,011,679

6,836,908

991,259

(4) To exclude the GAAP to non-GAAP reconciling items relating to investment loss (gain) and revaluation of investments on the share of
equity method investments.

 Shares used in calculating earnings per share: 

 Weighted average number of Class A and Class B ordinary shares: 

 —Basic 

135,695,489

121,010,371

121,010,371

136,175,112

127,235,048

127,235,048

 —Diluted 

136,631,560

122,089,636

122,089,636

138,745,022

128,157,304

128,157,304

 Non-GAAP net income per Class A and Class B ordinary share 

 Non-GAAP net income attributable to Vipshop’s shareholders——Basic 

13.27

18.44

2.67

44.15

53.73

7.79

 Non-GAAP net income attributable to Vipshop’s shareholders——Diluted 

13.18

18.27

2.65

43.33

53.35

7.74

 Non-GAAP net income per ADS (1 ordinary share equal to 5 ADSs) 

 Non-GAAP net income attributable to Vipshop’s shareholders——Basic 

2.65

3.69

0.53

8.83

10.75

1.56

 Non-GAAP net income attributable to Vipshop’s shareholders——Diluted 

2.64

3.65

0.53

8.67

10.67

1.55

Cision View original content:https://www.prnewswire.com/news-releases/vipshop-reports-unaudited-fourth-quarter-and-full-year-2022-financial-results-301754108.html

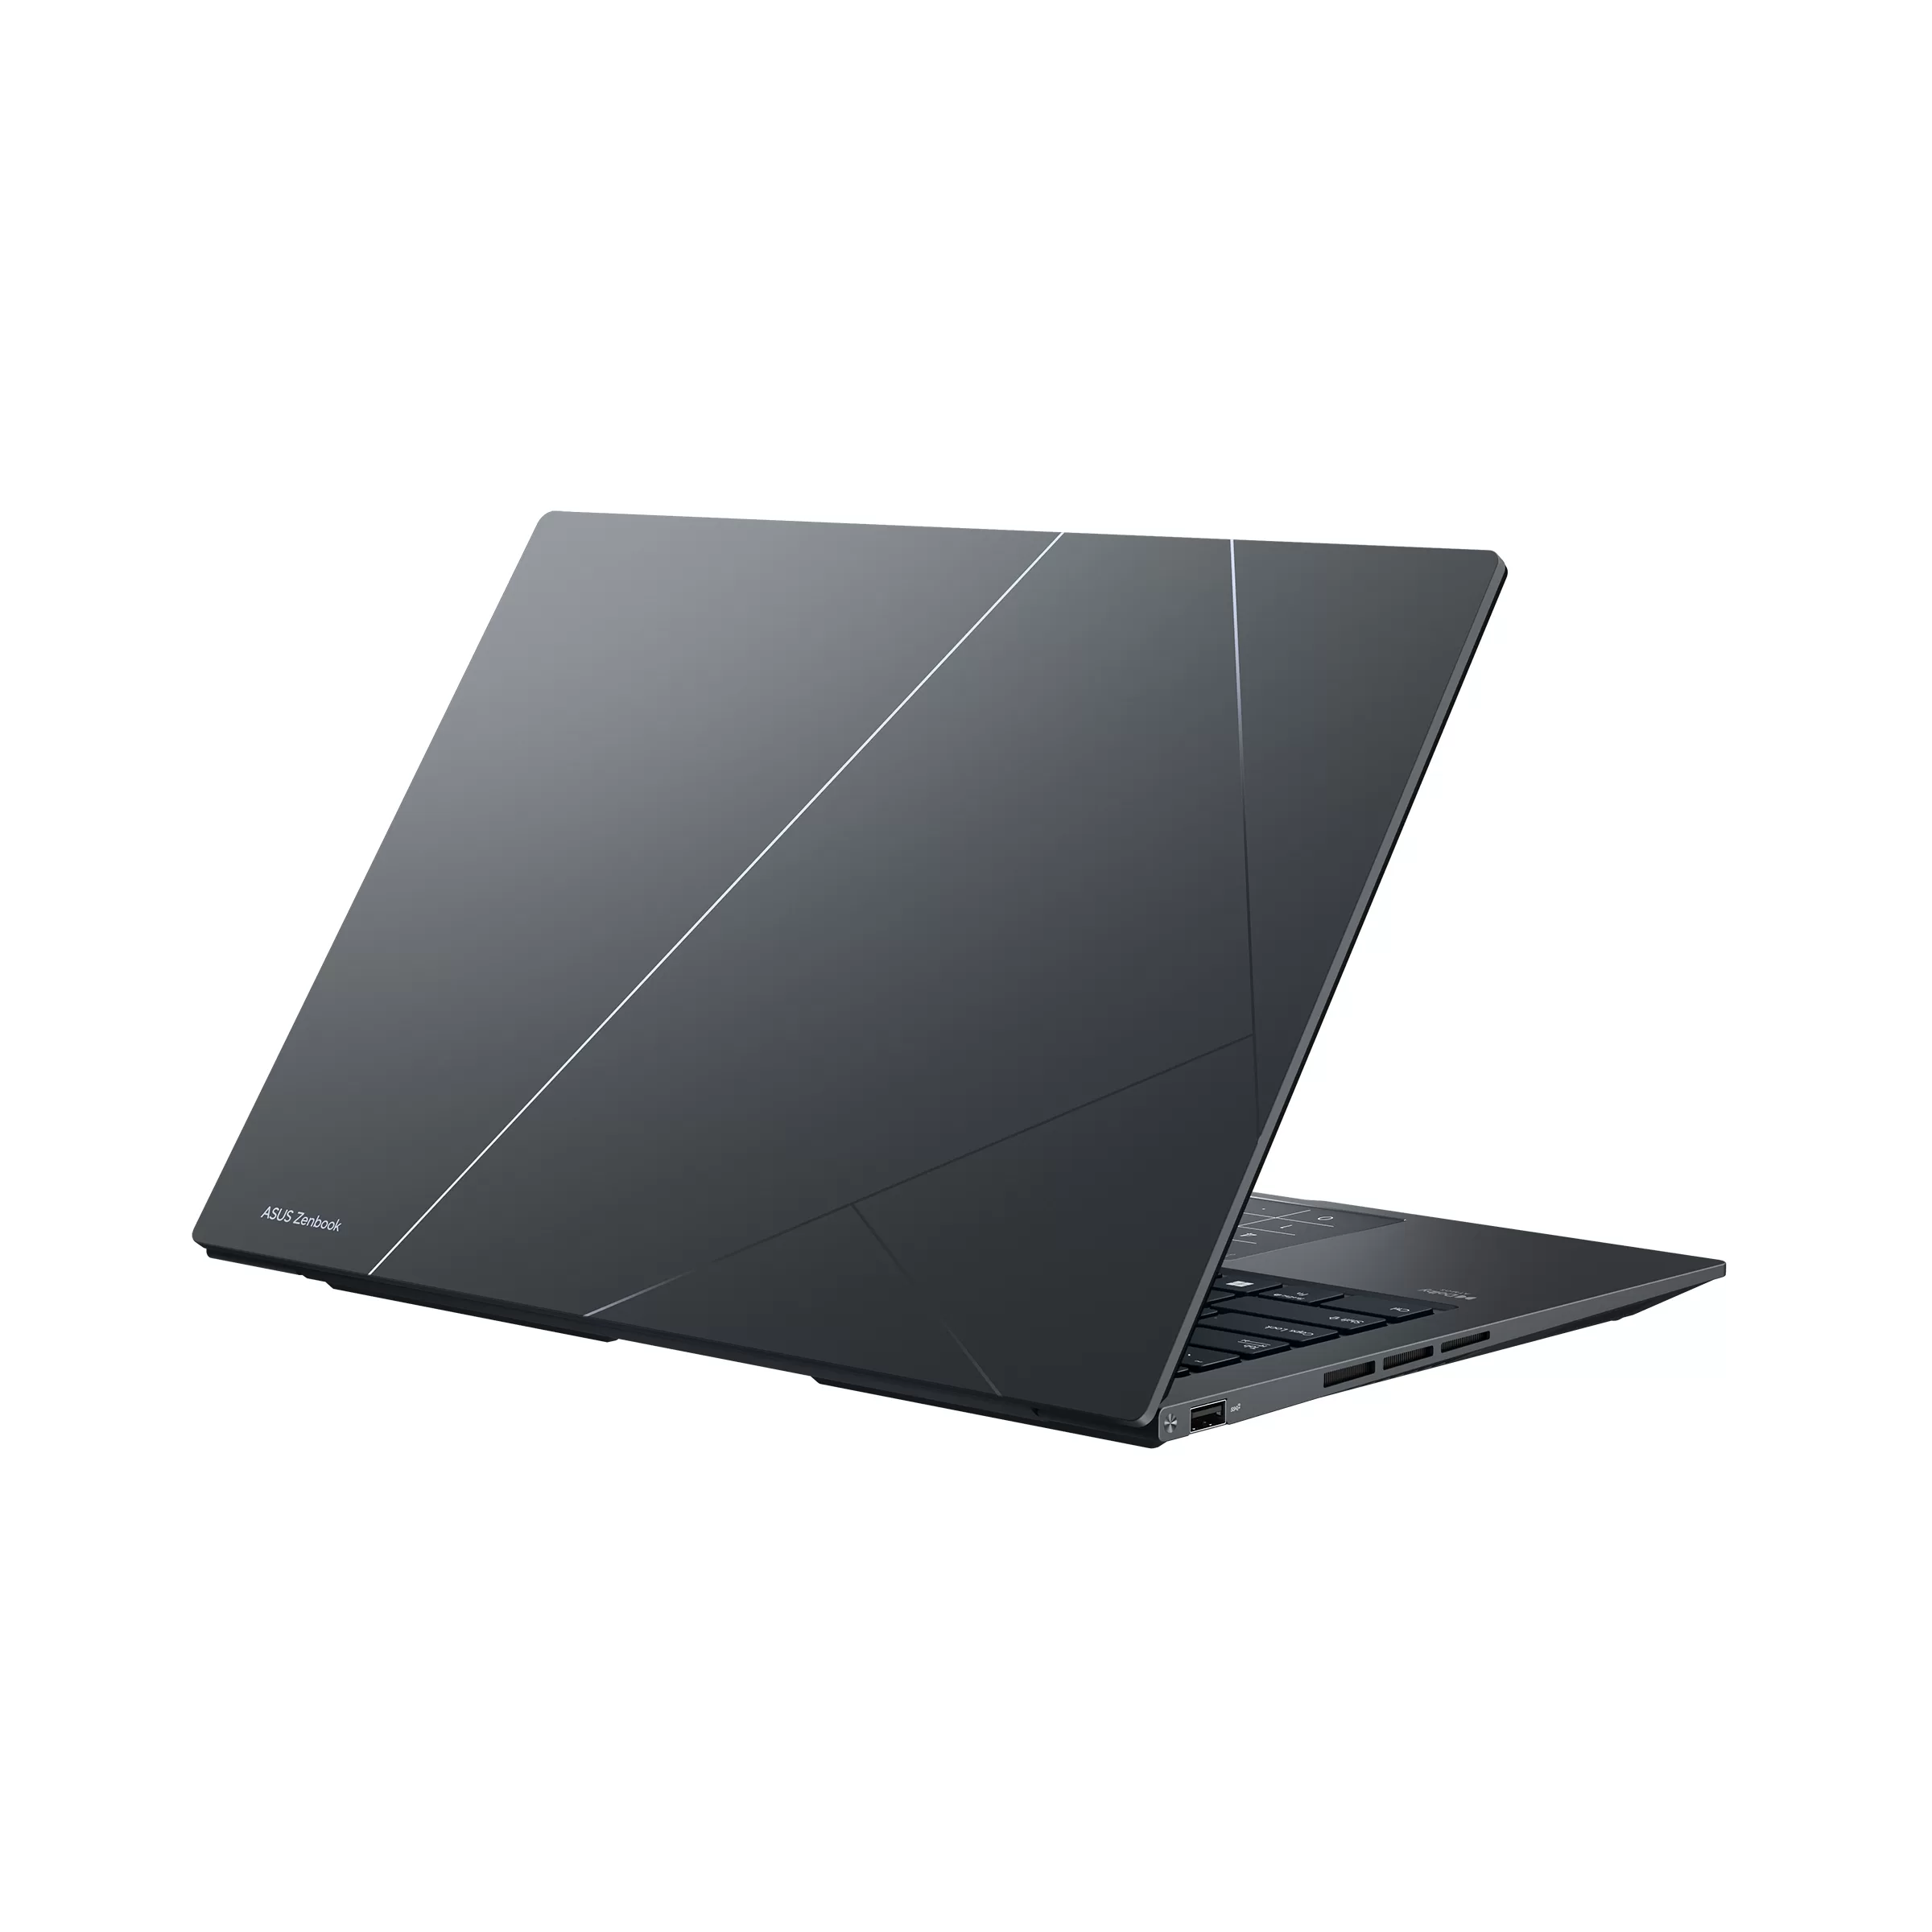
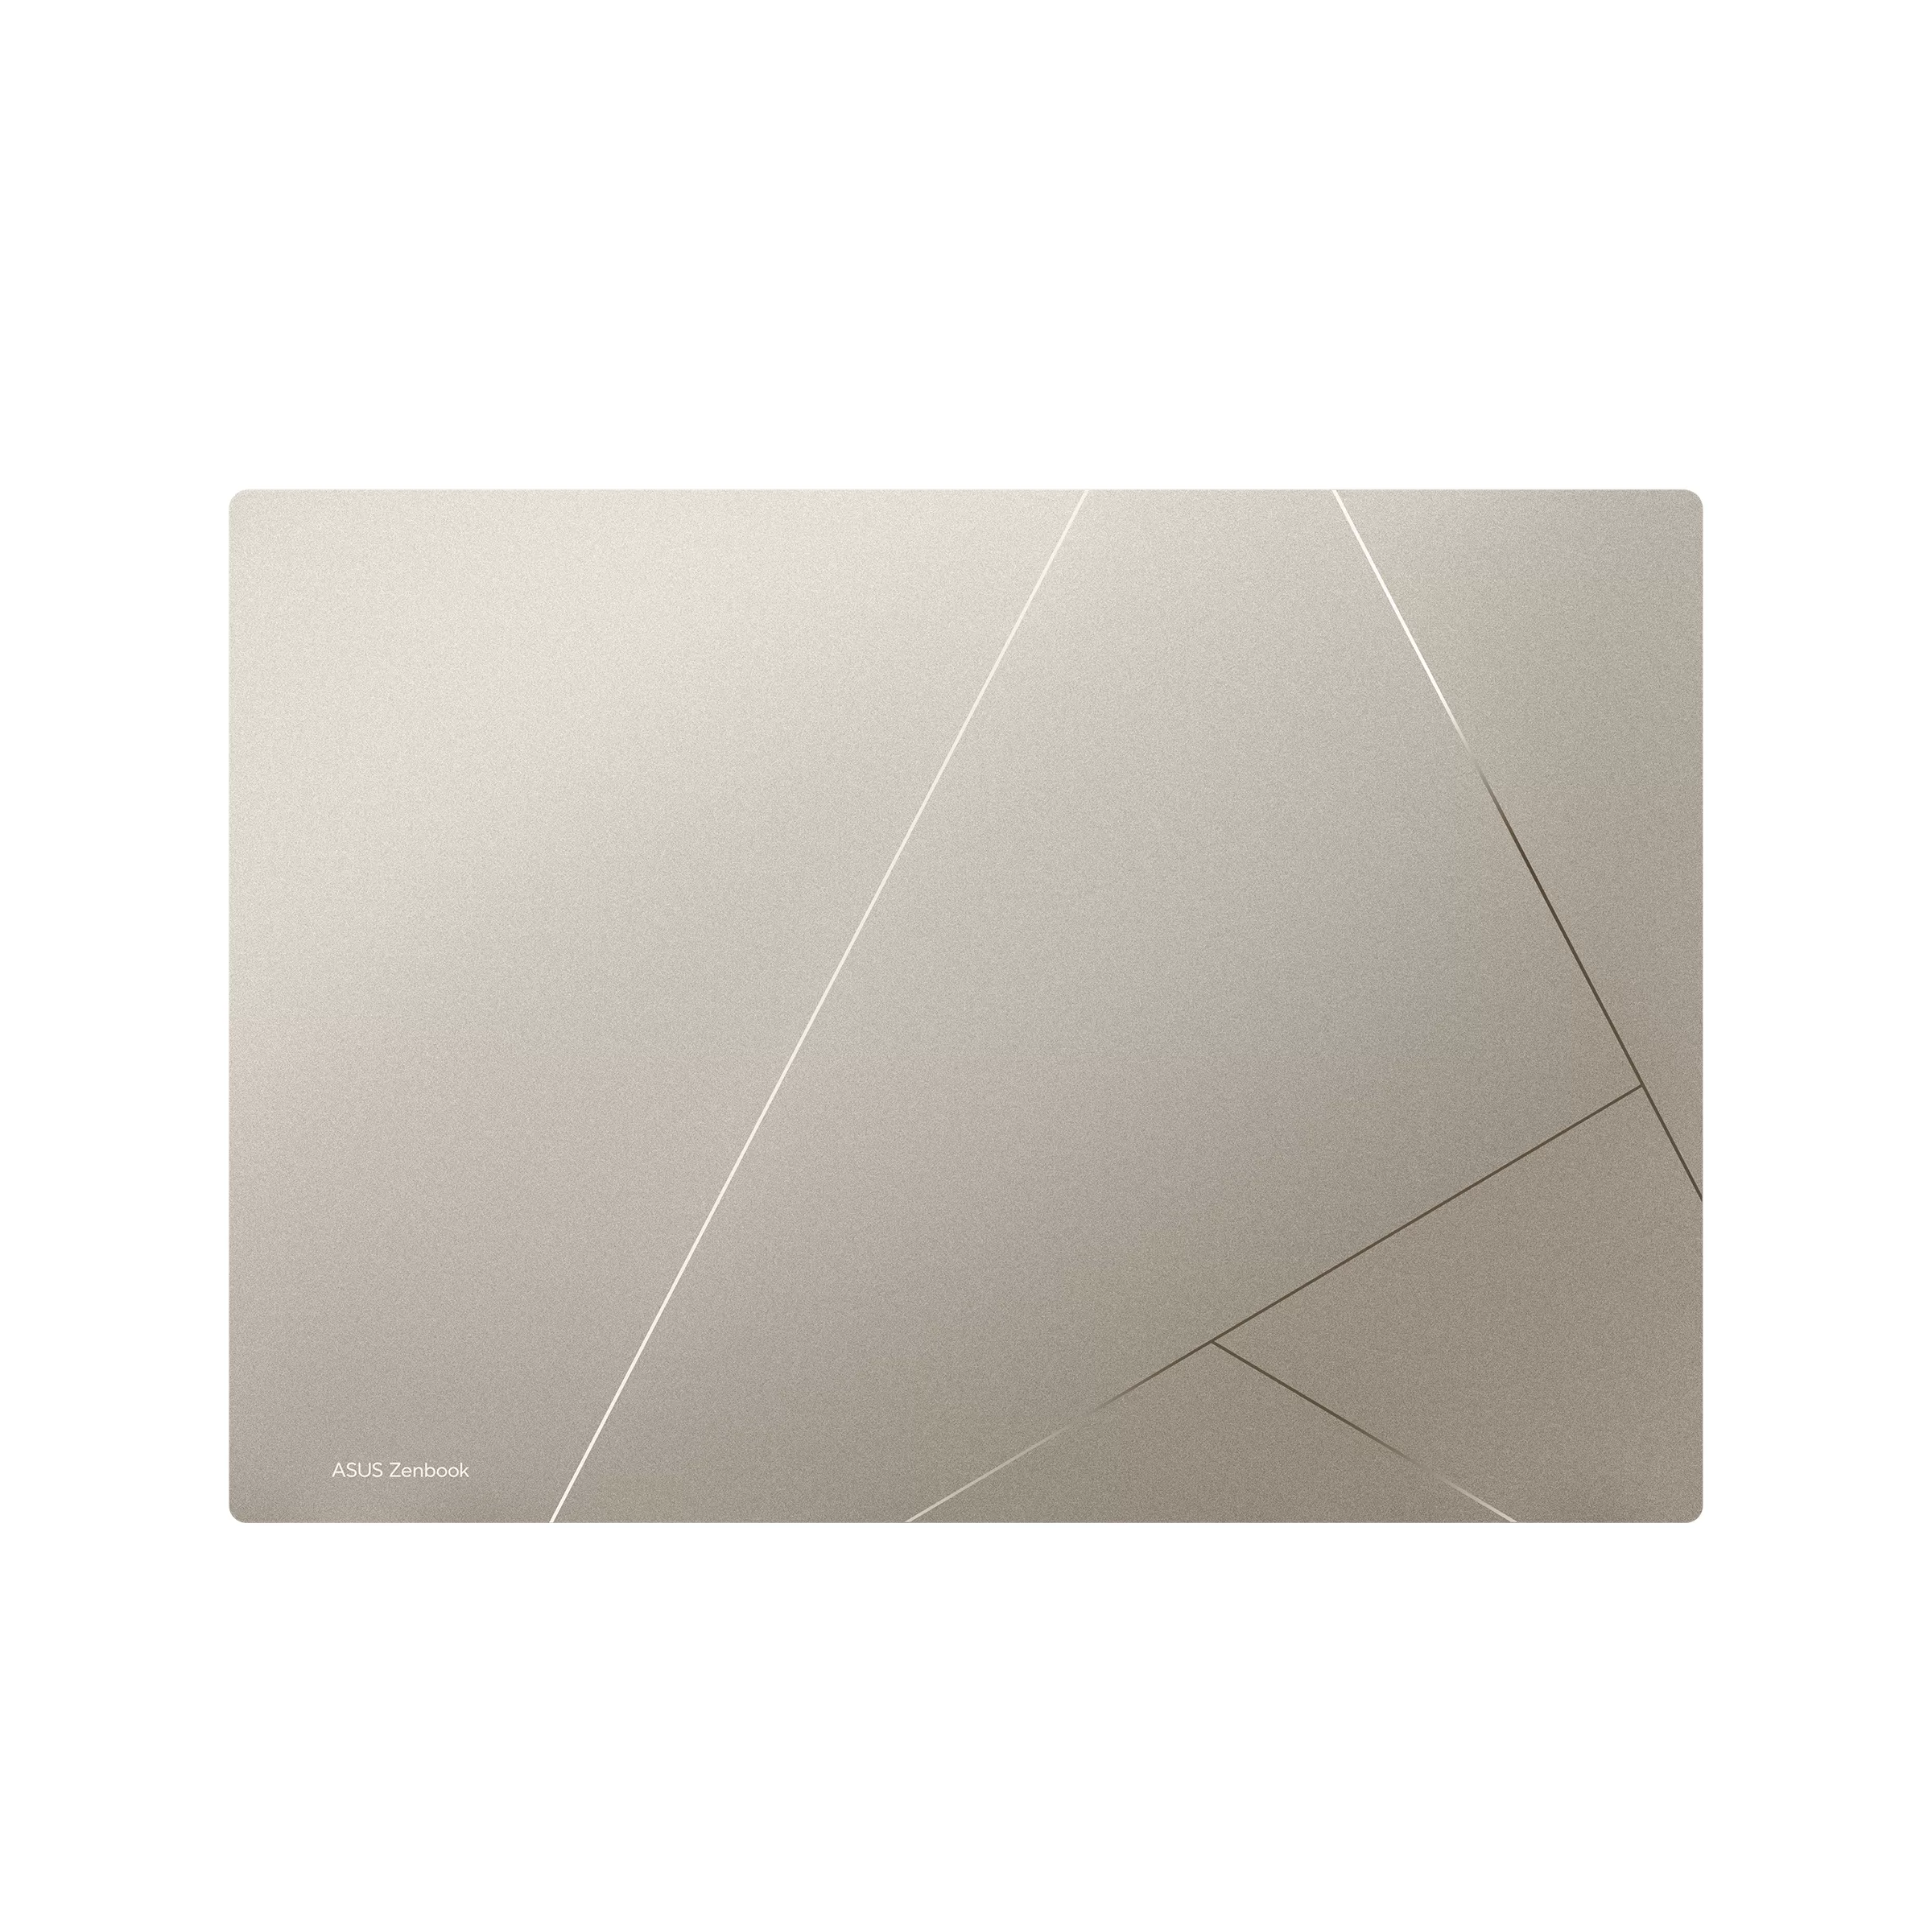
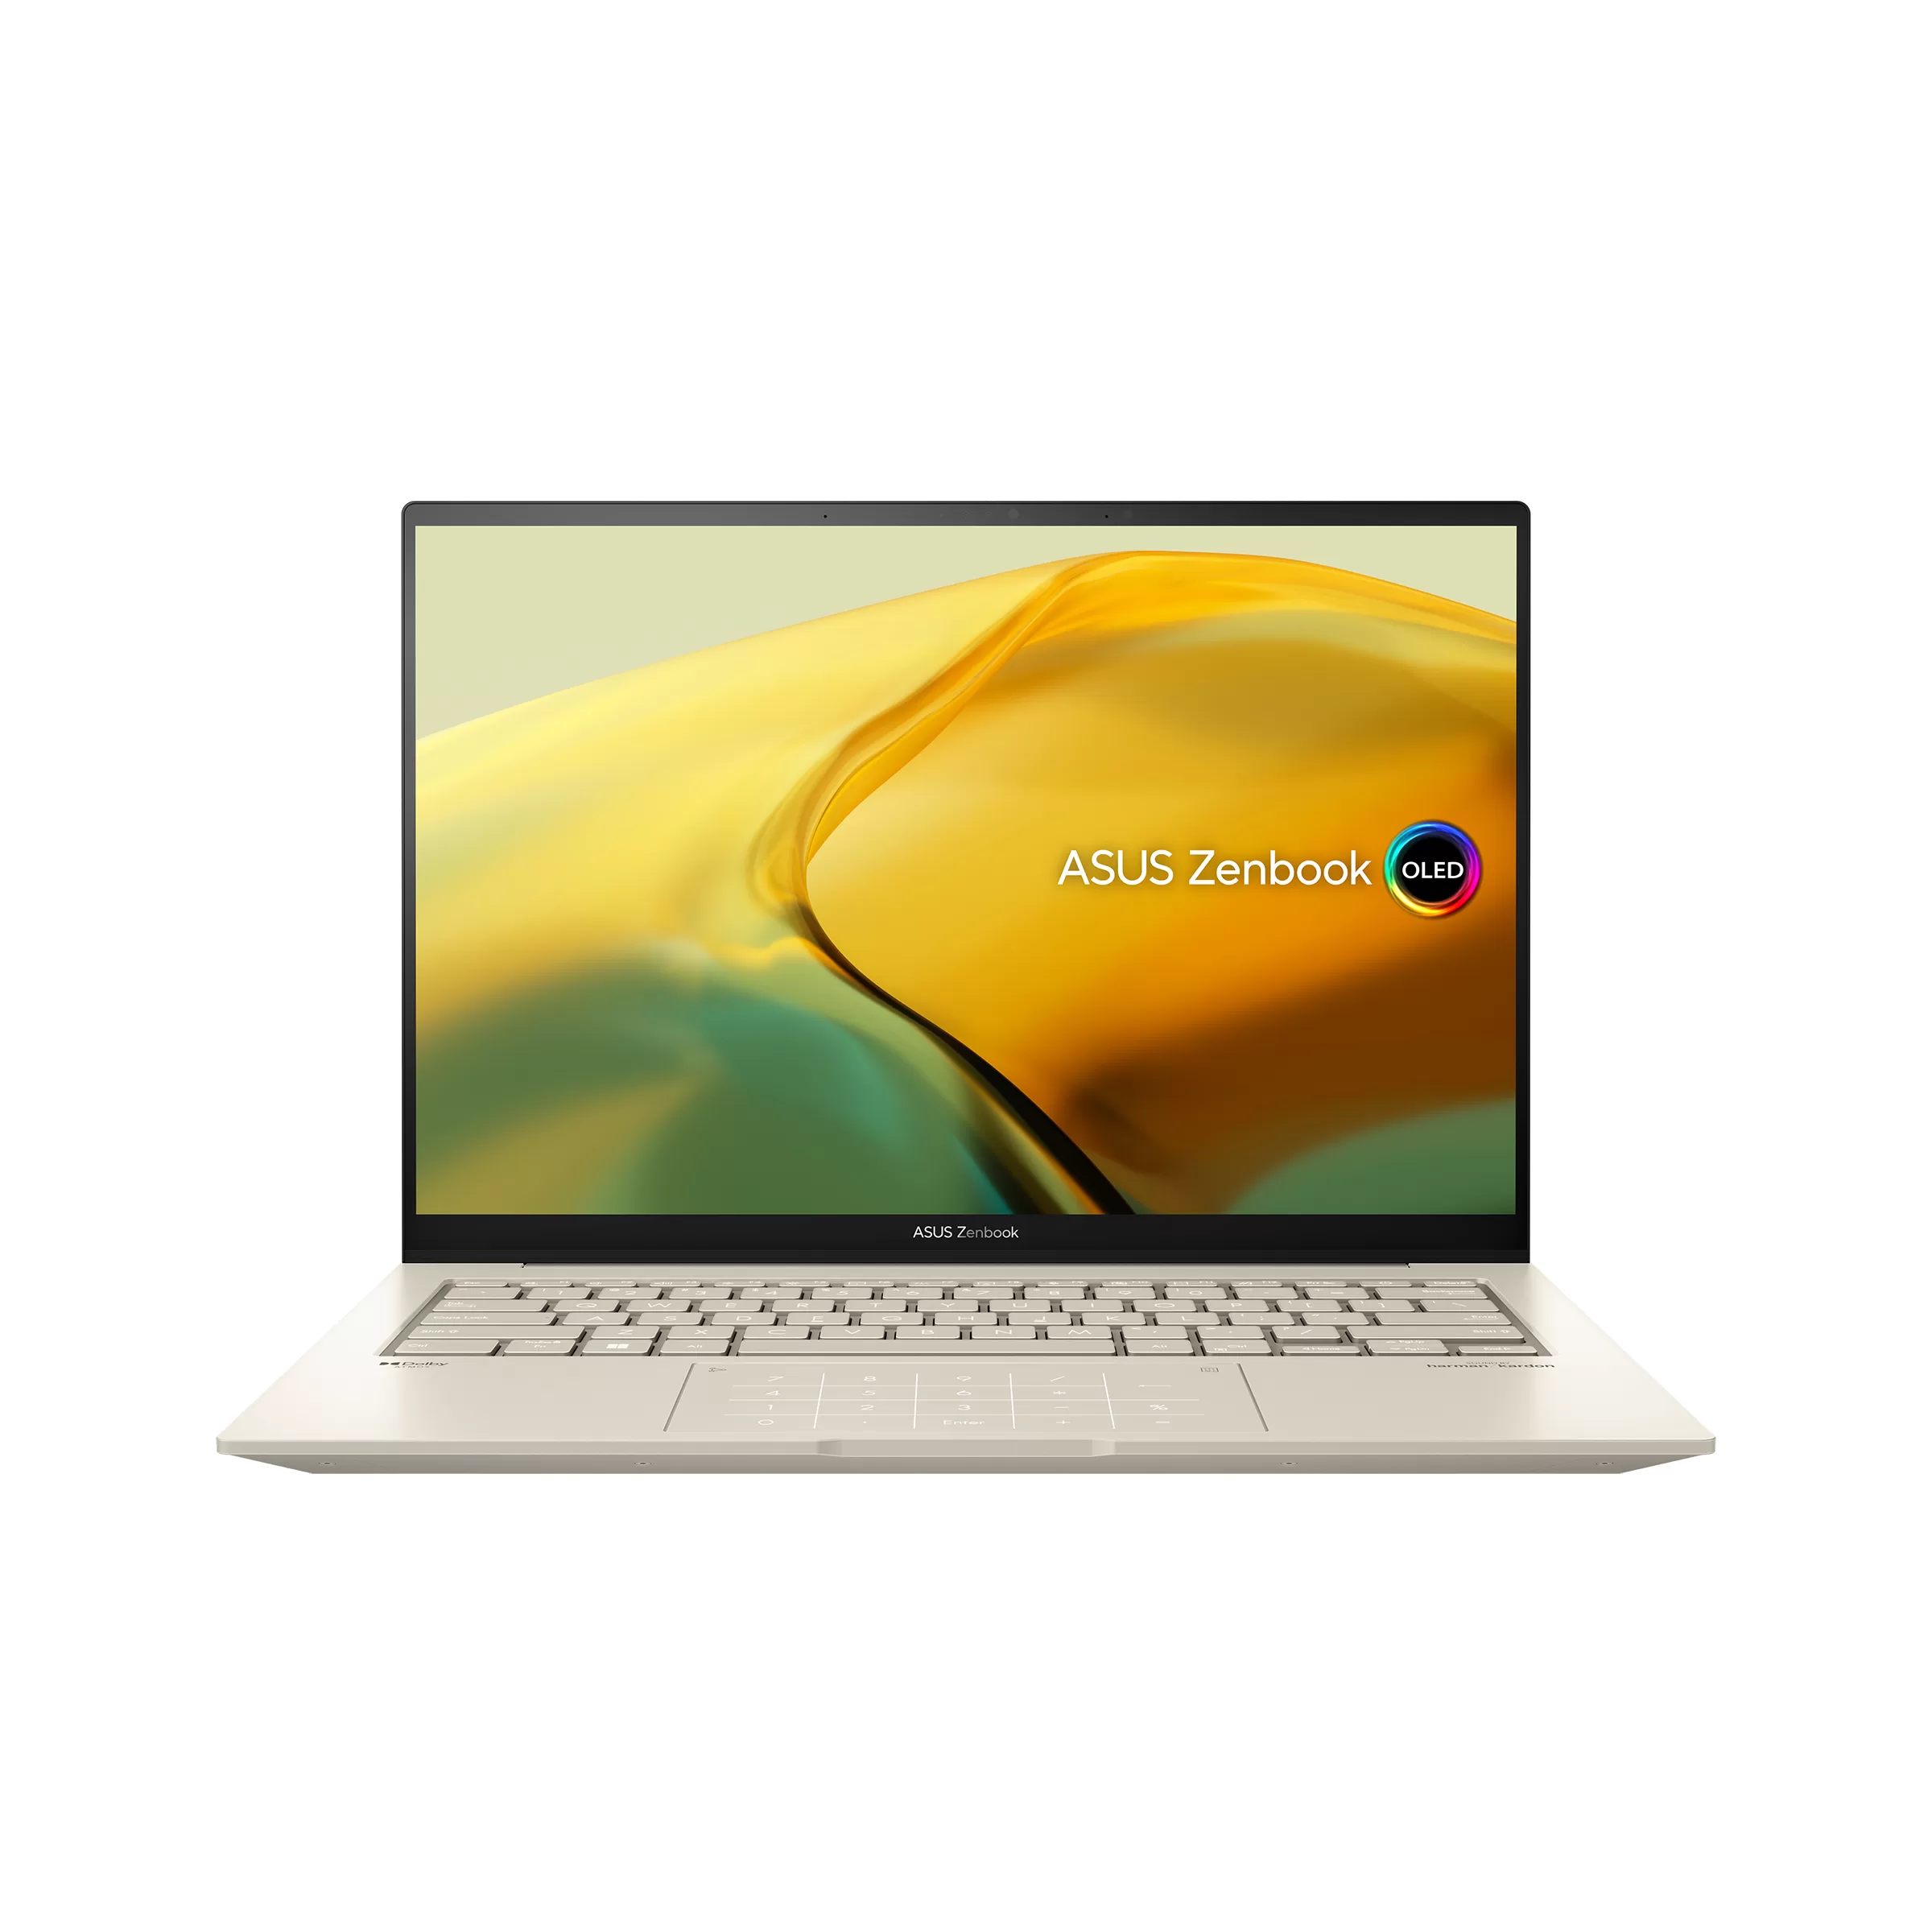
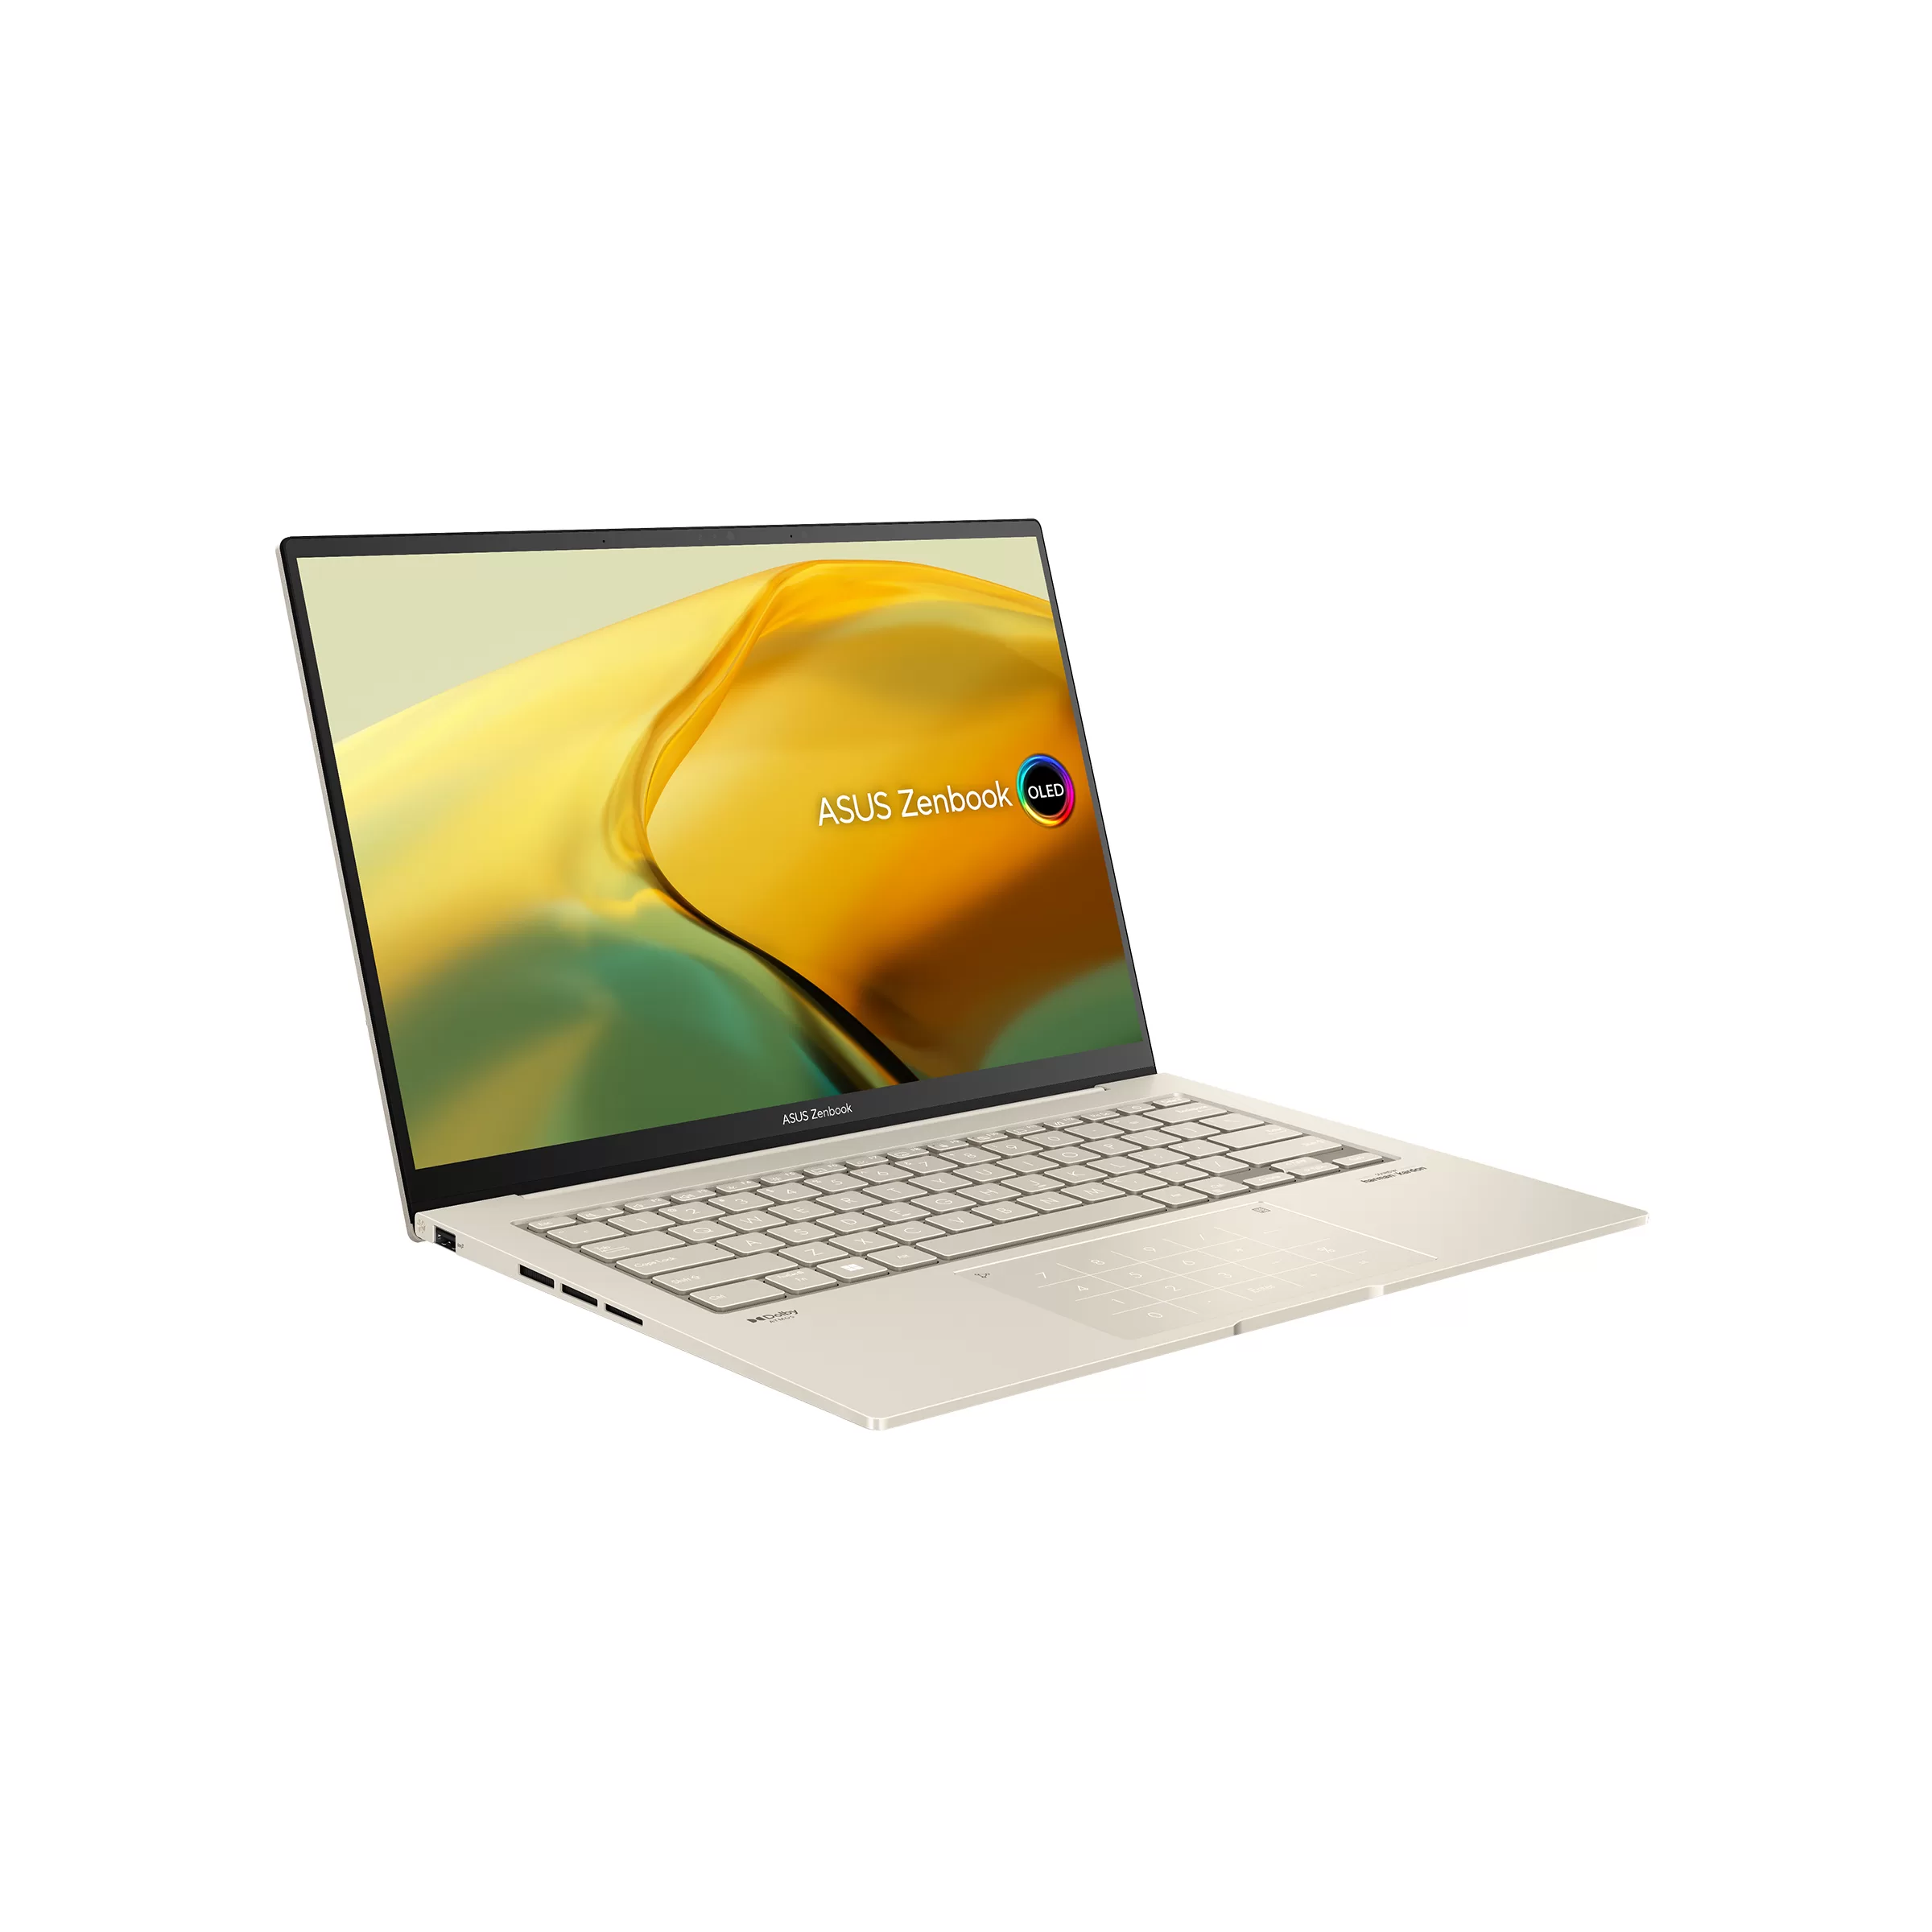
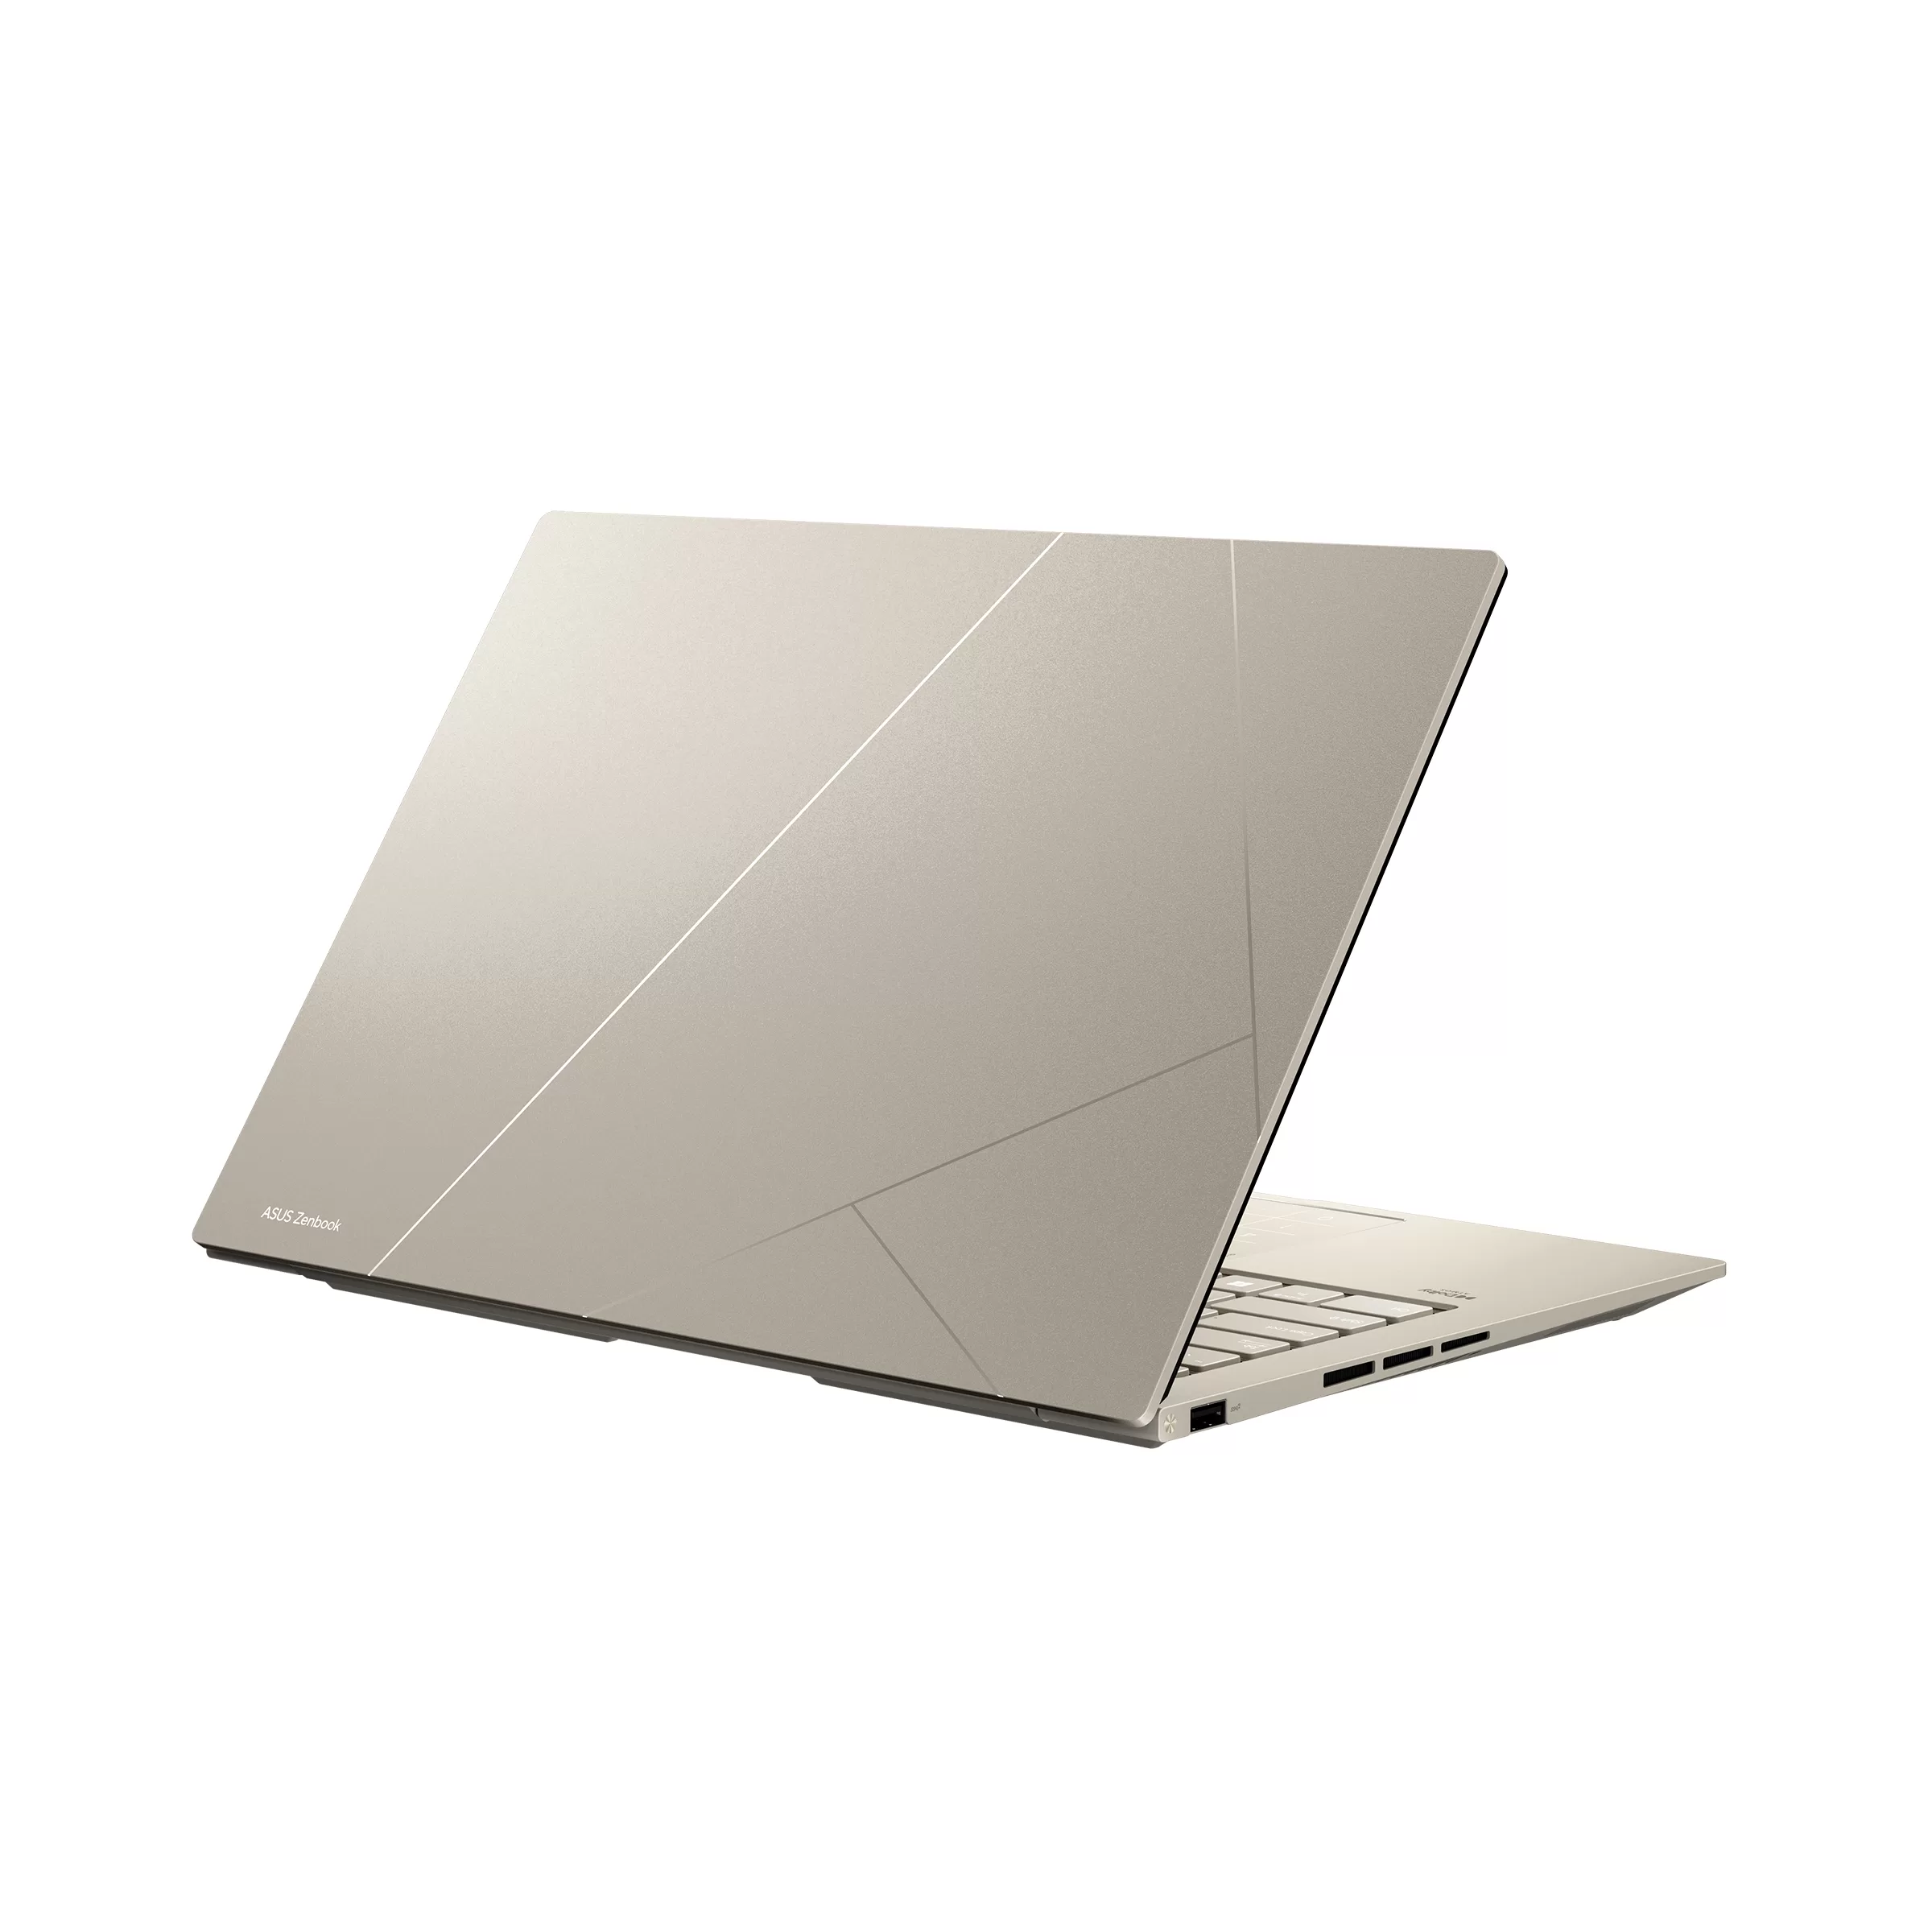
The ASUS Zenbook 14X OLED Now Available with Intel’s 13th Generation Core Processors at MYR 4,999 Onward

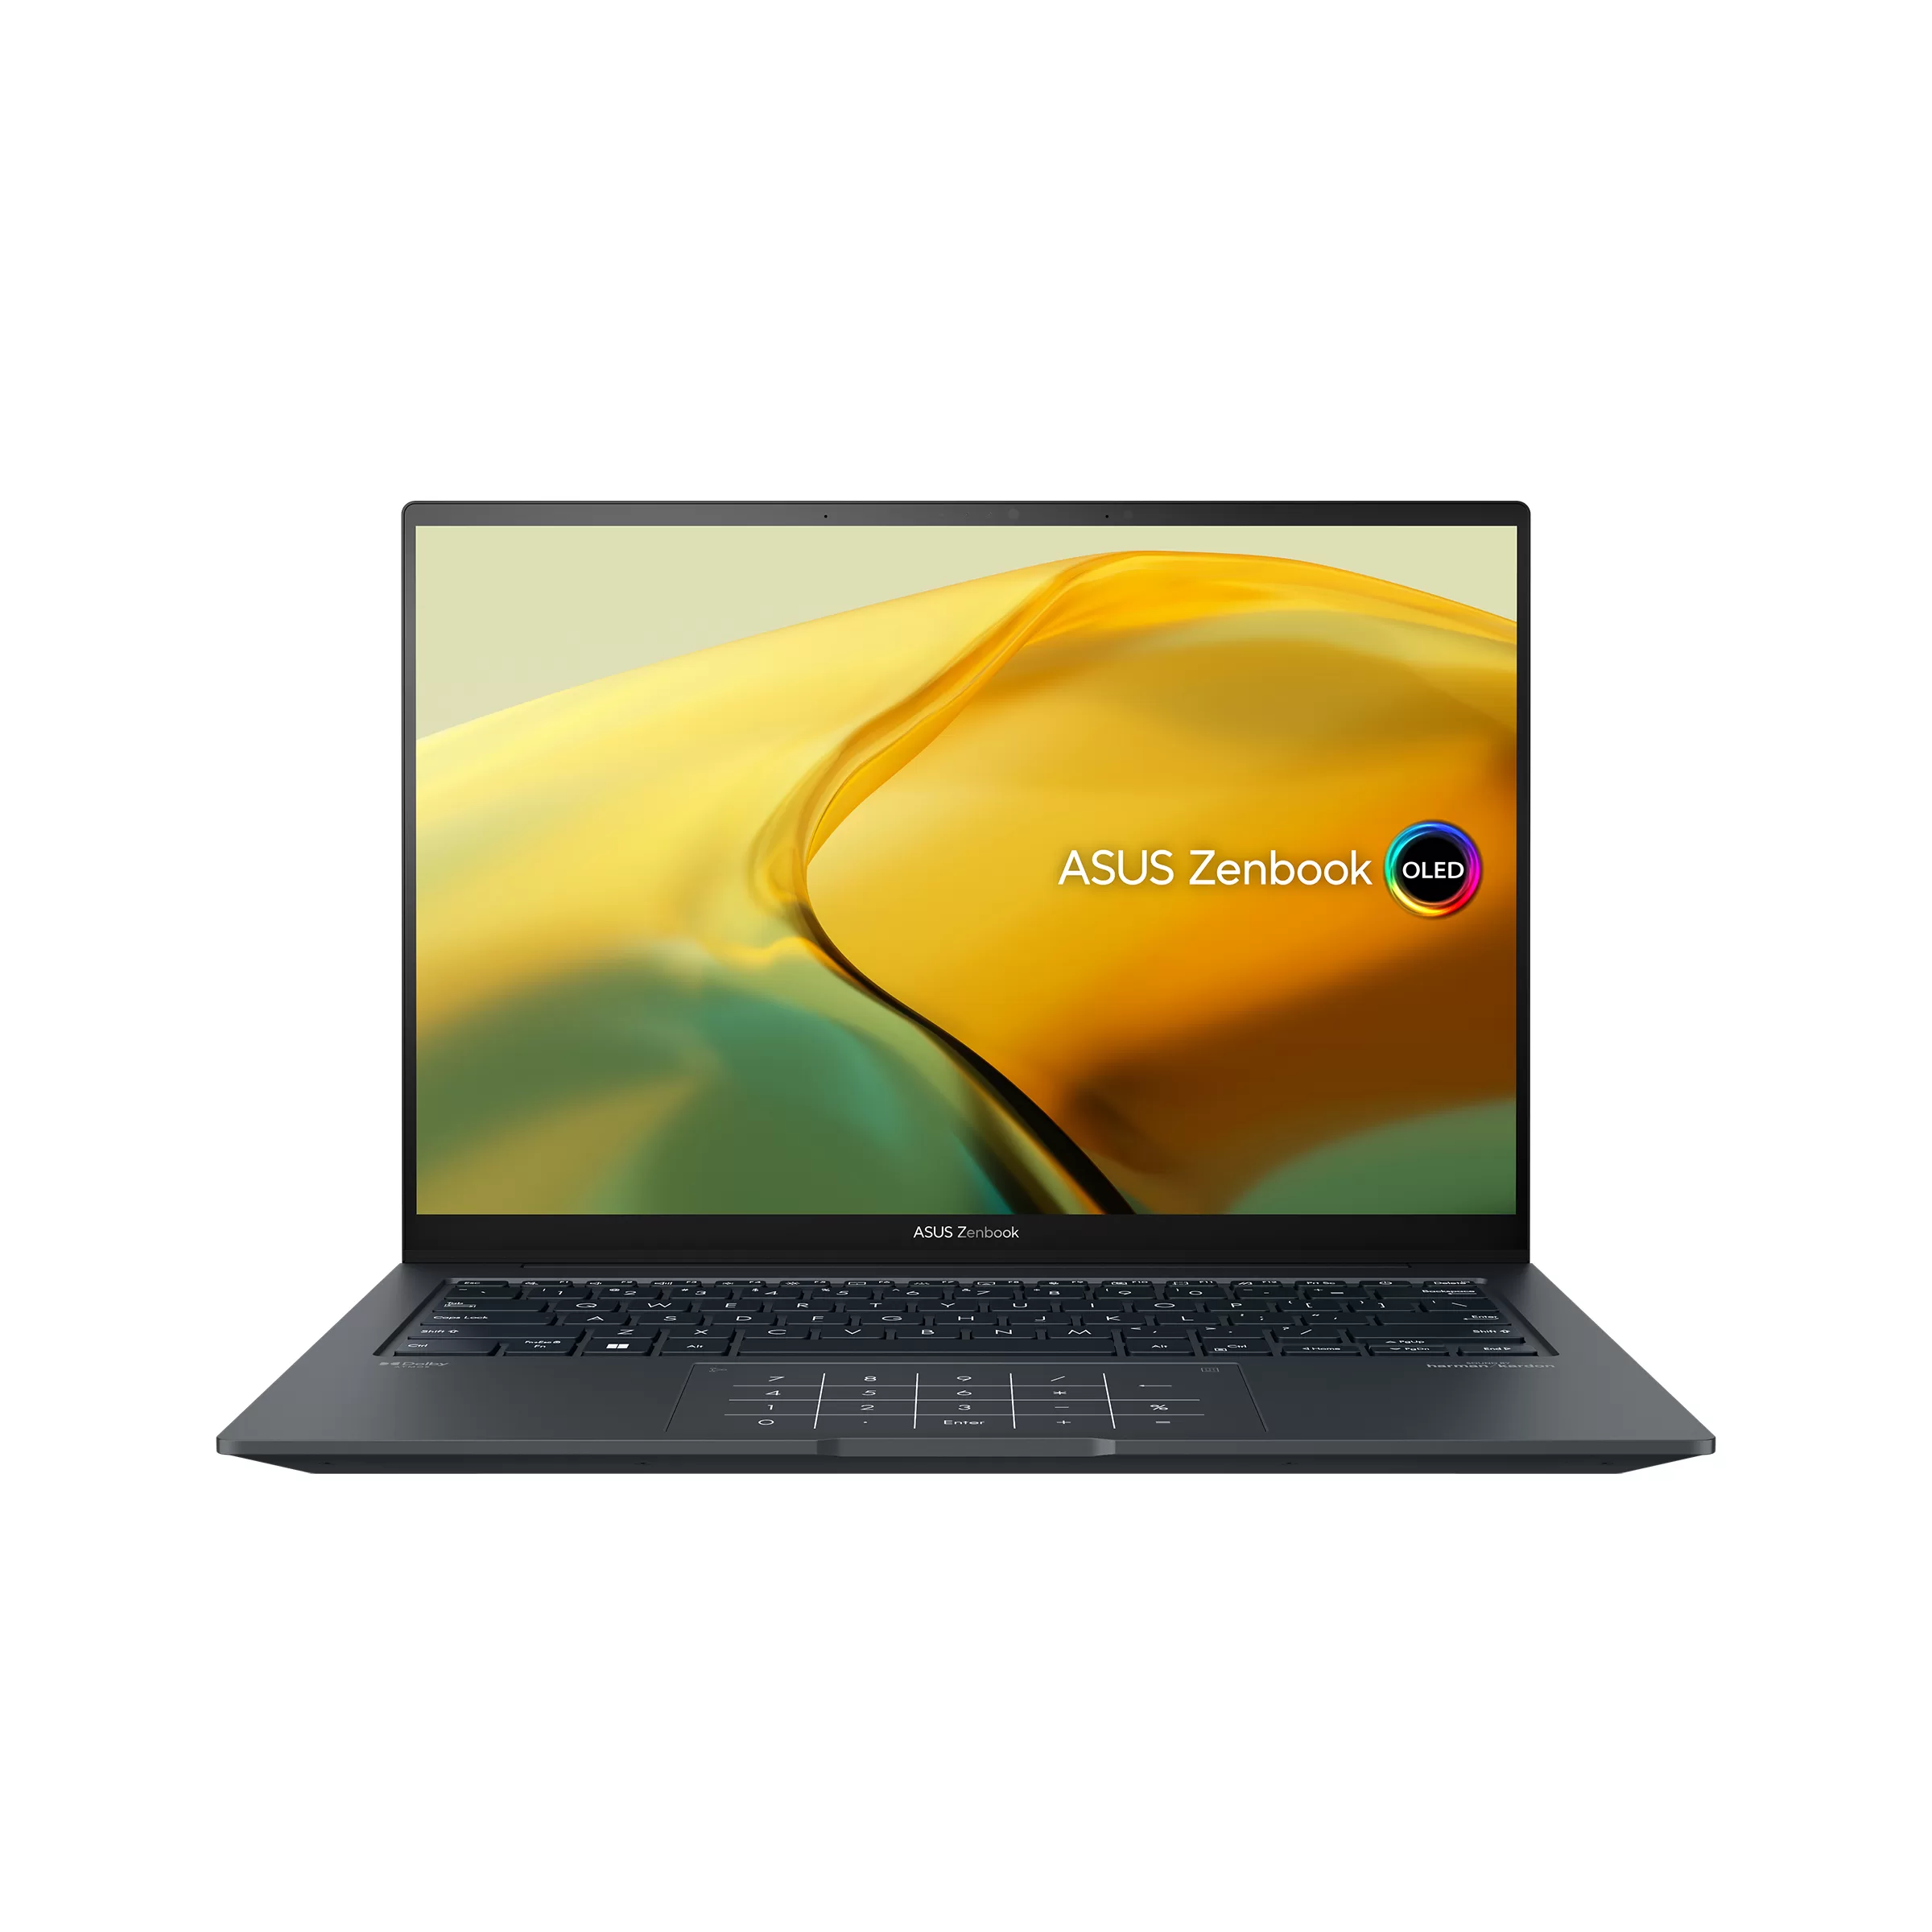
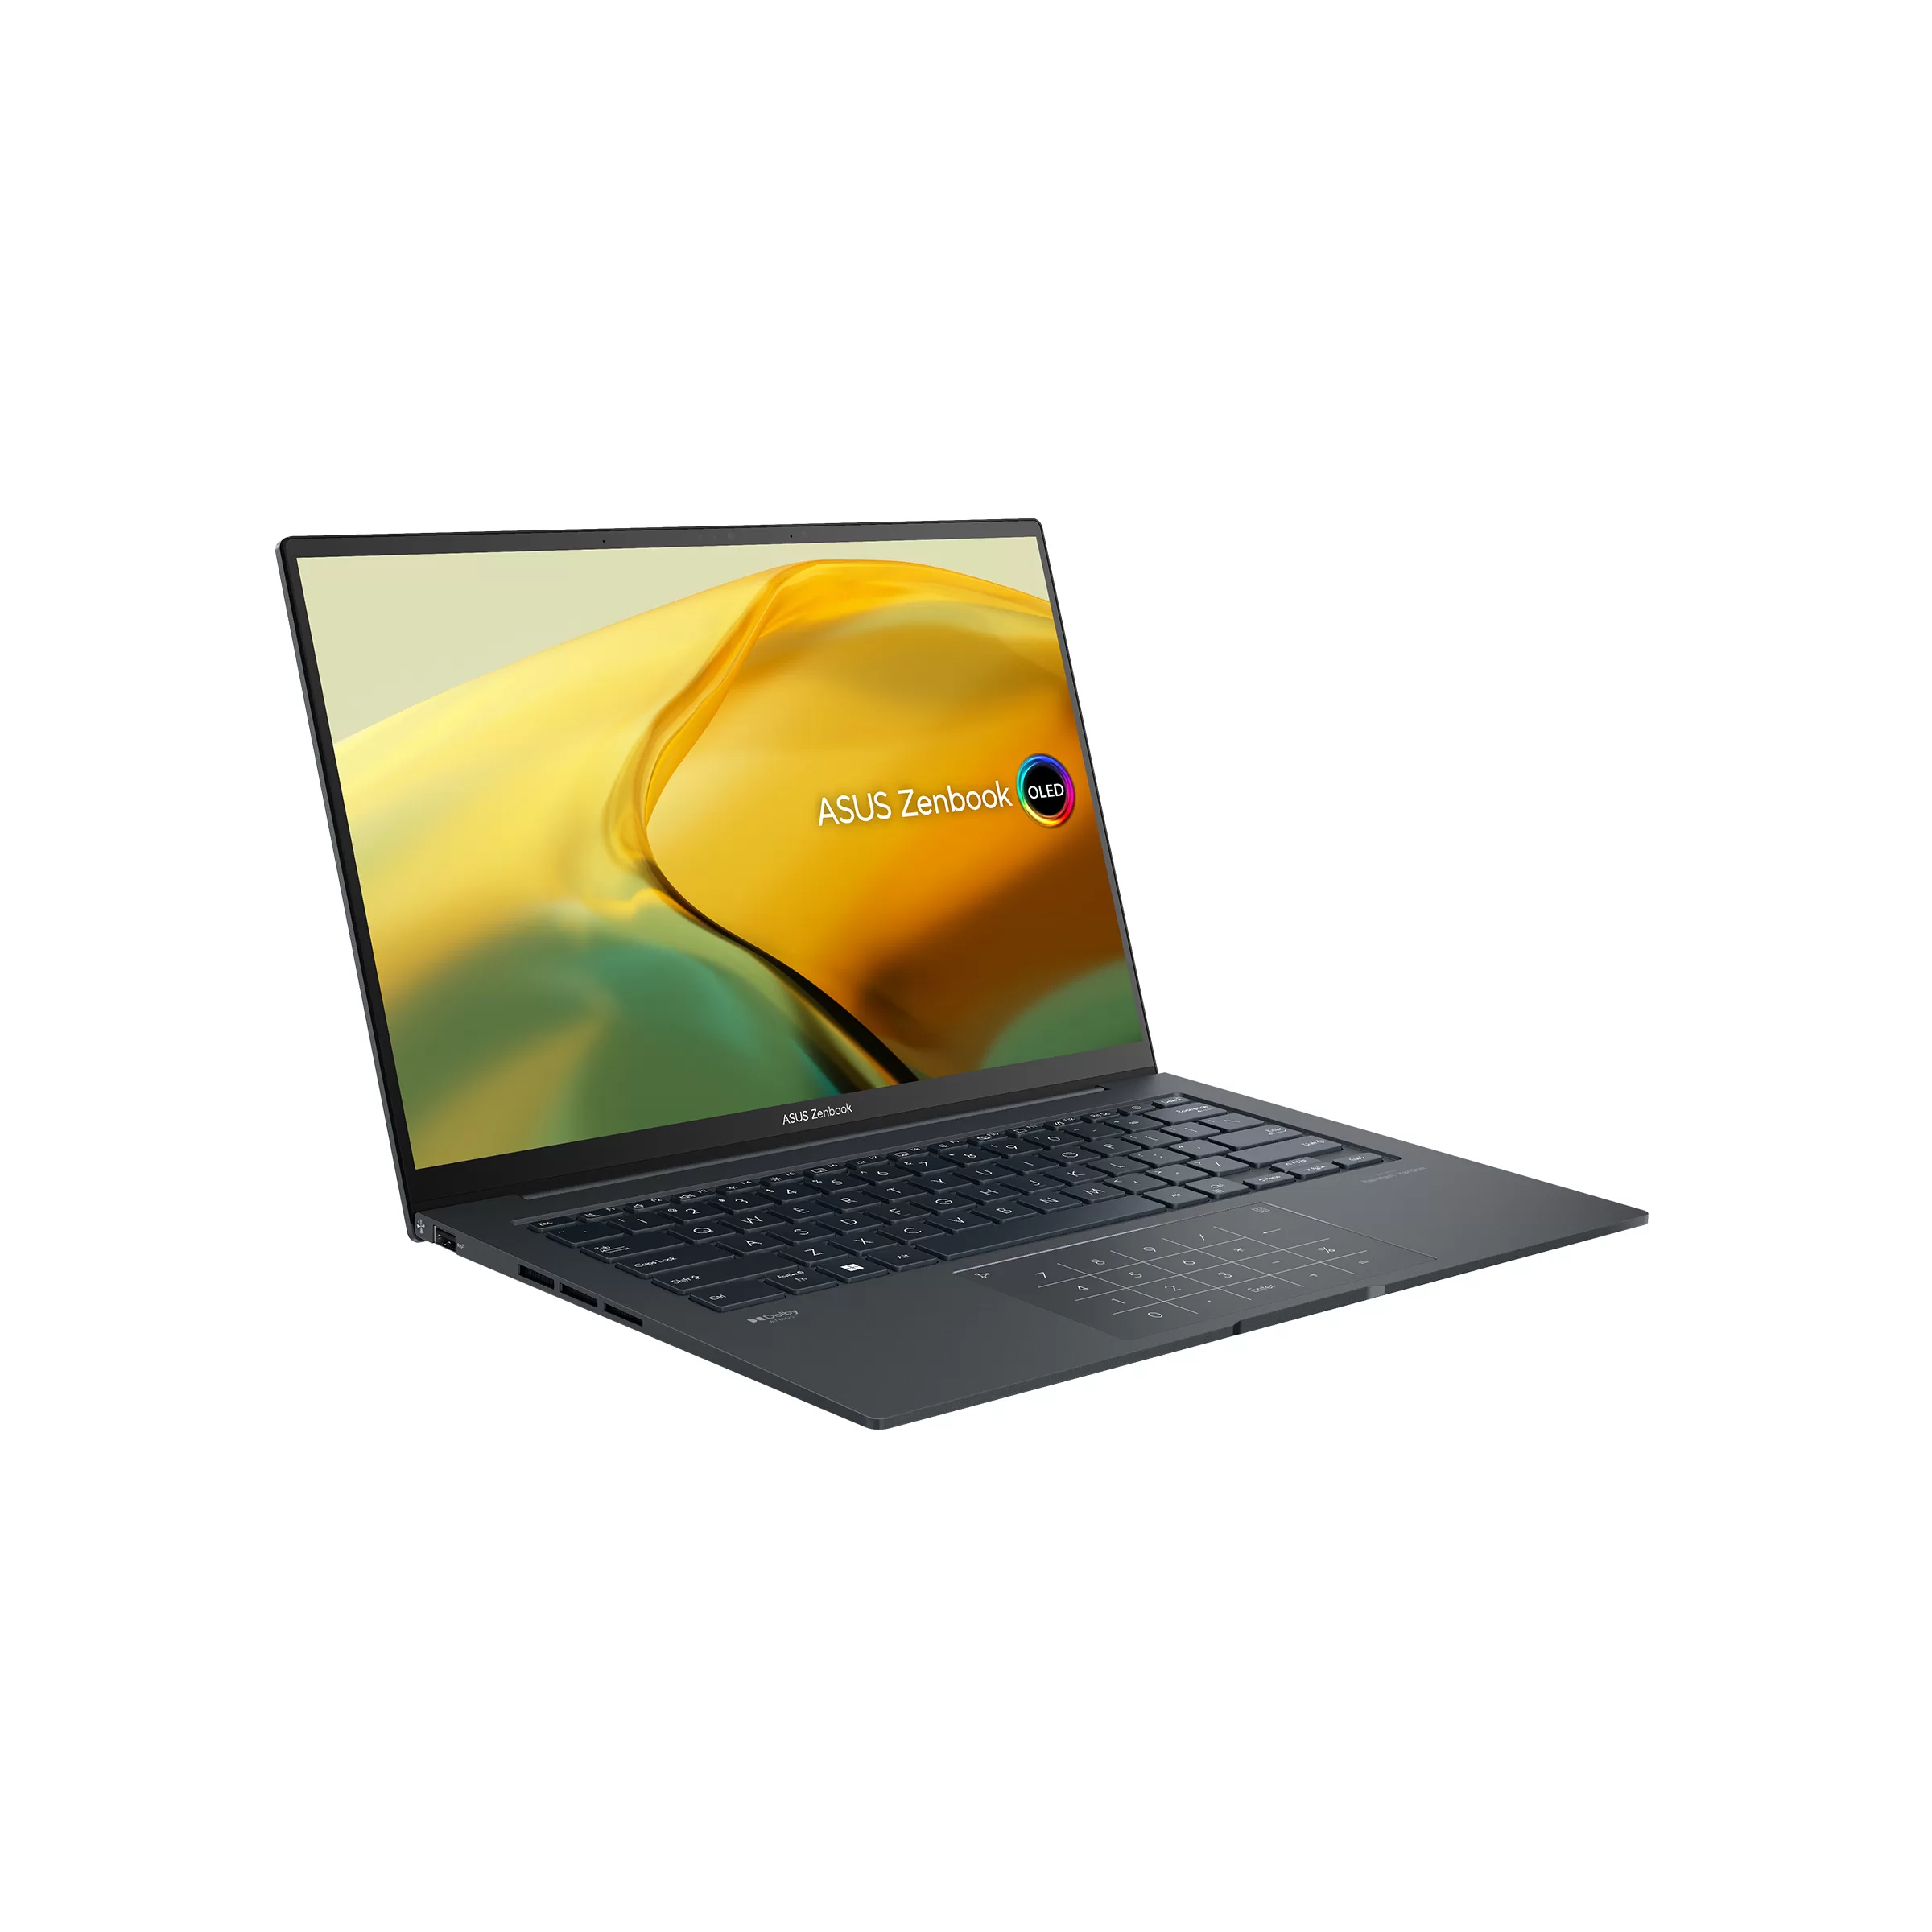
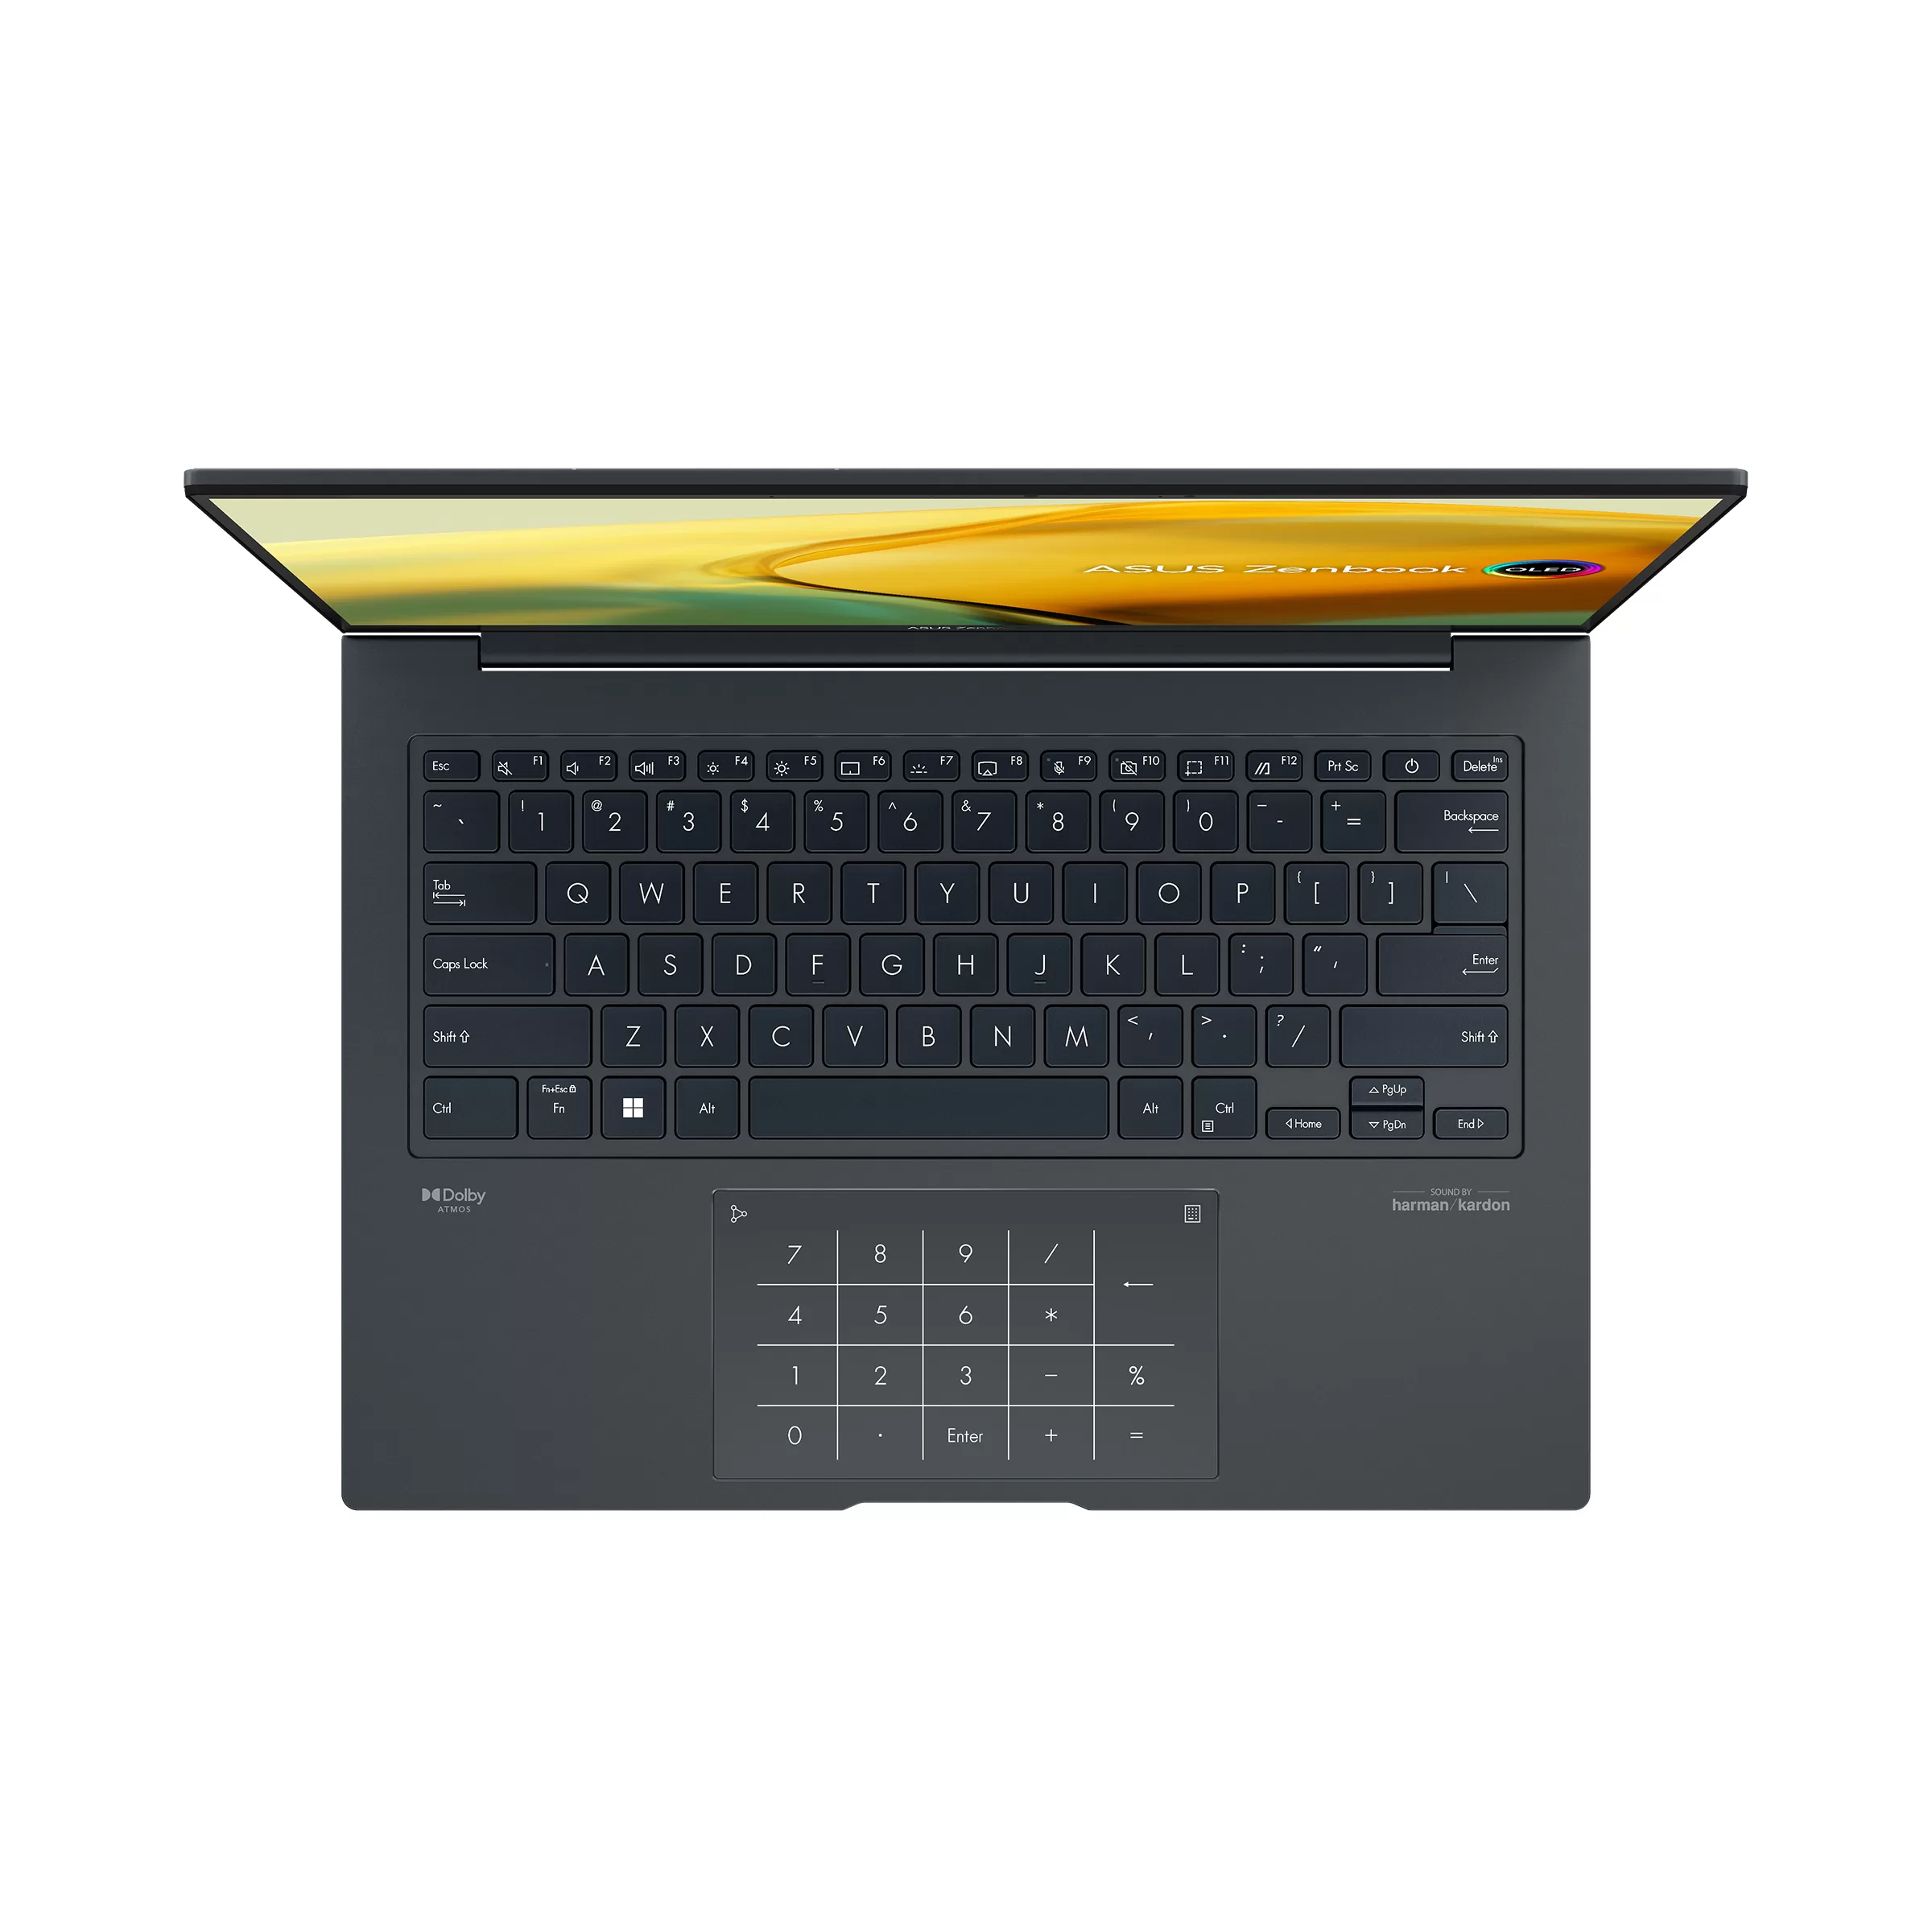
We quite liked ASUS’ Zenbook 14X OLED from last year. Its powerful internals are perfect for our line of work and our requirements. Its good looks is a huge bonus for our interaction with it too. That was last year though, and there is a new processor on the block. That also means that the ASUS Zenbook 14X OLED from 2022 is now outdated.

No matter, ASUS has a new Zenbook 14X OLED for 2023. This time it comes packing Intel’s latest 13th Generation Core processor. In fact, you get to fit up to an Intel Core i9 in the new Zenbook.

The 2023 Zenbook 14X OLED is one of the most powerful thin-and-light notebooks in its class. As mentioned, you can opt for Intel’s latest Core i9-13900H processor that clocks at 2.6 GHz and turbos up to 5.4 GHz. You can settle for Intel’s Iris Xe graphics, or you can opt for NVIDIA’s GeForce RTX 3050 laptop GPU for all your heavy duty workloads. You can even opt for 32GB of LDPDDR5 RAM if you really want to go crazy.

The display is a little larger than before at 14.5-inch. As the name suggests, it is an OLED display. The expansive display offers up to 2.8K in resolution for your viewing pleasure and offers up to 120Hz smoothness. For the best colour grading experience you can get out of a mobile workstation, the OLED panel also offers DisplayHDR True Black 600, 100% DCI-P3 colour gamut, and is even Pantone validated. For better productivity, the display is at as 16:10 ratio.

To keep everything powered up an entire day is a 70 Wh battery with fast charging technology via USB Type-C. That also means that you can even use the bundled charger to charge your smartphone with little issue. You technically can use any 5-20V chargers with Power Deliver certification too for even more convenience and flexibility in remote working.

All of this goodness is wrapped in a familiar all-metal chassis. It is thin too at 16.9 mm but features all the right full-sized I/O ports for even more flexibility. It is not even that heavy at 1.5kg, even with all the metal.

  • ASUS Zenbook 14X OLED UX3404 Product photo Sandstone Beige 04
  • ASUS Zenbook 14X OLED UX3404 Product photo Sandstone Beige 05
  • ASUS Zenbook 14X OLED UX3404 Product photo Sandstone Beige 01
  • ASUS Zenbook 14X OLED UX3404 Product photo Sandstone Beige 02
  • ASUS Zenbook 14X OLED UX3404 Product photo Sandstone Beige 03
  • ASUS Zenbook 14X OLED UX3404 Product photo Inkwell Gray 01
  • ASUS Zenbook 14X OLED UX3404 Product photo Inkwell Gray 02
  • ASUS Zenbook 14X OLED UX3404 Product photo Inkwell Gray 03
  • ASUS Zenbook 14X OLED UX3404 Product photo Inkwell Gray 04
  • ASUS Zenbook 14X OLED UX3404 Product photo Inkwell Gray 05
  • ASUS Zenbook 14X OLED UX3404 Scenario Photo Performance
  • ASUS Zenbook 14X OLED UX3404 Scenario Photo Battery

The new ASUS Zenbook 14X OLED for 2023 is now available for purchase from ASUS’ authorized dealers and stores nationwide. It is available in either Inkwell Gray or Sandstone Beige colour options. Prices starts at MYR 4,999 for an Intel Core i5-13500H variant and up to MYR 6,999 for the top-of-the-line Core i9-13900H with NVIDIA GeForce RTX 3050 variant. More on the 2023 ASUS Zenbook 14X OLED can be found on their website.

Sony Launches the new Ultimate Portrait Lens You Want – the FE 50mm F1.4 GM Lens is Here

If you ask any photographer about their preferred lenses, or what lens you should start with as an enthusiast, most will respond with one lens length in particular. They will always tell you that you should get a 50mm lens. There is a good reason for that.

The 50mm prime lens is one of the most versatile lens you can find in your arsenal of lenses. In the right hands, it is an excellent portrait lens that is meant to capture everything from candid photos to magazine quality headshots. It is perfect for street photography, since 50mm is narrow enough for you to get portraits of people in their everyday lives without getting into their personal spaces. In open spaces, landscape photos can look good too. There is also the fact that they say that the frame you get with 50mm lenses is the closest to what you actually see with your own eyes. Whatever it is, you get the idea.

Sony already has two 50mm lenses in their stables. They have the SEL50F25G lens. It is a rather compact, budget-friendly 50mm lens with F2.5 aperture. It weighs only 174g and is only 45mm long.

They also have the super-premium FE 50mm F1.2 G Master lens that offers a lot of lens for three-folds the price of the 50mm G lens. It is not as compact at 108mm in length. It is also much heavier at 778g in weight. It offers F1.2 aperture though for beautiful bokeh. The F1.2 aperture means that it is amazingly fast and especially excellent video work. There are 11 aperture blades for smooth, round bokeh effects. The weight is also a direct contribution o the amount of glass elements within the lens, about 14 of them.

SEL5014GM Render 5
Source: Sony

So why do Sony need to introduce another 50mm lens? Because the new Sony 50mm G Master lens is meant to be a modern take of what a 50mm lens is supposed to be.

In terms of minimum focus distance and magnification, it is similar to the older lens. The minimum focus distance is at 0.41m and autofocus allows the lens 0.16x magnification for beautiful and detailed close-up photos. These are not the improvements made on the new lens though.

It features a slightly smaller maximum lens opening than the existing lens at F1.4 vs F1.2. But that does not mean that it is not a fast lens, it is still faster than most 50mm lens you can find in the market. It also weighs quite a little bit less than the older lens at 516g, which also means you might get more use out of the lens in one sitting. At 96mm length, it is also slightly more compact than the other 50mm G Master lens.

How they got the lens to go on a diet is by fitting a new high-thrust XD (extreme dynamic) linear motors which is smaller than lighter than ever before. You still have 11 aperture blades, but they are new more compact units compared to before, so the lens can be made shorter than before.

The new linear motors are not just to reduce weight and make the lens smaller though. The XD Linear motors goes along with a new algorithm for smoother and more responsive focus control. That also means that your autofocus is faster than before. Thanks to smoother motors, the autofocus mechanism is also quieter than before. The faster, smoother operations means that it is perfect for shooting high frame-rate videos. To make it even better for videos, the lens offers focus breathing compensation to reduce the image distortion when the lens changes focus.

The new lens offers a Linear Response MF focus ring that directly responses to subtle controls when you work with it manually. There is also a new iris lock switch, first in a prime lens from Sony. There are now two custom programmable buttons on the lens. Sony has also coat the glass with a fluorine coating that is supposed to repel fingerprints, dust, water, oil, and other contaminants from the exposed glass elements to ensure that the lens is still as excellent as it can be in any shoot conditions.

  • SEL5014GM Render 1
  • SEL5014GM Render 7
  • SEL5014GM Render 6
  • SEL5014GM Render 5
  • SEL5014GM Render 4
  • SEL5014GM Render 3
  • SEL5014GM Render 2

The Sony FE 50mm F1.4 G master (SEL5014GM) lens will be available in Malaysia at the end of March 2023 onward. They have not mentioned the price for the lens just yet. The previous 50mm lens from Sony’s G Master line-up sets you back MYR 9,499. With that as an indication, you might want to ensure you have anywhere between MYR 8,000 to 10,000 to spare to get the upcoming lens. It is just an educated guess though; we could be wrong. More information on the Sony FE 50mm F1.4 G Master lens can be found on their website.

MAXST will Showcase Metaverse Service Development Platform at MWC 2023

SEOUL, South Korea and BARCELONA, Spain, Feb. 22, 2023 /PRNewswire/ — MAXST Co., Ltd., a company specializing in the metaverse platform, will participate in MWC 2023 (Mobile World Congress 2023), held in Barcelona, Spain from February 27 to March 2.

MAXST will Showcase Metaverse Service Development Platform at MWC 2023.

MAXST plans to introduce MAXVERSE, an integrated platform for metaverse service development, AR development platform (MAXST AR SDK), and AR glasses.

MAXVERSE is attracting attention as an integrated platform for metaverse service development and will lead the development of the metaverse ecosystem.

As a Unity plug-in content authoring tool, it includes an XR simulation function, so users can develop services based on real space without going to the field. It can be applied to various fields such as XR telepresence, navigation, advertising, and games.

The upgraded MAXST AR SDK 6.0 version will also be shown. Space Tracker was added to the MAXST AR development platform, which is recognized for its world-class technology, and applied to MAXSCAN application. Space Tracker is a function that can automatically create a realistic spatial map by scanning a space within a radius of 10 meters.

In this expo, MAXST will give a demonstration that allows visitors to place AR contents directly on a 3D spatial map created by them. Also, users can experience reality-based AR contents by linking them to various hardware such as smartphones, tablets, and AR glasses through Space Tracker.

AR SDK 6.0 version will be officially distributed within the first half of the year. It is expected to give a new level of user experience that is connected to reality by providing a convenient development environment such as creating sophisticated AR meshes.

Also, MAXST will unveil tethered type AR glasses which has the industry’s smallest lens thickness, 40 degree field of view(FOV), and ultra light weight of less than 100g. Sensor Fusion SLAM technology installed in these glasses provides an immersive AR experience by tracking the movement of the device with high accuracy. Visitors will also be able to experience Space Tracker through AR glasses.

A MAXST official said, “Through MWC 2023, we plan to not only enter MAXVERSE into overseas markets, but also focus on promoting MAXST’s AR source technology to the world markets and increasing global brand awareness.

Founded in 2010, MAXST is a technology company that has focused on securing and localizing AR source technology. After releasing the open beta version of MAXVERSE, a metaverse development platform, in November, 2022, it is attracting attention as an innovative company that will lead the metaverse ecosystem.

MWC is an exhibition where you can see the latest market and technology trends in the global mobile communication industry and is hosted by Global System for Mobile communications Association (GSMA).

MAXST is going to operate a booth at Congress Square Stand CS179, Fira Gran Via for 4 days.

(https://www.mwcbarcelona.com/exhibitors/maxst-co-ltd)

About MAXST

MAXST (KRX: 377030) is a metaverse leading company that has unrivaled technologies such as commericalization of global top-level AR source technology, Sensor Fusion SLAM and 3D Reconstruction technology. Maxst is currently a public trust company listed on the Korean KOSDAQ market providing globally renowned AR SDK, industrial AR solution MAXWORK and Reality-based metaverse platform MAXVERSE.

Cision View original content to download multimedia:https://www.prnewswire.com/news-releases/maxst-will-showcase-metaverse-service-development-platform-at-mwc-2023-301753042.html