BEST Inc. Announces Unaudited First Quarter 2022 Financial Results

HANGZHOU, China, June 9, 2022 /PRNewswire/ — BEST Inc. (NYSE: BEST) (“BEST” or the “Company”), a leading integrated smart supply chain solutions and logistics services provider in China and Southeast Asia (“SEA”), today announced its unaudited financial results for the first quarter ended March 31, 2022.

Johnny Chou, Founder, Chairman and CEO of BEST, commented, “Despite the disruptions caused by the COVID-19 pandemic, we continued to serve our customers with operational resilience. BEST Global continued its strong growth momentum and finished the quarter with 25% year-over-year (“YOY”) volume increase in SEA. As we continued with our Strategic Refocusing Program, we are winding down our BEST UCargo and Capital business lines, which gives us a much leaner organization and lower cost structure. At end of the first quarter, we have a net cash position of RMB1.5 billion

“During the quarter, BEST Freight maintained its industry-leading position and achieved notable service quality improvements. Freight’s on-time delivery rate has improved by 14% YOY. Supply Chain Management remains our key differentiator as it empowers our customers with digitalized end-to-end logistics solutions. It is also the heart of our cross-segment synergies; significantly benefiting Freight and Global by supporting its customer’s transportation and global logistics needs. Among SCM’s top customers, more than 20% use our Freight service.

“We believe the activities of supply chain and logistics business will pick up quickly in China and SEA as the pandemic eases. Information technology-driven and integrated supply chain and logistics solutions will be in high demand to support such growth. BEST’s strengths in technology, domestic and international end-to-end supply chain and logistics capabilities, as well as our broad customer base in China coupled with strong cash position will allow us to capture this growth opportunity and on the path to profitability.” concluded Mr. Chou.

Gloria Fan, BEST’s Chief Financial Officer, added, “Our first quarter revenue, excluding UCargo and Capital, declined by 4.6% YOY. Given the pandemic-related disruptions and other macro environment uncertainties, our performance is a testament to our strong business resilience. Our balance of cash and cash equivalents, restricted cash, and short-term investments were RMB5.3 billion at the end of the first quarter. Supported by our robust balance sheet, our emphasis on service quality and operational efficiency will strengthen our core competencies in Freight, integrated Supply Chain Management and Global logistics solutions, building a solid foundation for future growth and profitability.”

FINANCIAL HIGHLIGHTS(1) 

For the First Quarter Ended March 31, 2022:(2)

  • Revenue was RMB1,802.6 million (US$284.4 million) compared to RMB2,783.6 million in the first quarter of 2021. The revenue decrease was primarily due to the winding-down of the UCargo business line. Revenue generated from UCargo business was approximately RMB19.4 million (US$3.1 million) compared with RMB868.7 million in the same quarter of 2021, a decrease of 97.8%.
  • Gross Loss was RMB76.8 million (US$12.1 million), compared to gross profit of RMB51.7 million in the first quarter of 2021. The decrease was primarily due to winding down of the Capital business line and increased unit cost of Freight business, mainly resulting from higher fuel cost. Gross Loss Margin was 4.3%, compared to a Gross Profit Margin of 1.9% in the first quarter of 2021. 
  • Net Loss from continuing operations was RMB379.9 million (US$59.9 million), compared to RMB191.2 million in the first quarter of 2021. Non-GAAP Net Loss from continuing operations(3)(4) was RMB359.2 million (US$56.7 million), compared to RMB169.7 million in the first quarter of 2021.
  • Diluted loss per ADS(5) from continuing operations was negative RMB4.60 (US$0.73), compared to negative RMB2.40 in the first quarter of 2021. Non-GAAP diluted loss per ADS(3)(4) from continuing operations was negative RMB4.33 (US$0.68), compared to negative RMB2.12 in the first quarter of 2021.
  • EBITDA(6) from continuing operations was negative RMB315.3 million (US$49.7 million), compared to negative RMB120.0 million in the first quarter of 2021. Adjusted EBITDA(3)(5) from continuing operations was negative RMB294.6 million (US$46.5 million), compared to negative RMB98.5 million in the first quarter of 2021.

BUSINESS HIGHLIGHTS(7) 

BEST Freight – In the first quarter of 2022, the Company remained focused on developing its e-commerce related business, which contributed 22.2% of total volume during the quarter, up 5.6 ppts YOY. The logistics industry has been significantly affected by the resurgences of the pandemic. Freight’s volume decreased by 13.5% YOY, as parts of its operations, particularly some of its transportation fleet, hubs and sortation centers, have been restricted due to the pandemic.

Freight continued to implement measures to strengthen its network coverage and service quality including automation in certain major sortation centers and expansion of franchise network. These efforts have delivered immediate results. In the first quarter, Freight’s on-time delivery rate improved by 14.0% YOY. 

BEST UCargo’s operations and financial results are now consolidated with BEST Freight.

BEST Supply Chain Management – During the first quarter of 2022, the Company continued to grow its B2B2C fulfillment network and distribution capabilities (“Cloud OFCs”) while prioritizing higher-margin accounts. Due to discontinuation of certain low-margin legacy customers, the total number of orders fulfilled by Cloud OFCs decreased 13.3% YOY to 87.3 million in the first quarter, of which the total number of orders fulfilled by franchised Cloud OFCs increased by 2.4% to 54.1 million. Supply Chain Management’s gross margin for the first quarter of 2022 was 4.3%, decreased by 1.1 ppts YOY, primarily due to restrictions on certain warehouses caused by the pandemic.

BEST Global – Despite the ongoing pandemic and disruption in its supply chains, Global continued to expand its market share in SEA. Its parcel volume reached 38.4 million in the first quarter of 2022, up 24.5% YOY. Parcel volumes in Vietnam, Malaysia and Singapore, increased by 67.7%, 67.6% and 72.0%, respectively. In addition to the positive development in SEA, U.S. operations reached breakeven last year and continued to be profitable in the first quarter of 2022.

Others

As part of its strategic refocusing plan, the Company continued to wind down its Capital business line in the first quarter of 2022.

Key Operational Metrics

Three Months Ended

% Change YOY

March 31,
2020

March 31,
2021

March 31,
2022

2021 vs
2020

2022 vs

2021

Freight Volume (Tonne in ‘000)

1,074

1,945

1,683

81.0%

(13.5%)

Supply Chain Management
Orders Fulfilled (in ‘000)

83,596

100,784

87,347

20.6%

(13.3%)

Global Parcel Volume in SEA
 (in ‘000)

8,840

30,841

38,390

248.9%

24.5%

FINANCIAL RESULTS(8) 

For the First Quarter Ended March 31, 2022:

Revenue

The following table sets forth a breakdown of revenue by business segment for the periods indicated.

Table 1 – Breakdown of Revenue by Business Segment

Three Months Ended

March 31, 2021

March 31, 2022

(In ‘000, except for %)

RMB

% of
Revenue

RMB

US$

% of
Revenue

% Change
YOY

Total Freight

2,043,186

73.4%

1,092,814

172,387

60.6%

(46.5%)

  -Freight

1,174,493

42.2%

1,073,460

169,334

59.6%

(8.6%)

  -Legacy UCargo

868,693

31.2%

19,354

3,053

1.0%

(97.8%)

Supply Chain
Management

447,661

16.1%

408,962

64,512

22.7%

(8.6%)

Global

250,422

9.0%

268,709

42,388

14.9%

7.3%

Others(9)

42,290

1.5%

32,100

5,064

1.8%

(24.1%)

Total Revenue

2,783,559

100.0%

1,802,585

284,351

100.0%

(35.2%)

  • Freight Service Revenue was RMB1,092.8 million (US$172.4million) for the first quarter of 2022, compared with RMB2,043.2 million in the same period of last year; of which, RMB19.4 million and RMB868.7 million were from the legacy UCargo business line.  Freight service revenue excluding legacy UCargo business decreased by 8.6% YOY resulting from a 13.5% decrease in freight volume, partially offset by a 4.5% increase in ASP per tonne.
  • Supply Chain Management Service Revenue decreased by 8.6% YOY to RMB409.0 million (US$64.5 million) for the first quarter of 2022 from RMB447.7million in the same period of last year, primarily due to discontinuation of certain low-margin legacy accounts.
  • Global Service Revenue increased by 7.3% YOY to RMB268.7 million (US$42.4 million) for the first quarter of 2022 from RMB250.4 million in the same period of last year, primarily due to parcel volume growth in SEA.

Cost of Revenue

The following table sets forth a breakdown of cost of revenue by business segment for the periods indicated.

Table 2 – Breakdown of Cost of Revenue by Business Segment

Three Months Ended

% of
Revenue
Change

YOY

March 31, 2021

March 31, 2022

(In ‘000, except for %)

RMB

% of
Revenue

RMB

US$

% of
Revenue

Total Freight

(2,029,952)

99.4%

(1,170,314)

(184,612)

107.1%

7.7ppt

-Freight

(1,173,930)

100.0%

(1,144,613)

(180,558)

106.6%

6.6ppt

-Legacy UCargo

(856,022)

98.5%

(25,701)

(4,054)

132.8%

34.3ppt

Supply Chain
Management

(423,506)

94.6%

(391,207)

(61,711)

95.7%

1.1ppt

Global

(265,102)

105.9%

(285,678)

(45,065)

106.3%

0.4ppt

Others

(13,307)

31.5%

(32,225)

(5,083)

100.4%

68.9ppt

Total Cost of Revenue

(2,731,867)

98.1%

(1,879,424)

(296,471)

104.3%

6.2ppt

  • Cost of Revenue for Freight excluding legacy UCargo business was RMB1,144.6 million or 106.6% of revenue in the first quarter of 2022. The 6.6 ppts increase YOY in cost of revenue as a percentage of revenue was mainly due to higher fuel cost and additional costs caused by the pandemic.
  • Cost of Revenue for Supply Chain Management was RMB391.2 million or 95.7% of revenue in the first quarter of 2022. The 1.1 ppts increase YOY in cost of revenue as a percentage of revenue was primarily due to restrictions on certain warehouses caused by the pandemic.
  • Cost of Revenue for Global was RMB285.7 million or 106.3% of revenue in the first quarter of 2022. The 0.4 ppts increase YOY in cost of revenue as a percentage of revenue was primarily due to additional costs caused by the pandemic and higher fuel cost; partially offset by increased parcel volume.
  • Cost of Revenue for Others was RMB 32.2 million or 100.4% of revenue in the first quarter of 2022. The 68.9 ppts increase YOY in cost revenue as percentage of revenue was primarily due to winding down of BEST Capital business line.

Gross Loss was RMB76.8 million (US$12.1 million) in the first quarter of 2022, compared to gross profit of RMB51.7 million in the first quarter of 2021; Gross Margin was negative 4.3%, compared to positive 1.9% in the first quarter of 2021.

Operating Expenses

Selling, General and Administrative Expenses were RMB255.0 million (US$40.2 million) or 14.1% of revenue in the first quarter of 2022, compared to RMB249.8 million or 9.0% of revenue in the first quarter of 2021, primarily due to the expenses associated with winding down the Capital business.

Research and Development Expenses were RMB33.2million (US$5.2 million) or 1.8% of revenue in the first quarter of 2022, compared to RMB40.1 million, or 1.4% of revenue in the first quarter of 2021, primarily due to reduced headcount. 

Share-based Compensation (“SBC”) Expenses included in the cost and expense items above were RMB20.7 million (US$3.3 million) in the first quarter of 2022, compared to RMB27.1 million in the first quarter of 2021. In the first quarter of 2022, RMB0.05 million (US$0.01 million) was allocated to cost of revenue, RMB1.2 million (US$0.2 million) was allocated to selling expenses, RMB18.2 million (US$2.9 million) was allocated to general and administrative expenses, and RMB1.3 million (US$0.2 million) was allocated to research and development expenses.

Net Loss and Non-GAAP Net Loss from continuing operations

Net Loss from continuing operations in the first quarter of 2022 was RMB379.9 million (US$59.9 million), compared to RMB191.2 million in the first quarter of 2021. Excluding SBC expenses, amortization of intangible assets resulting from business acquisitions and gain from appreciation of investment, Non-GAAP Net Loss from continuing operations in the first quarter of 2022 was RMB359.2 million (US$56.7 million), compared to RMB169.7 million in the first quarter of 2021.

Diluted loss per ADS and Non-GAAP diluted loss per ADS from continuing operations

Diluted loss per ADS from continuing operations in the first quarter of 2022 was negative RMB4.60 (US$0.73), compared to negative RMB2.4 in the same period of 2021. Excluding SBC expenses, amortization of intangible assets resulting from business acquisitions and gain from appreciation of investment, Non-GAAP diluted loss per ADS from continuing operations in the first quarter of 2022 was negative RMB4.33 (US$0.68), compared to negative RMB2.12 in the first quarter of 2021. A reconciliation of non-GAAP diluted loss per ADS to diluted loss per ADS is included at the end of this results announcement.

Adjusted EBITDA and Adjusted EBITDA Margin from continuing operations

Adjusted EBITDA from continuing operations in the first quarter of 2022 was negative RMB294.6 million (US$46.5million), compared to negative RMB98.5million in the same period of 2021. Adjusted EBITDA Margin from continuing operations in the first quarter of 2022 was negative 16.3%, compared to negative 3.5% in the same period of 2021.

Cash and Cash Equivalents, Restricted Cash and Short-term Investments

As of March 31, 2022, cash and cash equivalents, restricted cash and short-term investments were RMB5,261.1 million (US$829.9 million), compared to RMB3,389.0 million as of March 31, 2021.

Net Cash Used In Continuing Operating Activities

Net cash used in continuing operating activities in the first quarter of 2022 was RMB304.1 million (US$48.0 million), compared to RMB47.9 million of net cash generated from continuing operating activities in the same period of 2021. The increase in net cash used in operating activities was mainly due to the increased net loss and catch-up payments to vendors in the first quarter of 2022. 

Capital Expenditures (“CAPEX”)

CAPEX was RMB49.1 million (US$7.7 million), or 2.7% of total revenue in the first quarter ended March 31, 2022, compared to CAPEX of RMB74.7 million, or 2.7% of total revenue, in the same period of 2021. 

SHARES OUTSTANDING

As of May 31, 2022, the Company had approximately 392.5 million ordinary shares outstanding(10). Each American Depositary Share represents five (5) Class A ordinary shares.

As previously announced, effective from May 20, 2022, the Company has changed the ratio of its American Depositary Shares to its Class A ordinary shares, par value US$0.01 per share, from the original ADS ratio of one (1) ADS to one (1) Class A ordinary share, to a new ADS ratio of one (1) ADS to five (5) Class A ordinary shares.

FINANCIAL GUIDANCE

Due to the uncertainties relating to the COVID-19 pandemic, the Company renounces, and does not affirm, its previous financial guidance given in its results announcement dated March 8, 2022.  Accordingly, the Company is not providing any financial guidance or revenue outlook at this time. We are driving each of our business units toward a speedy recovery as the COVID-19 pandemic eases.

WEBCAST AND CONFERENCE CALL INFORMATION

The Company will hold a conference call at 9:00 pm U.S. Eastern Time on June 8, 2022 (9:00 am Beijing Time on June 9, 2022), to discuss its financial results and operating performance for the first quarter of 2022.

Participants may access the call by dialing the following numbers:

United States:                                     +1-888-317-6003
Hong Kong:                                         800-963976 or +852-5808-1995
Mainland China:                                  4001-206115
International:                                       +1-412-317-6061
Participant Elite Entry Number:           6408443

A replay of the conference call will be accessible through June 15, 2022 by dialing the following numbers:

United States:                                       +1-877-344-7529
International:                                         +1-412-317-0088
Replay Access Code:                            2605618

Please visit the Company’s investor relations website to view the earnings release prior to the conference call. A live and archived webcast of the conference call and a corporate presentation will be available at the same site.

ABOUT BEST INC.

BEST Inc. (NYSE: BEST) is a leading integrated smart supply chain solutions and logistics services provider in China and SEA. Through its proprietary technology platform and extensive networks, BEST offers a comprehensive set of logistics and value-added services, including freight delivery, supply chain management, and global logistics services. BEST’s mission is to empower business and enrich life by leveraging technology and business model innovation to create a smarter, more efficient supply chain. For more information, please visit: http://www.best-inc.com/en/.  

For investor and media inquiries, please contact:

BEST Inc.
Investor relations team                         
ir@best-inc.com

The Piacente Group, Inc.
Yang Song
Tel: +86-10-6508-0677
E-mail: best@tpg-ir.com

The Piacente Group, Inc.
Brandi Piacente
Tel: +1-212-481-2050
E-mail:  best@tpg-ir.com

SAFE HARBOR STATEMENT

This announcement contains forward-looking statements. These statements are made under the “safe harbor” provisions of the U.S. Private Securities Litigation Reform Act of 1995. These forward-looking statements can be identified by terminology such as “will,” “expects,” “anticipates,” “future,” “intends,” “plans,” “believes,” “estimates” and similar statements. Among other things, the business outlook and quotations from management in this announcement, as well as BEST’s strategic and operational plans, contain forward-looking statements. BEST may also make written or oral forward-looking statements in its periodic reports to the U.S. Securities and Exchange Commission (the “SEC”), in its annual report to shareholders, in press releases and other written materials and in oral statements made by its officers, directors or employees to third parties. Statements that are not historical facts, including statements about BEST’s beliefs and expectations, are forward-looking statements. Forward-looking statements involve inherent risks and uncertainties. A number of factors could cause actual results to differ materially from those contained in any forward-looking statement, including but not limited to the following: BEST’s goals and strategies; BEST’s future business development, results of operations and financial condition; BEST’s ability to maintain and enhance its ecosystem; BEST’s ability to compete effectively; BEST’s ability to continue to innovate, meet evolving market trends, adapt to changing customer demands and maintain its culture of innovation; fluctuations in general economic and business conditions in China and other countries in which BEST operates, and assumptions underlying or related to any of the foregoing. Further information regarding these and other risks is included in BEST’s filings with the SEC. All information provided in this press release and in the attachments is as of the date of this press release, and BEST does not undertake any obligation to update any forward-looking statement, except as required under applicable law.

USE OF NON-GAAP FINANCIAL MEASURES

In evaluating its business, BEST considers and uses non-GAAP measures, such as non-GAAP net loss/income, non-GAAP net loss/profit margin, adjusted EBITDA, adjusted EBITDA margin, EBITDA, and non-GAAP Diluted earnings/loss per ADS, as supplemental measures in the evaluation of the Company’s operating results and in the Company’s financial and operational decision-making. The Company believes these non-GAAP financial measures that help identify underlying trends in the Company’s business that could otherwise be distorted by the effect of the expenses and gains that the Company includes in loss from operations and net loss. The Company believes that these non-GAAP financial measures provide useful information about its operating results, enhance the overall understanding of its past performance and future prospects and allow for greater visibility with respect to key metrics used by the Company’s management in its financial and operational decision-making. The presentation of these non-GAAP financial measures is not intended to be considered in isolation or as a substitute for the financial information prepared and presented in accordance with U.S. GAAP. For more information on these non-GAAP financial measures, please see the table captioned “Reconciliations of Non-GAAP Measures to the Nearest Comparable GAAP Measures” in the results announcement.

The non-GAAP financial measures are provided as additional information to help investors compare business trends among different reporting periods on a consistent basis and to enhance investors’ overall understanding of the Company’s current financial performance and prospects for the future. These non-GAAP financial measures should be considered in addition to results prepared in accordance with U.S. GAAP, but should not be considered a substitute for, or superior to, U.S. GAAP results. In addition, the Company’s calculation of the non-GAAP financial measures may be different from the calculation used by other companies, and therefore comparability may be limited.

Summary of Unaudited Condensed Consolidated Income Statements

(In Thousands)

Three Months Ended March 31,

2021

2022

RMB

RMB

US$

Revenue

Freight

2,043,186

1,092,814

172,387

  -Freight

1,174,493

1,073,460

169,334

  -Legacy UCargo

868,693

19,354

3,053

Supply Chain Management

447,661

408,962

64,512

Global

250,422

268,709

42,388

Others

42,290

32,100

5,064

Total Revenue

2,783,559

1,802,585

284,351

Cost of Revenue

Freight

(2,029,952)

(1,170,314)

(184,612)

Supply Chain Management

(423,506)

(391,207)

(61,711)

Global

(265,102)

(285,678)

(45,065)

Others

(13,307)

(32,225)

(5,083)

Total Cost of Revenue

(2,731,867)

(1,879,424)

(296,471)

Gross Profit/(Loss)

51,692

(76,839)

(12,120)

Selling Expenses

(55,081)

(54,926)

(8,664)

General and Administrative
   Expenses

(194,680)

(200,054) (11)

(31,558)

Research and

   Development Expenses

(40,065)

(33,175)

(5,233)

Other operating
   income/(expense), net

41,718

2,640

416

Loss from Operations

(196,416)

(362,354)

(57,159)

Interest Income

11,707

15,618

2,464

Interest Expense

(35,512)

(26,422)

(4,168)

Foreign Exchange Gain

800

4,845

764

Other Income

40,735

16,109

2,541

Other Expense

(8,242)

(27,476)

(4,334)

Loss before Income Tax
   and Share of Net Loss of
   Equity Investees

(186,928)

(379,680)

(59,892)

Income Tax Expense

(4,290)

(219)

(35)

Loss before Share of Net
   loss of Equity Investees

(191,218)

(379,899)

(59,927)

Share of Net Loss of Equity
   Investees

Net Loss from continuing
   operations

(191,218)

(379,899)

(59,927)

Net loss from discontinued
   operations

(427,087)

(284)

(45)

Net Loss

(618,305)

(380,183)

(59,972)

Net loss attributable to non-
   controlling interests

(5,410)

(20,878)

(3,293)

Net Loss attributable to
    BEST Inc.

(612,895)

(359,305)

(56,679)

Summary of Unaudited Condensed Consolidated Balance Sheets

(in thousands)

As of December 31,2021

              As of March 31, 2022

      RMB

           RMB      

  US$         

Assets

Current Assets

Cash and Cash Equivalents

3,571,745

2,053,610

323,949

Restricted Cash

675,159

599,920

94,635

Accounts and Notes Receivables

827,631

752,397

118,690

Inventories

25,622

24,295

3,832

Prepayments and Other Current
   Assets

1,172,472

1,013,868

159,933

Short‑term Investments

147,359

1,297,440

204,666

Amounts Due from Related Parties

125,198

97,585

15,394

Lease Rental Receivables

298,364

223,073

35,189

Total Current Assets

6,843,550

6,062,188

956,288

Non‑current Assets

Property and Equipment, Net

762,642

748,443

118,064

Intangible Assets, Net

55,684

59,273

9,350

Long‑term Investments

219,171

189,171

29,841

Goodwill

54,135

54,135

8,540

Non‑current Deposits

92,866

83,257

13,133

Other Non‑current Assets

111,640

83,478

13,168

Restricted Cash

1,069,244

1,310,141

206,670

Lease Rental Receivables

235,429

168,478

26,577

Operating Lease Right-of-use
Assets

1,899,522

1,785,192

281,607

Total non‑current Assets

4,500,333

4,481,568

706,950

Total Assets

11,343,883

10,543,756

1,663,238

Liabilities and Shareholders’
   Equity

Current Liabilities

Long-term borrowings-current

287,814

239,382

37,762

Convertible Senior Notes held by
   related parties

633,475

632,259

99,736

Convertible Senior Notes held by
   third parties

633,475

632,259

99,736

Short‑term Bank Loans

530,495

410,156

64,701

Accounts and Notes Payable

1,353,150

1,373,396

216,648

Income Tax Payable

587

350

55

Customer Advances and Deposits
   and Deferred Revenue

298,353

292,141

46,084

Accrued Expenses and Other
   Liabilities

1,591,639

1,387,461

218,867

Financing Lease Liabilities

1,851

1,699

268

Operating Lease Liabilities

518,248

493,438

77,838

Amounts Due to Related Parties

2,763

11,430

1,803

Total Current Liabilities

5,851,850

5,473,971

863,498

Summary of Unaudited Condensed Consolidated Balance Sheets (Cont’d)

(In Thousands)

As of December 31, 2021

As of March 31, 2022

    RMB

         RMB

          US$

Non-current Liabilities

Convertible senior notes held by

   related parties

955,097

951,467

150,090

Long-term borrowings

67,080

32,702

5,159

Operating Lease Liabilities

1,456,843

1,374,940

216,891

Financing Lease Liabilities

2,121

2,104

332

Other Non‑current Liabilities

24,261

25,034

3,949

Long-term Bank Loans

769,767

841,231

132,701

Total Non‑current Liabilities

3,275,169

3,227,478

509,122

Total Liabilities

9,127,019

8,701,449

1,372,620

Mezzanine Equity:

Convertible Non-controlling Interests

191,865

191,865

30,266

Total mezzanine equity

191,865

191,865

30,266

Shareholders’ Equity

Ordinary Shares

25,988

25,988

4,100

Treasury Shares

(113,031)

(28,824)

(4,547)

Additional Paid‑In Capital

19,522,173

19,457,107

3,069,284

Statutory reserves

167

Accumulated Deficit

(17,471,716)

(17,843,712) (12)

(2,814,776)

Accumulated Other
   Comprehensive Income

107,379

93,050

14,678

BEST Inc. Shareholders’ Equity

2,070,960

1,703,609

268,739

Non-controlling Interests

(45,961)

(53,167)

(8,387)

Total Shareholders’ Equity

2,024,999

1,650,442

260,352

Total Liabilities, Mezzanine Equity
   and Shareholders’ Equity

11,343,883

10,543,756

1,663,238

Summary of Unaudited Condensed Consolidated Statements of Cash Flows

 (In Thousands)

Three Months Ended March 31,

2021

2022

RMB

RMB

US$

Net cash generated from/(used in) 
   continuing operating activities

47,887

(304,096)

(47,970)

Net cash used in discontinued
   operating activities

(705,838)

Net cash used in operating
   activities

(657,951)

(304,096)

(47,970)

Net cash generated from/(used in)
   continuing
investing activities

150,074

(879,542)

(138,744)

Net cash used in discontinued
   Investing activities

(127,278)

Net cash generated from/(used in) 
   investing activities

22,796

(879,542)

(138,744)

Net cash generated from/(used in)
   continuing financing
activities

274,100

(145,284)

(22,918)

Net cash used in discontinued
   financing
activities

(172,653)

Net cash generated from/(used in)
   financing activities

101,447

(145,284)

(22,918)

Exchange Rate Effect on Cash and
   Cash Equivalents, and Restricted
   Cash

6,716

(23,555)

(3,716)

Net decrease in Cash and Cash
   Equivalents, and Restricted Cash

(526,992)

(1,352,477)

(213,348)

Cash and Cash Equivalents, and
   Restricted Cash at Beginning of
   Period

4,209,121

5,316,148

838,602

Cash and Cash Equivalents, and
   Restricted Cash at End of
 Period

3,682,129

3,963,671

625,254

Less: Cash and Cash Equivalents,
   and Restricted Cash held for sales
   at end of the Period

588,824

Cash and Cash Equivalents, and

   Restricted Cash from continuing
   operations at End of
 Period

3,093,305

3,963,671

625,254

RECONCILIATIONS OF NON-GAAP MEASURES TO THE NEAREST COMPARABLE GAAP MEASURES

For the Company’s continuing operations, the table below sets forth a reconciliation of the Company’s net (loss)/income to EBITDA, adjusted EBITDA and adjusted EBITDA margin for the periods indicated:

Table 4 – Reconciliation of EBITDA, Adjusted EBITDA and Adjusted EBITDA Margin

Three Months Ended March31, 2022

(In RMB’000)

Freight

Supply Chain

Global

Others

Unallocated(13)

Total

Net Loss

(173,111)

(20,768)

(70,976)

(57,376)

(57,668)

(379,899)

Add

  Depreciation &
  Amortization

20,257

10,484

5,110

13,317

4,391

53,559

  Interest Expense

26,422

26,422

  Income Tax Expense

12

18

189

219

Subtract

Interest Income

(15,618)

(15,618)

EBITDA

(152,854)

(10,272)

(65,848)

(43,870)

(42,473)

(315,317)

Add

 Share-based

2,953

1,822

2,428

143

13,337

20,683

   Compensation
   Expenses

Adjusted EBITDA

(149,901)

(8,450)

(63,420)

(43,727)

(29,136)

(294,634)

Adjusted EBITDA
   Margin

(13.7%)

(2.1%)

23.6%)

(136.2%)

(16.3%)

Three Months Ended March 31, 2021

(In RMB’000)

Freight

Supply Chain

Global

Others

Unallocated(14)

Total

Net (Loss)/Income

(57,629)

(11,965)

(58,244)

5,296

(68,676)

(191,218)

Add

   Depreciation &
   Amortization

21,597

10,227

4,174

343

6,767

43,108

   Interest Expense

35,512

35,512

   Income Tax Expense

9

4,281

4,290

Subtract

  Interest Income

(11,707)

(11,707)

EBITDA

(36,032)

(1,729)

(54,070)

9,920

(38,104)

(120,015)

Add

 Share-based

3,162

1,896

2,150

146

19,704

27,058

    Compensation
    Expenses

Subtract

   Gain from
   appreciation of
   investments

(5,562)

(5,562)

Adjusted EBITDA

(32,870)

167

(51,920)

10,066

(23,962)

(98,519)

Adjusted EBITDA
   Margin

(1.6%)

0.0%

(20.7%)

23.8%

(3.5%)

For the Company’s continuing operations, the table below sets forth a reconciliation of the Company’s net (loss)/income to non-GAAP net Income/(loss), non-GAAP net Income/(loss) margin for the periods indicated:

Table 5 – Reconciliation of Non-GAAP Net (Loss)/Income and Non-GAAP Net (Loss)/Income Margin

Three Months  Ended March 31, 2022

(In RMB’000)

Freight

Supply Chain

Global

Others

Unallocated(15)

Total

Net Loss

(173,111)

(20,768)

(70,976)

(57,376)

(57,668)

(379,899)

Add

 Share-based

 Compensation Expenses

2,953

1,822

2,428

143

13,337

20,683

Non-GAAP Net
   Loss

(170,158)

(18,946)

(68,548)

(57,233)

(44,331)

(359,216)

Non-GAAP Net
   Loss Margin

(15.6%)

(4.6%)

(25.5%)

(178.3%)

(19.9%)

Three Months  Ended March 31, 2021

(In RMB’000)

Freight

Supply Chain

Global

Others

Unallocated(16)

Total

Net (Loss)/Income

(57,629)

(11,965)

(58,244)

5,296

(68,676)

(191,218)

Add

 Share-based

 Compensation Expenses

3,162

1,896

2,150

146

19,704

27,058

Subtract

   Gain from
   appreciation of
   investments

(5,562)

(5,562)

Non-GAAP Net
   (Loss)/Income

(54,467)

(10,069)

(56,094)

5,442

(54,534)

(169,722)

Non-GAAP Net
  (Loss)/Income
 Margin

(2.7%)

(2.2%)

(22.4%)

12.9%

(6.1%)

For the Company’s continuing operations, the table below sets forth a reconciliation of the Company’s diluted loss per ADS to Non-GAAP diluted loss per ADS for the periods indicated:

Table 6 – Reconciliation of diluted loss per ADS and Non-GAAP diluted loss per ADS

Three Months Ended March 31,

2022

(In ‘000)

             RMB          

       US$

Net Loss Attributable to Ordinary Shareholders

(359,021)

(56,634)

Add

   Share-based Compensation Expenses

20,683

3,263

Non-GAAP Net Loss Attributable to Ordinary
   Shareholders

(338,338)

(53,371)

Weighted Average Diluted Ordinary Shares
  Outstanding During the Quarter

Diluted

390,274,553

390,274,553

Diluted (Non-GAAP)

390,274,553

390,274,553

Diluted loss per ordinary share

(0.92)

(0.15)

Add

   Non-GAAP adjustment to net loss per
   ordinary share

0.05

0.01

Non-GAAP diluted loss per ordinary share

(0.87)

(0.14)

Diluted loss per ADS

(4.60)

(0.73)

Add

   Non-GAAP adjustment to net loss per ADS

0.27

0.05

Non-GAAP diluted loss per ADS

(4.33)

(0.68)

(1) All numbers presented have been rounded to the nearest integer, tenth, or hundredth, and year-over-year comparisons are based on figures before rounding.                     

(2) In December 2021, BEST sold its China express business, the principal terms of which were previously announced. As a result, China express business has been deconsolidated from the Company and its historical financial results are reflected in the Company’s consolidated financial statements as discontinued operations accordingly. The financial information and non-GAAP financial information disclosed in this press release is presented on a continuing operations basis, unless otherwise specifically stated.

(3) Non-GAAP net income/loss represents net income/loss excluding share-based compensation expenses, amortization of intangible assets resulting from business acquisitions, and fair value change of equity investments (if any).

(4) See the sections entitled “Use of Non-GAAP Financial Measures” and “Reconciliations of Non-GAAP Measures to the Nearest Comparable GAAP Measures” for more information about the non-GAAP measures referred to within this results announcement.

(5) Diluted earnings/loss per ADS, is calculated by dividing net income/loss attributable to ordinary shareholders as adjusted for the effect of dilutive ordinary equivalent shares, if any, by the weighted average number of ordinary and dilutive ordinary equivalent shares expressed in ADS outstanding during the period.

(6) EBITDA represents net loss excluding depreciation, amortization, interest expense and income tax expense and minus interest income. Adjusted EBITDA represents EBITDA excluding share-based compensation expenses and fair value change of equity investments (if any).

(7) All numbers presented have been rounded to the nearest integer, tenth, or hundredth, and year-over-year comparisons are based on figures before rounding.                     

(8) All numbers represented the financial results from continuing operations, unless otherwise stated.               

(9) Others” Segment primarily represents Capital business units. Results from UCargo’s legacy contracts with external customers are now reported under “Freight” segment and prior period segment information were retrospectively revised to conform to current period presentation.           

(10) The total number of shares outstanding excludes shares reserved for future issuances upon exercise or vesting of awards granted under the Company’s share incentive plans.

(11) Including additional expenses associated with winding down the Capital business line of RMB28,005.

(12) Including accumulated accretion to redemption value and deemed dividend in relation to redeemable convertible preferred shares of RMB9,493,807, and accumulated loss from operations of RMB8,349,905.

(13) Unallocated expenses are primarily related to corporate administrative expenses and other miscellaneous items that are not allocated to individual segments.

(14) Unallocated expenses are primarily related to corporate administrative expenses and other miscellaneous items that are not allocated to individual segments.

(15) Unallocated expenses are primarily related to corporate administrative expenses and other miscellaneous items that are not allocated to individual segments.

(16) Unallocated expenses are primarily related to corporate administrative expenses and other miscellaneous items that are not allocated to individual segments.

Cision View original content to download multimedia:https://www.prnewswire.com/news-releases/best-inc-announces-unaudited-first-quarter-2022-financial-results-301564167.html

Source: BEST Inc.

New app from Health in Transportation & NuraLogix allows drivers to perform CDL health checks that target hypertension and type-2 diabetes.

DETROIT, June 8, 2022 /PRNewswire/ — Professional drivers, working both in mass transit and in trucking, are now able to access a 30-second CDL health check that focuses on the dangers of hypertension and type-2 diabetes by utilizing a new smartphone app from Health in Transportation and NuraLogix.

New app from Health in Transportation & NuraLogix allows drivers to perform CDL health checks that target hypertension and type-2 diabetes.

This app, called the CDL Health Scanner, allows drivers to quickly scan key vitals using either an iPhone or Android device. It is a unique, driver-centric system that relies on the revolutionary Anura technology to measure Blood Pressure (BP) using transdermal optical imaging delivered via a smartphone camera. When combined with the user’s Body Mass Index (BMI) data, the risk-factors for hypertension, type-2 diabetes, and even obstructive sleep apnea (OSA), the bane of over-the-road truckers, come into clear focus.

The Background

In a situation in which the industry is experiencing a shortage of close to 100,000 drivers – and when putting a new driver behind the wheel involves five-figure expense for the carrier – reducing the number of medical disqualifications that result from a Department of Transportation physical is the top priority. Close to 80% of those disqualifications are caused by high BP, dangerous blood-sugar levels and OSA, and this app not only warns drivers that they are in dangerous territory, it also links them to specialty health coaches who can guide lifestyle changes that will transform their health situation.

The principals of Health in Transportation have a proven track record, over several decades, of finding realistic ways for drivers to improve their health, despite the massive difficulties that life on the road creates. The CDL Health Scanner is the culmination of that work and their greatest achievement. It promises to protect the lives and livelihoods of hundreds of thousands of professional drivers whose life-expectancies are years less than their contemporaries. Fleets benefit too by reducing driver-replacement costs, while providing savings in their self-financed health insurance programs.

The Partnership

It would be impossible for Health in Transportation to offer this valuable tool to the transportation sector without the incredible breakthrough that the Anura technology represents. Just as important, by opting to partner with Health in Transportation, NuraLogix has ensured that this product can be supplied to drivers for only a few cents a day. The mark of true innovation is its ability to impact the lives of millions and this app is the first step towards doing just that.

Of course, the CDL Health Scanner app utilizes only a portion of the monitoring capability that NuraLogix is equipped to provide. However, getting Anura into the hands of hundreds of thousands of professional drivers will generate a wealth of data that can only enhance the Anura platform when, as will inevitably be the case, this type of non-intrusive health monitoring becomes the norm for in-car information systems. Truck drivers, many of whom drive vehicles that include interior cameras that monitor their situational awareness and other performance metrics, are the perfect population to help propel this concept into the mainstream.

About Health in Transportation

This truly unique app – patent pending was first envisioned by Bob Perry, President of Health in Transportation, a company that provides innovative and practical Health & Wellness solutions for professional drivers in trucking and mass transit. For forty years, their programs have helped thousands of drivers avoid medical disqualification with unique coaching mechanisms that drivers utilize on the road to upgrade their health status. Consequently, health insurance carriers such as Cigna have often availed themselves of the company’s services in their ongoing efforts to boost preventative care.

Known as ‘The Trucker Trainer’ by professional drivers nationwide, Bob Perry brings a very distinctive perspective to the transportation industry and its over-the-road drivers. Bob comes from a family of professional drivers and has played a critical role in the paradigm shift of regulatory agencies – both private and public sector entities – and consumers towards understanding the driver-health challenge.

Health in Transportation has experienced successful working relationships in the past with industry giants such as Covenant Transport, Greyhound, Sherwin Williams, and R+L Carriers, as well as with top OEM Daimler.

About AutoTech Detroit

The CDL Health Scanner app was launched today at AutoTech Detroit, which brings together the full automotive tech industry to immerse attendees in the future of automotive, by showcasing the newest tech and the latest vehicles.

About NuraLogix

The Anura technology powering the application comes from NuraLogix, the Toronto-based pioneers of the world’s first contactless blood pressure and vital sign measurement platform. The NuraLogix technology uses their patented Transdermal Optical Imaging (TOI™) in which a conventional video camera is used to extract facial blood flow information from the face. NuraLogix’s Anura technology is based on extensive peer-reviewed research and clinical studies, differentiating them from their competitors. NuraLogix has conducted multiple clinical studies and published research in many notable publications such as Frontiers in Psychology, Scientific Reports, and the Journal of Natural Sciences (JNS). NuraLogix currently holds 11 patents, with more pending. Their impressive client roster includes Japanese systems integration leader NTT Data; Sanitas, the second largest medical insurance company in Spain; and Lafiya Telehealth, a Nigerian-based health telehealth platform which provides 24/7 virtual healthcare services to residents in remote and rural areas.

To Learn More:

Visit our website:
Health in Transportation-  https://healthintransportation.com/
NuraLogix –https://www.nuralogix.ai/ 

Disclaimers:

Note: In the United States, this product is for Investigational Use only. The performance characteristics of this product have not been established.

For more Information: Chris Lin, Chief Marketing Officer, ChrisLin@nuralogix.ai, Tel: 437-928-2666; Bob Perry, President of Health in Transportation, bob@healthintransportation.com, Tel: 602-692-2734

SIGNATURE KITCHEN SUITE PRESENTS VALUE OF ‘TRUE TO FOOD’ PHILOSOPHY IN MILAN

Ultra-Premium Built-in Brand’s Innovation with a Passion for Food

SEOUL, South Korea, June 8, 2022 /PRNewswire/ — LG Electronics (LG) is set to hold a series of sophisticated events at the Signature Kitchen Suite Showroom in Piazaa Cavour, Milan, during this year’s Milan Design Week 2022.

LG Electronics (LG) is set to hold a series of events at the Signature Kitchen Suite Showroom in Piazza Cavour, Milan, during Milan Design Week 2022.

LG Electronics (LG) is set to hold a series of events at the Signature Kitchen Suite Showroom in Piazza Cavour, Milan, during Milan Design Week 2022.

During Milan Design Week 2022, an architect and illustrator, Carlo Stanga showcases his work of art at the Signature Kitchen Suite Showroom in Piazza Cavour, Milan.

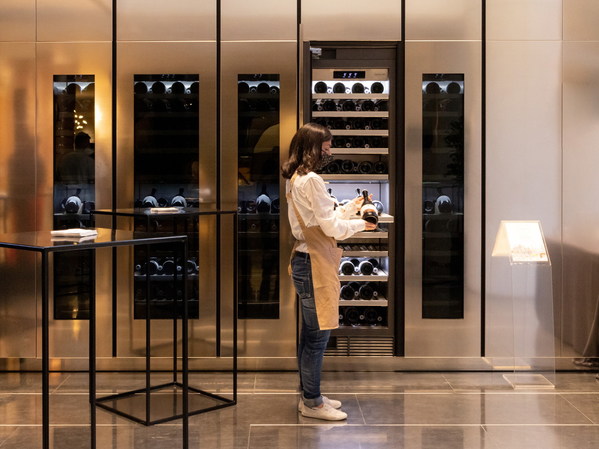
Product line-ups including 18-inch and 24-inch Column Wine Cellars from LG’s ultra-premium built-in kitchen appliance brand Signature Kitchen Suite are showcased in the Signature Kitchen Suite Showroom in Piazza Cavour, Milan.

Open since 2020, the showroom presents the luxurious offerings of Signature Kitchen Suite, a brand that is creating new trends in built-in kitchen appliances. Admired throughout Europe, the home of built-in appliances, LG’s luxurious built-in kitchen solutions combine the company’s innovative technologies and passion for food to deliver precise cooking and food preservation as well as next-level style and convenience.

The ultra-premium brand’s showroom resembles an elegant, modern art gallery where tradition and innovation come together in effortless harmony. Perfectly complementing the understated design of Signature Kitchen Suite’s advanced appliances is a nature-inspired décor by Calvi Brambilla, one of Milan’s most esteemed interior design studios. Visitors can see and experience for themselves the unique value of Signature Kitchen Suite and LG’s home appliances by exploring the showroom’s Food Academy and curated domestic spaces, including the kitchen, living room, bedroom and laundry room.

During Milan Design Week 2022, the showroom will demonstrate the true value of Signature Kitchen Suite products through the True to Food™ Itinerary event – which shows consumers the benefits of a True to Nature lifestyle, where ingredients are kept nature-fresh by LG’s latest technologies. Also on offer are cookery courses hosted by Signature Kitchen Suite’s food experience director, the noted chef, Andrea Vigna, and storytelling by architect, illustrator and author, Carlo Stanga, as well as appearances by well-known artists and furniture designers. Providing a variety of delicious experiences, the showroom’s events convey the importance of proper food storage and preparation, and the passion and dedication Signature Kitchen Suite has for sharing its True to Food philosophy.

“Visitors to our showroom this Milan Design Week will experience the unmatched value and artistry of our ultra-premium brand appliances, and see for themselves how we remain true to creating a better life in all areas of the home,” said Lyu Jae-cheol, president of LG Electronics Home Appliance & Air Solution Company. “We will continue to expand our portfolio of built-in appliances for the European market with high-tech, well-designed products that meet the needs and expectations of the most discerning consumers.”

For more information on the Signature Kitchen Suite Showroom in Milan, visit www.signaturekitchensuite.it/it_en/.

About LG Electronics Home Appliance & Air Solution Company

The LG Home Appliance & Air Solution Company is a leader in home appliances, smart home solutions, air solutions as well as visionary products featuring LG ThinQ AI. The company is creating various solutions with its industry leading core technolglobal ogies and is committed to making life better and healthier for consumers by developing thoughtfully designed kitchen appliances, living appliances, HVAC and air purification solutions. Together, these products deliver enhanced convenience, superb performance, efficient operation and compelling health benefits. For more news on LG, visit www.LGnewsroom.com.

Source: LG Electronics, Inc.
SONGTRADR EXPANDS ITS B2B MUSIC TECHNOLOGY SOLUTIONS – ACQUIRES LEADING ADVANCED AI SEARCH COMPANY, MUSICUBE


The Hamburg-based AI technology company enables measurable ROI-driven licensing that optimizes the creative performance of content

LOS ANGELES, June 8, 2022 /PRNewswire/ — Songtradr, the world’s leading B2B music company, announced today the acquisition of leading AI metadata and music search company, Musicube. The transaction expands the company’s portfolio of tech-enabled music solutions designed to license the right music for any content, driving higher ROI and enabling brands to measurably engage their target audience. Using neural networks and proprietary artificial intelligence, Musicube’s semantic search has reached product leadership in both quality and data depth. It helps match music to content and a brand’s target audience. This technology further enhances Songtradr’s B2B music solutions that harness the power of data and tech-enabled intelligence with creative excellence.

“Musicube has approached audio analysis from an entirely unique perspective and this acquisition accelerates our mission to increase the value and effectiveness of music in content,” said Paul Wiltshire, CEO of Songtradr. “Their impressive team of passionate musicologists and data scientists understand the power of data and its relationship with music, which ultimately benefits our brand and agency customers as well as music rights holders. In order to have the world’s best B2B music search and recommendation technology, we need premier metadata enrichment technology, which is a key component of the B2B music supply chain. Adding the Musicube technologies, data and extraordinary team to Songtradr will help accelerate our enterprise customer user experience.”

Musicube’s proprietary software is delivered via web widgets and an API that provides pristine metadata at scale for music labels, publishers, music supervisors, among many other audiences. The technology also enables customers to search for tracks, playlists and artists based on audiences, moods, genres, vocal features, instruments, tempo and more, unlocking the true value of catalogs and rights.

David Hoga, CEO and founder of Musicube, said: “Songtradr is the most exciting music company we have seen in a very long time. We are incredibly happy to join this exceptional team of music lovers and technologists as every single conversation we have had can be characterized by both cordiality and an ambitious agenda. We share a common vision of an artist-friendly music industry, using data to achieve it.”

With a team of more than 350 people and offices in 12 countries worldwide, Songtradr has grown from being a music tech product for independent artists to a multi-disciplined, end-to-end solution for music buyers, brands and rights holders.

Songtradr’s unique portfolio of the world’s leading music services companies (Massive Music, Big Sync Music and Song Zu) alongside its industry-leading technology and data products (Songtradr, Tunefind, Pretzel, Jaxsta (investment only) and Musicube) provides its customers a distinct advantage to maximize the value of music in their projects.

For more information about Songtradr’s products and services, visit songtradr.com.

ABOUT MUSICUBE:

Musicube’s music AI solution provides rich metadata for music labels, publishers, rights holders and others seeking song discoverability tools. The database includes more than 50 million song titles with ISRC and all contributors, as well as more than 500 keywords (such as moods, musical characteristics, content from song lyrics and many more). The company is composed of experienced musicologists and data scientists  based in Hamburg, Germany. For more information, visit http://www.musicu.be.

ABOUT SONGTRADR:

Songtradr is where music meets data, ideas meet innovation, and brand missions are transformed by sound.

We work with brands, agencies, businesses, labels, artists, and more, empowering them to excel on an international stage. Propelled by technology, real-time data intelligence, and musical expertise, our fully integrated products and services help amplify brands and enable artists and rights holders to realize the full potential of their catalog.

Whether with a classic song or a trending tune, a global music strategy or a sonic identity, we help translate ideas into powerful, ROI-driven solutions to ensure content always hits the right note.

We power the world with music.

Press Contact:
Kara Gaughan
Jive PR + Digital
778-872-7676  
kara@jiveprdigital.com   
www.jiveprdigital.com 

[WWDC 2022] Apple Introduces iOS 16 – of Widgets, Shared Library, Mail Scheduling, and Recalling Messages

Every year at WWDC, Apple always says that their latest update to iOS is the biggest one ever. To be fair, iOS has come a long way since we first saw it in the first Apple iPhone. It got an App Store a few generations later and never looked back. But the modern iOS is more than its app store, it is the updates that Apple has added to the iOS that makes it such a versatile interface we know today.

Apple is not technically wrong to say that the iOS 16 update is the biggest ever for the iOS interface. In terms of visuals at least, iOS 16’s interface could be the most visually distinct iOS ever. It also seems like Apple is finally going into a completely different direction with making the iOS better than ever. The update, technically, is the most feature packed major update ever.

Lock Screen – Not Just a Screen Anymore

photo6123087016095756444
photo6123087016095756445
photo6123087016095756437
Apple WWDC22 iOS16 Lockscreen Notifications 220606
Apple WWDC22 iOS16 Live Activities Starbucks 220606
Apple WWDC22 iOS16 Live Activities Nike Run Club 220606
Apple WWDC22 iOS16 Live Activities Apple TV Plus 220606
Apple WWDC22 iOS16 Live Activities Apple Music 220606
1 / 8

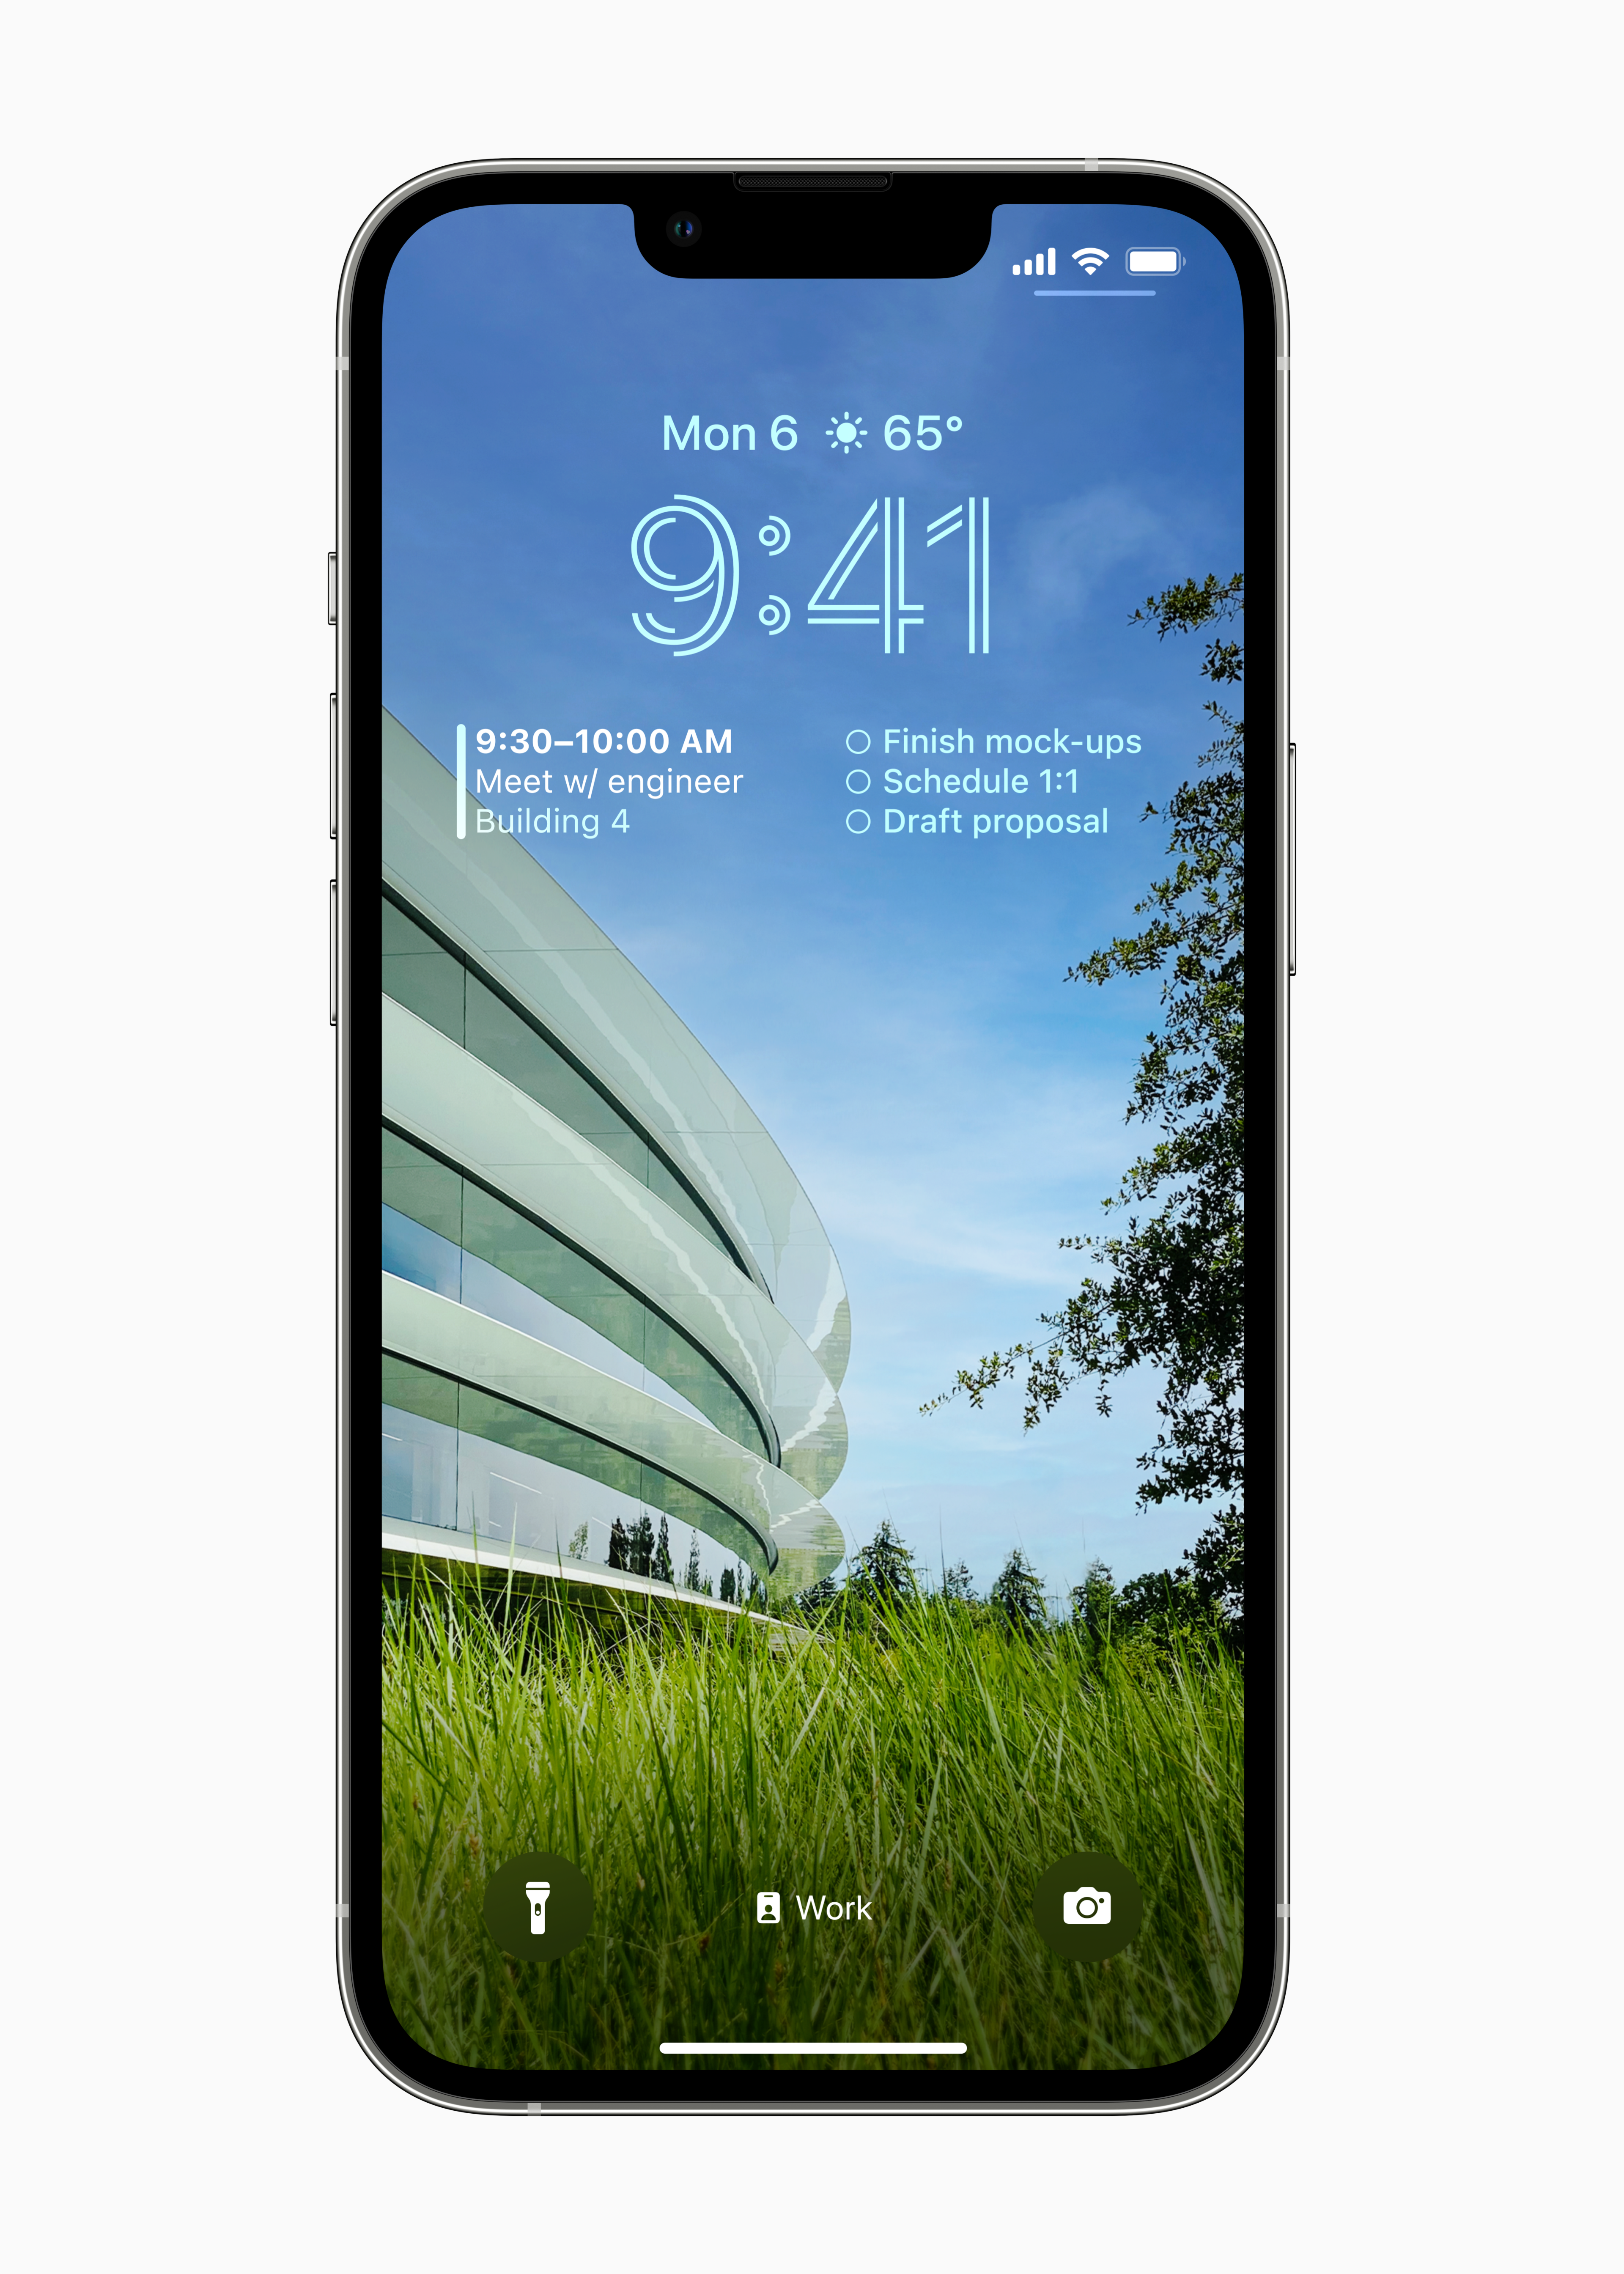
Lock screens have always been the most plain looking part of the iOS experience. It is basically a transitional screen before you get to your main home screen. Most of the time, you probably use it as a sort of clock or watch replacement too, a quick glance to tell you the time of day and date.

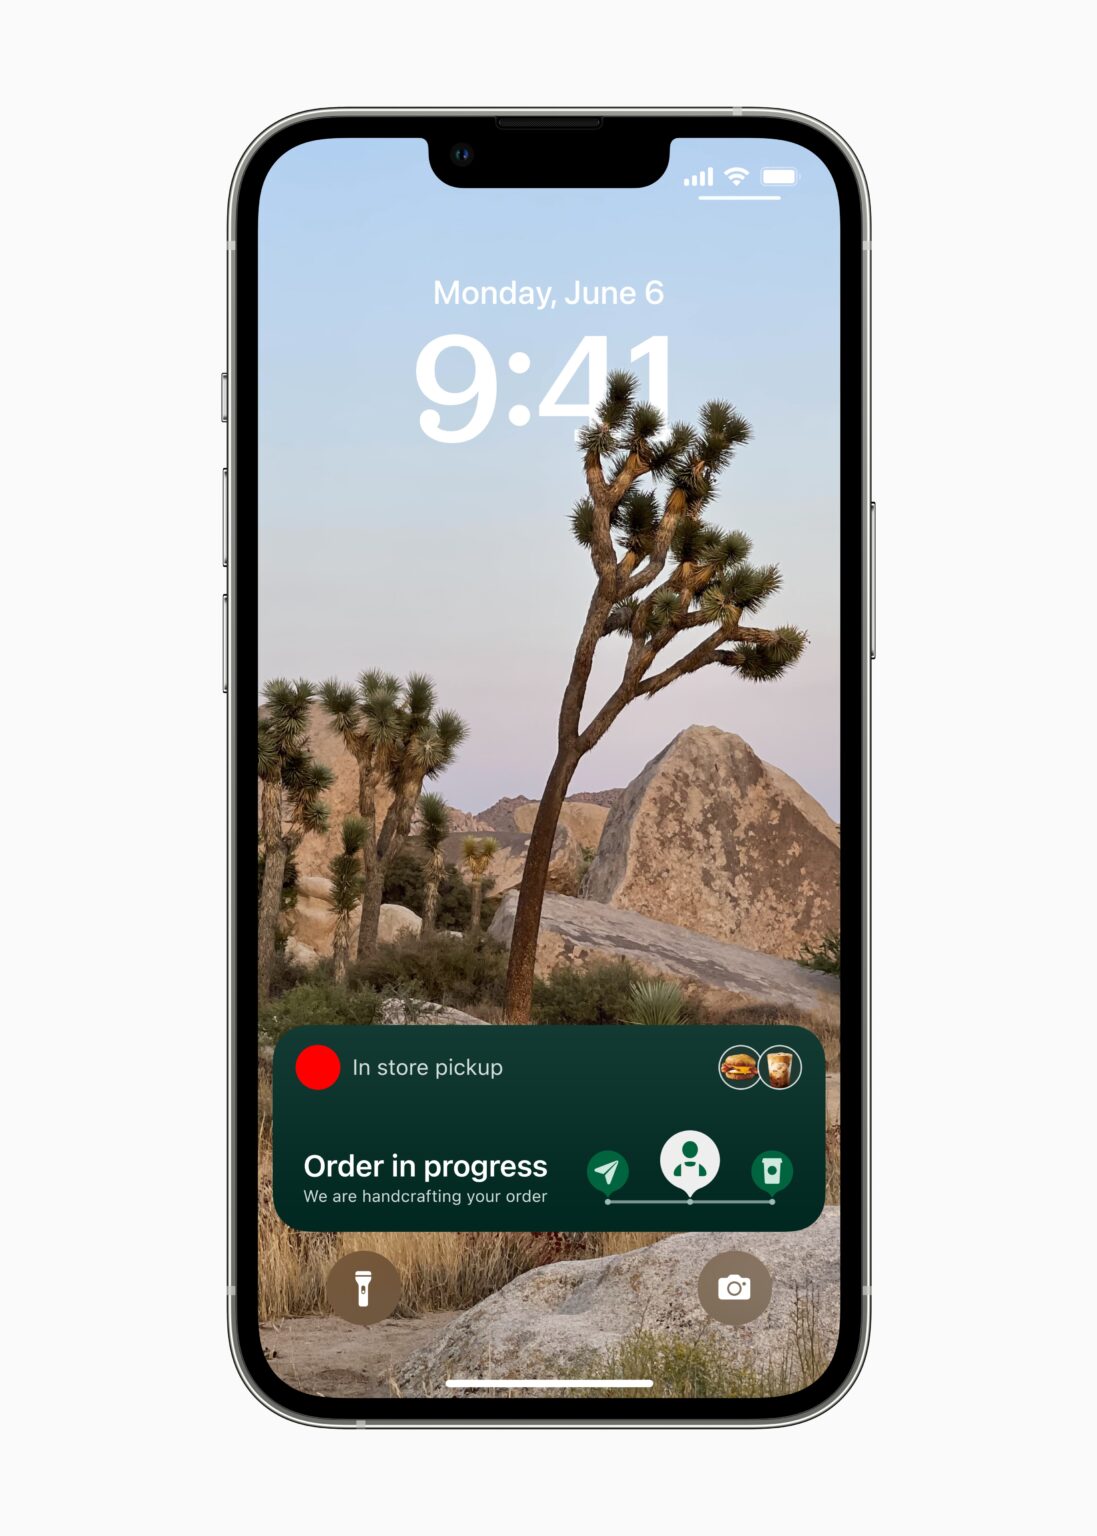
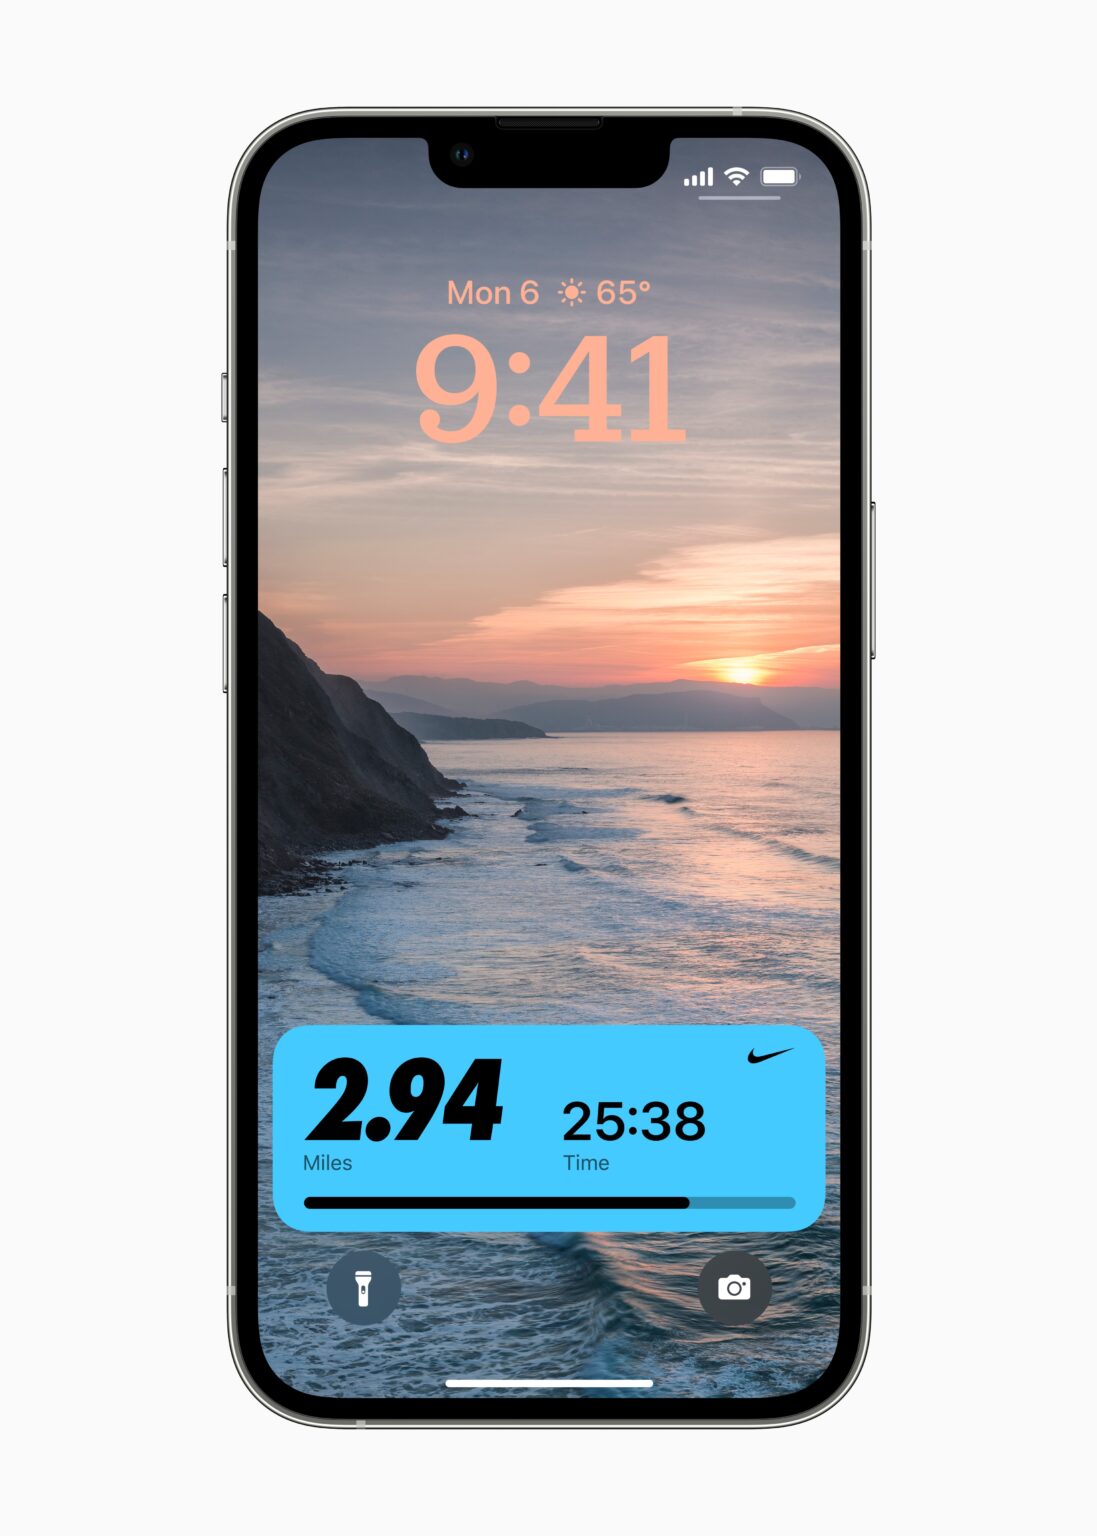
The thing is, there is a lot more you can do with the lock screen. It is technically a blank canvas for quick glances. That is what they implemented on the iOS 16.

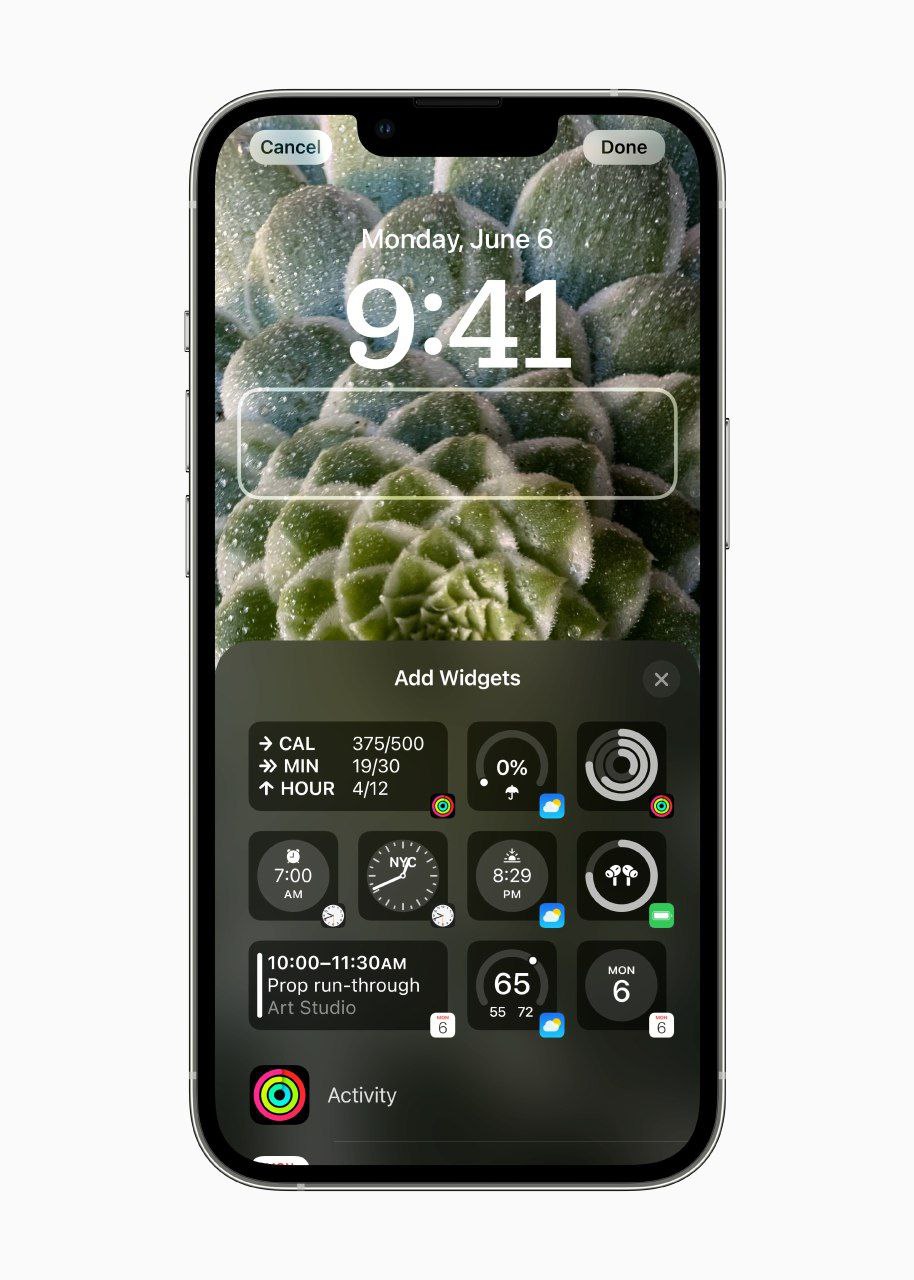
They say that it is an inspiration from the Apple Watch. The home screen is now an information throve but designed in such a way that you can absorb everything by just quickly glancing through it. It now updates you on your next calendar agenda, battery levels, the weather, upcoming alarms, time zones, and even your activity ring progress. Of course, your essential time and date information will always be the front and center of your lock screen notification center. Of course, there is only a limited amount of space for information as well, so you get to choose which widgets go on your lock screen.

At the same time, users get to work with multilayered effects to really personalize their lock screen. You can artfully choose a lock screen image and iOS can cleverly layer your clock and widgets behind the art subject to create this rather interesting 3D layering of your lock screen. It is not really a Live Wallpaper kind of thing, but it is still rather interesting to work with.

Focusing on the Important Stuff

Apple WWDC22 iOS16 3up hero 220606
Apple WWDC22 iOS16 Focus Lock Screen Personal 220606
Apple WWDC22 iOS16 Focus Lock Screen Work 220606
Apple WWDC22 iOS16 Focus switcher 220606
Apple WWDC22 iOS16 Home app 220606

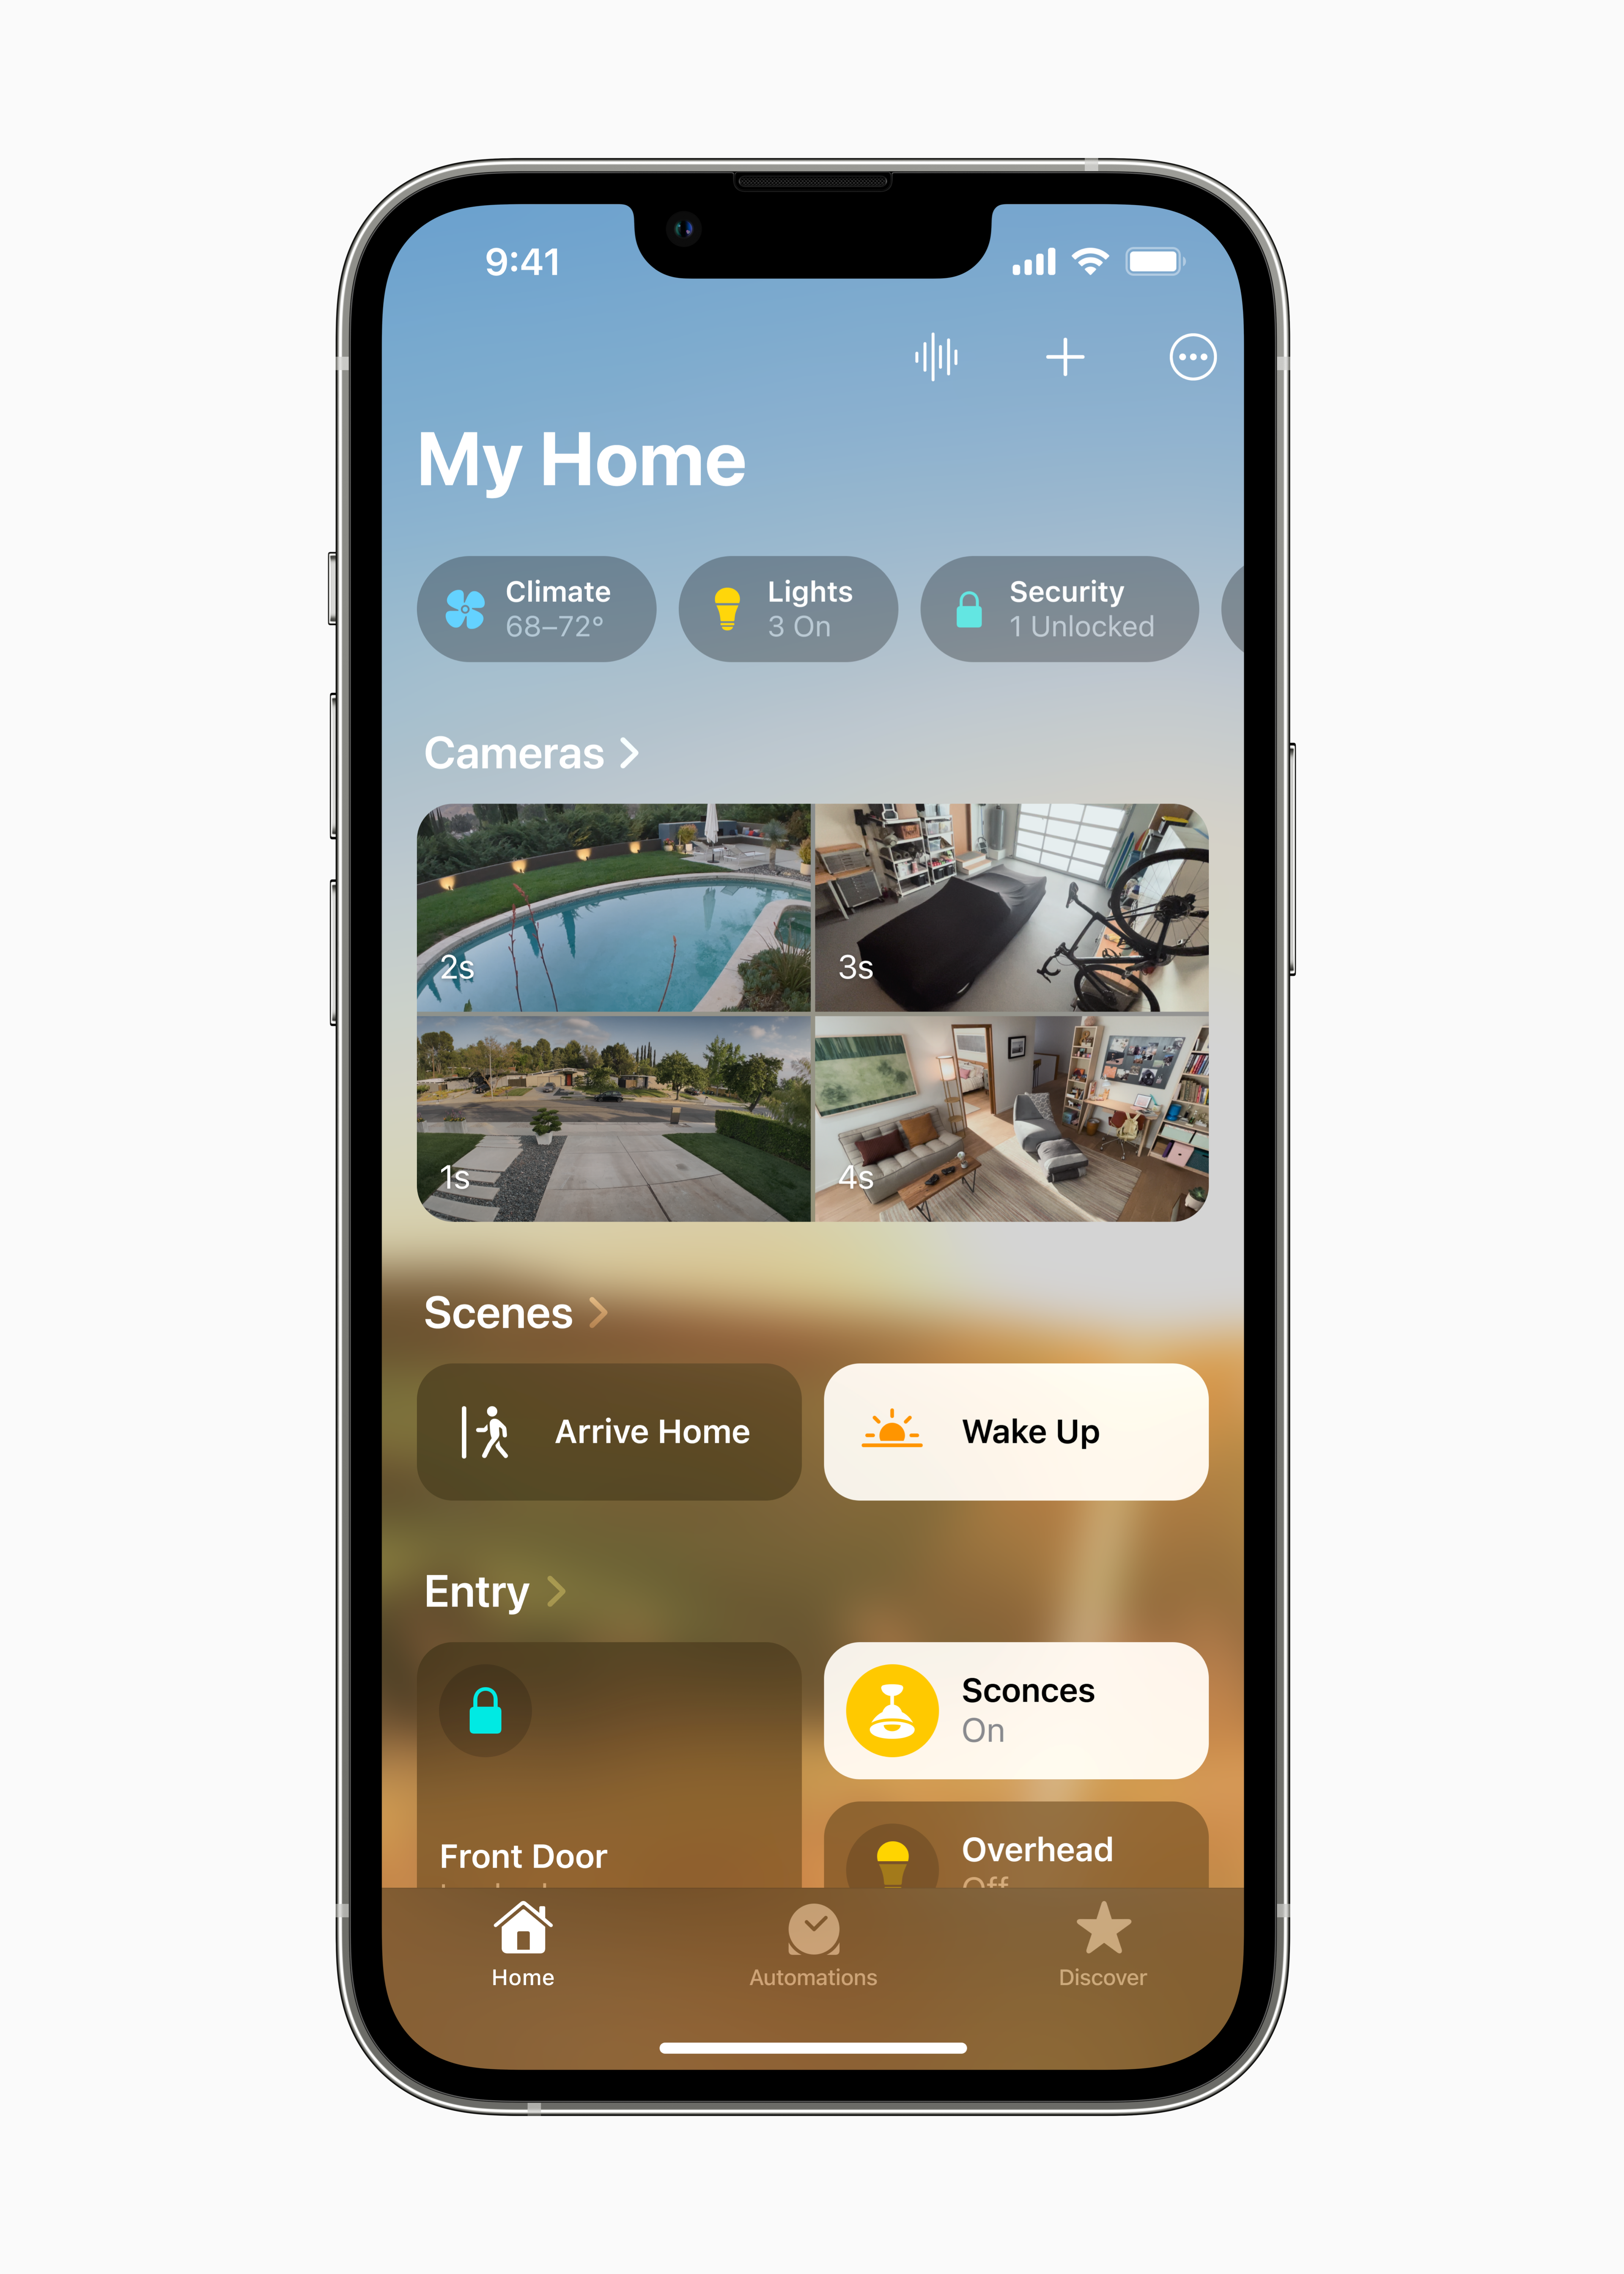
Not much here, but Apple have claimed that they have improved Focus on the new iOS 16. To activate different focus modes, all you need to do is to swipe to differing lock screens you have on your iPhone. Different focus modes can also be customized to notify and show different notifications to ensure that users are given relevant information at whatever focus mode they choose to work with at any time.

A Shared Library

photo6123087016095756442
Apple WWDC22 iOS16 iCloud Shared Photo Library selected photos 220606
Apple WWDC22 iOS16 iCloud Shared Photo Library Camera app 220606
Apple WWDC22 iOS16 iCloud Shared Photo Library For You 220606
Apple WWDC22 iOS16 Family Sharing 220606

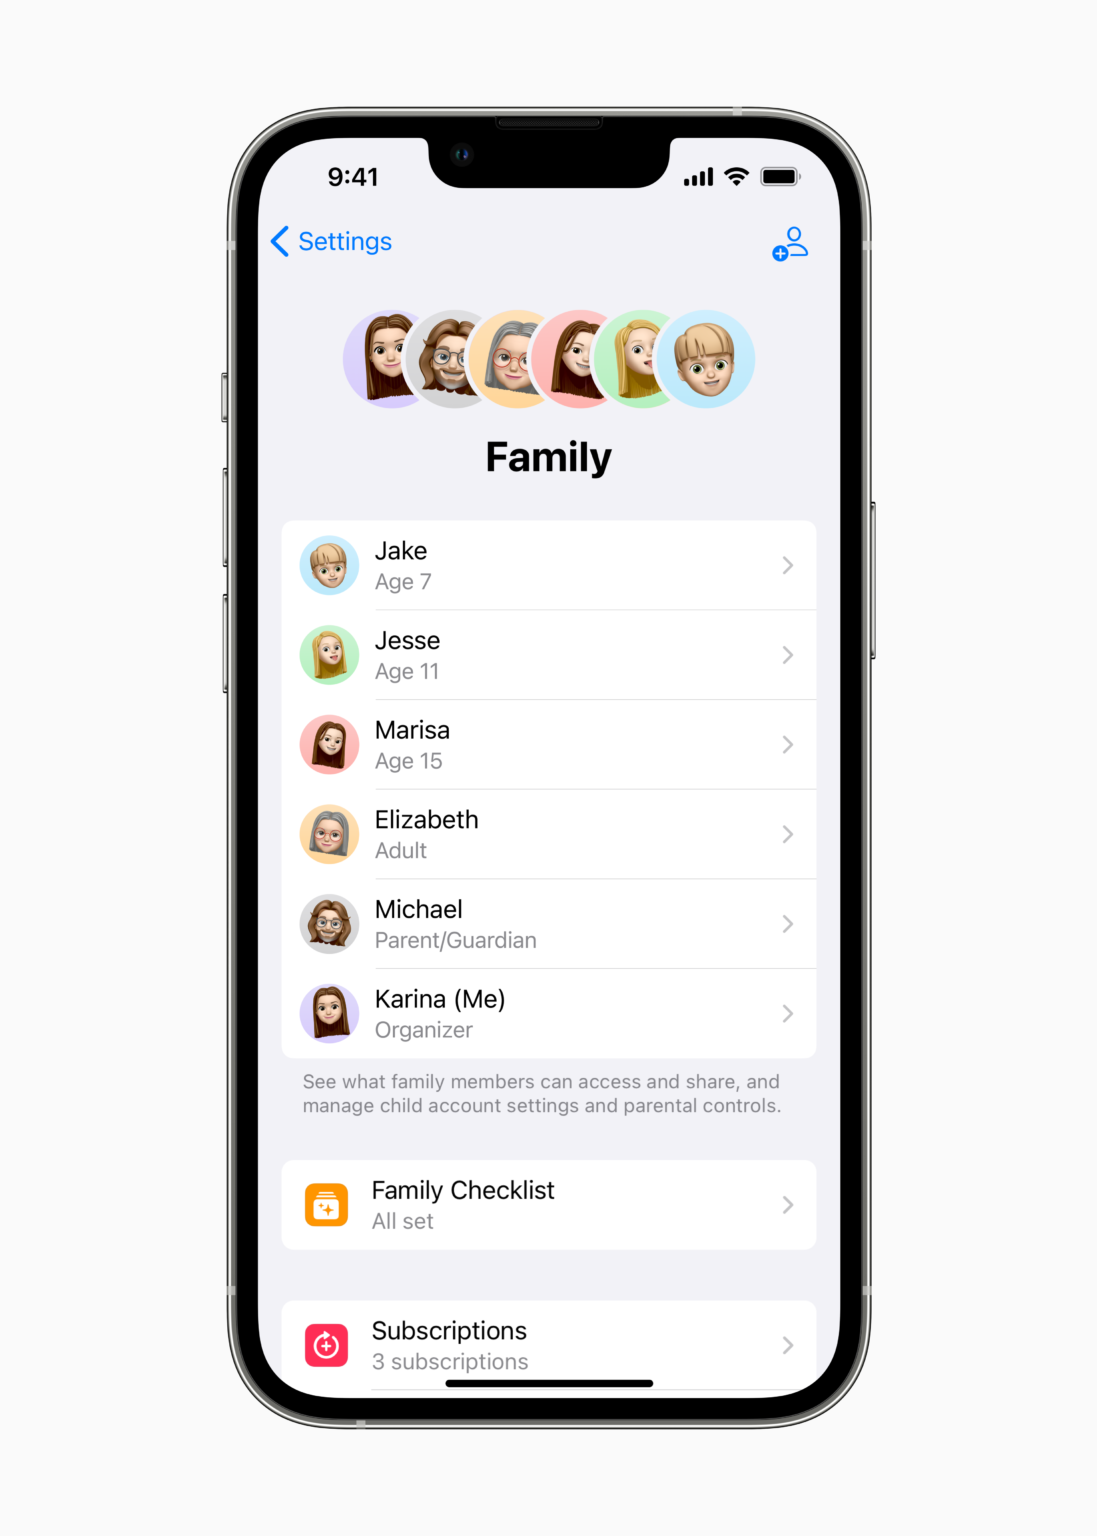
With the power of iCloud, you can now share your photo library with your family. The Shared Photo Library feature gives users the ability to collaborate or share the library with up to five other people. Each user can also share photos from their own personal library to be included in the shared library. Each user in the library can also add, delete, edit, and favourite their photos or videos in the library.

Unsend Stuff on Messages

Apple WWDC22 iOS16 Focus filter Messages 220606
Apple WWDC22 iOS16 Mail search 220606
photo6123087016095756443
photo6123087016095756441

Usually, when you send messages, once it gets through, you can hardly retrieve it. With the introduction of new messenger apps like Telegram, you can now unsend messages that you sent to unintended parties. WhatsApp also recently introduced the same “delete message” feature with a certain time limit to it. Now the feature to unsend a message is available of the iOS native messaging app. They did not stop there/

You can now mark messages as unread, just so that it still can appear on your message list as unread, just so you can come back to it later. You can also recover recently deleted messages if you accidentally delete an important message. SharePlay is also new on iOS Messages. You get to enjoy synced movies or songs and even control their playback all while through messaging via Messages.

Mail Better

Apple WWDC22 iOS16 Focus filter Mail 220606
Apple WWDC22 iOS16 Dictation in Mail 220606

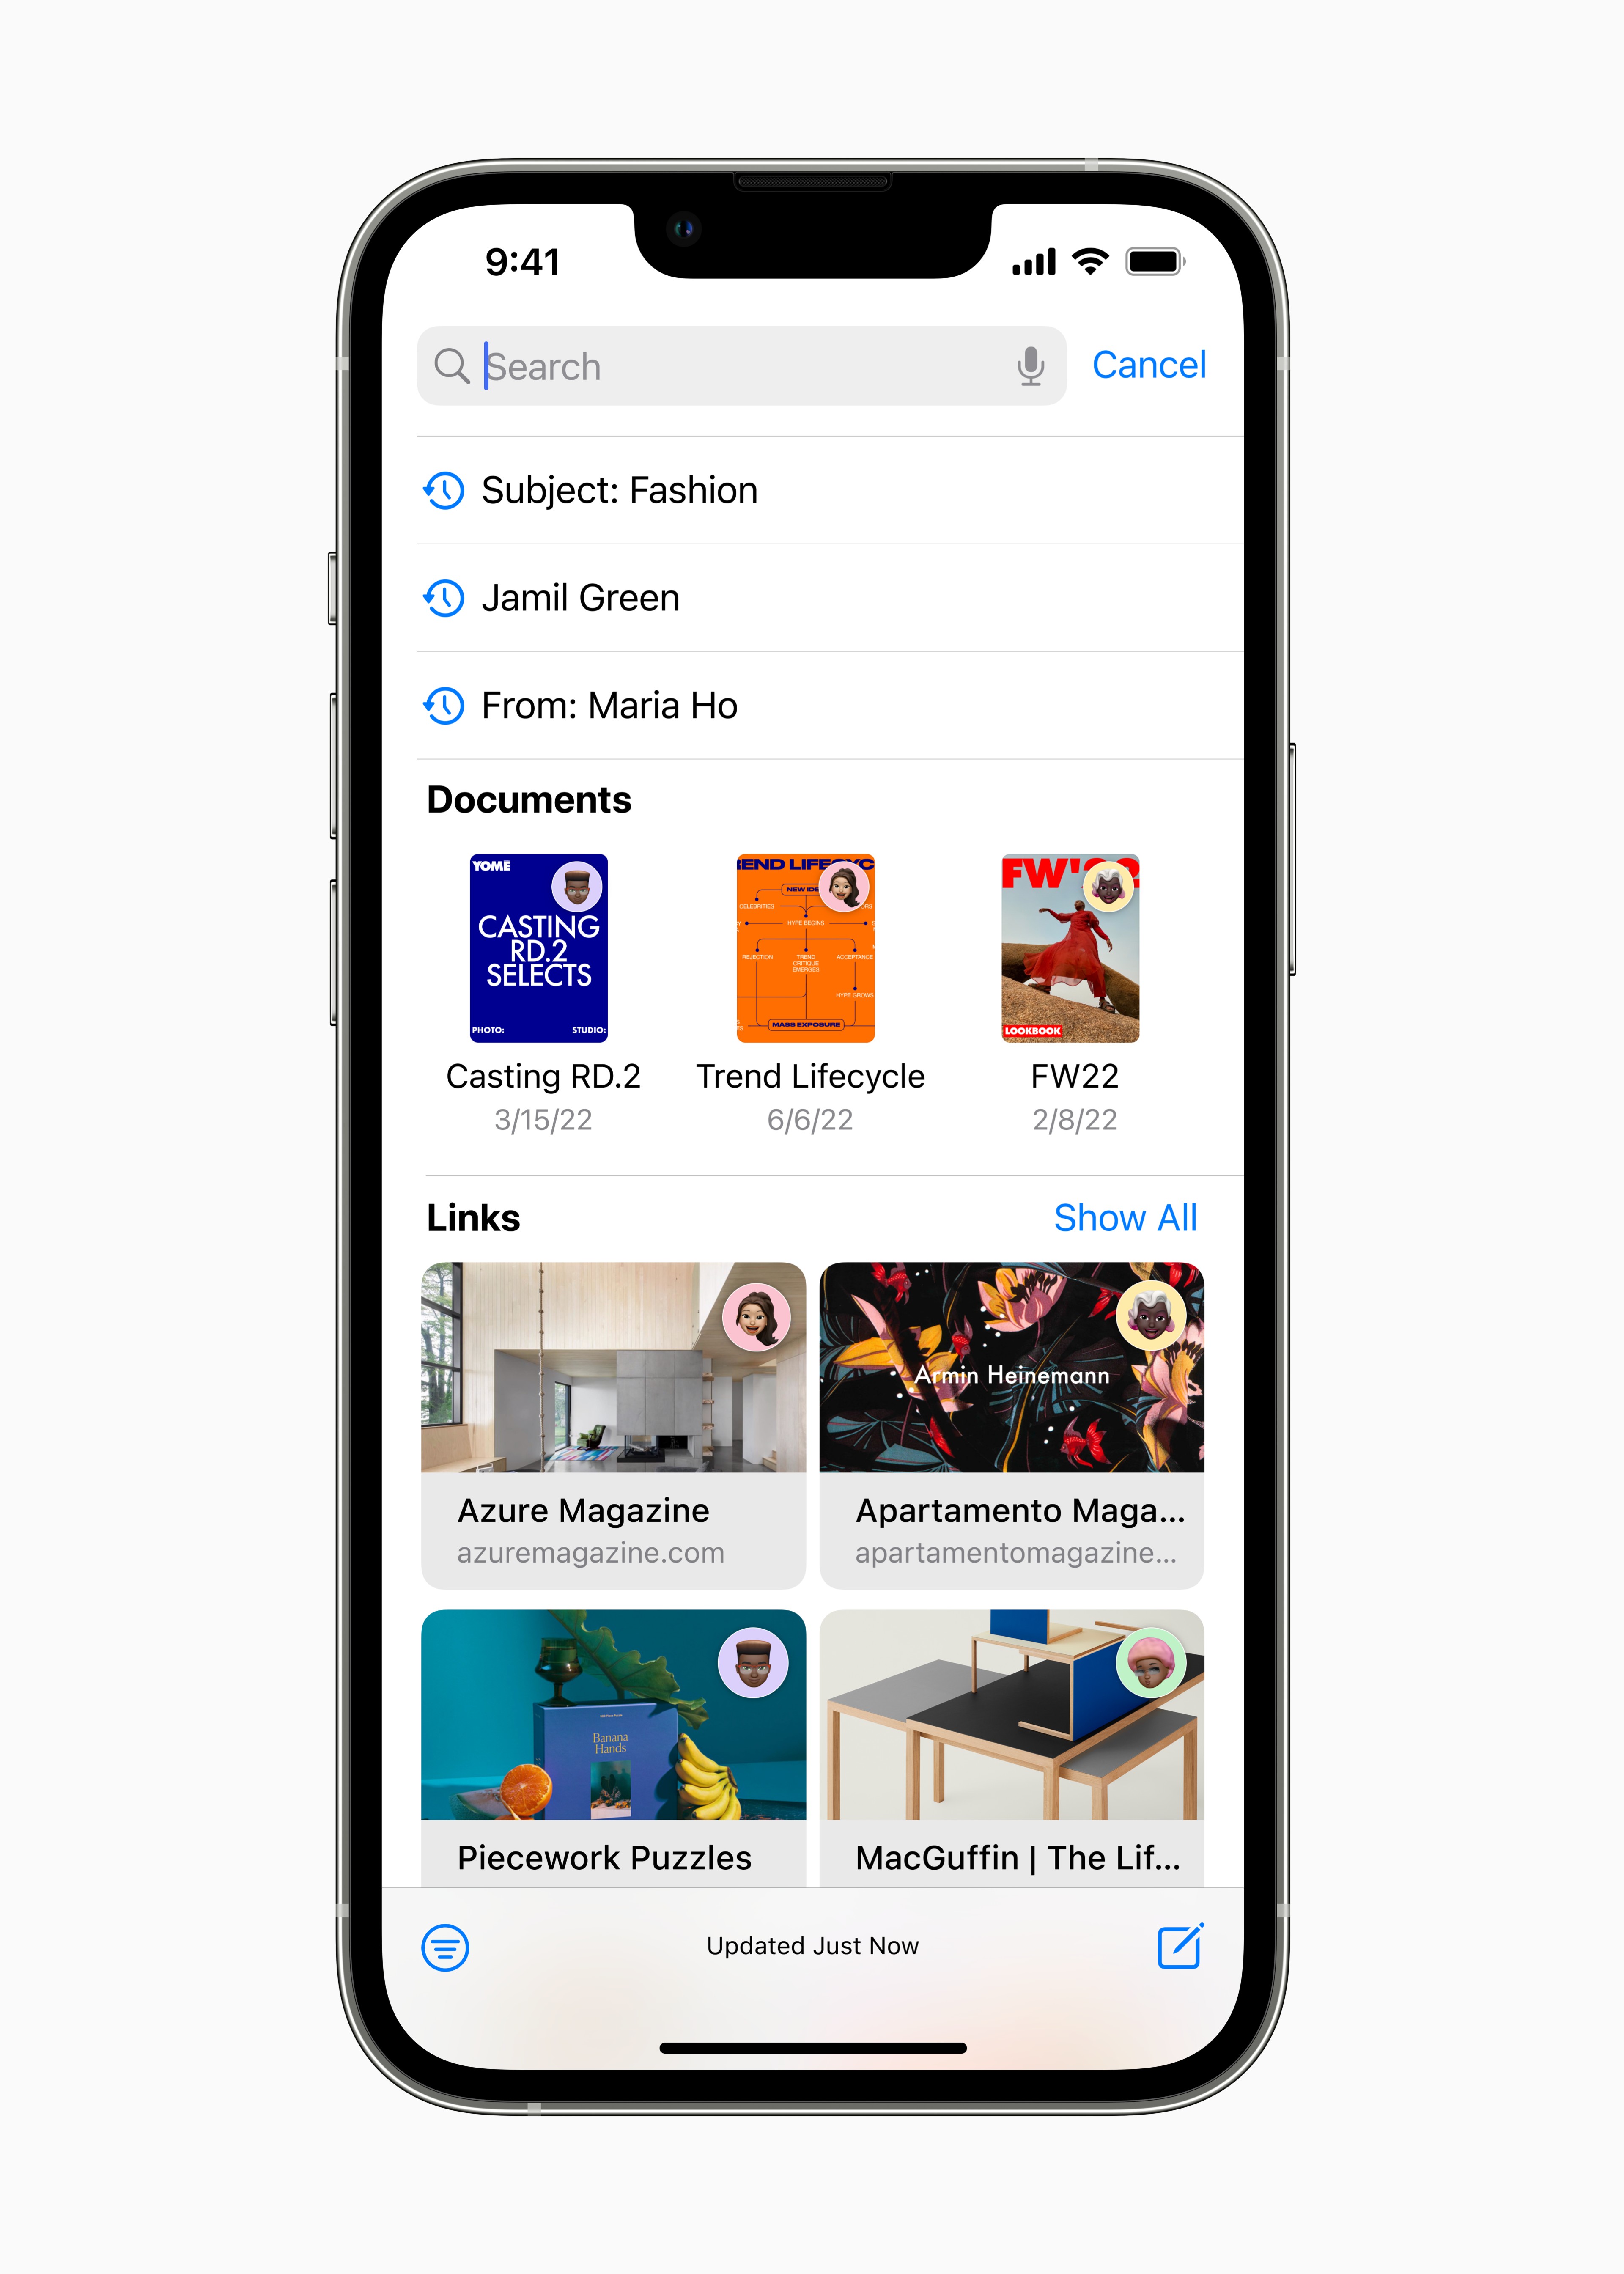
With the Mail app, you can now schedule your emails ahead of time, just so that you have a lot more control over your working time. Just in case, the Mail app gives you time to cancel the delivery of emails before it hits the recipient’s inbox. With Remind Later and Follow Up features, Mail can remind users to follow up on emails they might have missed after a while. Search is also now better on the Mail app than ever. Apple claims that the Mail app’s search algorithm is much more accurate and relevant compared to its predecessors to help you find older emails.

More Intelligent, Even On-the-Go

photo6123087016095756438
Apple WWDC22 iOS16 Live Text translate 01 220606
Apple WWDC22 iOS16 CarPlay 220606
Apple WWDC22 iOS16 Door Detection Accessibility 220606
Apple WWDC22 iOS16 Apple Pay Pay Later summary 220606
Apple WWDC22 iOS16 Apple Pay Order Tracking dashboard 220606
Apple WWDC22 iOS16 Apple Pay Order Tracking 220606
Apple WWDC22 iOS16 Apple Pay Later 220606
6 / 8

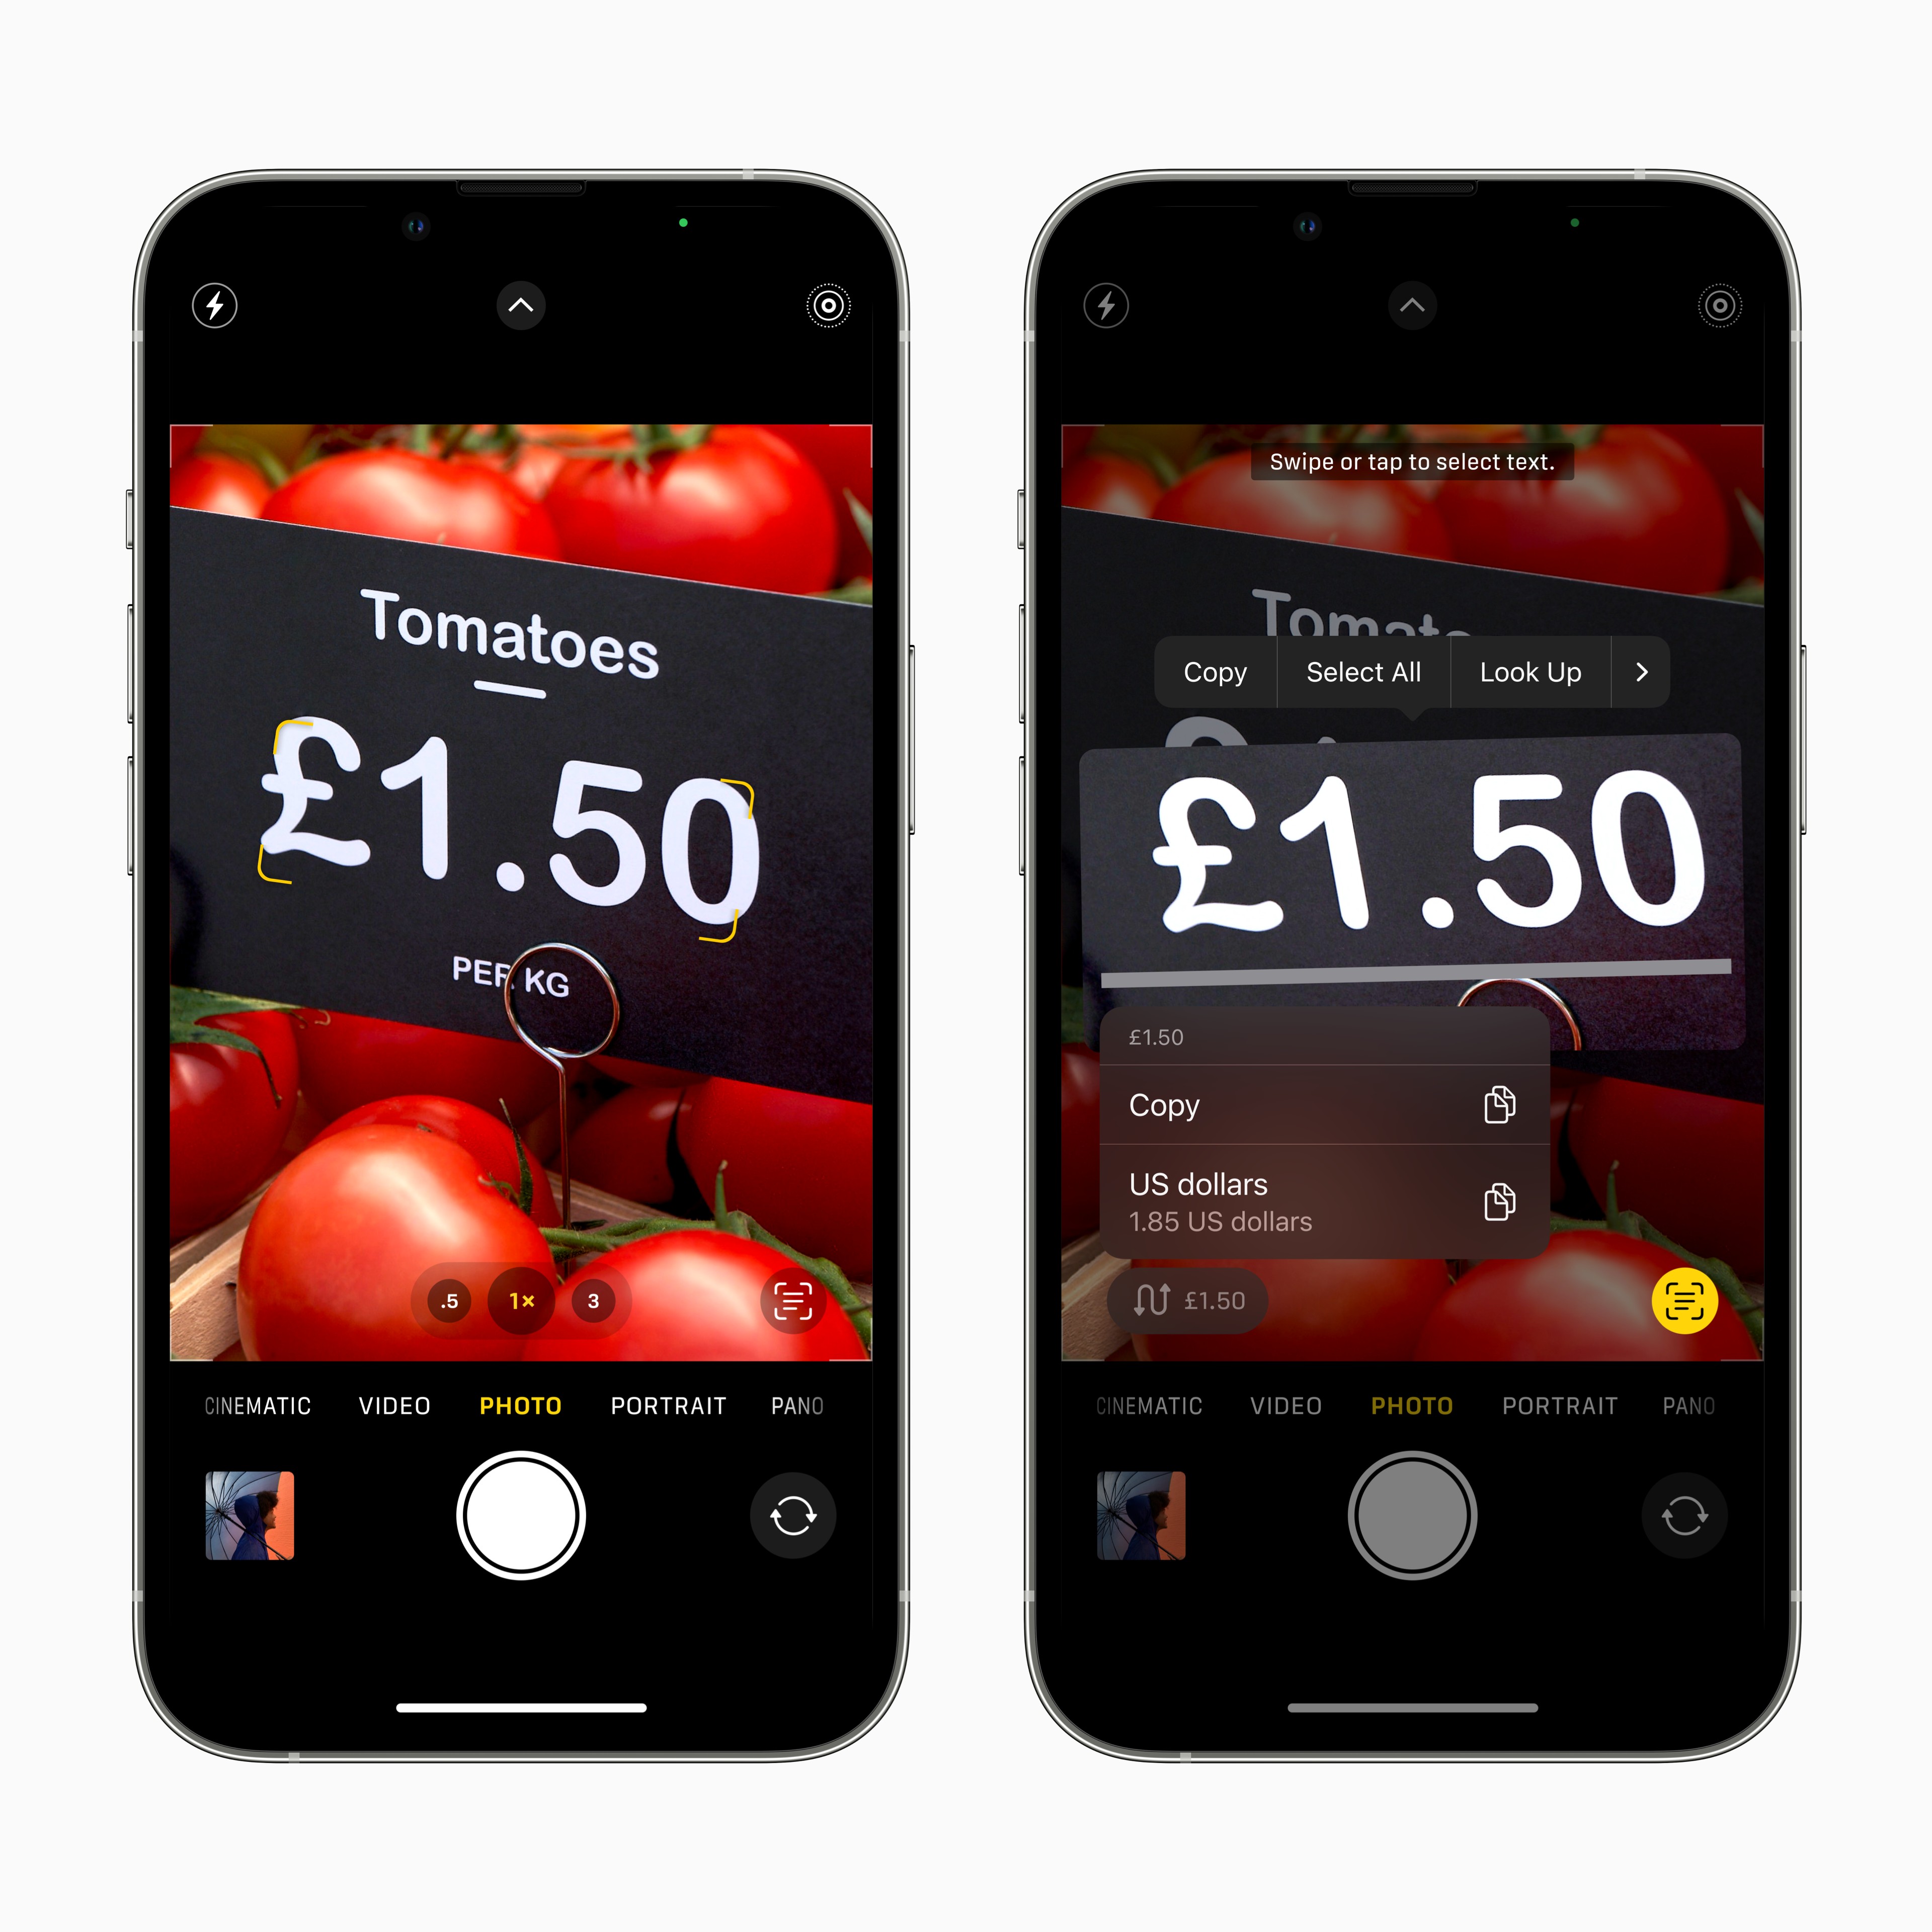
Live text is now cleverer than before. You can use the feature in videos now by just pausing the video and interact with texts within the image or frame. You can even use Live texts as your personal translator or currency converter.

Beyond that though, Visual Look Up is also now improved. Instead of just recognizing a subject, users can now duplicate the subject and place it in other messenger apps. It also now recognizes birds, insects, and statues.

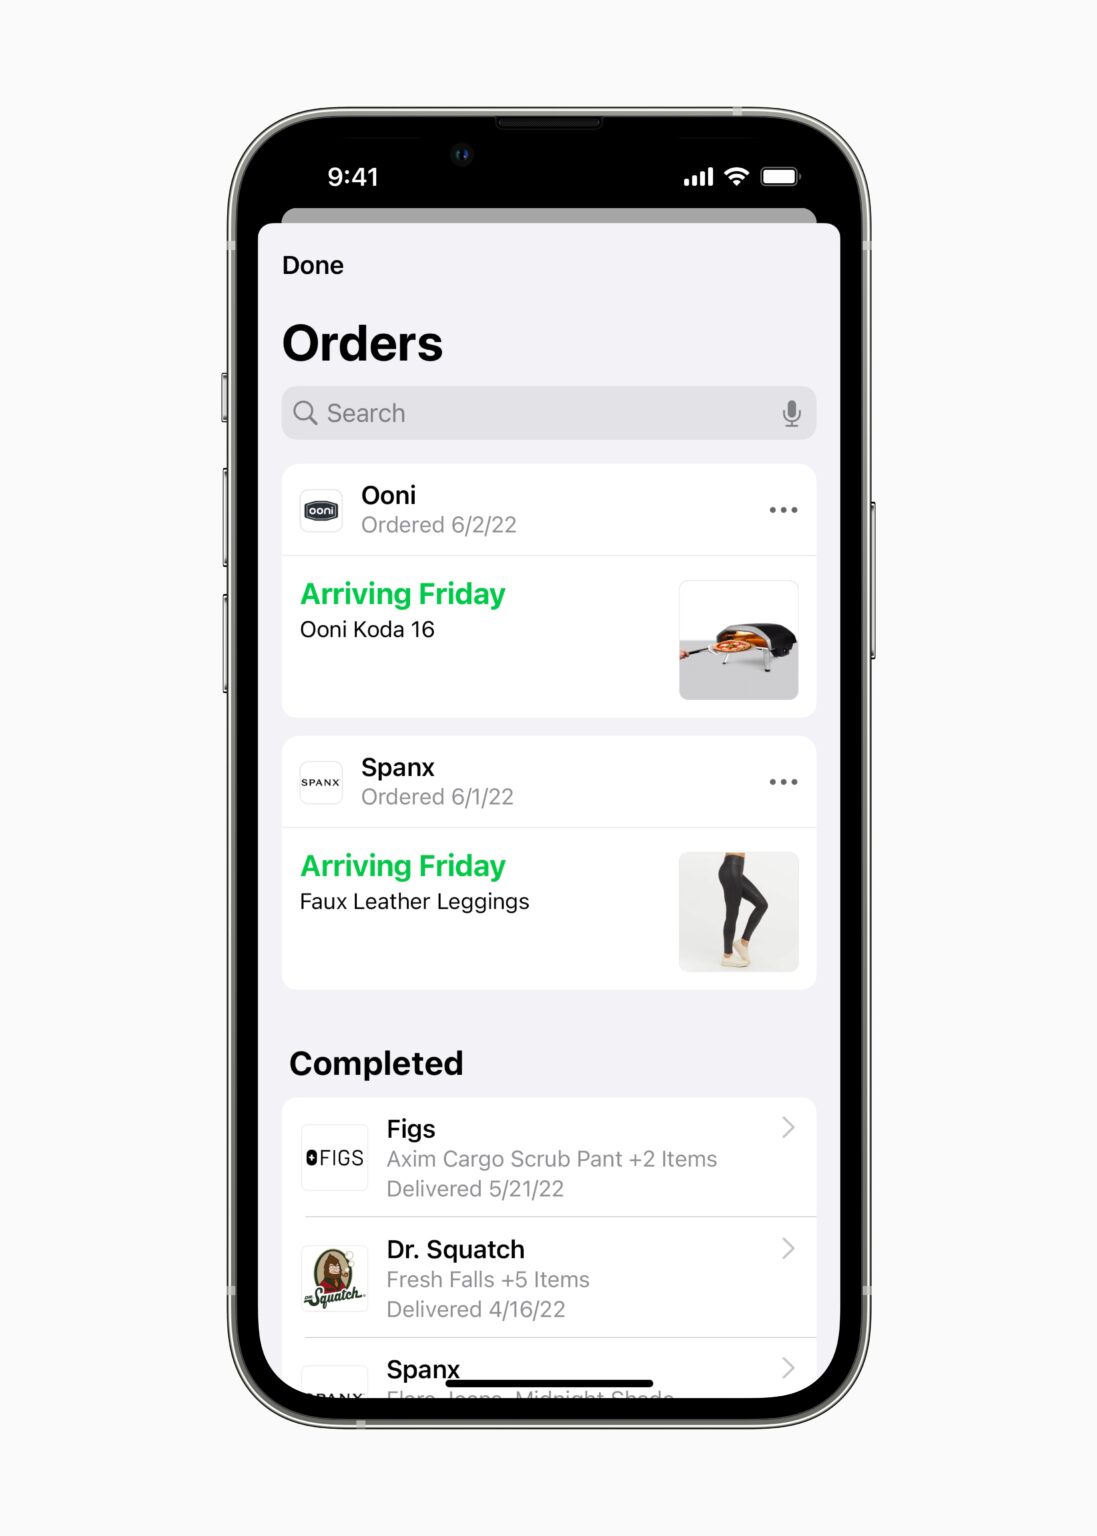
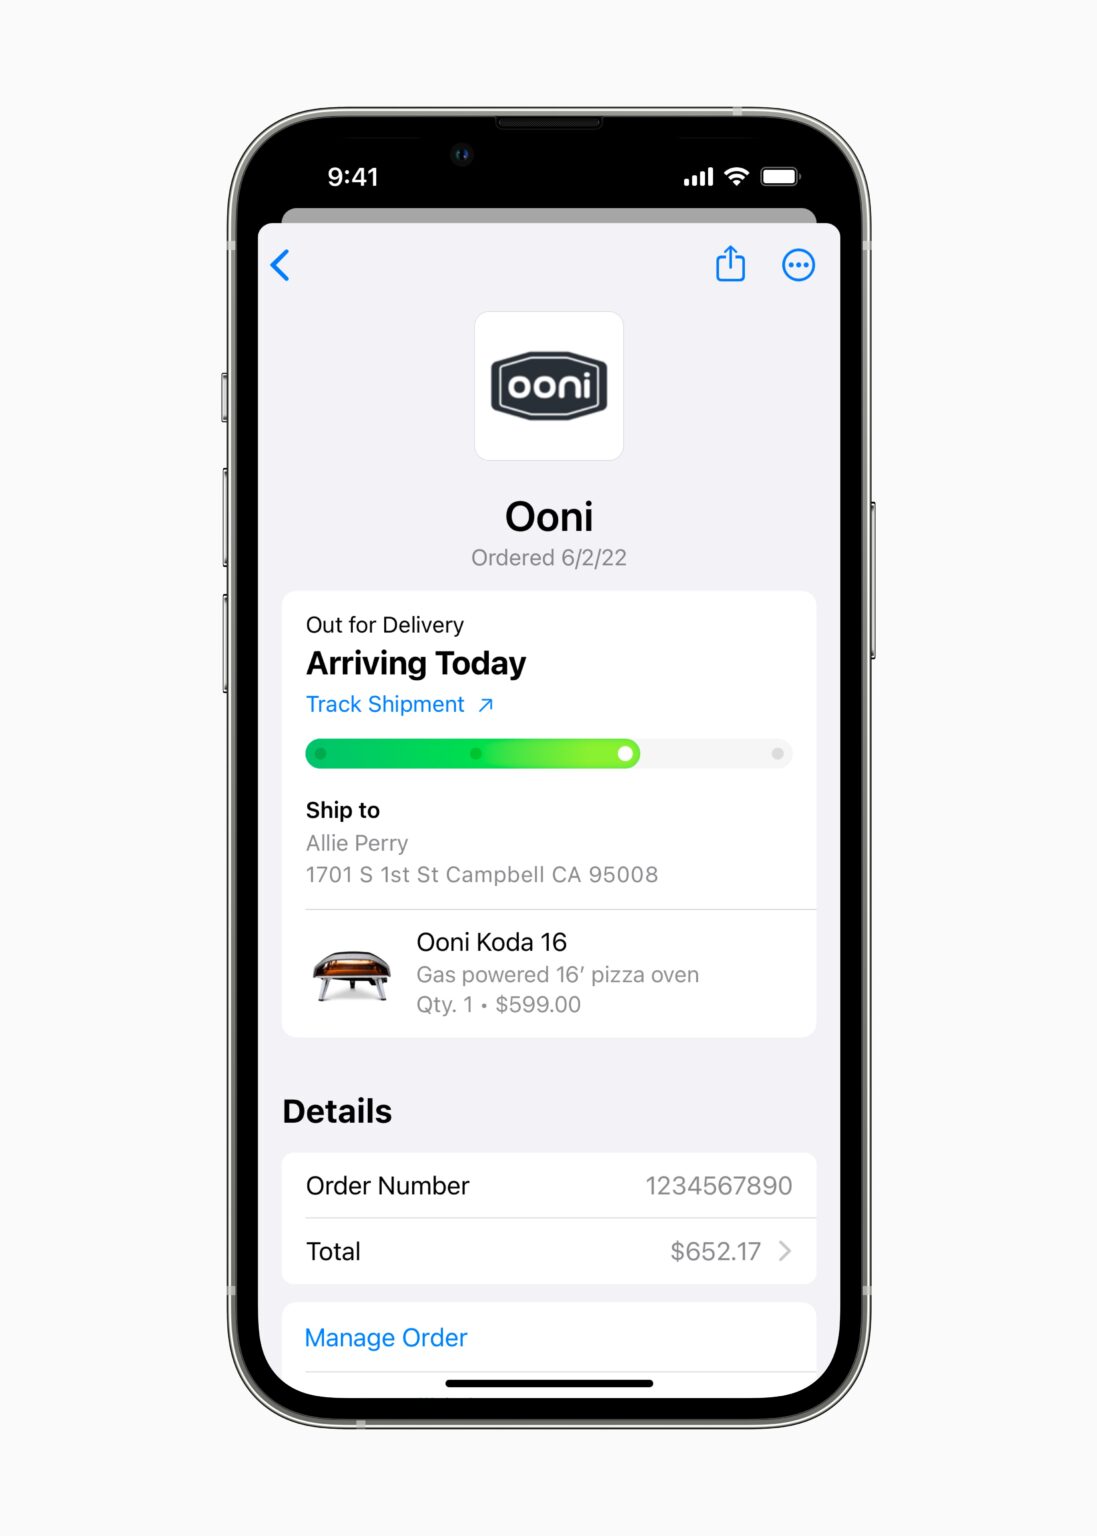
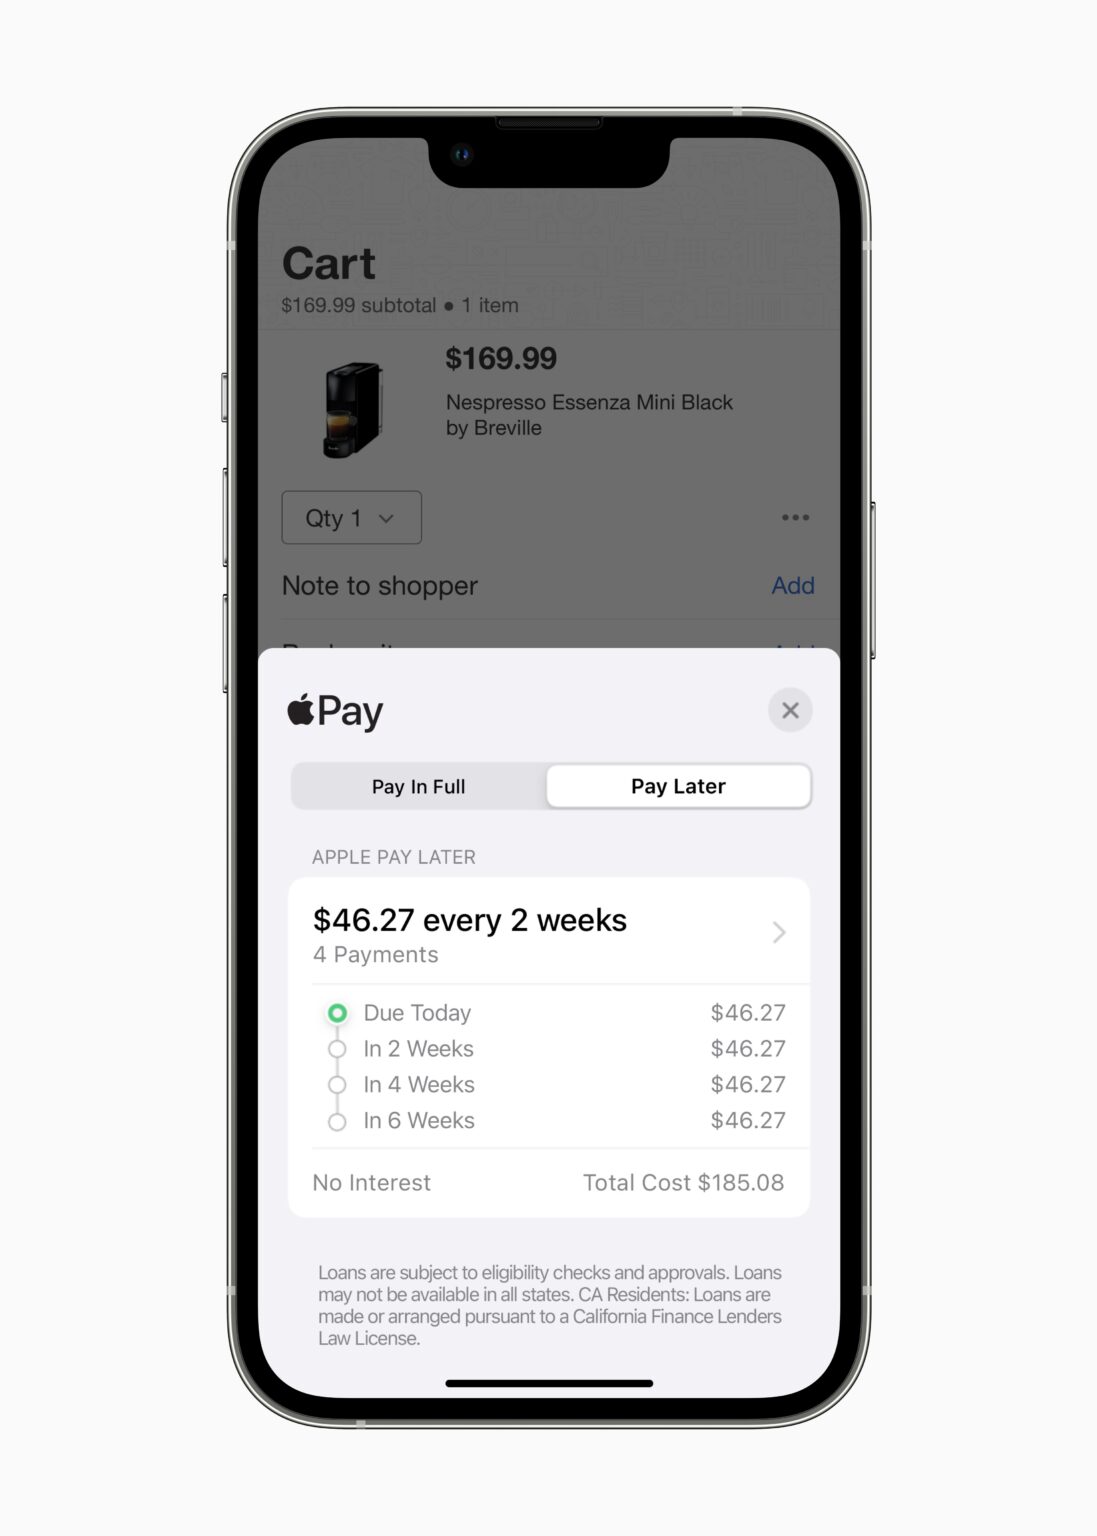
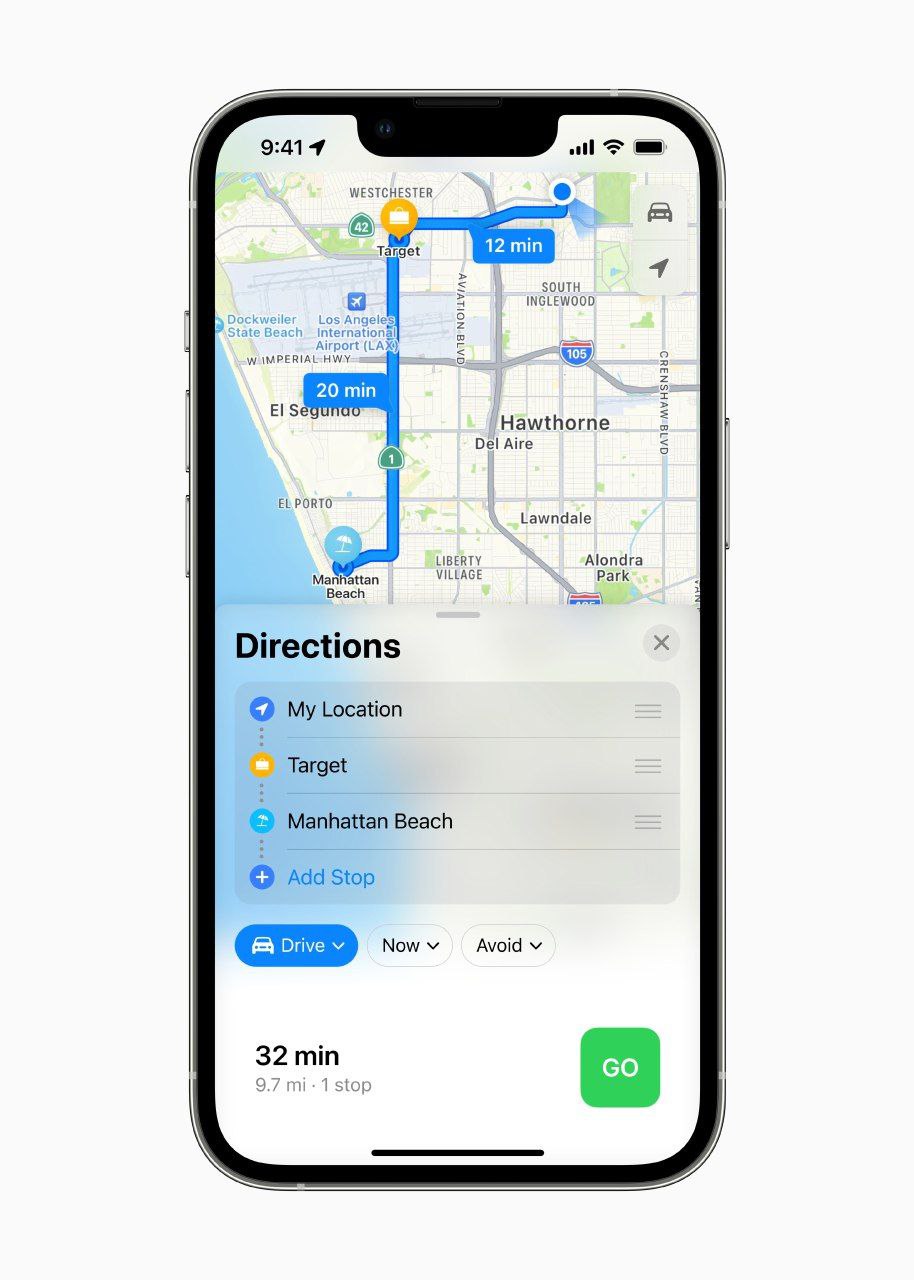
Apple’s Pay app is also improved at least in the United States (U.S.). They just introduced their very own microfinancing service in Apple Pay Later. If you have used Grab’s Pay Later wallet, it works very similarly there. The Pay Later feature also allows you to pay for your items in monthly instalments with no additional charges for now.

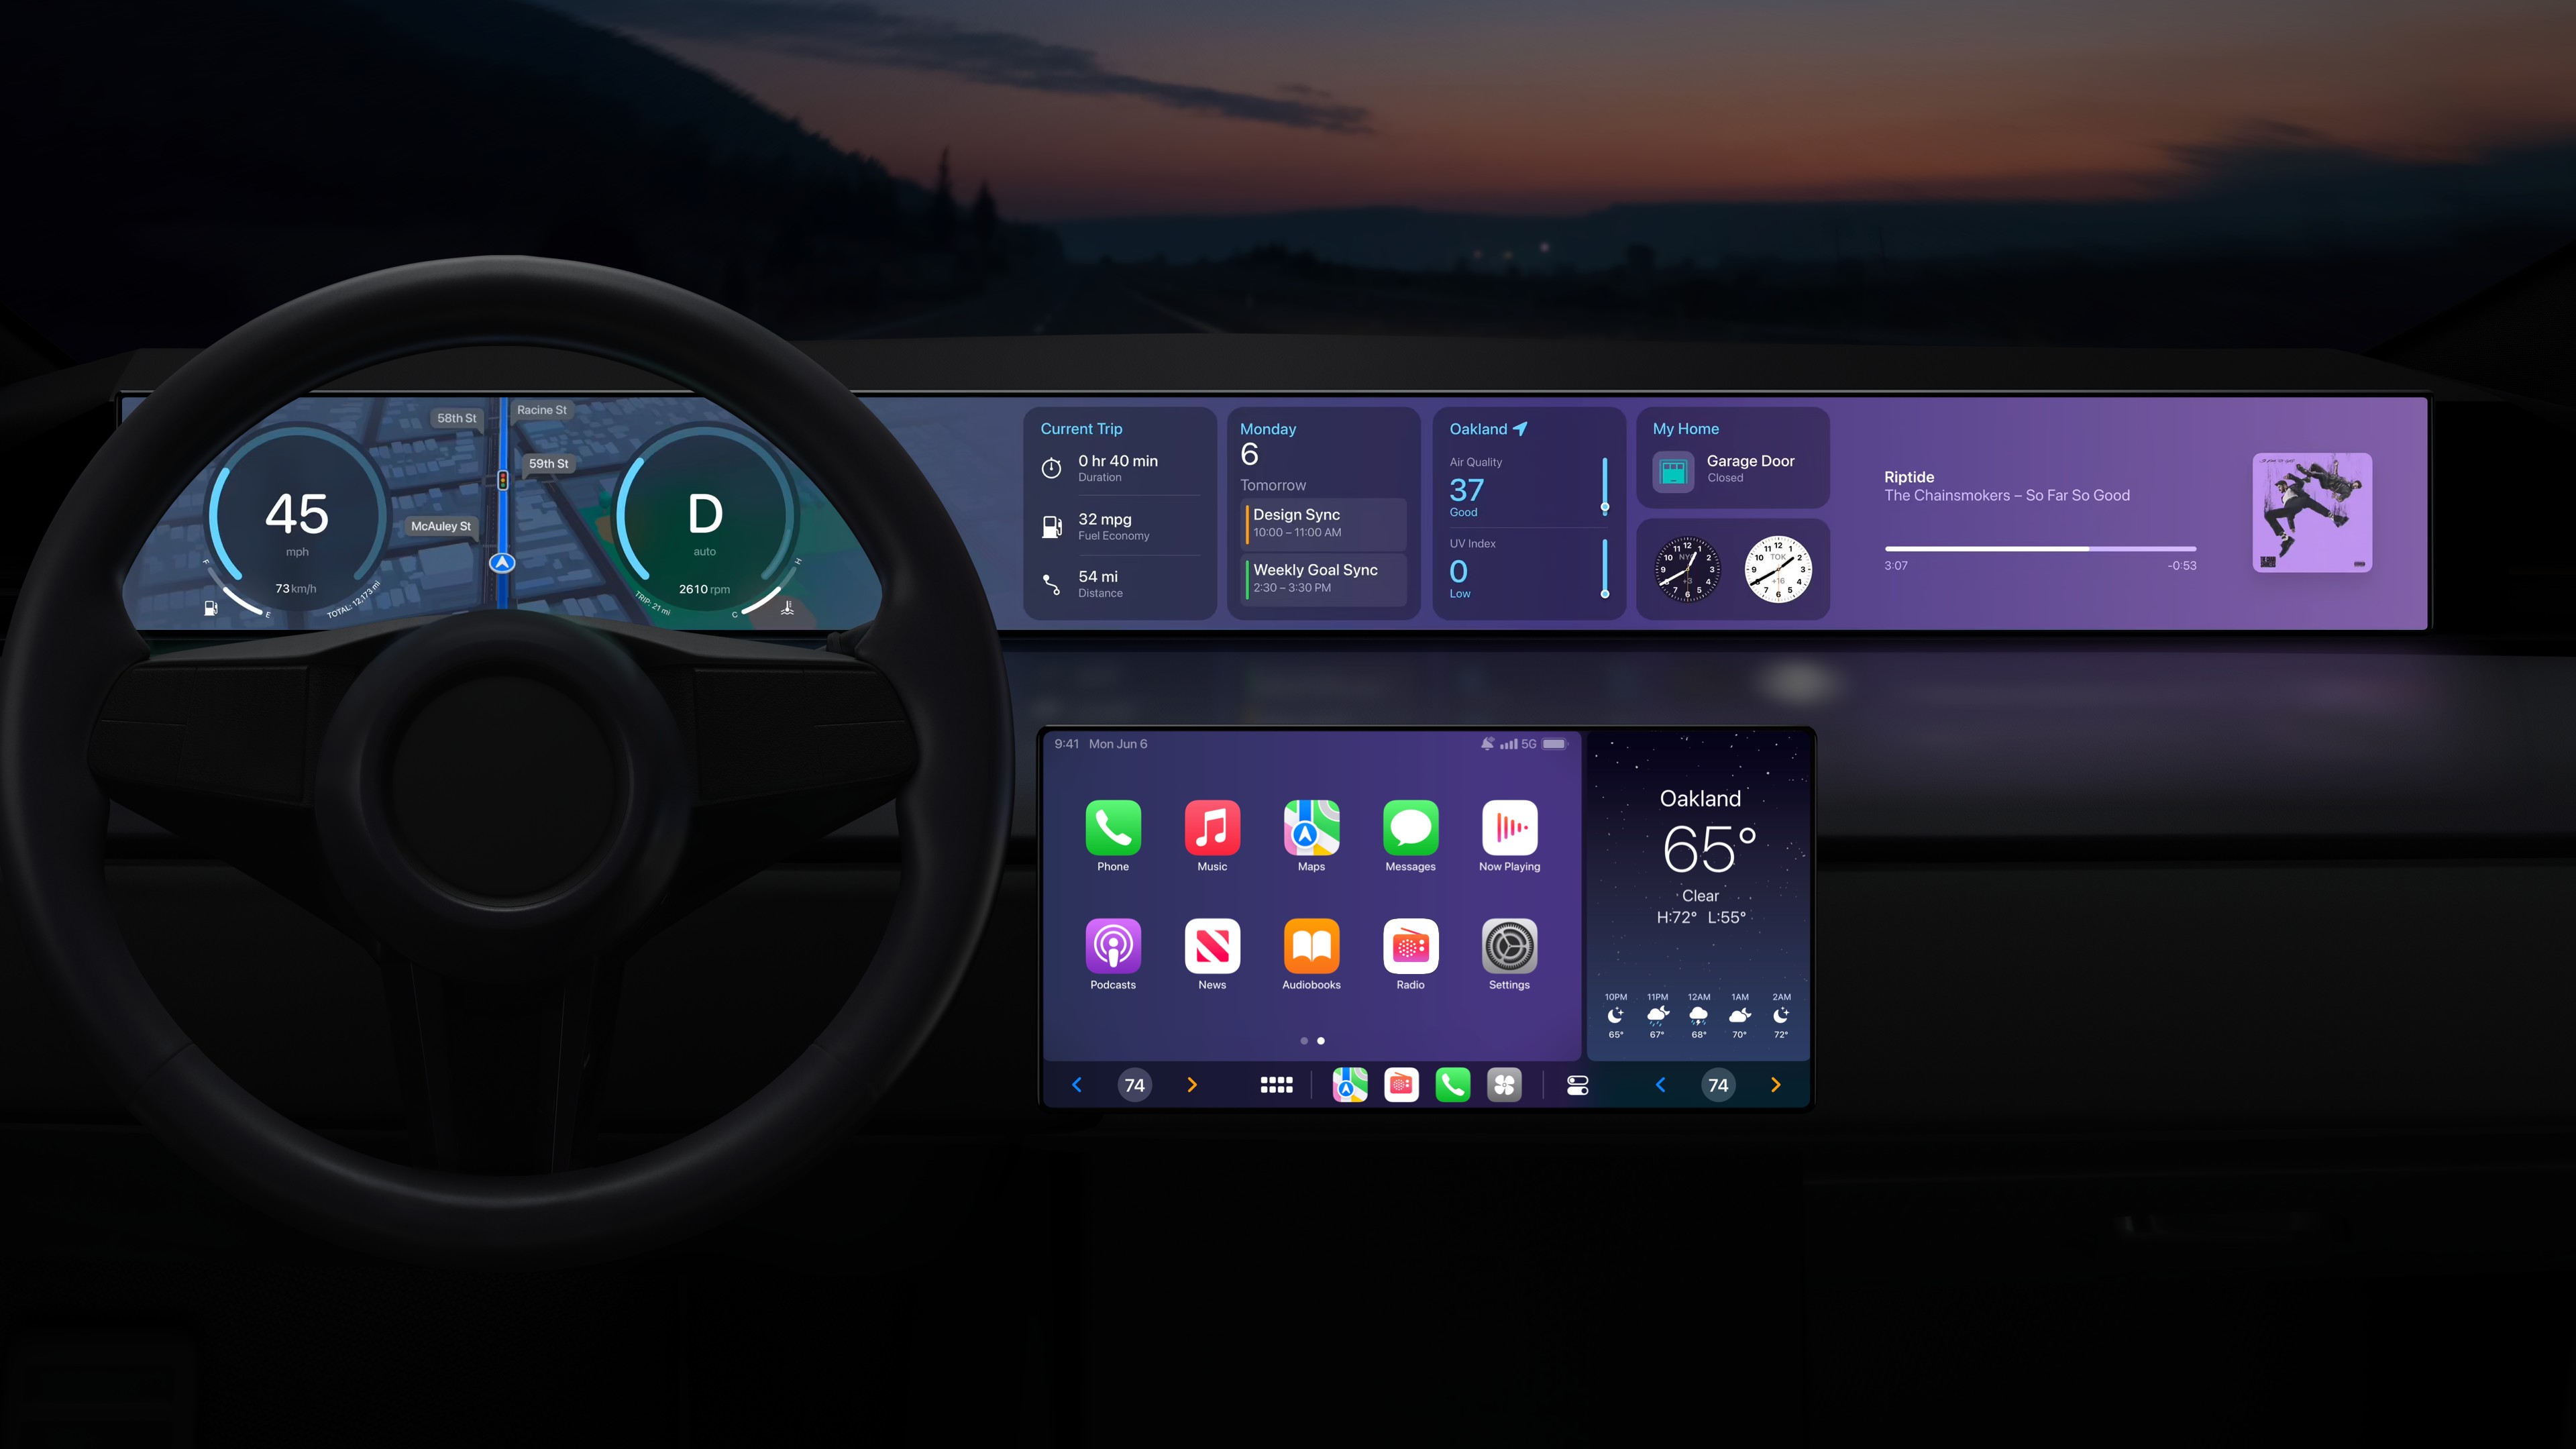
CarPlay is also improved with new features that makes it a powerful and versatile interface for in-car infotainment systems. CarPlay can now provide for multiple screens in a car to ensure that the CarPlay experience is consistent throughout a vehicle. There is more integration as well with CarPlay. Other than climate controls, CarPlay can also provide readings from multiple sensors in the car like fuel level, engine temperature, and even speed. Users can completely change what they see on their dash as well, if they choose to do so.

And more …

photo6123087016095756439
photo6123087016095756440
Apple WWDC22 iOS16 Live Text convert currency 220606
Apple WWDC22 iOS16 Fitness app 220606
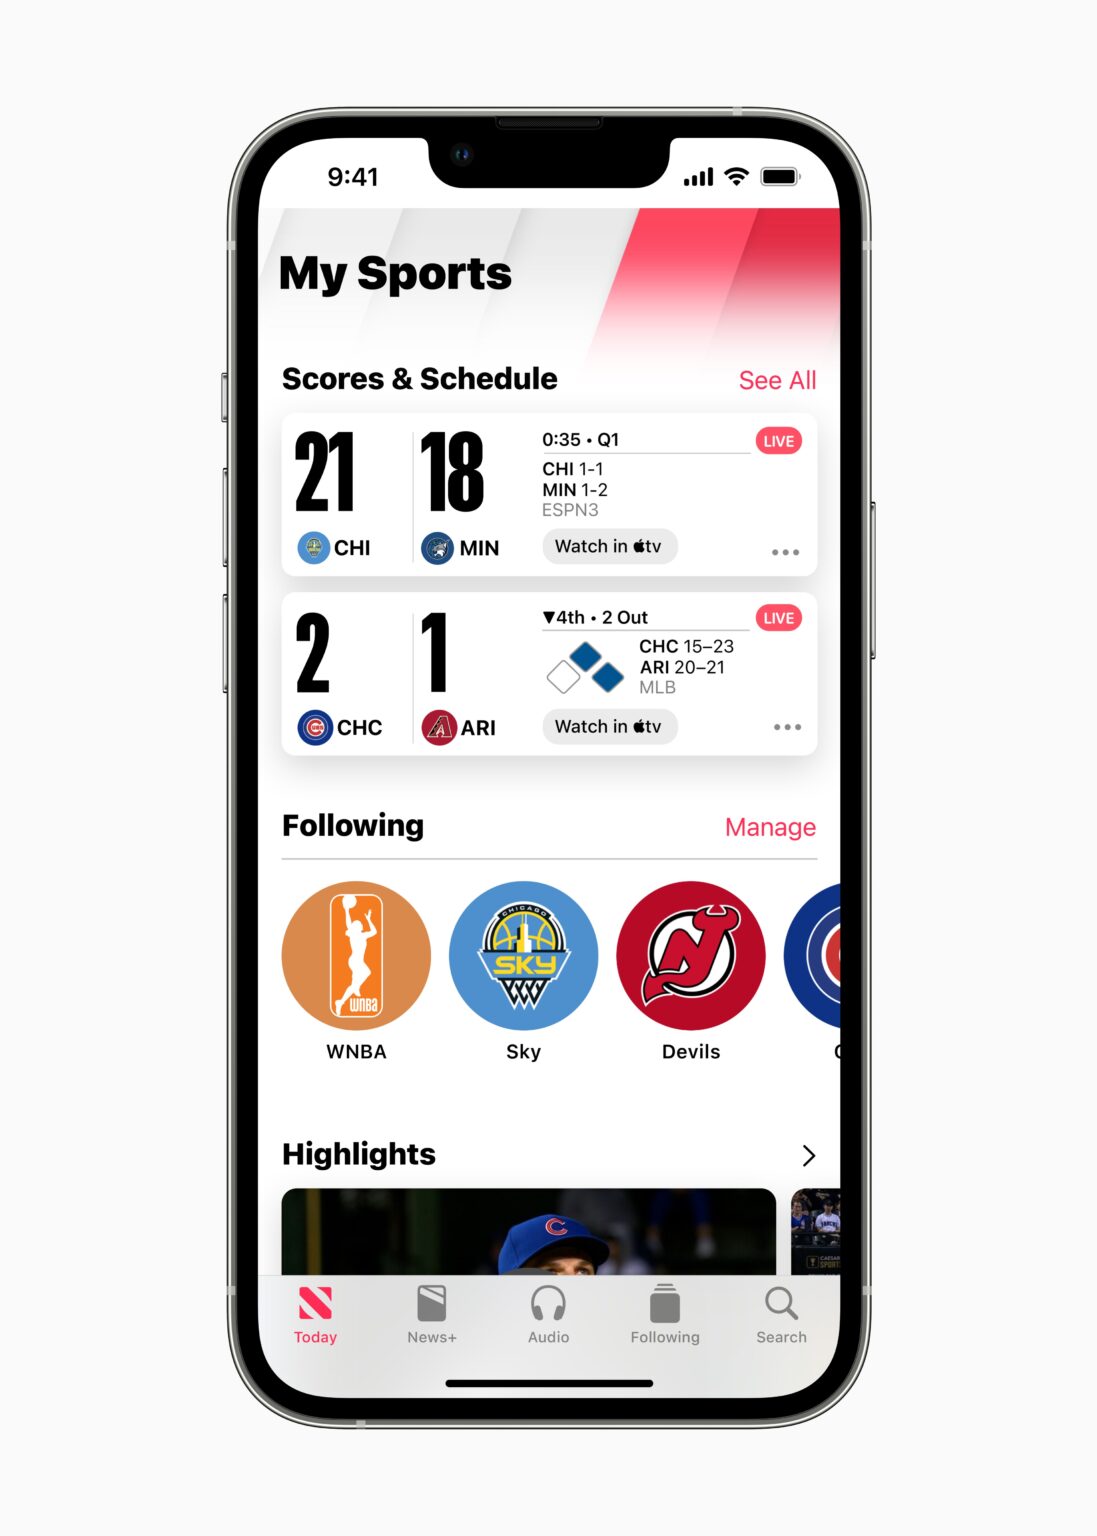
Apple WWDC22 iOS16 Apple News My Sports 220606

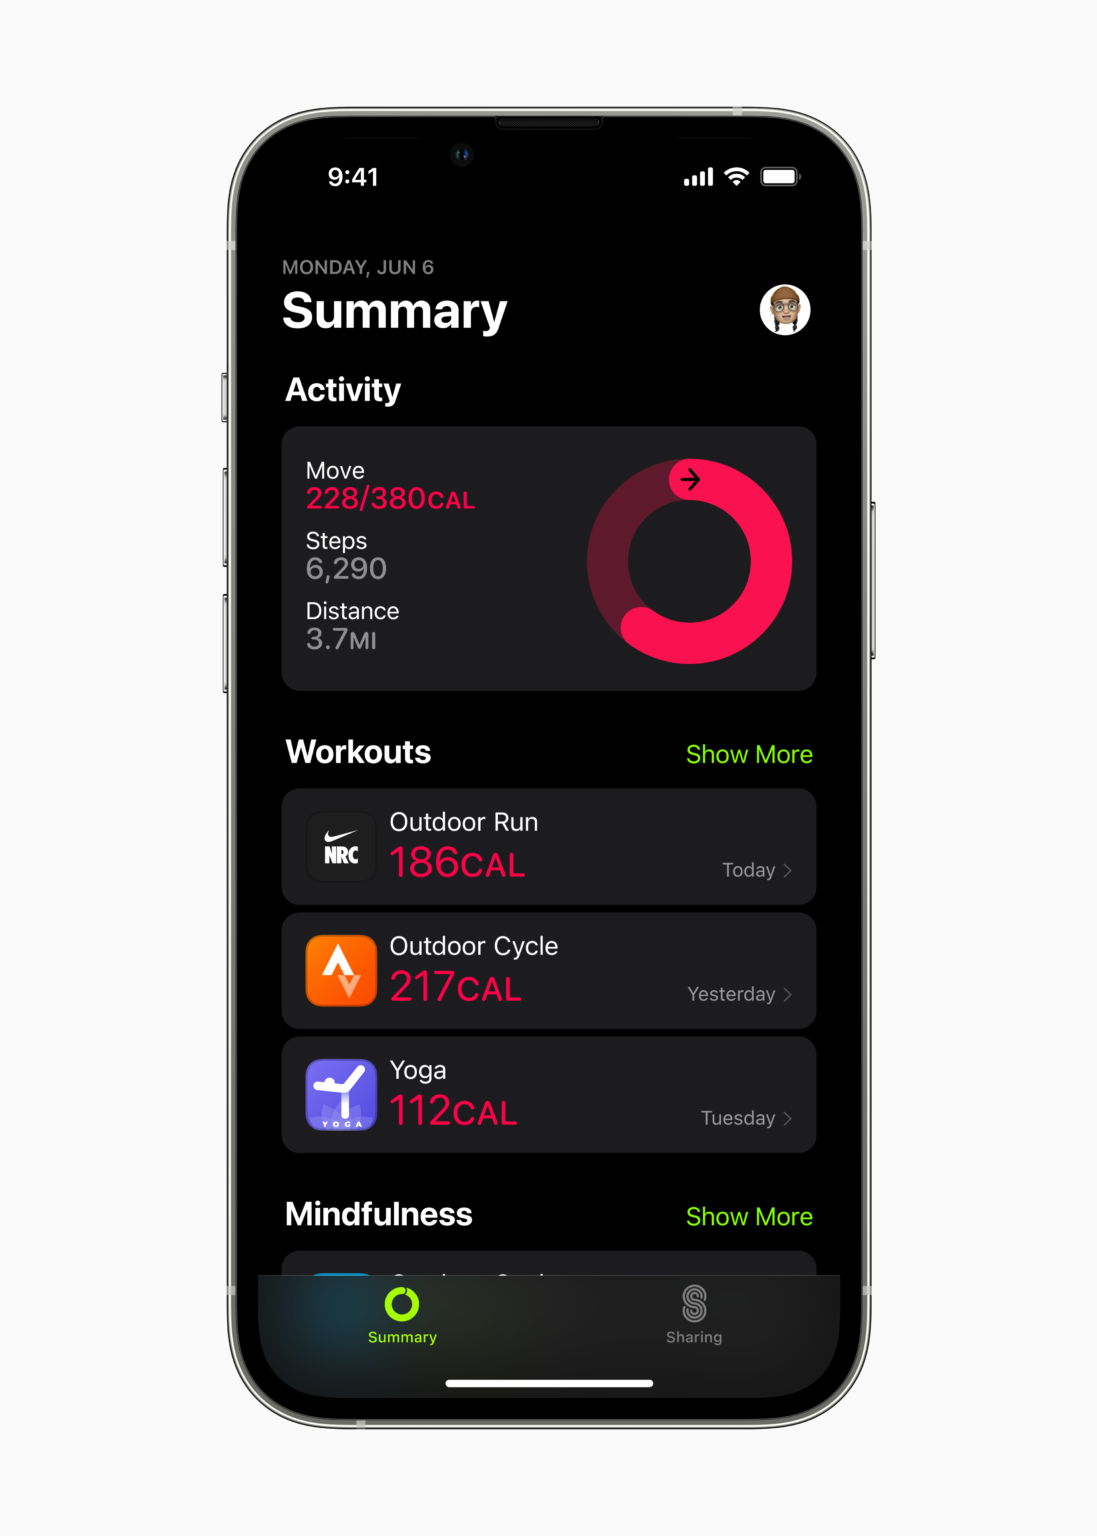
There are plenty of minor updates and improvements done on Safari, Apple maps, Siri, and even the Fitness app. For example, the Fitness App no longer requires users to own an Apple Watch to track their fitness goals. Apple News also now has My Sports section to allow users to easily follow their favourite sports teams in their favourite games. Spatial Audio is also improved on the iOS 16 to allow for a more precise and immersive audio with TrueDepth camera for a more personally tuned experience.

Availability

Apple’s iOS 16 is now available as a preview for members of Apple’s Developer Program. You can find it on their developer website. A public beta of the iOS will be available in the coming month. iOS 16 and its features will be available for iPhone 8 and later. For more information on iOS 16, you can visit their microsite for it.

CERC Chooses Vermiculus’ Clearing Solution to Revolutionize the Receivables Market

STOCKHOLM, June 7, 2022 /PRNewswire/ — Vermiculus has been chosen to deliver a real-time clearing solution to CERC, the main financial market infrastructure specialized in receivables in Brazil. In this cooperation, Vermiculus will provide a solution based on its modern clearing system, VeriClearTM, which is an elastically scalable and AI-powered real-time clearing system.  

CERC has the mission to make the market of receivables more efficient and reliable and aims to achieve this by efficiently connecting stakeholders of multiple economic sectors. Attaining this demands a system with immense architectural integrity and flexibility that can adapt to the vast, diverse, and always changing requirements. It also seeks to maintain its cloud integration and therefore requires the most modern architectural solution. Furthermore, with CERC’s rapidly increasing business, the need for a multi-functional and greatly advanced settlement clearing system is paramount.

“Vermiculus’ VeriClearTM perfectly matches our ambition to modernize and streamline our industry in a powerful way that has never been done before.” 

Marcelo Maziero, Co-Founder of CERC

CERC began its operations by pioneering the registry of trade invoices, which was later extended to include receivables from credit and debit cards, among other assets, making it a reference in this sector that moves trillions of Brazilian reais. Aware of this financial potential and the importance of receivables as collateral for credit transactions, CERC is expanding its services and is waiting for authorization from the Brazilian Central Bank (BCB) and Brazilian Securities and Exchange Commission (CVM) to operate a Settlement System and a Central Securities Depository, which will allow it to offer more services to further enhance credit transactions in Brazil.

The Vermiculus and CERC partnership is the beginning of a long and rewarding relationship between both companies. “We are excited to work together with the highly experienced and professional team at Vermiculus to develop a solution that supports our core objective of decentralizing data to reduce information asymmetry and help democratize the supply of credit so that more companies can benefit.” says Marcelo Maziero, co-founder of CERC. “In order for us to meet our uniquely advancing business initiatives, extreme flexibility and performance are key, which Vermiculus already delivers.”

Vermiculus’ multi-asset microservices-based clearing solution, VeriClearTM, provides comprehensive and flexible multi-currency settlement capabilities for clearing houses. The system allows for monitoring and managing receivables and risk in real-time across multiple markets as well as provides an in-depth overview of the transaction chain. The clearing system is optimized for being able to quickly adopt new business initiatives and product developments, with unparalleled scalability, adaptability, and customization. This is powered by intelligent APIs and AI functions which are presented with superior usability through its dynamic GUI dashboard. The analytical dashboard enables efficient drill-down possibilities and error handling through its algorithmic abilities and has the capacity to gather business intelligence.

Taraneh Derayati, CEO of Vermiculus says “Founded in 2015, CERC has built their business into one of the fastest growing marketplaces in Brazil with a uniquely diverse set of offerings. CERC’s innovative nature and execution power for diverse growth make them a fantastic client for Vermiculus as we value innovation and progressive ambition. With this collaboration, we will continue to deliver our mission-critical technology with uniquely flexible solutions based on our pioneering microservices and AI architecture.”

Derayati adds, “By working with such a forward-thinking client, we are set to deliver a powerful and modern product that is made-to-measure, fully adaptable, and of the highest performance.”

About CERC

Headquartered in São Paulo and founded in 2015 with employees throughout Brazil and the USA, CERC is a financial market infrastructure (FMI) operating in several economic sectors with several types of receivables. The company provides solutions that add transparency and security for analyzing, registering, and controlling property and settlement of financial assets, so that these assets can be more easily used as collateral for credit transactions.

CERC is the first cloud-native FMI specialized in receivables with an outstanding role in clearing (settlement registration and control) credit card receivables. It is Brazil’s largest FMI by volume of processed transactions. One of CERC’s main objectives is to centralize data from thousands of companies’ financial assets to reduce the information asymmetry that restricts market growth and supply more credit to businesses.

About Vermiculus Financial Technology 

Vermiculus Financial Technology provides cutting-edge trading, clearing and CSD solutions to market participants around the world. Vermiculus solutions are the first to bring together state-of-the-art advances in dynamic microservices architecture with vast experience in clearing house and exchange business requirements.  

Vermiculus solutions radically improve robustness, quality, and flexibility by utilizing AI-driven microservices, and can achieve superior environmental performance, elastic scalability, and cost-efficiency through SaaS and cloud-based deployment. 

The company started its operation in 2020 and is founded by industry experts with the incentive to revolutionize the technology of exchanges, clearing houses and CSDs.  With its headquarters in Stockholm, Sweden, Vermiculus consists of hand-picked industry experts, trained to deliver mission-critical solutions. With decades of accumulated knowledge and expertise, the team has previously completed 75+ projects for the world’s largest exchanges, clearing houses and CSDs.  

For more information about Vermiculus and its product and service offerings, visit www.vermiculus.se or get in touch through info@vermiculus.se

For further information, please contact:
Taraneh Derayati – CEO
Vermiculus Financial Technology
Tel +46-(0)73 634 56 26
taraneh.derayati@vermiculus.se

This information was brought to you by Cision http://news.cision.com

https://news.cision.com/vermiculusft/r/cerc-chooses-vermiculus–clearing-colution-to-revolutionize-the-receivables-market,c3581007

Samsung’s 2022 Neo QLED TVs Make Malaysian Debut

Samsung’s 2022 Neo QLED TVs are finally making their way to Malaysia after their announcement in January at CES 2022. The new lineup brings an extensive list of enhancements focused on enhancing the entertainment experience as well as adapting one of the most ubiquitous screens to your lifestyle.

Samsung Malaysia Neo QLED 2022 Launch 2
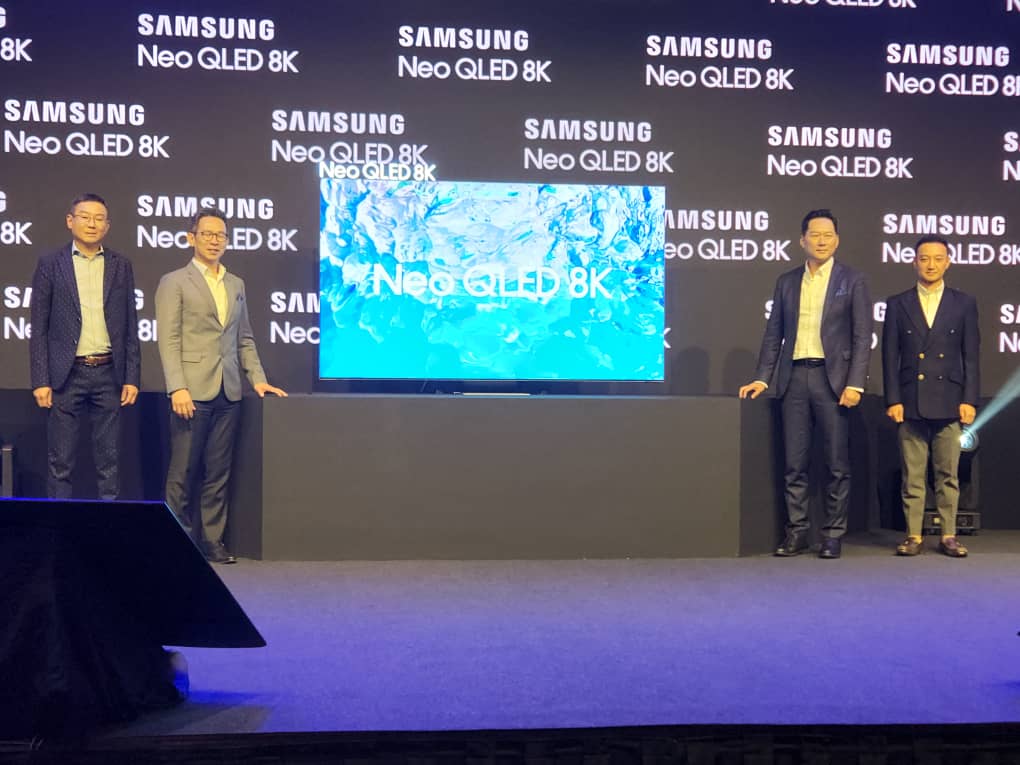
Calvert Yap (Head of TV, Audio Visual, Samsung Malaysia), Jimmy Tan (Head of Consumer Electronics, Samsung Malaysia), Edward Han (President, Samsung Malaysia) and Sunghwan Joo (Director of Audio Visual Division, Samsung Malaysia) at the launch gambit of the Neo QLED 8K TV

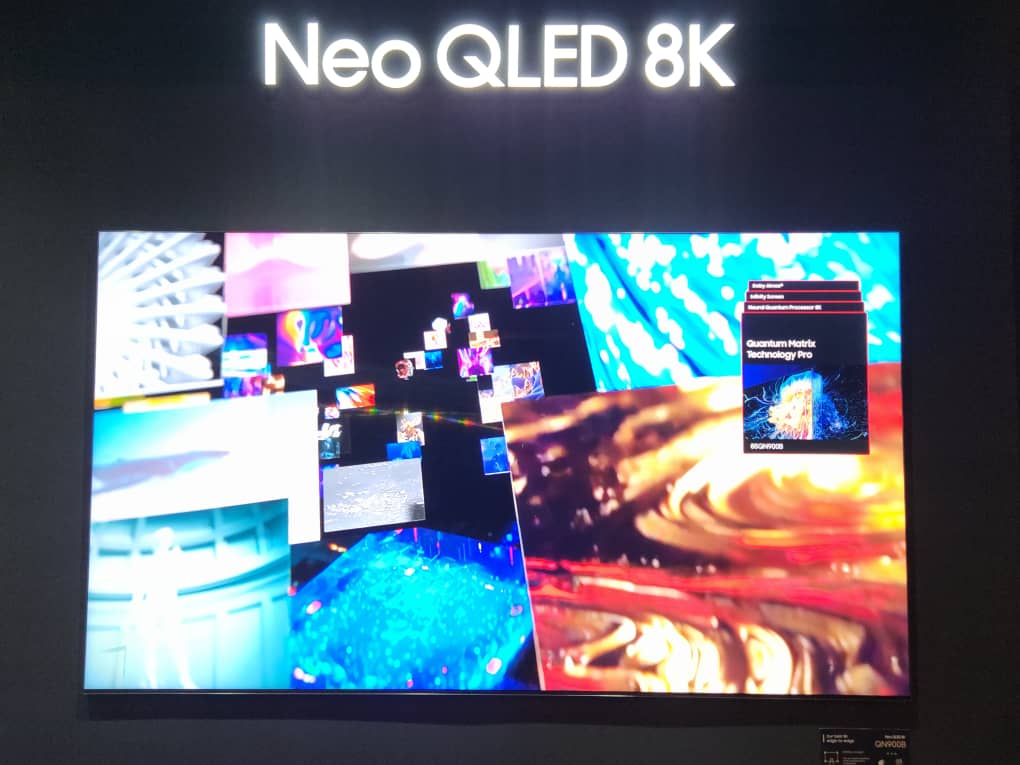
The new Neo QLED TVs come with a new Neo QLED 8K processor which ups the ante when it comes to image quality. The new Neural Quantum Processor 8K has been enhanced with a new algorithm called the Real Depth Enhancer. This dynamically scans the screen and maximizes the contrast between the object and the background of the scene making the object pop. It also adds a level of clarity and makes the image more realistic in a natural way. Samsung’s Neo QLED TVs are using also a lot more dynamic and reactive as the screens are able to create localised dark zones with the Mini LED technology. The increased precision allows for better, more realistic details and a more natural image as contrast and back-lighting is controlled on a per pixel basis. This year’s QLED TVs are also the first to be PANTONE verified for colour accuracy.

Together with the enhanced technology of the Neo QLED TVS, Samsung is also introducing features that will allow the TV to adapt to its users seamlessly. The TVs now come with features that will not only allow you to be more immersed in your content but also adapt to your work environment. The new line up of Samsung Neo QLED TVs come with features such as Google Duo which will allow you to take and make video calls from the TV with a webcam. In addition to that, DeX is also making its big screen debut and will allow you to use you screen as desktop for remote work. It will also bring a seamless second display experience that will help you get things done more efficiently.

Samsung Malaysia Neo QLED 2022 Launch 4
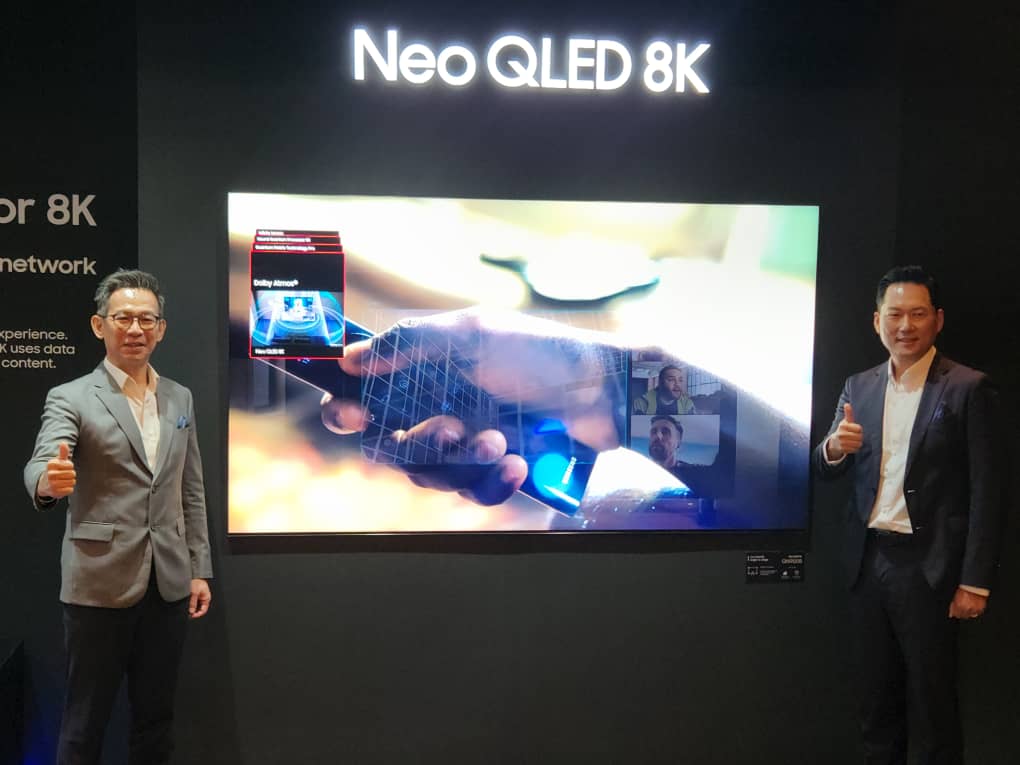
Jimmy Tan (Head of Consumer Electronics, Samsung Malaysia) and Edward Han (President, Samsung Malaysia) showcasing the Neo QLED 8K Flagship TV

With accessories like the webcam, the new Neo QLED TVs are here to help you get in better shape. Samsung is bringing even more features that will help you exercise and get fit with your TV. In fact, you’ll be able to get tips on how to improve your form straight from the TV as you workout. Of course, sometimes we prefer working out while watching our favourite shows, with Multiview, you’ll be able to watch up to 4 screens at the same time. So, you’ll be able to watch your stocks, Netflix, workout and be on the video call all at the same time.

There’s a whole lot of improvements that have been baked into the new 2022 Samsung QLED TV lineup – you’ll be able to get the full breakdown in our coverage of the CES announcement.

Pricing and Availability

Samsung’s Neo QLED TVs are already available in Malaysia together with the updated versions of their lifestyle TVs: The Frame, The Serif and The Sero.

ModelRRP (MYR)
85-inch Neo QLED 8K QN900B49,999
75-inch Neo QLED 8K QN900B34,999
65-inch Neo QLED 8K QN900B23,999
85-inch Neo QLED 8K QN800B33,999
75-inch Neo QLED 8K QN800B24,999
65-inch Neo QLED 8K QN800B18,999
55-inch Neo QLED 8K QN700B12,499

P.I. Works and VMware To Bolster O-RAN Adoption and Innovation

P.I. Works’ rApps to be interoperable with VMware’s Non-Real-Time RIC Platform to enable the automation and optimization of Open RAN networks

RESTON, VA, June 7, 2022 /PRNewswire/ — P.I. Works, the leading provider of AI-driven mobile network management solutions, has announced its rApps are now interoperable with VMware’s Non-Real-Time RIC (RAN Intelligent Controller) platform, which will allow for the efficient automation and optimization of both existing and Open RAN mobile network elements. The solution will enable operators to make the shift toward introducing O-RAN into their existing networks.

VMware – P.I. Works Partnership

With 5G technologies being widely deployed across the globe, O-RAN is poised to become the first choice of operators as they overhaul their current Radio Access Networks, especially given it is designed to accommodate multi-vendor equipment through open interfaces. As such, as RAN evolves from the current architecture to Open RAN, automated network management via a standardized Radio Intelligence Controller (RIC) will become essential for CSPs in abstracting the complexity of their heterogeneous networks and thus improving customer experience.

Lakshmi Mandyam, Vice President of Product Management and Partner Ecosystems, Service Provider & Edge, VMware said, “We are committed to delivering world-class network management solutions that not just meet, but exceed customer expectations. Our collaboration with P.I. Works adds advanced automation and optimization capabilities to RIC platform to help service providers make the most of their RAN modernization efforts.”

Djakhongir Siradjev, Chief Technology Officer at P.I. Works noted: “As a global provider of mobile network automated management solutions, P.I. Works has always seen the need for open and standardized network landscapes in order to achieve the interoperability and thus efficiency needed to maximize subscriber experiences. We believe that our collaboration with VMware will pave way for this within the O-RAN ecosystem and drive innovation to build a better, more sustainable future for the industry.”

About P.I. Works 
www.piworks.com

Media Contact:
marketing@piworks.net

Source: P.I. Works

Cisco Unveils Innovations Driving New Security Cloud Strategy

News Summary:

  • Cisco unveiled its new strategic vision of a unified platform for end-to-end security across hybrid multi-cloud environments
  • The company is designing the Cisco Security Cloud to be the most open security platform with no public cloud lock-in
  • Cisco is taking steps to realize its vision with innovations across the industry’s most complete portfolio, driving security resilience for its customers

SAN FRANCISCO, June 6, 2022 /PRNewswire/ — RSA Conference – Cisco, the leader in enterprise networking and security, unveiled its plan for a global, cloud-delivered, integrated platform that secures and connects organizations of any shape and size. The company is designing the Cisco Security Cloud to be the industry’s most open platform, protecting the integrity of the entire IT ecosystem – without public cloud lock-in.

At RSA Conference 2022, Cisco unveiled its strategic plan to provide security resilience for a hybrid multi-cloud future

“With the complexity of hybrid work, continued acceleration of cloud adoption, and the ever-advancing threat landscape, organizations are looking for a trusted partner to help them achieve security resilience. We believe Cisco is uniquely positioned due to its scale, breadth of solutions and cloud-neutral business model to meet their needs,” said Jeetu Patel, Executive Vice President and General Manager of Security and Collaboration at Cisco. “Cisco is already delivering upon key tenets of our cloud platform vision. We’re excited to increase our innovation velocity to truly deliver on the vision of the Cisco Security Cloud.”

The Security Cloud will provide an integrated experience for securely connecting people and devices everywhere to applications and data anywhere. With unified management, the open platform will provide threat prevention, detection, response, and remediation capabilities at scale. Cisco has been on the journey toward the Security Cloud for some time and is sharing additional progress with new innovations across its security portfolio.

Secure Access

Ushering in the next generation of zero trust, Cisco is building solutions that enable true continuous trusted access by constantly verifying user and device identity, device posture, vulnerabilities, and indicators of compromise. These intelligent checks take place in the background, leaving the user to work without security getting in the way. Cisco is introducing less intrusive methods for risk-based authentication, including the patent-pending Wi-Fi fingerprint as an effective location proxy without compromising user privacy.

To evaluate risk after a user logs in, Cisco is building session trust analysis using the open Shared Signals and Events standards to share information between vendors. Cisco unveiled the first integration of this technology with a demo of Cisco Secure Access by Duo and Box.

“The threat landscape today is evolving faster than ever before,” said Aaron Levie, CEO and Co-founder of Box. “We are excited to strengthen our relationship with Cisco and deliver customers with a powerful new tool that enables them to act on changes in risk dynamically and in near real-time. You can expect to see more innovation and execution from Box and Cisco that help businesses protect their content across any location, application, or device.”

Secure Edge

To radically simplify how organizations connect and protect users, things, and applications, anywhere, Cisco is excited to introduce Cisco+ Secure Connect Now, a unified Secure Access Service Edge (SASE) solution. Cisco+ Secure Connect Now is a turnkey offer available in several countries that allows customers to quickly deploy SASE and ease day-to-day operations through a cloud-managed platform. The as-a-service subscription is optimized for value and managed through a unified dashboard.

Cisco offers unmatched breadth and depth in its networking and security capabilities, which is why Telefonica Tech will add Cisco’s SASE suite to its service portfolio.

“As businesses shift to support hybrid work and work from anywhere models, we are committed to helping them adapt to the increased demand for high performing and secure connectivity,” said Rames Sarwat, Director of Cyber Security & Cloud Products and Services at Telefonica Tech. “Together with Cisco, we will offer customers an innovative, managed service that will combine SD-Branch with Cisco SASE to address a complete set of next-generation connectivity and security use cases for the branch and the hybrid worker.” 

Secure Operations

Cisco added a new Talos Intel On-Demand service offering custom research on the threat landscape unique to each organization. To help accelerate incident detection and response, Cisco announced enhancements to Cisco Secure Cloud Analytics with its ability to automatically promote alerts into SecureX and map those alerts to MITRE ATT&CK. This follows the general availability of SecureX device insights to aggregate, correlate, and normalize data about the devices in their environment, and the integrations of Kenna and Secure Endpoint to better prioritize vulnerabilities. Cisco also introduced the Secure Firewall 3100 Series, designed for hybrid work with a new encrypted visibility engine that uses artificial intelligence and machine learning to detect hidden threats.

Simplification

Cisco is introducing simplification across the portfolio with the new unified Secure Client. Streamlining how administrators and users manage endpoints, half of Cisco Secure agents, including AnyConnect, Secure Endpoint, and Umbrella, will be unified by mid-year 2022 with additional agents to be added over time. This follows the new cloud-delivered Secure Firewall Management Center, which is enabled through the Cisco Defense Orchestrator and unifies management of both cloud and on-premise firewalls.

To learn more, visit Cisco.com/go/security.

Additional Resources:

About Cisco
Cisco (NASDAQ: CSCO) is the worldwide leader in technology that powers the Internet. Cisco inspires new possibilities by reimagining your applications, securing your data, transforming your infrastructure, and empowering your teams for a global and inclusive future. Discover more on The Newsroom and follow us on Twitter. Cisco and the Cisco logo are trademarks or registered trademarks of Cisco and/or its affiliates in the U.S. and other countries. A listing of Cisco’s trademarks can be found at http://www.cisco.com/go/trademarks. Third-party trademarks mentioned are the property of their respective owners. The use of the word partner does not imply a partnership relationship between Cisco and any other company.

Source: Cisco Systems, Inc.
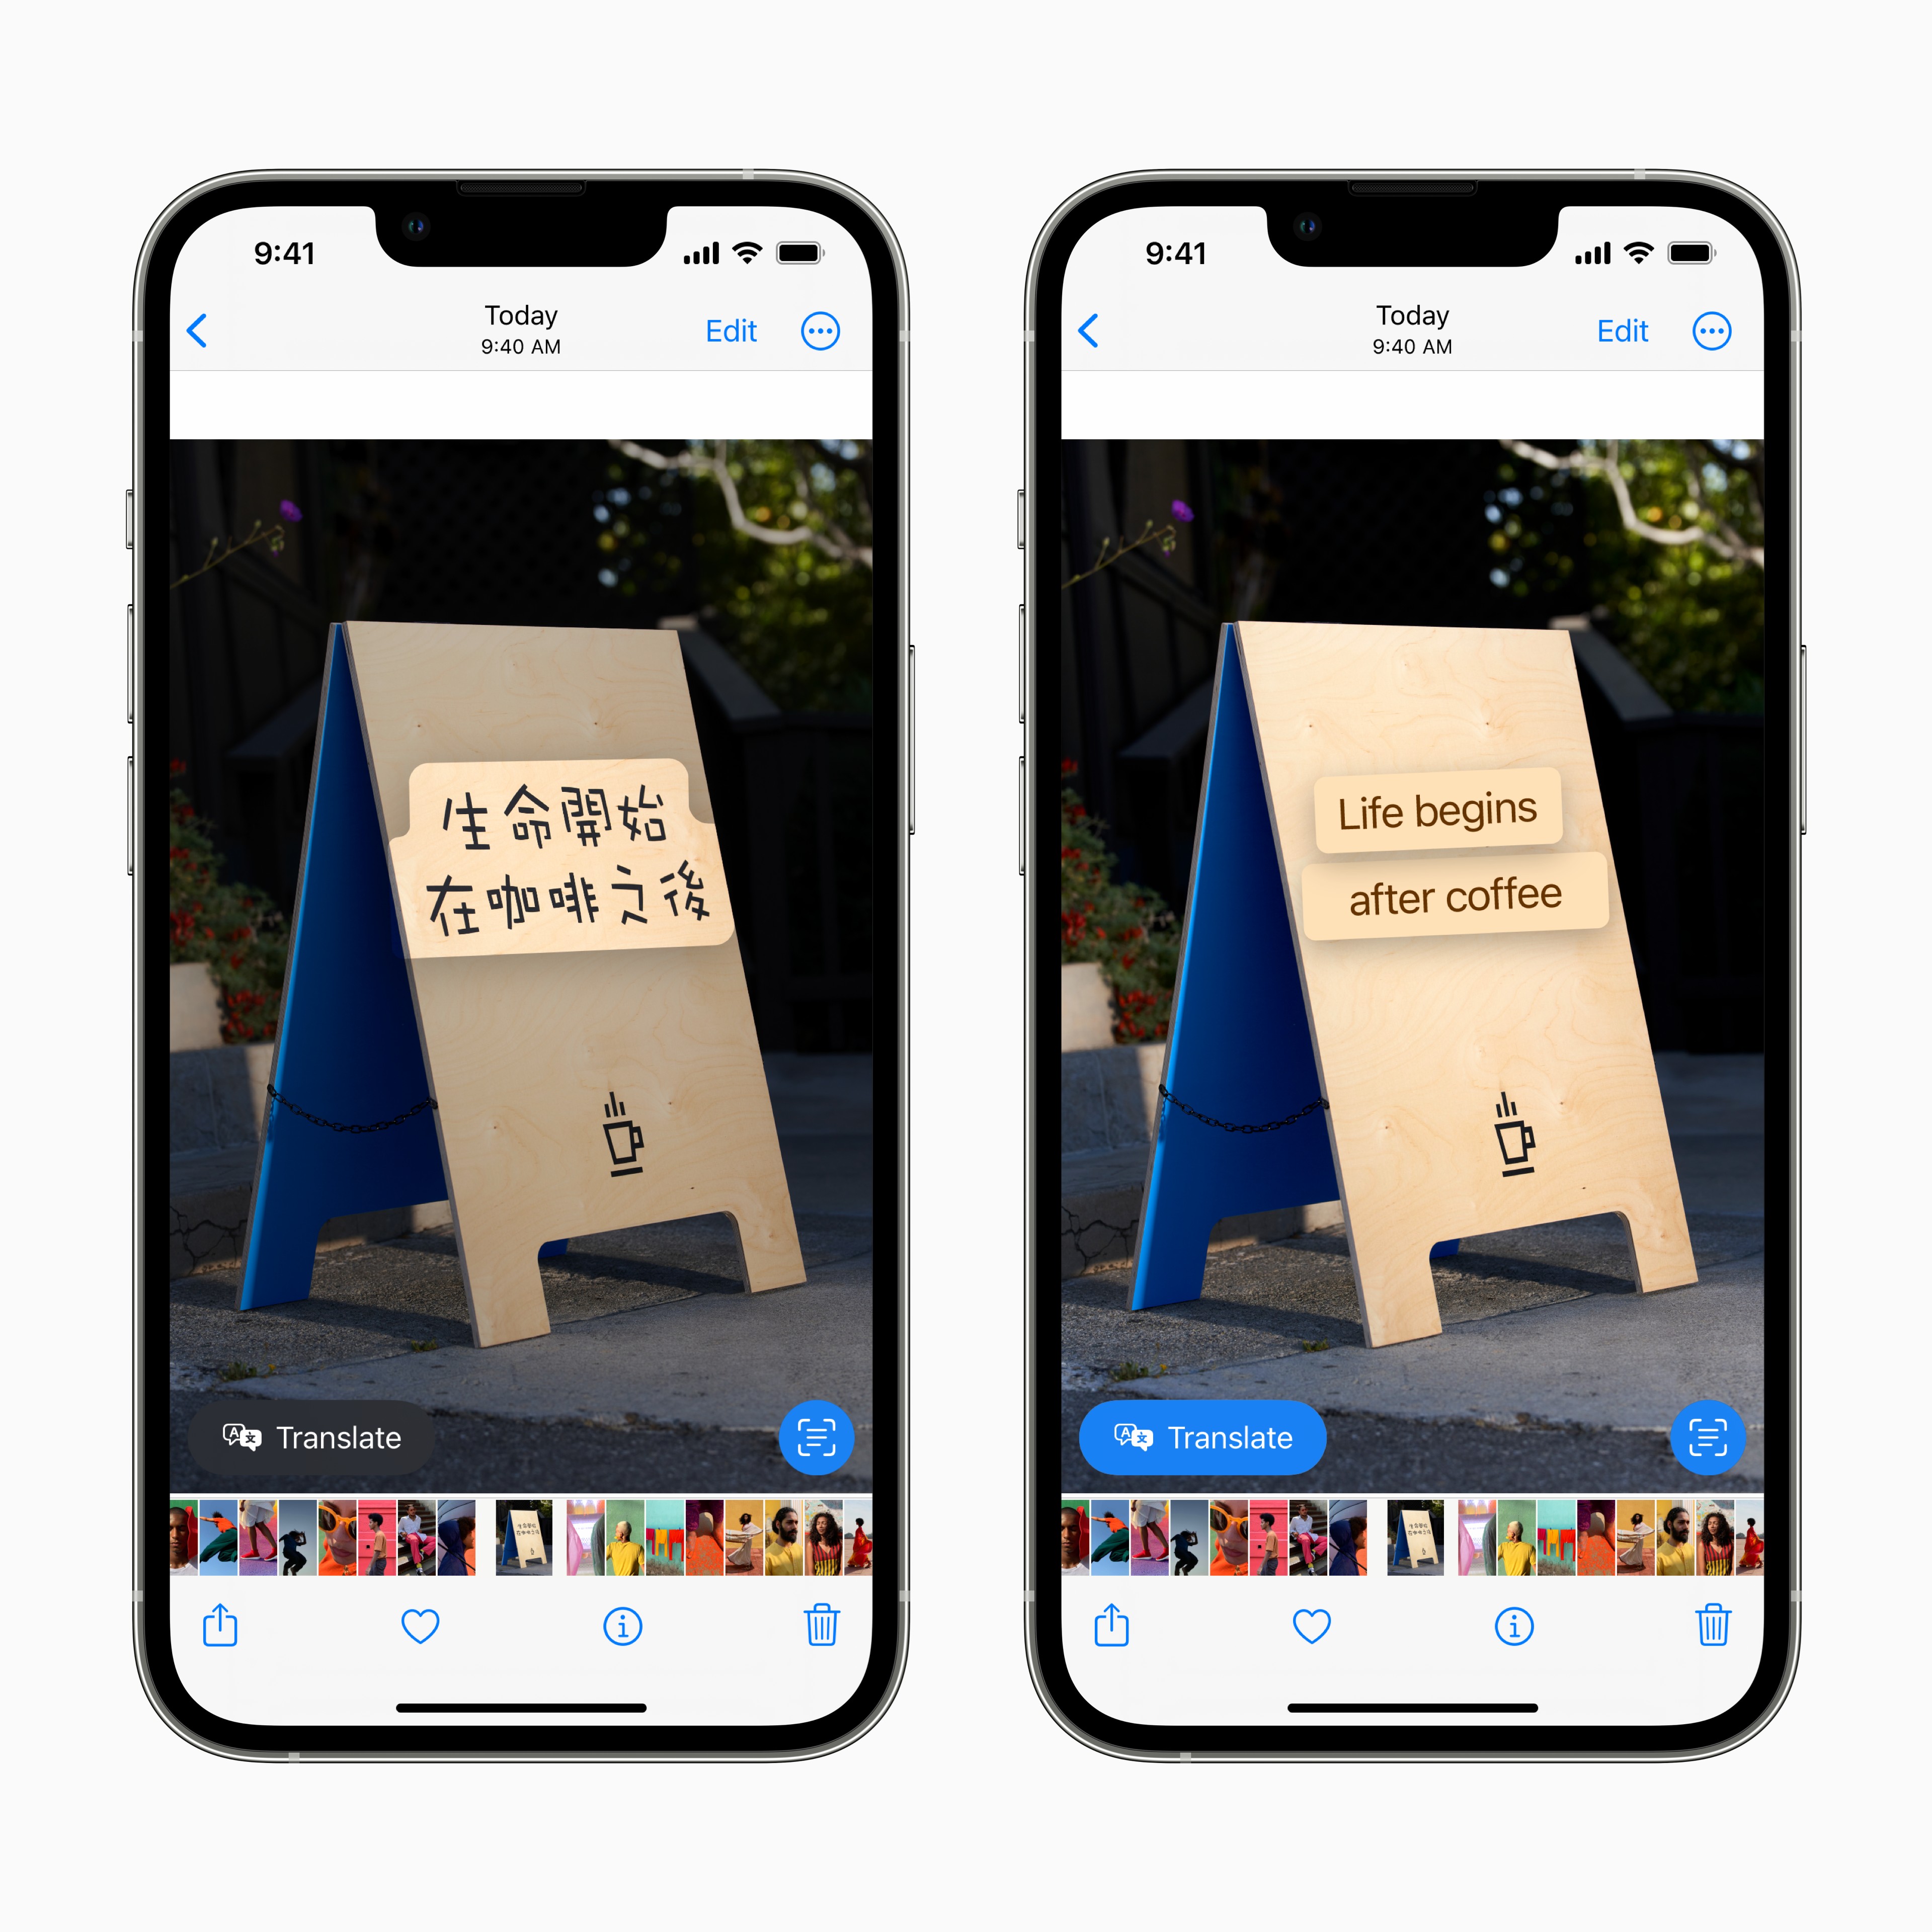
Trina Solar ranks ‘AAA’ in latest PV Tech Bankability Report

CHANGZHOU, China, June 6, 2022 /PRNewswire/ — Trina Solar, the leading global PV and smart energy total solution provider, has been ranked ‘AAA’, the highest category, in the latest PV ModuleTech Bankability report published by PV-Tech.
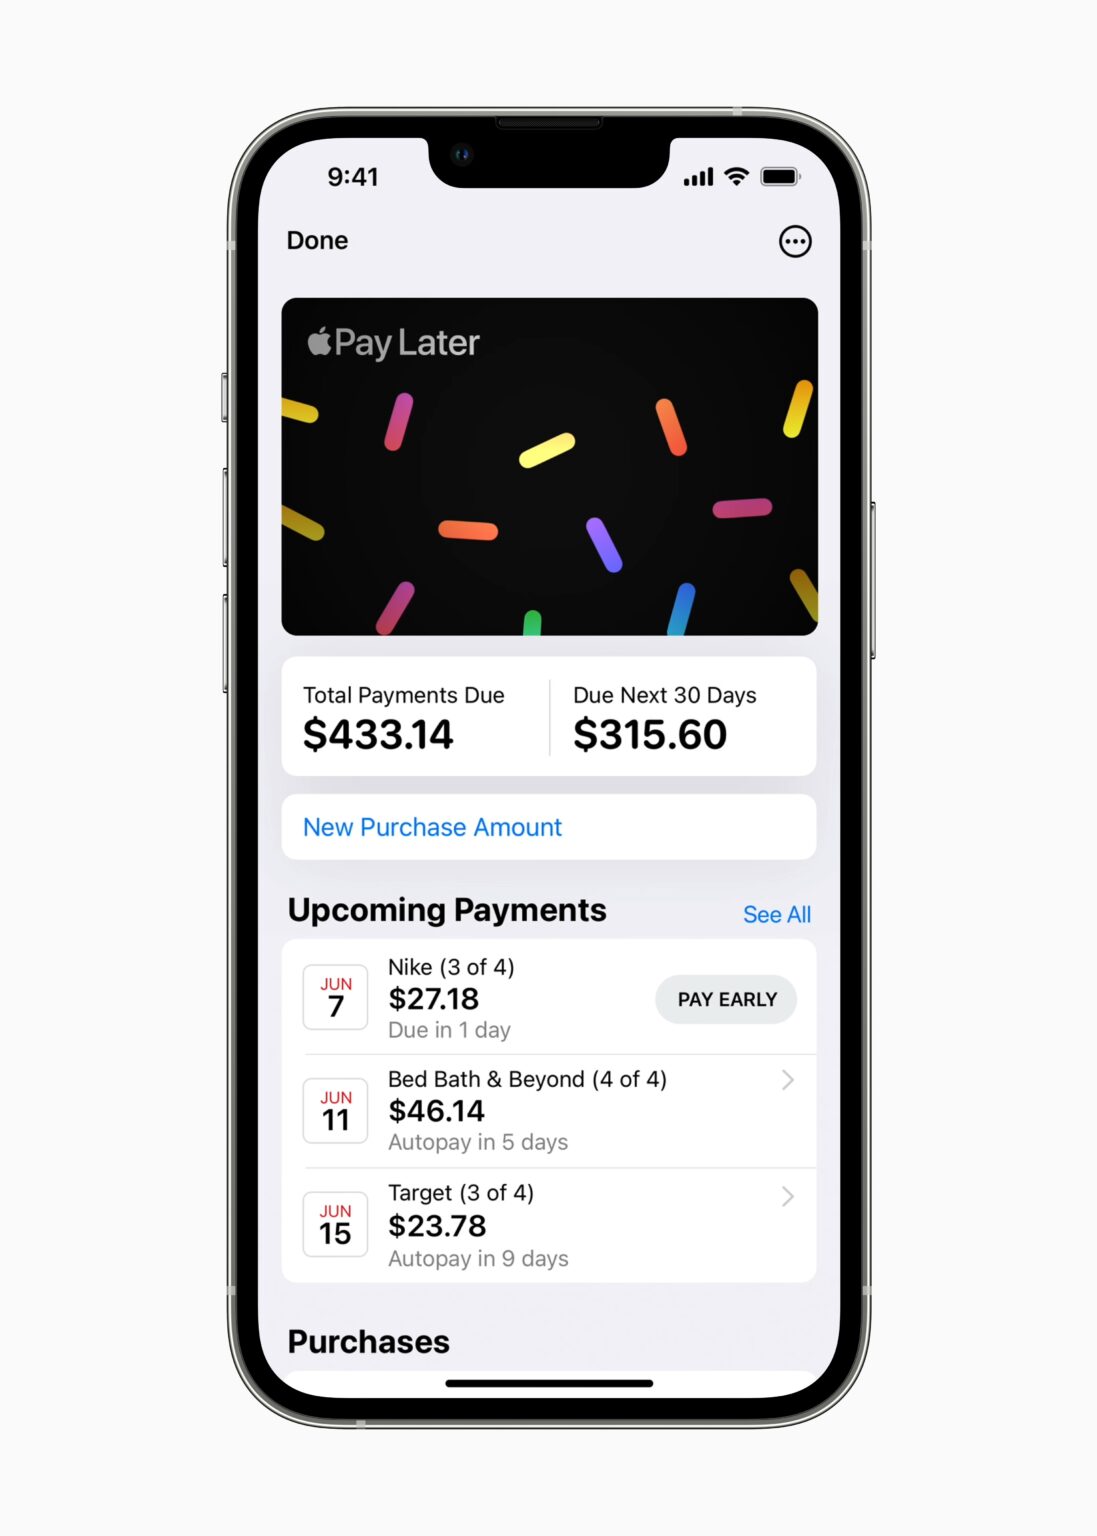
Based on a proprietary analytical model to establish bankability scores and ratings, the report combines both the manufacturing and financial health of companies, the latest issue covering more than 50 PV module suppliers.

Trina Solar ranked second for global module shipments in 2021, with a figure of 24.8GW, and has retained that position in the first quarter of 2022, shipping 8GW. Industry reports indicate that global shipments of 210 modules rose sharply in 2021 to reach 26GW, Trina contributing 16GW, with cumulative 210 shipments exceeding 35GW as of the end of March 2022.

Technology indicators are also analyzed in the PV Tech report. Trina continues to innovate in this area, being an early mover in n-type technology and setting its 23rd world record in March, with its 210×210mm TOPCon cell achieving a maximum efficiency of 25.5%. The company has also set a high benchmark for efficiency of its PERC and HJT cells.

Trina’s high value Vertex modules, from the Vertex S 410W to the 600W+ ultra-high-power version, cover both residential and large ground mounted power plant applications and have displayed a combination of excellent reliability, high energy yield and low LCOE. Due to its longstanding commitment to product quality, Trina has also recently been recognized as a “Top Performer” by PVEL for the eighth consecutive year.

According to the company’s 2021 financial report, it achieved revenue of $6.895 billion, a year-on-year increase of 51.2%, with total assets of $9.966 billion, a year-on-year increase of 39.36%.

Helena Li, President of Trina’s Cell and Module business, commented: “Trina Solar has been a leading global PV module supplier for many years. Based on our consistent financial performance, technology innovation and product value, we are proud to be ranked in the AAA category in PV Tech’s bankability ratings. Trina Solar will continue to progress and create higher customer value globally.”