HH Global acquires Adare International


Merge completion of global marketing services providers, HH Global and Adare International 

LONDON and CHICAGO, Aug. 18, 2021 — HH Global is pleased to announce the completion of the acquisition of Adare International (including Purple Agency), from the private equity firm Endless LLP, following the signing of an agreement on Monday 21 June 2021. The combined business will generate approximately $2.1bn in annual sales.  

This deal will create a combined global business with over 4,000 employees and a presence in more than 65 countries, cementing HH Global’s position as market leader. It will also allow stronger in-country operations, helping to propel seven of our local markets to achieve local annual run rates of over $50m revenue for the first time. 

Mike Perez, Group CEO of HH Global, expressed: "Following on from the successful integration of InnerWorkings in October last year, we are thrilled to join forces with Adare International. Welcoming new clients and colleagues on board is always an exciting process, and the strength of Adare International in these areas was a key motivation for our interest in acquiring them. I’m also particularly excited to enhance our capabilities in creative services in the healthcare and B2B sectors with Purple Agency, and to take advantage of the enhanced geographical reach and local revenue within their regional operations. 

The complementary nature of our business models and our shared passion for innovation, sustainability, and commitment to delivering outstanding services, assures me that this acquisition will allow us to continue to boost the growth momentum we have built over the last few years. On behalf of everyone at HH Global I would like to wish both employees and clients alike from Adare International a very warm welcome to the HH Global family." 

Andrew Dutton, Group CEO of Adare International, is also excited for what the merge will mean for the future, stating "Having been the CEO of Adare International since 2016, I have had the privilege of helping to grow our business into the exceptional marketing services provider it is today. Our dedication for delivering innovative, integrated marketing solutions to clients around the world aligns perfectly with the strengths of HH Global, making us confident that this partnership represents the best path for our company going forwards." 

About HH Global  
Founded in 1991, HH Global is a global outsourced marketing execution provider. Applying proven processes, industry-leading technology, and the deep expertise of over 4,000+ employees, we develop innovative solutions that drive down the cost of our clients’ physical marketing procurement and content development, while improving quality, sustainability, and speed to market. For more information, please visit hhglobal.com 

About Adare International  
Adare International is a British-headquartered provider of marketing services with strong procurement, creative and data offerings. From digital content and print management to logistics and point of sale, Adare International provide a full suite of services. Adare International also has an excellent procurement offering, as well as innovative content and interactive service lines. For more information please visit – Adare | Harmonise Your Marketing (adareinternational.net) 

About Purple Agency  
Owned by Adare International, Purple Agency is a global marketing agency, who specialise in healthcare, B2B and dedicated studios. The company have a global reach, with offices across the UK, Germany, Italy, Mexico and Brazil, and presence in over 40 countries. Their service offerings include Purple Health, which covers the full healthcare marketing spectrum, from sickness to wellness, intervention to prevention, and animal to human. They also offer Purple B2B, bringing fresh insight into companies’ business marketing communications, as well as Purple Studios which allows companies to build dedicated studios for their targeted needs. For more information please visit – Purple Agency | About us 

Strategic Motivation  
As with the recent merge with Innerworkings, the rationale behind this latest acquisition is centred on the strategic fit and complementary nature of the businesses, ultimately allowing HH Global to further consolidate its leading position within market. The acquisition will allow HH Global to expand capacity and reach, particularly in Europe and Latin American markets, in which our combined presence will grow our in-country capabilities. Furthermore, Adare International’s impressive solution offerings, as well as expanded agency and interactive service lines, will allow HH Global to significantly diversify and increase our proposition. Along with improving upon current services, the acquisition will also establish an increased capability in market sectors such as healthcare and B2B marketing.  

The merge will ultimately result in an unparalleled marketing and execution firm that will provide our clients with meaningful opportunities to increase the value they receive from our services. Being chosen as Adare International’s acquisition partner reflects the reputation and status HH Global has managed to achieve in recent years. We will ultimately be in a stronger position to transform and grow our long-term client relationships as their trusted solutions partner.

Related Links :

Home Page

SKF to service Berlin underground carriages in long-term agreement

Service agreement for U-Bahn trains includes original part supply and service for at least 606 carriages – and will last for a 32-year period minimum

GOTHENBURG, Sweden, Aug. 17, 2021 — SKF has signed a long-term agreement with Stadler Rail to equip and service rolling stock for the Berlin underground (U-Bahn) in Germany.

The contract, with Swiss rail vehicle manufacturer Stadler Rail, is worth several million Euros. It includes a number of SKF solutions ranging from wheel set bearings and axle boxes to lubrication systems. Over the more than 32-year duration of the contract, SKF will cover spares supply. The contract is covered by a performance agreement, which is measured against a set of KPIs to ensure high customer confidence.

"This contract will provide reliability and safety of spare parts over the entire period," says Thomas White, Key Account Manager for Railways at SKF. "This aims to reduce logistics efforts and raise reliability for both the train operator and Stadler Rail."

Under the agreement, SKF will service more than 606 rail carriages, to be built between 2022 and 2026. This may extend to a total of 1,500 carriages. Berlin U-bahn operator, Berliner Verkehrsbetriebe (BVG), has said that this is the largest vehicle purchasing programme in its history – with a budget of around €3 billion for up to 1,500 carriages.

Overall, the SKF contract will involve the supply and servicing of more than 12,000 wheelset bearings, among other services. The wheelset bearings are insocoated – so have a plasma coating to prevent electrical damage.

SKF’s long-standing relationship with Stadler, its ability to offer a broad service package and its technical expertise were key factors behind winning the contract. SKF was also involved in the very early phase of development – developing product solutions that were tailored to the customer’s needs.

The service contract aims to help to improve the reliability and uptime of trains on the U-Bahn.

SKF can support rail manufacturers to meet their RAMS (Reliability, Availability, Maintainability, and Safety) and LCC (Lifecycle Costing) responsibilities, a key factor in modern rail stock performance.

For further information, please contact:

Press Relations: Nia Kihlström, +46 31-337 2897; +46 706 67 28 97; nia.kihlstrom@skf.com

This information was brought to you by Cision http://news.cision.com

https://news.cision.com/skf/r/skf-to-service-berlin-underground-carriages-in-long-term-agreement,c3397363

The following files are available for download:


OPPO Reno6 Pro Available In Malaysia Exclusively on LAZADA

OPPO’s Reno6 series was recently announced. However, the series was a little incomplete without the Pro variant. Joining the OPPO Reno 6Z and the Reno 6 is the Reno 6 Pro which will be available exclusively via LAZADA.

The OPPO Reno6 Pro is the most powerful Reno yet coming with the Snapdragon 870 mobile platform. The processor is paired with 12GB of RAM and 256GB of internal storage. Display-wise it comes equipped with a 6.5-inch AMOLED 3D curved display. This is enhanced with a 90Hz refresh rate and up to 180Hz touch sampling.

OPPO Reno6 Pro with box

Of course, being a Reno flagship, the Reno6 Pro comes with a quad-camera setup. The main camera is a Sony IMX766 sensor which OPPO has co-developed. This is complemented with a 16-megapixel wide-angle camera, a 13-megapixel telephoto camera and a 2-megapixel macro camera. The OPPO Reno 6 Pro also comes with a dedicated colour temperature sensor which allows it to capture more realistic colours.

Keeping with other Reno flagships, the OPPO Reno6 Pro also focuses on camera performance. OPPO has augmented the camera setup on the OPPO Reno6 Pro with AI algorithms which allow it to capture higher quality images with more detail than before. The smartphone’s camera comes with a new Bokeh Flare Portrait Video which allows users to capture video with the much sought after blurry background effect. In addition, it also has AI highlight video which allows the phone to optimize videos according to the ambient lighting of the surroundings. It also has focus tracking to keep your subject in focus throughout your video.

The smartphone is powered by a 4,500mAh battery with support for 65W SuperVOOC 2.0 charging. This will allow you to get from 0 to 100% in just 31 minutes.

Pricing & availability

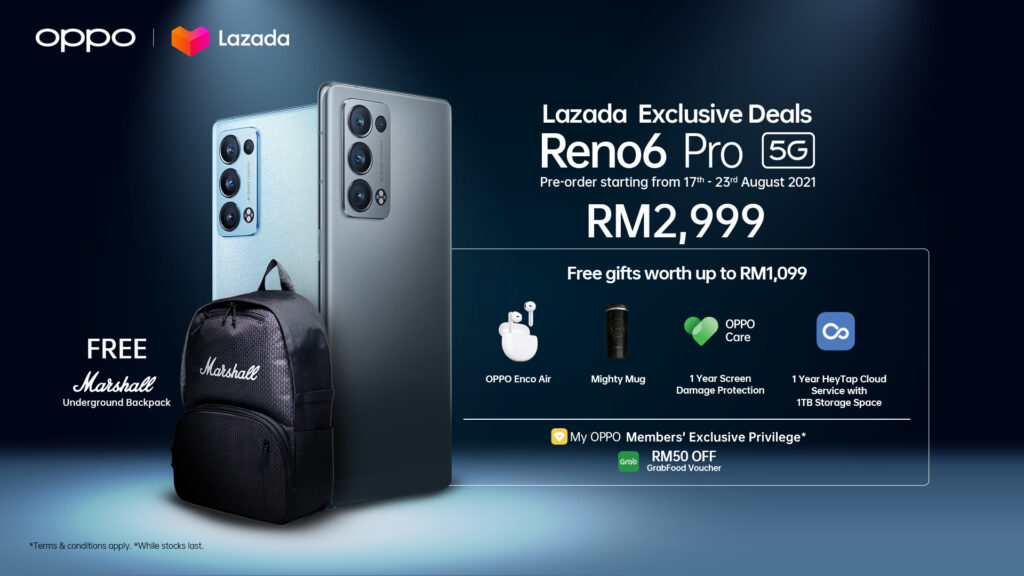
The OPPO Reno6 Pro will be available in Arctic Blue and Lunar Grey. It will be retailing for MYR2,999.

Reno6 Pro Launch KV

Pre-orders start on 17 August 2021. Each pre-order is entitled to freebies worth up to MYR1099 including an OPPO Enco Air, 1 Year of OPPO Care Screen Damage protection and 1 year of HeyTop Cloud with 1TB of Storage space.

Reno6 Pro Lucky Draw

OPPO is also giving early adopters a chance to with Marshall products worth up to MYR5900 during their pre-order period. Every pre-order placed on LAZADA is entitled to 5 entries for this lucky draw.

ASUS ROG Phone 5s – The ROG Phone 5, But Even More Powerful

The ASUS ROG Phone 5 was launched earlier this year and it is the ultimate gaming smartphone with not just the most powerful smartphone processor you can find in a modern smartphone. We are talking about Qualcomm’s Snapdragon 888 5G platform here. But they squeeze up to 18GB of RAM into a smartphone. You are essentially getting the performance of a modern PC in the palm of your hands, and it still fits in your pockets.

The ASUS ROG Phone 5 packed a fast display too. At 144Hz, it is one of the fastest, if not the fastest, smartphone display you can get in a modern smartphone. It also came with one of the fastest responding displays you can find in a modern smartphone as well at 240Hz of touch sampling rate.

While all of that made the ASUS ROG Phone 5 series one of the most powerful and desirable smartphones in the market, the recipe is not unique to ASUS’ ROG Phone 5 series. Other flagship smartphones started using the same recipe in their smartphones. You still will not get RAM sizes as big as 18GB in most flagships from major manufacturers. But you will get the same Qualcomm Snapdragon 888 5G platform and even up to 512GB of storage onboard. You also get up to 240Hz touch sampling rate with displays that refreshes at up to 120Hz in most cases.

Screenshot 2021 08 17 at 18 18 03 ROG Phone 5s Gaming Phones|ROG Republic of Gamers|ROG Global
Source: ASUS

The ASUS ROG Phone 5s series takes things up a notch in power though. It now packs a specially tuned Qualcomm Snapdragon 888 5G chipset. They call it the Qualcomm Snapdragon 888+ platform and it is marginally more powerful that its Plain Jane counterpart.

That is not all they improved though. They also made the 144Hz display a little faster to the touch. Instead of 240Hz in touch sampling, it now responds at 360Hz for an even faster 24ms latency from touch to action. It is still a Full HD+ display that measures at 6.78-inc though.

You also get mostly the same hardware as the current ASUS ROG Phone 5. The behemoth 6,000 mAh battery is still present to ensure you can work with it the entire day. You still get the high-resolution 64-Megapixel shooter supported by a 5-Megapixel macro camera and 13-Megapixel ultra-wide camera. Out front is a 24-megapixel shooter still.

  • Screenshot 2021 08 17 at 18 16 16 ROG Phone 5s Pro Gaming Phones|ROG Republic of Gamers|ROG Global
  • Screenshot 2021 08 17 at 18 18 03 ROG Phone 5s Gaming Phones|ROG Republic of Gamers|ROG Global
  • s9
  • Screenshot 2021 08 17 at 18 16 49 ROG Phone 5s Pro Gaming Phones|ROG Republic of Gamers|ROG Global

We said that there is a series in the new line-up. That is because there will be two devices from the series – a regular ROG Phone 5s and an extreme ROG Phone 5s Pro. The difference between the two devices, at least in terms of visual, is found at the backplate. The regular ROG Phone 5s only packs the dot matrix RGB graphics at the back. The ROG Phone 5s Pro has the small OLED display that trickle down from the ROG Phone 5 Ultimate. Of course, the Pro also gets the 18GB RAM + 512GB storage treatment that was signature to the ROG Phone 5 Ultimate. Because the new ROG Phone 5s series shares similar dimensions with the original ROG Phone 5, you can use accessories that you have from the older ROG Phone 5 series.

ASUS says that the devices will launch on the 30th of September 2021 in Taiwan. The ASUS ROG Phone 5s (16GB + 256GB) starts at NTD 29,990 (MYR 4,559*). You can get the ROG Phone 5s in 512GB storage flavour too at NTD 33,390 (MYR 5,167*). The ROG Phone 5s Pro will set you back NTD 37,990 (MYR 5,773*) at launch. There are no specific dates for an international launch at this time. Considering that the ROG Phone 5 Ultimate just arrived in Malaysian shores, we think the ROG Phone 5s series might not come all that soon.

* Approximately based on exchange rate of NTD 100 = MYR 15.20 on xe.com as of 17/08/2021

AiHuiShou International Co. Ltd. Reports Unaudited Second Quarter 2021 Financial Results

SHANGHAI, Aug. 17, 2021 — AiHuiShou International Co. Ltd. ("ATRenew" or the "Company") (NYSE: RERE), a leading technology-driven pre-owned consumer electronics transactions and services platform in China, today announced its unaudited financial results for the second quarter ended June 30, 2021. 

Second Quarter 2021 Highlights

  • Total net revenues grew by 56.2% to RMB1,867.7 million (US$289.3 million) from RMB1,195.8 million in the second quarter of 2020.
  • Loss from operations was RMB507.3 million (US$78.6 million), compared to RMB116.0 million in the second quarter of 2020. Adjusted loss from operations (non-GAAP)[1] was RMB51.0 million (US$7.9 million), compared to RMB36.6 million in the second quarter of 2020.
  • Total Gross Merchandise Volume ("GMV[2]") increased by 69.6% to RMB7.8 billion from RMB4.6 billion in the second quarter of 2020. GMV for product sales increased by 72.7% to RMB1.9 billion from RMB1.1 billion in the second quarter of 2020. GMV for online marketplaces increased by 68.6% to RMB5.9 billion from RMB3.5 billion in the second quarter of 2020.
  • Number of consumer products transacted[3] increased by 27.9% to 7.8 million from 6.1 million in the second quarter of 2020.

[1] See "Reconciliations of GAAP and Non-GAAP Results" for more information.

[2] "GMV" represents the total dollar value of goods distributed to merchants and consumers through transactions on the Company’s platform in a given period for which payments have been made, prior to returns and cancellations, excluding shipping cost but including sales tax.

[3] "Number of consumer products transacted" represents the number of consumer products distributed to merchants and consumers through transactions on the Company’s PJT Marketplace, Paipai Marketplace and other channels the Company operates in a given period, prior to returns and cancellations, excluding the number of consumer products collected through AHS Recycle; a single consumer product may be counted more than once according to the number of times it is transacted on PJT Marketplace, Paipai Marketplace and other channels the Company operates through the distribution process to end consumer.

Mr. Kerry Xuefeng Chen, Founder, Chairman, and Chief Executive Officer of ATRenew, commented, "We are pleased to deliver robust financial and operational results in our first quarterly earnings release as a public company. Our NYSE listing in June marked a paramount milestone following a decade of commitment and effort to fulfill our mission to give a second life to all idle goods. During the quarter, we further upgraded our pre-owned consumer products supply chain and automated operation capabilities, elevating the efficiency of pre-owned consumer electronics transactions on our platform. Meanwhile, we continued to empower small merchants in mid- and lower-tier cities and optimize the consumer experience. By leveraging our proprietary technology and services along with the pre-owned electronics supply chain we have established, we are well-positioned to increase the overall penetration and circulation rate of pre-owned consumer electronics in China, and to generate sustainable value for our shareholders and society while supporting the development of China’s circular economy."

Mr. Rex Chen, Chief Financial Officer of ATRenew, added, "In the second quarter of 2021, our GMV and revenue both maintained strong momentum. Our proprietary system for automated inspection, grading, and pricing serves as the essential technical foundation to empower small merchants and provide optimal transaction services for our PJT Marketplace and Paipai Marketplace. Notably, revenue contribution from services during the quarter continued to increase, further demonstrating our economies of scale. Looking ahead, we will continue to invest in our operations and automation technology upgrades to provide consumers and merchants with optimal trade-in and consignment experiences. Utilizing our combined resources with strategic partners, we will continue to expand the presence of our recycling, trade-in, and multiple-device trade-in within our ecosystem."

Second Quarter 2021 Financial Results

REVENUE

Total net revenues increased by 56.2% to RMB1,867.7 million (US$289.3 million) from RMB1,195.8 million in the same period of 2020.

  • Net product revenues increased by 53.1% to RMB1,603.4 million (US$248.3 million) from RMB1,047.2 million in the same period of 2020. The increase was attributable to an increase in the sales of pre-owned consumer electronics through PJT Marketplace, Paipai Marketplace and the Company’s offline trade-in channels. GMV for product sales increased by 72.7% to RMB1.9 billion from RMB1.1 billion in the second quarter of 2020.
  • Net service revenues increased by 77.9% to RMB264.3 million (US$40.9 million) from RMB148.6 million in the same period of 2020. The increase was primarily due to the increases in transaction volume on PJT Marketplace and Paipai Marketplace and an increase in the average commission rate. GMV for online marketplaces increased by 68.6% to RMB5.9 billion from RMB3.5 billion in the second quarter of 2020.

OPERATING COSTS AND EXPENSES

Operating costs and expenses increased by 81.0% to RMB2,379.4 million (US$368.5 million) from RMB1,314.4 million in the same period of 2020. The increase was primarily due to the Company’s business growth and the immediate recognition of share-based compensation expense of RMB378.4 million (US$58.6 million) resulting from restricted share units and options granted to the management immediately prior to the IPO and options granted to employees with an IPO condition.

  • Merchandise costs increased by 56.9% to RMB1,395.4 million (US$216.1 million) from RMB889.5 million in the same period of 2020. The increase was primarily due to the growth in product sales.
  • Fulfillment expenses increased by 84.4% to RMB275.5 million (US$42.7 million) from RMB149.4 million in the same period of 2020. The increase was primarily due to (i) an increase in personnel cost in connection with the Company’s growing business and the immediate recognition of share-based compensation expense of RMB42.5 million (US$6.6 million) resulting from options granted to employees with an IPO condition; and (ii) the increases in logistics expenses and operation center related expenses which were in line with the increase in sales of pre-owned consumer electronics.
  • Selling and marketing expenses increased by 60.3% to RMB316.3 million (US$49.0 million) from RMB197.3 million in the same period of 2020. The increase was primarily due to (i) an increase in personnel cost in connection with the Company’s growing business and the immediate recognition of share-based compensation expense of RMB26.3 million (US$4.1 million) resulting from options granted to employees with an IPO condition; and (ii) an increase in sales commissions in connection with traffic acquisition and sourcing of pre-owned devices.
  • General and administrative expenses increased by 593.2% to RMB310.3 million (US$48.1 million) from RMB44.8 million in the same period of 2020. The increase was primarily due to the share-based compensation expense of RMB220.1 million (US$34.1 million) in connection with the restricted share units and options granted to the management immediately prior to the IPO and the immediate recognition of share-based compensation expense of RMB62.0 million (US$9.6 million) resulting from options granted to employees with an IPO condition.
  • Technology and content expenses increased by 144.5% to RMB81.9 million (US$12.7 million) from RMB33.5 million in the same period of 2020. The increase was primarily due to the increase in personnel cost in connection to the expansion of the research and development team and the immediate recognition of share-based compensation expense of RMB27.6 million (US$4.3 million) resulting from options granted to employees with an IPO condition.

LOSS FROM OPERATIONS

Loss from operations was RMB507.3 million (US$78.6 million), compared to RMB116.0 million in the second quarter of 2020. Adjusted loss from operations (non-GAAP) was RMB51.0 million (US$7.9 million), compared to RMB36.6 million in the second quarter of 2020.

NET LOSS

Net loss was RMB505.7 million (US$78.3 million), compared to RMB107.3 million in the second quarter of 2020. Adjusted net loss (non-GAAP)[4] was RMB59.7 million (US$9.2 million), compared to RMB39.8 million in the second quarter of 2020.

BASIC AND DILUTED NET LOSS PER ORDINARY SHARE

Basic and diluted net loss per ordinary share were RMB13.47 (US$2.09), compared to RMB23.07 in the same period of 2020.

Adjusted basic and diluted net loss per ordinary share (non-GAAP)[5] were RMB1.59 (US$0.25), compared to RMB2.12 in the same period of 2020.

[4] See "Reconciliations of GAAP and Non-GAAP Results" for more information.

[5] See "Reconciliations of GAAP and Non-GAAP Results" for more information.

CASH AND CASH EQUIVALENTS AND SHORT-TERM INVESTMENTS

Cash and cash equivalents and short-term investments increased to RMB2,835.5 million (US$439.2 million) as of June 30, 2021 from RMB1,015.9 million as of December 31, 2020, primarily due to net proceeds from the Company’s initial public offering in June 2021.

Business Outlook

For the third quarter of 2021, the Company currently expects its total revenues to be between RMB1,870.0 million and RMB1,930.0 million. This forecast only reflects the Company’s current and preliminary views on the market and operational conditions, which are subject to change.

Environment, Social, and Governance

On July 13, 2021, the Company announced its response to the 14th Five-Year Plan (2021-2025) for Circular Economy Development released by the National Development and Reform Commission. The Company pursues its mission "to give a second life to all idle goods", supporting the development of a circular economy.

On August 17, 2021, the Company published its first environmental, social and governance ("ESG") report, highlighting the company’s long-term initiatives focused on improving its environmental impact and furthering its social contributions. The full report is available on the Company’s investor relations website and is provided in both Simplified Chinese and English.

Recent Development

On July 20, 2021, the Company announced that, in connection with its previously announced initial public offering, the underwriters have exercised their over-allotment option to purchase an additional 1,875,717 shares of the Company’s American Depositary Shares ("ADSs") (equivalent to 1,250,478 Class A ordinary shares of the Company) at a price of US$14.00 per ADS. The Company also announced the closing of its initial public offering of 16,233,000 at a price of US$14.00 per ADS, which did not include the sale of shares pursuant to the over-allotment option. As of July 20, 2021, the Company had 18,108,717 ADSs outstanding (equivalent to 12,072,478 Class A ordinary shares of the Company), which included the ADSs issued as part of the Company’s initial public offering and the underwriters’ exercise of their over-allotment option.

Conference Call Information

The Company’s management will hold a conference call on Tuesday, August 17, 2021 at 08:00 A.M. Eastern Time (or 08:00 P.M. Beijing Time on Tuesday, August 17, 2021) to discuss the financial results. Listeners may access the call by dialing the following numbers:

International:

1-412-317-6061

United States Toll Free:

1-888-317-6003

Mainland China Toll Free:

4001-206115

Hong Kong Toll Free:

800-963976

Access Code:

6346736

The replay will be accessible through August 24, 2021 by dialing the following numbers:

International:

1-412-317-0088

United States Toll Free:

1-877-344-7529

Access Code:

10159327

A live and archived webcast of the conference call will also be available at the Company’s investor relations website at ir.aihuishou.com.  

About AiHuiShou International Co. Ltd.

Headquartered in Shanghai, AiHuiShou International Co. Ltd. operates a leading technology-driven pre-owned consumer electronics transactions and services platform in China under the brand ATRenew. Since its inception in 2011, ATRenew has been on a mission to give a second life to all idle goods, addressing the environmental impact of pre-owned consumer electronics by facilitating recycling and trade-in services, and distributing the devices to prolong their lifecycle. ATRenew’s open platform integrates C2B, B2B, and B2C capabilities to empower its online and offline services. Through its end-to-end coverage of the entire value chain and its proprietary inspection, grading, and pricing technologies, ATRenew sets the standard for China’s pre-owned consumer electronics industry.

Exchange Rate Information

This announcement contains translations of certain RMB amounts into U.S. dollars at specified rates solely for the convenience of the reader. Unless otherwise noted, all translations from RMB to U.S. dollars are made at a rate of RMB6.4566 to US$1.00, the exchange rate set forth in the H.10 statistical release of the Board of Governors of the Federal Reserve System as of June 30, 2021.

Use of Non-GAAP Financial Measures

The Company also uses certain non-GAAP financial measures in evaluating its business. For example, the Company uses adjusted loss from operations, adjusted net loss and adjusted net loss per ordinary share as supplemental measures to review and assess its financial and operating performance. The presentation of these non-GAAP financial measures is not intended to be considered in isolation, or as a substitute for the financial information prepared and presented in accordance with U.S. GAAP. Adjusted loss from operations is loss from operations excluding the impact of share-based compensation expenses and amortization of intangible assets resulting from business acquisition. Adjusted net loss is net loss excluding the impact of share-based compensation expenses, amortization of intangible assets resulting from business acquisition, tax benefit from amortization of such intangible assets and fair value change in warrant liabilities. Adjusted net loss per ordinary share is adjusted net loss attributable to ordinary shareholders divided by weighted average number of shares used in calculating net loss per ordinary share. Adjusted net loss attributable to ordinary shareholders is net loss attributable to ordinary shareholders excluding the impact of share-based compensation expenses, amortization of intangible assets resulting from business acquisition, tax benefit from amortization of such intangible assets and fair value change in warrant liabilities.

The Company presents non-GAAP financial measures because they are used by the Company’s management to evaluate the Company’s financial and operating performance and formulate business plans. The Company believes that adjusted loss from operations and adjusted net loss help identify underlying trends in the Company’s business that could otherwise be distorted by the effect of certain expenses that are included in loss from operations and net loss. The Company also believes that the use of non-GAAP financial measures facilitates investors’ assessment of the Company’s operating performance. The Company believes that adjusted loss from operations and adjusted net loss provide useful information about the Company’s operating results, enhance the overall understanding of the Company’s past performance and future prospects and allow for greater visibility with respect to key metrics used by the Company’s management in its financial and operational decision making.

The non-GAAP financial measures are not defined under U.S. GAAP and are not presented in accordance with U.S. GAAP. The non-GAAP financial measures have limitations as analytical tools. One of the key limitations of using non-GAAP financial measures is that they do not reflect all items of income and expense that affect the Company’s operations. Share-based compensation expenses, amortization of intangible assets resulting from business acquisition, tax benefit from amortization of such intangible assets and fair value change in warrant liabilities have been and may continue to be incurred in the Company’s business and is not reflected in the presentation of non-GAAP financial measures. Further, the non-GAAP measures may differ from the non-GAAP measures used by other companies, including peer companies, potentially limiting the comparability of their financial results to the Company’s. In light of the foregoing limitations, the non-GAAP financial measures for the period should not be considered in isolation from or as an alternative to loss from operations, net loss, and net loss attributable to ordinary shareholders per share, or other financial measures prepared in accordance with U.S. GAAP.

The Company compensates for these limitations by reconciling the non-GAAP financial measures to the nearest U.S. GAAP performance measures, which should be considered when evaluating the Company’s performance. For reconciliations of these non-GAAP financial measures to the most directly comparable GAAP financial measures, please see the section of the accompanying tables titled, "Reconciliations of GAAP and Non-GAAP Results."

Safe Harbor Statement

This press release contains statements that may constitute "forward-looking" statements pursuant to the "safe harbor" provisions of the U.S. Private Securities Litigation Reform Act of 1995. These forward-looking statements can be identified by terminology such as "will," "expects," "anticipates," "aims," "future," "intends," "plans," "believes," "estimates," "likely to" and similar statements. Among other things, quotations in this announcement, contain forward-looking statements. ATRenew may also make written or oral forward-looking statements in its periodic reports to the U.S. Securities and Exchange Commission (the "SEC"), in its annual report to shareholders, in press releases and other written materials and in oral statements made by its officers, directors or employees to third parties. Statements that are not historical facts, including statements about ATRenew’s beliefs, plans and expectations, are forward-looking statements. Forward-looking statements involve inherent risks and uncertainties. A number of factors could cause actual results to differ materially from those contained in any forward-looking statement, including but not limited to the following: ATRenew’s strategies; ATRenew’s future business development, financial condition and results of operations; ATRenew’s ability to maintain its relationship with major strategic investors; its ability to provide facilitate pre-owned consumer electronics transactions and provide relevant services; its ability to maintain and enhance the recognition and reputation of its brand; general economic and business conditions globally and in China and assumptions underlying or related to any of the foregoing. Further information regarding these and other risks is included in ATRenew’s filings with the SEC. All information provided in this press release is as of the date of this press release, and ATRenew does not undertake any obligation to update any forward-looking statement, except as required under applicable law.

Investor Relations Contact

In China:
AiHuiShou International Co. Ltd.
Investor Relations
Email: ir@aihuishou.com

In the United States:
ICR, LLC
Email: aihuishou@icrinc.com
Tel: +1-212-537-0461


AIHUISHOU INTERNATIONAL CO. LTD.

UNAUDITED CONDENSED CONSOLIDATED BALANCE SHEETS

(Amounts in thousands, except share and per share and otherwise noted)

As of

December 31

As of June 30,

2020

2021

RMB

RMB

US$

ASSETS

Current assets:

Cash and cash equivalents

918,076

2,785,542

431,426

Short-term investments

97,866

50,000

7,744

Amount due from related parties

289,156

305,441

47,307

Inventories, net

176,994

352,326

54,568

Funds receivable from third party payment service providers

124,262

191,221

29,616

Prepayments and other receivables, net

268,284

562,352

87,097

Total current assets

1,874,638

4,246,882

657,758

Non-current assets:

Investment in equity investees

96,362

114,112

17,674

Property and equipment, net

69,562

78,265

12,122

Intangible assets, net

1,367,841

1,241,364

192,263

Goodwill

1,803,415

1,803,415

279,313

Other non-current assets

14,520

98,115

15,196

Total non-current assets

3,351,700

3,335,271

516,568

TOTAL ASSETS

5,226,338

7,582,153

1,174,326

LIABILITIES, MEZZANINE EQUITY AND EQUITY (DEFICIT)

Current liabilities:

Short-term borrowings

369,657

209,205

32,402

Accounts payable

27,201

48,317

7,483

Accrued expenses and other current liabilities

396,612

394,331

61,074

Accrued payroll and welfare

115,400

107,319

16,622

Convertible bonds

160,000

Amount due to related parties

114,669

45,067

6,980

Total current liabilities

1,183,539

804,239

124,561

Non-current liabilities:

Long-term borrowings

32,624

14,066

2,179

Warrant liability

19,587

3,034

Deferred tax liabilities

341,960

350,341

54,261

Total non-current liabilities

374,584

383,994

59,474

TOTAL LIABILITIES

1,558,123

1,188,233

184,035

TOTAL MEZZANINE EQUITY

8,879,894

EQUITY (DEFICIT)

TOTAL EQUITY (DEFICIT)

(5,211,679)

6,393,920

990,291

TOTAL LIABILITIES, MEZZANINE EQUITY AND EQUITY
(DEFICIT)

5,226,338

7,582,153

1,174,326


AIHUISHOU INTERNATIONAL CO. LTD.

UNAUDITED CONDENSED CONSOLIDATED STATEMENTS OF OPERATIONS AND
COMPREHENSIVE LOSS

(Amounts in thousands, except share and per share and otherwise noted)

Three months ended June 30,

Six months ended June 30,

2020

2021

2020

2021

RMB

RMB

US$

RMB

RMB

US$

Net revenues

Net product revenues

1,047,248

1,603,419

248,338

1,653,351

2,913,966

451,316

Net service revenues

148,564

264,297

40,934

234,673

468,181

72,512

Operating expenses (1)(2)

Merchandise costs

(889,469)

(1,395,358)

(216,113)

(1,390,269)

(2,491,054)

(385,815)

Fulfillment expenses

(149,391)

(275,525)

(42,673)

(307,345)

(498,544)

(77,215)

Selling and marketing expenses

(197,305)

(316,295)

(48,988)

(341,455)

(538,875)

(83,461)

General and administrative expenses

(44,758)

(310,280)

(48,056)

(98,658)

(339,688)

(52,611)

Technology and content expenses

(33,524)

(81,903)

(12,685)

(73,689)

(137,402)

(21,281)

Total operating expenses

(1,314,447)

(2,379,361)

(368,515)

(2,211,416)

(4,005,563)

(620,383)

Other operating income

2,661

4,369

677

8,472

4,730

733

Loss from operations

(115,974)

(507,276)

(78,566)

(314,920)

(618,686)

(95,822)

Interest expense

(7,604)

(5,513)

(854)

(11,139)

(12,065)

(1,869)

Interest income

5,360

1,013

157

7,270

4,433

687

Other income, net

846

(4,862)

(753)

7,405

(3,948)

(611)

Fair value change in warrant liabilities

(9,242)

(1,431)

(9,242)

(1,431)

Loss before income taxes

(117,372)

(525,880)

(81,447)

(311,384)

(639,508)

(99,046)

Income tax benefits

11,914

19,460

3,014

23,942

38,919

6,028

Share of income (loss) in equity method
investments

(1,801)

735

114

(6,082)

123

19

Net loss

(107,259)

(505,685)

(78,319)

(293,524)

(600,466)

(92,999)

Accretion of convertible redeemable preferred
shares

(326,123)

(652,246)

(508,627)

(78,776)

Net loss attributable to ordinary shareholders
of the Company

(433,382)

(505,685)

(78,319)

(945,770)

(1,109,093)

(171,775)

Net loss per ordinary share:

Basic

(23.07)

(13.47)

(2.09)

(50.35)

(39.30)

(6.09)

Diluted

(23.07)

(13.47)

(2.09)

(50.35)

(39.30)

(6.09)

Weighted average number of shares used in
calculating net loss per ordinary share

Basic

18,782,620

37,552,443

37,552,443

18,782,620

28,219,382

28,219,382

Diluted

18,782,620

37,552,443

37,552,443

18,782,620

28,219,382

28,219,382

Net loss

(107,259)

(505,685)

(78,319)

(293,524)

(600,466)

(92,999)

Foreign currency translation adjustments

16

2,427

376

(614)

2,152

333

Total comprehensive loss

(107,243)

(503,258)

(77,943)

(294,138)

(598,314)

(92,666)

Accretion of convertible redeemable preferred
shares

(326,123)

(652,246)

(508,627)

(78,776)

Total comprehensive loss attributable to
ordinary shareholders

(433,366)

(503,258)

(77,943)

(946,384)

(1,106,941)

(171,442)


AIHUISHOU INTERNATIONAL CO. LTD.

UNAUDITED CONDENSED CONSOLIDATED STATEMENTS OF OPERATIONS AND COMPREHENSIVE LOSS (CONTINUED)

(Amounts in thousands, except share and per share and otherwise noted)

Three months ended June 30,

Six months ended June 30,

2020

2021

2020

2021

RMB

RMB

US$

RMB

RMB

US$

(1) Includes share-based compensation expenses as follows:

Fulfillment expenses

(42,491)

(6,581)

(42,491)

(6,581)

Selling and marketing expenses

(26,264)

(4,068)

(26,264)

(4,068)

General and administrative expenses

(282,070)

(43,686)

(282,070)

(43,686)

Technology and content expenses

(27,580)

(4,272)

(27,580)

(4,272)

(2) Includes amortization of intangible assets resulting from
assets and business acquisitions as follows:

Selling and marketing expenses

(77,766)

(76,258)

(11,811)

(156,286)

(152,517)

(23,622)

Technology and content expenses

(1,580)

(1,580)

(245)

(3,160)

(3,160)

(489)


Reconciliations of GAAP and Non-GAAP Results

(Amounts in thousands, except share and per share and otherwise noted)

Three months ended June 30,

Six months ended June 30,

2020

2021

2020

2021

RMB

RMB

US$

RMB

RMB

US$

Loss from operations

(115,974)

(507,276)

(78,566)

(314,920)

(618,686)

(95,822)

Add:

Share-based compensation expense

378,405

58,607

378,405

58,607

Amortization of intangible assets resulting from business
acquisitions

79,346

77,838

12,056

159,446

155,677

24,111

Adjusted loss from operations

(36,628)

(51,033)

(7,903)

(155,474)

(84,604)

(13,104)

Net loss

(107,259)

(505,685)

(78,319)

(293,524)

(600,466)

(92,999)

Add:

Share-based compensation expense

378,405

58,607

378,405

58,607

Amortization of intangible assets resulting from business
acquisitions

79,346

77,838

12,056

159,446

155,677

24,111

Fair value change in warrant liabilities

9,242

1,431

9,242

1,431

Less:

Tax effect of amortization of intangible assets resulting from
business acquisitions

(11,914)

(19,460)

(3,014)

(23,942)

(38,919)

(6,028)

Adjusted net loss

(39,827)

(59,660)

(9,239)

(158,020)

(96,061)

(14,878)

Adjusted net loss per ordinary share:

Basic

(2.12)

(1.59)

(0.25)

(8.41)

(3.40)

(0.53)

Diluted

(2.12)

(1.59)

(0.25)

(8.41)

(3.40)

(0.53)

Weighted average number of shares used in calculating net
loss per ordinary share

Basic

18,782,620

37,552,443

37,552,443

18,782,620

28,219,382

28,219,382

Diluted

18,782,620

37,552,443

37,552,443

18,782,620

28,219,382

28,219,382


Senmiao Technology Reports Fiscal 2022 First Quarter Financial Results

CHENGDU, China, Aug. 17, 2021 — Senmiao Technology Limited ("Senmiao") (NASDAQ: AIHS), a provider of automobile transaction and related services targeting the online ride-hailing industry in China as well as an operator of its own online ride-hailing platform, today announced financial results for its fiscal 2022 first quarter ended June 30, 2021.

Fiscal 2022 First Quarter Financial and Operating Highlights

  • Total revenues of $1.9 million, an increase of approximately 61% from $1.1 million in the prior-year period, primarily as a result of increased operating lease revenues from automobile rentals as Senmiao has shifted its focus to this business in direct response to the COVID-19 pandemic.
  • Net loss from continuing operations of $7.4 million, compared with $2.3 million from the prior-year period, primarily due to increased cost of revenue, operating expenses and other expense related to the development and services provided on Senmiao’s new online ride-hailing platform.
  • From October 23, 2020, the date Senmiao launched its online ride-hailing platform, to June 30, 2021, 10.5 million rides were completed through the platform with fares paid by riders totaling $31.4 million.

Management Commentary

Xi Wen, Chairman, Chief Executive Officer and President of Senmiao, stated, "Our online ride-hailing platform continued to ramp its growth since its launch in last October. We achieved 61% growth on the top line during the fiscal 2022 first quarter, primarily driven by increased operating lease revenues from automobile rentals, which accounted for the majority of our total revenues. During the period, we were pleased to see the public health situation continue to improve in a post-pandemic recovery. We anticipate operating lease revenues from automobile rentals will continue to account for most of our revenues with our online ride-hailing platform services making steady contributions over the next 12 months."

Mr. Wen continued, "We feel there is a natural symmetry where Senmiao can leverage our online ride-hailing platform and improve utilization of automobiles under our operating leases. This year, we launched the platform in Guangzhou, China’s third-largest city, in late March, as well as in the smaller cities of Nanchong and Panzhihua in June. As a result of our expansions into new cities and valued partnerships, approximately 6 million rides have been completed using Senmiao’s platform, generating gross fares of approximately $18 million, during the three months ended June 30, 2021."

"We remain confident in the long-term prospects of the online ride-hailing industry despite some setbacks caused by recent COVID-19 resurgences in Guangzhou and Chengdu, which resulted in local governments implementing travel restrictions and lockdowns. We continue to deepen our relationships with our key industry partners and anticipate further expansion into more cities in China this year. We believe the acceleration of our platform’s growth will benefit the automobile rentals business as more individuals look to transition into ride-hailing as a profession. We look forward to supporting a growing population of ride-hailing drivers as the industry continues to expand across the country."

Financial Review

Revenues

Total revenues were $1.9 million for the fiscal first quarter ended June 30, 2021, an increase of 61% from $1.1 million in the prior-year period. The increase was largely due to increased operating lease revenues from Senmiao’s automobile rental business, which was partially offset by lack of revenue contributions from automobile sales and facilitation of automobile transaction and financing during the period.

Cost of Revenues

Cost of revenues increased to $3.8 million for the fiscal first quarter ended June 30, 2021, compared to $0.8 million in the prior fiscal year, primarily due to a $1.4 million increase in cost of automobiles under operating leases and a $1.9 million increase in direct expense and technical service fees related to Senmiao’s online ride-hailing platform, as a result of the commencement and expansion of those two businesses.

Gross Profit (Loss)

Gross loss was $1.9 million for the fiscal first quarter ended June 30, 2021, compared to gross profit of $0.3 million in the prior-year period, due to the decreased number of automobiles sold and facilitated new automobile purchases. Senmiao has focused on operating leases to mitigate the impact of the return of automobiles by a substantial number of drivers and the intense competition in the online ride-hailing market in Chengdu and Changsha since 2020. As noted above, Senmiao incurred increased cost of revenues related to the launch of its online ride-hailing platform. It also paid additional cash incentives to attract drivers to its platform.

Selling, General and Administrative Expenses

Selling, general and administrative expenses increased to $3.7 million for the fiscal first quarter ended June 30, 2021, compared to $2.0 million in the prior-year period. The increase was mainly attributable to a $0.7 million increase in salary and employee benefits as Senmiao’s employee headcount increased from 179 to 347, a $0.8 million increase in advertising and promotion expenses for online ride-hailing platform services, and a $0.4 million increase for office expenses, professional service fees such as financial, legal and market consulting, and other miscellaneous expenses, partially offset by a $0.3 million decrease in amortization of automobiles that were rendered to Senmiao but have not been sub-leased as Senmiao leased more automobiles during this quarter than in the prior-year period.

Net Loss

Net loss from Senmiao’s continuing operations for the fiscal first quarter ended June 30, 2021, was $7.4 million, compared to $2.3 million in the prior-year period, which was primarily the result of the increased cost of revenues and increased selling, general and administrative expenses mentioned above, as well as a $1.1 million decrease in change in fair value of derivative liabilities related to warrants issued in Senmiao’s most recent registered direct offering.

Loss per Share

Loss per share for continuing operations was approximately $0.12 based on a weighted average number of basic and diluted common stock of 52.7 million, compared to approximately $0.07 based on a weighted average number of basic and diluted common stock of 29.0 million.

Financial Position

As of June 30, 2021, Senmiao had cash and cash equivalents of $4.0 million, compared to $4.4 million as of March 31, 2021. The Company’s business is capital intensive, and management is taking steps to alleviate the working capital deficit.

Further information regarding Senmiao’s results of operations for the quarter ended June 30, 2021 can be found in Senmiao’s website, which will be filed with the Securities and Exchange Commission.

About Senmiao Technology Limited

Headquartered in Chengdu, Sichuan Province, Senmiao provides automobile transaction and related services including sales of automobiles, facilitation and services for automobile purchase and financing, management, operating lease, guarantee and other automobile transaction services as well as operates its own ride-hailing platform aimed principally at the growing online ride-hailing market in Senmiao’s areas of operation in China. For more information about Senmiao, please visit: http://www.senmiaotech.com. The Company routinely provides important information on its website.

Cautionary Note Regarding Forward-Looking Statements 

This press release contains forward-looking statements as defined by the Private Securities Litigation Reform Act of 1995. These forward-looking statements (including statements concerning the development of Senmiao’s automobile transaction, financing, rental and related services and online ride-hailing platform, the Chinese ride-hailing and automobile financial leasing markets, Senmiao’s plans, objectives, goals, strategies, and performance, and the impact of COVID-19 on Senmiao’s business), as well as the assumptions such statements and other statements that are not statements of historical facts are subject to significant risks, uncertainties and assumptions, including those detailed from time to time in the Senmiao’s filings with the SEC, and represent Senmiao’s views only as of the date they are made and should not be relied upon as representing Senmiao’s views as of any subsequent date. Senmiao undertakes no obligation to publicly revise any forward-looking statements to reflect changes in events or circumstances. 

For more information, please contact:

At the Company:

Yiye Zhou
Email: edom333@ihongsen.com 
Phone: +86 28 6155 4399

Investor Relations:

The Equity Group Inc. 
Adam Prior, Senior Vice President
(212) 836-9606
aprior@equityny.com 

In China
Lucy Ma, Associate
+86 10 5661 7012
lma@equityny.com 

© 2021 Senmiao Technology Ltd.  All rights reserved.


SENMIAO TECHNOLOGY LIMITED

UNAUDITED CONDENSED CONSOLIDATED BALANCE SHEETS

(Expressed in U.S. dollar, except for the number of shares)

June 30, 2021

March 31, 2021

(Unaudited)

ASSETS

Current assets

Cash, and cash equivalents

$

4,037,518

$

4,448,075

Accounts receivable, net, current portion

1,284,226

1,437,195

Inventories

255,954

127,933

Finance lease receivables, net, current portion

501,482

541,605

Prepayments, other receivables and other assets, net

4,560,491

3,905,278

Due from related parties

38,333

39,572

Current assets – discontinued operations

54,255

393,348

Total current assets

10,732,259

10,893,006

Property and equipment, net

Property and equipment, net

5,574,939

3,700,147

Property and equipment, net – discontinued operations

5,592

Total property and equipment, net

5,574,939

3,705,739

Other assets

Operating lease right-of-use assets, net

452,035

499,221

Operating lease right-of-use assets, net, related parties

718,804

580,367

Financing lease right-of-use assets, net

3,889,841

4,778,772

Intangible assets, net

935,122

968,131

Goodwill

135,388

Accounts receivable, net, noncurrent

111,591

269,183

Finance lease receivables, net, noncurrent

337,885

473,472

Total other assets

6,445,278

7,704,534

Total assets

$

22,752,476

$

22,303,279

LIABILITIES AND EQUITY DEFICIENCY

Current liabilities

Borrowings from financial institutions

$

451,742

$

310,662

Accounts payable

184,113

44,769

Advances from customers

154,779

155,586

Income tax payable

17,666

17,408

Accrued expenses and other liabilities

8,704,888

6,655,592

Due to related parties and affiliates

485,301

352,827

Operating lease liabilities

112,977

209,644

Operating lease liabilities – related parties

410,582

243,726

Financing lease liabilities

5,195,122

5,172,943

Derivative liabilities

6,164,941

1,278,926

Current liabilities – discontinued operations

934,524

2,336,861

Total current liabilities

22,816,635

16,778,944


SENMIAO TECHNOLOGY LIMITED

UNAUDITED CONDENSED CONSOLIDATED BALANCE SHEETS(CONTINUED)

(Expressed in U.S. dollar, except for the number of shares)

June 30, 2021

March 31, 2021

(Unaudited)

Other liabilities

Borrowings from financial institutions, noncurrent

40,062

44,962

Operating lease liabilities, non-current

249,017

263,708

Operating lease liabilities, non-current – related parties

407,296

341,549

Financing lease liabilities, non-current

1,734,107

2,256,553

Deferred tax liability

45,659

44,993

Total other liabilities

2,476,141

2,951,765

Total liabilities

25,292,776

19,730,709

Commitments and contingencies

Stockholders’ equity (deficiency)

Common stock (par value $0.0001 per share, 100,000,000
shares authorized; 55,356,670 and 49,780,725 shares issued
and outstanding at June 30, 2021 and March 31, 2021, respectively)

5,536

4,978

Additional paid-in capital

43,031,107

40,755,327

Accumulated deficit

(40,313,536)

(34,064,921)

Accumulated other comprehensive loss

(845,908)

(838,671)

Total Senmiao Technology Limited stockholders’ equity

1,877,199

5,856,713

Non-controlling interests

(4,417,499)

(3,284,143)

Total equity (deficiency)

(2,540,300)

2,572,570

Total liabilities and equity (deficiency)

$

22,752,476

$

22,303,279


SENMIAO TECHNOLOGY LIMITED

UNAUDITED CONDENSED CONSOLIDATED STATEMENTS OF OPERATIONS AND COMPREHENSIVE LOSS

(Expressed in U.S. dollar, except for the number of shares)

For the Three Months Ended

June 30, 

2021

2020

(Unaudited)

(Unaudited)

Revenues

$

1,850,075

$

1,146,916

Cost of revenues

(3,779,346)

(800,256)

Gross profit (loss)

(1,929,271)

346,660

Operating expenses

Selling, general and administrative expenses

(3,683,277)

(1,960,425)

Provision for doubtful accounts, net of recovery

(45,553)

(128,612)

Impairments of long-lived assets and goodwill

(164,257)

Total operating expenses

(3,893,087)

(2,089,037)

Loss from operations

(5,822,358)

(1,742,377)

Other expense

Other expense, net

(56,659)

(6,076)

Interest expense

(14,696)

(20,648)

Interest expense on finance leases

(107,639)

(226,177)

Change in fair value of derivative liabilities

(1,369,284)

(282,980)

Total other expense, net

(1,548,278)

(535,881)

Loss before income taxes

(7,370,636)

(2,278,258)

Income tax expense

(6,272)

Net loss from continuing operations

(7,370,636)

(2,284,530)

Net loss from discontinued operations, net of applicable income taxes

(85,654)

Net loss

(7,370,636)

(2,370,184)

Net loss attributable to non-controlling interests from continuing operations

1,122,021

389,699

Net loss attributable to stockholders

$

(6,248,615)

$

(1,980,485)

Net loss

$

(7,370,636)

$

(2,370,184)

Other comprehensive income (loss)

Foreign currency translation adjustment

(18,572)

11,717

Comprehensive loss

(7,389,208)

(2,358,467)

less: Total comprehensive loss attributable to noncontrolling interests

(1,133,356)

(387,386)

Total comprehensive loss attributable to stockholders

$

(6,255,852)

$

(1,971,081)

Weighted average number of common stock

Basic and diluted

52,731,560

29,008,818

Loss per share – basic and diluted

Continuing operations

$

(0.12)

$

(0.07)

Loss per share –

Discontinued operations

$

$

(0.00)


SENMIAO TECHNOLOGY LIMITED

UNAUDITED CONDENSED CONSOLIDATED STATEMENTS OF CASH FLOWS

(Expressed in U.S. dollar, except for the number of shares)

For the Three Months Ended

June 30, 

2021

2020

(Unaudited)

(Unaudited)

Cash Flows from Operating Activities:

Net loss

$

(7,370,636)

$

(2,370,184)

Net loss from discontinued operations

(85,654)

Net loss from continuing operations

(7,370,636)

(2,284,530)

Adjustments to reconcile net loss to net cash used in operating activities:

Depreciation and amortization of property and equipment

211,588

58,085

Amortization of right-of-use assets

1,182,825

880,785

Amortization of intangible assets

37,340

20,814

Provision for doubtful accounts, net of recovery

45,553

128,612

Impairments of long-lived assets and goodwill

164,257

Change in fair value of derivative liabilities

1,369,284

282,980

Change in operating assets and liabilities

Accounts receivable

302,036

(94,912)

Inventories

(126,111)

(10,647)

Prepayments, other receivables and other assets

(1,186,463)

365,804

Finance lease receivables

190,695

(74,350)

Accounts payable

843,054

3,609

Advances from customers

(3,108)

42,437

Income tax payable

60

Accrued expenses and other liabilities

1,896,615

564,708

Operating lease liabilities

(118,341)

(81,842)

Operating lease liabilities – related parties

33,877

(18,502)

Net cash used in operating activities from continuing operations

(2,527,535)

(216,889)

Net cash (used in) provided by operating activities from discontinued operations

(1,107,924)

183,832

Net Cash Used in Operating Activities

(3,635,459)

(33,057)

Cash Flows from Investing Activities:

Purchases of property and equipment

(2,072,779)

(4,891)

Net cash used in investing activities from continuing operations

(2,072,779)

(4,891)

Net cash used in investing activities from discontinued operations

(1,395)

(70)

Net Cash Used in Investing Activities

(2,074,174)

(4,961)

Cash Flows from Financing Activities:

Net proceeds from issuance of common stock and warrants in a registered direct
public offering

5,771,053

Net proceeds from issuance of common stock upon warrants exercised

22,015

Borrowings from financial institution

258,001

122,406

Loan to related party

(8,654)

(19,693)

Borrowings from related parties and affiliates

125,493

Repayments to related parties and affiliates

(4,155)

Repayments of current borrowings from financial institutions

(127,098)

(23,739)

Principal payments of finance lease liabilities

(718,648)

(376,670)

Net cash provided by (used in) financing activities from continuing operations

5,322,162

(301,851)

Net cash provided by financing activities from discontinued operations

7,233

Net Cash Provided by (Used in) Financing Activities

5,322,162

(294,618)


SENMIAO TECHNOLOGY LIMITED

UNAUDITED CONDENSED CONSOLIDATED STATEMENTS OF CASH FLOWS(CONTINUED)

(Expressed in U.S. dollar, except for the number of shares)

For the Three Months Ended

June 30, 

2021

2020

(Unaudited)

(Unaudited)

Effect of exchange rate changes on cash and cash equivalents

(23,086)

10,239

Net decrease in cash and cash equivalents

(410,557)

(322,397)

Cash and cash equivalents, beginning of period

4,448,075

844,028

Cash and cash equivalents, end of period

4,037,518

521,631

Less: Cash and cash equivalents from discontinued operations

(5,033)

Cash and cash equivalents from continuing operations, end of period

$

4,037,518

$

516,598

Supplemental Cash Flow Information

Cash paid for interest expense

$

14,696

$

20,648

Cash paid for income tax

$

$

Non-cash Transaction in Investing and Financing Activities

Recognition of right-of-use assets and lease liabilities

$

$

1,780,027

Recognition of right-of-use assets and lease liabilities, related parties

$

298,628

$

Acquisition of equipment through prepayment and financing lease receivables offset

$

$

85,455

Allocation of fair value of derivative liabilities for issuance of common stock
proceeds

$

3,562,404

$

Allocation of fair value of derivative liabilities to additional paid in capital upon
warrants exercised

$

45,674

$


Related Links :

http://www.senmiaotech.com

Under the Patronage of His Highness Sheikh Theyab bin Mohamed bin Zayed Al Nahyan, Abu Dhabi Early Childhood Authority’s WED Movement Engages Global Experts to Drive Innovation, Excellence in Early Childhood Development

ABU DHABI, UAE, Aug. 17, 2021Abu Dhabi’s World Early Childhood Development Movement (WED Movement) has launched a new initiative bringing together global experts to develop innovative and actionable solutions advancing Abu Dhabi’s vision to be a leader in Early Childhood Development.

Cecilia Vaca Jones, Executive Director of the Bernard van Leer Foundation, and Chair of the BWG

WED Movement was established earlier this year under the patronage of His Highness Sheikh Theyab bin Mohamed bin Zayed Al Nahyan, Chairman of Abu Dhabi Crown Prince Court and Chairman of the Abu Dhabi Early Childhood Authority (ECA). Under ECA, WED Movement is harnessing the expertise of a multidisciplinary group of 21 early child development experts representing a mix of academics, healthcare practitioners, policy influencers, children’s media and entertainment specialists, global business leaders and technical consultants. The experts come from several world-renowned institutions such as UNICEF, World Bank, UNESCO and Harvard University, as well as a number of global companies in technology and entertainment.

Participants are working in one of three Breakthrough Working Groups (BWGs), each focused on a unique and important aspect of how children’s mental, physical and cognitive abilities develop in the earliest years of life, from pregnancy to 8 years old. The BWGs are focused on Emotional Wellbeing & Social Interaction, Tech Humanity for Children, and 21st Century Lifestyle.

To date the BWGs have held nearly 100 strategic planning sessions and met with more than 65 parents, children, teachers and ECD experts in the UAE as part of their work towards creation of a series of innovative solutions that promote the holistic healthy development of Abu Dhabi’s young children. These solutions will also help parents and caregivers address some of the most common challenges faced during the earliest years of child growth and development. Outcomes from these sessions include policy recommendations, creation of specific programs and initiatives, development of products, as well as guidelines to address the identified issues.

Team members are coordinating directly with a range of government and social service entities, including Abu Dhabi Department of Community Development, Abu Dhabi Department of Health, Abu Dhabi Department of Education and Knowledge and Zayed Higher Organization for People of Determination. They also have commissioned independent research on such issues as child screen time, technology use in the home, play time and social interaction. 

WED Movement and the work of the BWGs reflects Abu Dhabi’s commitment to deliver on its vision to invest in breakthrough innovation in early childhood development with the goal of nurturing a generation of conscious youth who have the knowledge and skills to adapt to rapidly changing societal challenges and contribute to building a better society. The BWGs aim to play a significant role driving the level of innovation needed while helping establish Abu Dhabi as a global role model for and contributor to excellence in early childhood development. 

The BWGs work under the guidance of Cecilia Vaca Jones, Executive Director of the Bernard van Leer Foundation, and Chair of the BWG, alongside His Excellency Omar Saif Ghobash, Assistant Minister for Cultural Affairs at the UAE Ministry of Foreign Affairs and International Cooperation (MoFAIC), and Co-Chair of the BWG.

Chair Cecilia Vaca-Jones said: "This Breakthrough Working Group approach enables us to tap into a global collection of world-class early childhood development experts with a single mission and focus: helping Abu Dhabi create the best possible environment to give our children the opportunity in life each and every one deserves. And these new programs, policies and initiatives that we pioneer here at home can become models for early childhood development that are adopted in nations around the world."

The BWGs are currently researching and assessing issues as well as exploring potential solutions related to the following themes:

  • Emotional Wellbeing and Social Interaction: Creating an ecosystem that can help reduce emotional strains on children, parents and caregivers while promoting continuous interactions with children that help them establish important social interaction skills at early ages.
  • Tech Humanity for Children: Looking at how to ensure that children are ready for the rapidly growing level of technology in their lives and are well aware of and protected from risks in order to best reap the many benefits these new technologies offer.
  • 21st Century Lifestyle: Fostering an Abu Dhabi-wide environment that promotes a better lifestyle at home, in school and across the community and facilitates positive physical and mental health of children.

Co-Chair H.E. Omar Saif Ghobash said: "These themes represent both challenges and opportunities for fostering early childhood development not only in Abu Dhabi but across the UAE and worldwide. Through this team of experts and the BWG approach, we will look to generate recommended programs, policies and initiatives that can have a positive impact across the early childhood development ecosystem on behalf of our children, including parents and caregivers, academia, government policymakers, social support groups and the private sector."

Dr. Nikki Martyn, Program Head of Early Childhood Studies at the University of Guelph-Humber and a member of the one of the BWGs said: "Being a part of WED Movement is a truly unique opportunity to take the learnings and experiences of early childhood development experts from around the world and develop initiatives and recommendations that can quickly be put in place to directly benefit the children of Abu Dhabi. Over the longer term, we hope to see the outcomes of WED Movement work benefitting children around the world."


Omar Saif Ghobash, Assistant Minister for Cultural Affairs at the UAE Ministry of Foreign Affairs and International Cooperation, and Co-Chair of the BWG


Macronix ArmorFlash NOR Flash Earns PSA Certified Level 1 Status

NOR Flash Achieves Security Consortium’s Device-Level Certification

HSINCHU, Aug. 16, 2021 — Macronix International Co., Ltd. (TSE: 2337), a leading integrated device manufacturer in the non-volatile memory (NVM) market, today announced its ArmorFlash™ MX75 series NOR Flash received PSA Certified Level 1 status at the device level, where the NOR Flash is integrated within a larger system. Achieving the PSA Certified distinction at the device level ensures designers have high degrees of security when selecting ArmorFlash MX75 memories for demanding applications such as Internet of Things (IoT) and other systems requiring robust data security.

PSA Certified’s webpage on the ArmorFlash MX75 can be viewed at: www.psacertified.org/products/armorflash-mx75-series.

ArmorFlash is Macronix’s family of highly secure and configurable NOR Flash devices for code and data storage used in a broad array of applications: IoT, automotive, computing, industrial, healthcare, wearables, smart homes, and smart cities. The devices include both standard and advanced security features and are available in a range of densities and temperature grades.

Founded by a diverse roster of industry luminaries including semiconductor and software design leader Arm and six other security-certification specialists, PSA Certified offers a concise security framework for connected devices, from analysis through to assessment and certification. The multi-stage certification process aims to mitigate fragmentation of IoT requirements and eliminate security threats as barriers to product development.

"The IoT ecosystem is expanding at an astounding rate, and with that growth comes the enticement for ‘bad actors’ to prey on the billions of devices that comprise it," said Macronix Vice President of Marketing F.L. Ni. "Data storage is particularly alluring, given its rich collection of information. That’s why Macronix is as committed as ever to ensuring our NOR Flash solutions, such as the ArmorFlash MX75, are designed for optimal security. Toward that, we’ve worked diligently with PSA Certified to achieve device-level certification and provide designers with the verified assurance of security."

Security remains a top priority throughout the IoT market, as more than 20 billion devices are expected to be deployed by the year 2025. A survey of several-hundred security professionals found that more than fourth-fifths of organizations have IoT devices on their corporate networks, yet over half had insufficient security measures.*

A recent TechOnline webinar presented by Macronix Senior Technical Marketing Manager Jim Yastic and Arm System Architect Andrew Jones, titled Secure Flash Memory in Emerging Electronic Systems: Automotive Markets, Applications, Use Case Scenarios, highlights ArmorFlash and PSA Certified evaluations’ importance to automotive applications. It can be viewed here.

For more information on the ArmorFlash MX75 and Macronix’s entire NOR Flash solutions, please go to www.macronix.com/en-us/products/Pages/ArmorFlash.aspx.

About Macronix

Macronix, a leading integrated device manufacturer in the non-volatile memory (NVM) market, provides a full range of NOR Flash, NAND Flash, and ROM products. With its world-class R&D and manufacturing capability, Macronix continues to deliver high-quality, innovative and performance-driven products to its customers in the consumer, communication, computing, automotive, networking and other market segments. Find out more at www.macronix.com.

ArmorFlash is a trademark of Macronix International Co., Ltd. 

* conducted by Extreme Networks

Samsung Galaxy Fold3 & Flip3 Pre-order and Prices Revealed for Malaysia

Samsung’s new foldable devices have only just been announced and we’ve already got details for their Malaysian pre-orders. The new foldable smartphones are Samsung’s latest step in creating a new normal for smartphones. The Galaxy Z duo seems to be incorporating some of the most wanted features into the new generation with IPX8 and the S Pen. Of course, you can get all the details in our Galaxy Z Fold3 and Flip3 articles.

galaxyzflip3 5g cream

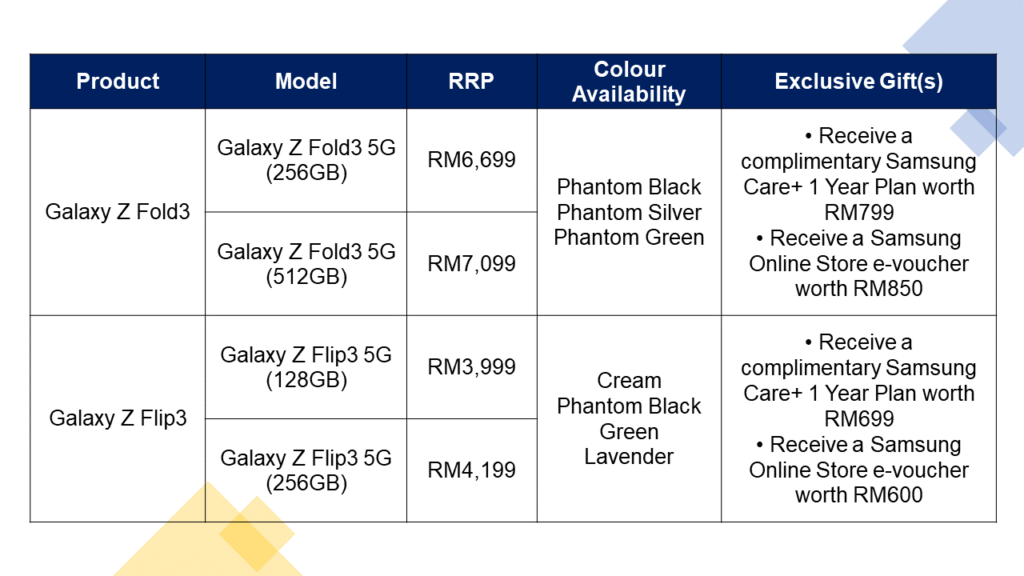
The foldable smartphones will be going on pre-order in Malaysia starting on 19 August 2021 until 21 August 2021. Of course, as always, Samsung is offering special pre-order freebies. All preorders of the Galaxy Z Fold3 and Flip3 will come with a complimentary year Samsung Care+ and an e-voucher for the Samsung Online Store.

Prices for the Fold3 start at MYR6,699 for the 256GB version and MYR7,099 for the 215GB version. The Flip3 starts at MYR3,999 for the 128GB version and MYR4,199 for the 256GB version.

Samsung Galaxy Z Fold3 Preorder

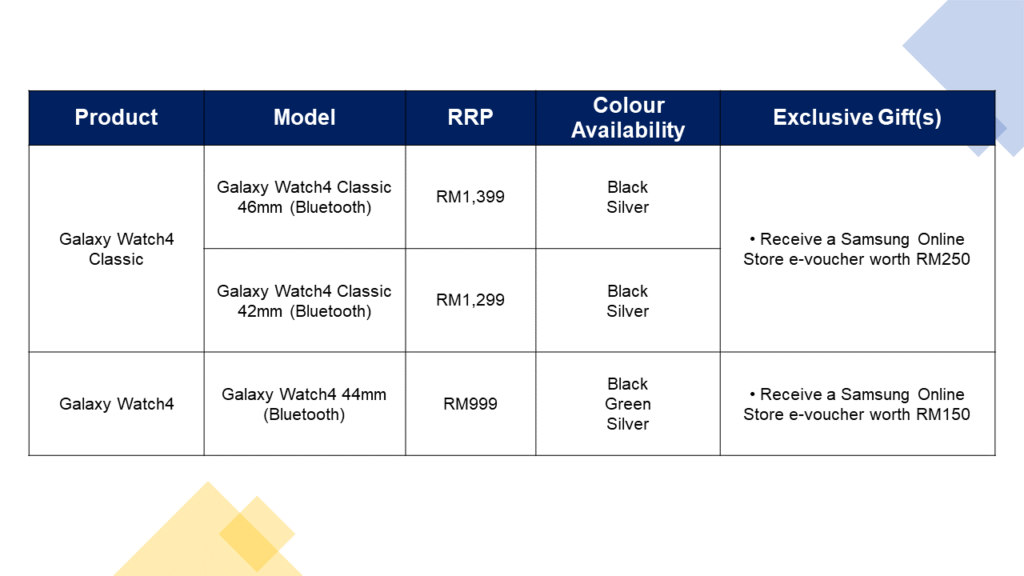
Together with the Galaxy Z series, the Samsung Galaxy Watch4 series is also going to be available for pre-order. Each pre-order of the Galaxy Watch4 Classic will be entitled to an e-voucher worth MYR250. The Galaxy Watch4, on the other hand, will be entitled to an e-voucher worth MYR150. Like the Galaxy Z series, the Galaxy Watch4 series freebies will only be usable on the Samsung Online Store.

Samsung Galaxy Watch4 pre order

The Galaxy Buds2 will also be available for purchase. It will be priced at MYR499.

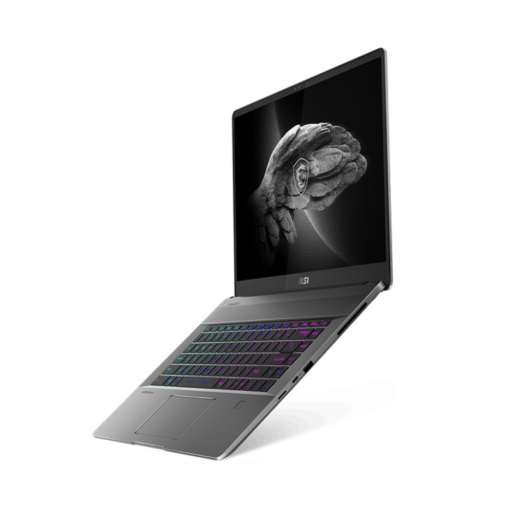
MSI’s Creator Z16 Notebook PC Lands in Malaysia

High-performance computing is the name of the game for MSI. For the longest time, they have been the name to beat too when it comes to high-performance gaming rigs. This includes their line of very powerful and very desirable gaming laptops.

Of late though, high-performance PCs are not just about playing games at high framerates and ultra-realistic graphics. It is also about creating contents that can live up to demands of the modern world. High-performance machines are not just about getting the most out of your games anymore, it is about making your workflow more effective and efficient.

Earlier in the year, MSI launched their new line of notebook PCs created for creators. The new line-up of creator notebook PCs combines the power of Intel’s latest and greatest with NVIDIA’s most powerful Ampere architecture for a performance like no other. At the same time, the svelte, stealth look of the notebook combined with fans designed to work as quietly as possible while maintaining optimal temperatures ensures that the MSI fits into any working environment.

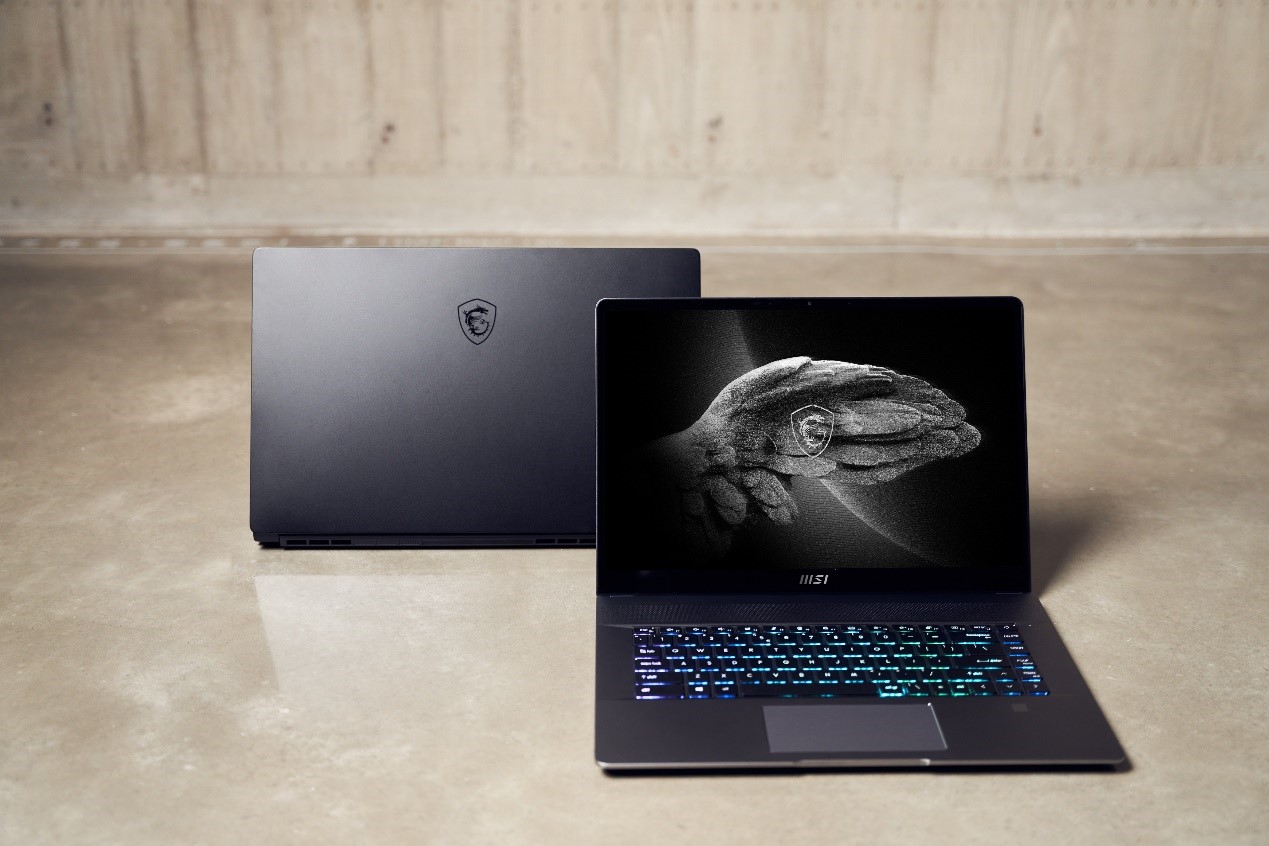
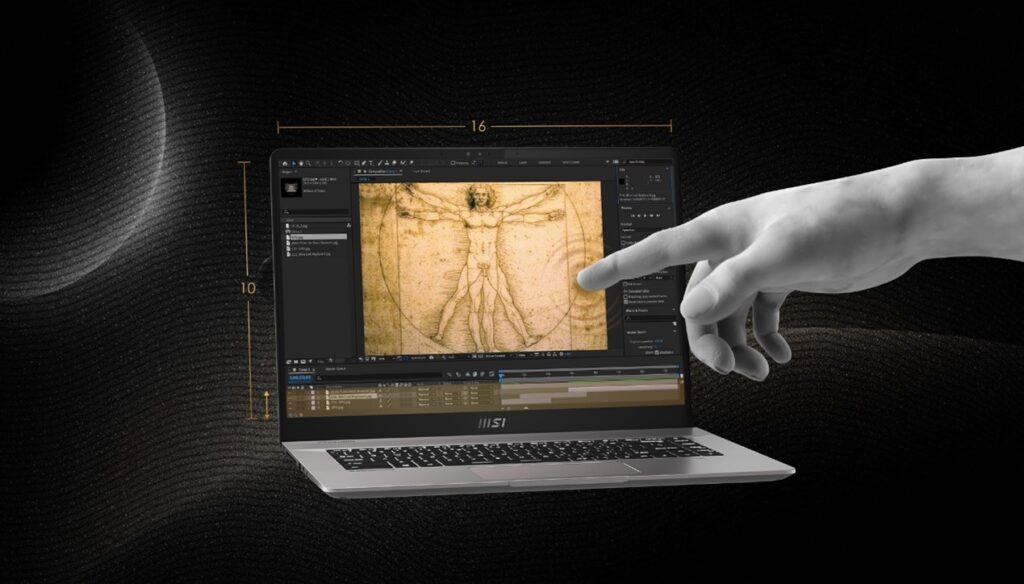
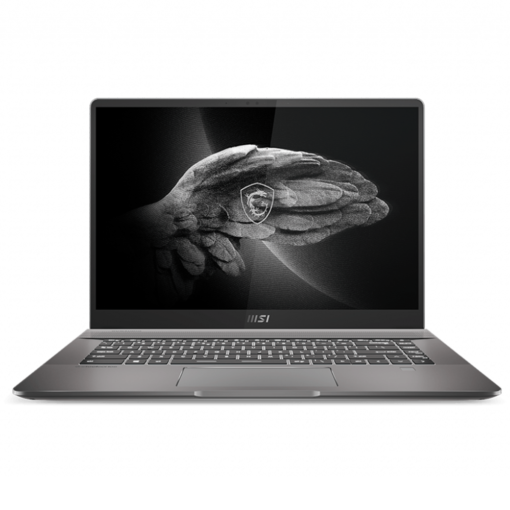
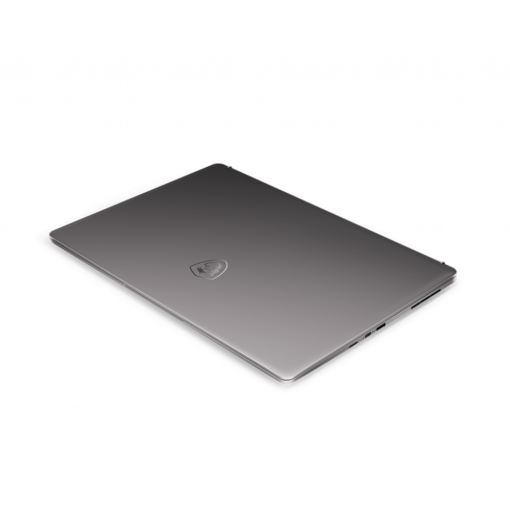
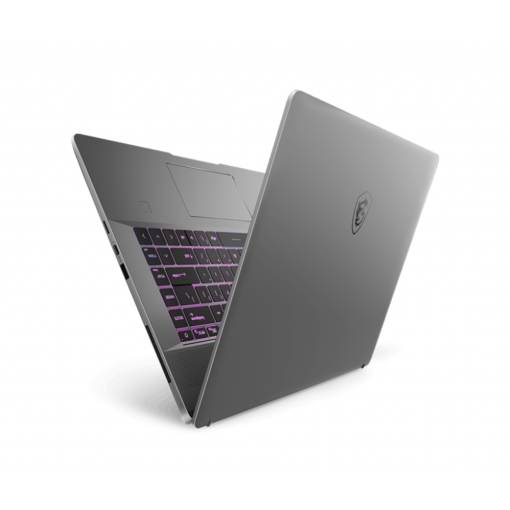
Today, MSI introduces its new line-up of ‘made for creator’ notebooks in the Creator Z16. Aside from the familiar MSI logo, there is nothing to indicate the power that is hidden within its aluminium body. It even looks like a modern unassuming thin and light notebook PC.

CREATORZ16 2
Source: MSI

Fire it up though and you get a completely different story from its external façade. The first thing that greets you is a brilliant 16-inch display that boasts 2,560 by 1,600 pixels (QHD) at a 16:10 aspect ratio. The 16-incher boasts 100% coverage of the DCI-P3 colour gamut with ΔE<2 in colour accuracy. That also means what you see is what you get on the MSI Creator Z16’s True Colour display. To get the best out of your creative mind, the 120Hz refresh rate display is a touch sensitive panel.

Of course, a high-resolution and fast display has to be matched by its powerful internals. The Creator Z16 boasts Intel’s latest 11th Generation Core i7 that clocks at up to 4.6Ghz on turbo. The new generation CPU is also paired with a new generation NVIDIA GeForce RTX 3060 with Max-Q design. The combination of the two processing chips means that the Creator Z16 is perfect for any sort of creative work on-the-go. With up to 16GB in RAM, you can edit 8K HDR videos smoothly and quickly, very important when you have a short deadline, and you need to be moving about for your shoots. You do not even need to lug around an extra backup drive for in your haul, because the Creator Z16 comes with 1TB of NVMe PCIe Gen4 SSD. The only downside is that you have no more excuses for not meeting your deadline.

  • z16 1 510x510 1
  • z16 5 510x510 1
  • z16 3 510x510 1
  • z16 2 510x510 1
  • z16 4 510x510 1

The MSI Creator Z 16 is now available for pre-order in Malaysia via MSI’s official Lazada Store and their own Online Store. There are no colour choices here, but you are getting a slate grey finish that looks ultra-professional. The MSI Creator Z16 will set you back MYR 11,999. More information on the MSI Creator Z16 is available from their website.