SatLease Capital Announces New Partnership with Blue C Mobile to Streamline SatCom Financing

GENEVA, Dec. 2, 2021 — SatLease Capital (SLC) announced a partnership today with Blue C Mobile, a maritime satellite communications company specializing in providing simple, affordable, and flexible solutions for all industry segments from shipping, passenger, fishing, and O&G. SLC will provide custom-tailored and flexible financing solutions for Blue C Mobile customers. 

Blue C Mobile
Blue C Mobile

"This partnership is truly a symbiotic one," said Mike Seery, Chief Commercial Officer at SatLease Capital. "Both companies are looking to transform the often complicated and expensive process of purchasing maritime satellite telecommunication solutions into a simplified and affordable one."

The newly forged relationship between SatLease Capital and Blue C Mobile is poised to transform how organizations in the Asia Pacific region procure satellite communications equipment. By removing the hurdle of hardware investment, the partnership is eliminating a barrier to entry for customers and enables them to benefit from market leading connectivity solutions without expending large capital investments upfront.

"We are really thrilled about our partnership with SatLease Capital," said Wesley Tham, Chief Executive Officer of Blue C Mobile. "It enables us to further accomplish our mission and serve our clients, particularly those that are not interested or able to make large hardware investments in order to access the latest in satcom technology."

The high upfront capital cost of financing equipment is a major inhibitor of growth for service providers who serve the maritime satellite telecom industry; Blue C Mobile and SatLease Capital hope that their partnership will support service providers in achieving faster business growth whilst enabling them to deliver more cost-effective solutions to their customers than ever before.

About Blue C Mobile:

Blue C Mobile is a satellite service provider that sells affordable and highly flexible airtime plans through a network of professional partners to the maritime market. Founded by a team of passionate and experienced individuals in the maritime industry, Blue C Mobile is determined to make maritime satellite communication easy for all maritime businesses. For more info, visit https://www.blue-c-mobile.com/

About SatLease Capital:

SatLease Capital was founded in 2021 in Geneva, Switzerland by a group of satellite telecom industry and finance top guns with the vision of creating an all-in-one solution for maritime and land enterprise customers seeking a simpler and more efficient way to finance their satellite needs. Through a global network of partners and suppliers, the SatLease Capital squad helps end-users of satellite service providers flexibly finance new satellite equipment. For more info, visit satleasecapital.com/

Nintex Brings Native eSignatures to Nintex Workflow Cloud and Nintex Drawloop®


Organisations in nearly every industry are accelerating their digital transformations with the end-to-end automation capabilities provided by Nintex

MELBOURNE, Australia, Dec. 2, 2021 — Nintex, the global standard for process management and automation, today announced the integration of its native eSignature capability, Nintex AssureSign, within its next generation cloud automation platform, Nintex Workflow Cloud, as well as within its industry-leading document automation app, Nintex Drawloop® DocGen for Salesforce which is available in the AppExchange.

"We are excited to present our global Nintex community of customers and partners with a complete end-to-end automation platform that includes digital forms, workflow, robotic process automation, document generation and now native eSignatures," said Nintex Chief Product Officer Neal Gottsacker. "With the power and ease of Nintex automation software, public and private sector organisations around the world are quickly optimising paper-based processes and automating repetitive tasks to maintain a strategic competitive advantage in our digital-first world."

Nintex AssureSign simplifies the process of securing signatures needed for business-critical agreements with powerful, accessible and secure digital signature capabilities. With Nintex AssureSign’s intuitive drag-and-drop interface, customers rapidly generate ready-to-sign documents, and digitally store their most commonly used signing templates for forms like NDAs, sales agreements and client contracts to expedite the completion of transactions.

Some of Nintex AssureSign’s benefits include:

  • eSign Anywhere: Close deals faster by reaching signers online, via text and across mobile devices or in-person.
  • Security and compliance standards: Execute digital transactions with confidence thanks to Nintex AssureSign’s 256-bit encryption, digital audit trails and ISO 27001 certified data centers.
  • Flexible integrations and custom APIs: Easily integrate Nintex AssureSign with existing business systems and leverage connectors for Salesforce and Microsoft Dynamics CRM.
  • Customisable experiences: Manage, configure and execute a personalised signing process to match the desired customer experience and reflect organisational branding with ease and speed.
  • Transparent pricing: Save money with flexible eSign pricing packages with no hidden fees or overage penalties.

Nintex AssureSign increases organisational efficiencies and lowers operating costs while providing a modern signing experience for every organisation’s most critical stakeholders from customers to employees.

To experience Nintex AssureSign for digital transaction management (DTM), request a demo at https://www.nintex.com/request-demo/

Media Contact 
Laetitia Smith
Nintex
laetitia.smith@nintex.com
cell: +64 21 154 7114

About Nintex
Nintex is the global standard for process management and automation. Today more than 10,000 public and private sector organisations across 90 countries turn to the Nintex Platform to accelerate progress on their digital transformation journeys by quickly and easily managing, automating and optimising business processes. Learn more by visiting www.nintex.com and experience how Nintex and its global partner network are shaping the future of Intelligent Process Automation (IPA).

Product or service names mentioned herein may be the trademarks of their respective owners.

Logo – https://techent.tv/wp-content/uploads/2021/12/nintex-brings-native-esignatures-to-nintex-workflow-cloud-and-nintex-drawloop.jpg


Related Links :

http://www.nintex.com

Huawei Calls for Accelerated Green ICT Growth at Telecom Digital Power Summit APAC 2021

BANGKOK, Dec. 1, 2021 — Huawei Digital Power hosted the Telecom Digital Power Summit APAC 2021 online on November 26, welcoming over 600 viewers from 23 countries. Here, industry and business leaders shared their insights and experiences on carbon neutrality in telecommunication networks and data center facilities.


”Carbon neutrality has become a global consensus and mission. I believe it will be one of the biggest changes in the upcoming 30-40 years. It will not only revolutionize power production and consumption, but also bring opportunities to upgrade all industries as well as rethink our economy and society.” — said Dr. Fang Lianzhou, VP and CMO of Huawei Digital Power.

Carbon neutrality is a growing trend in the global fight against climate change. Huawei Telecom Digital Power Summit APAC 2021 provided a virtual platform to exchange experiences in reducing both carbon emissions and OPEX, helping partners and customers digitalize their energy and go carbon neutral.

The global ICT industry consumed over 570 billion kWh of electricity in 2020 and the figure is expected to reach 1.85 trillion kWh in 2030. In addition, data center facilities and telecommunication networks were responsible for 160 million tons and 146 million tons of carbon emissions in 2020, respectively. It is therefore undeniable that the ICT industry will need to play a major role in reaching carbon neutrality targets.

The Summit looked at the foundation of building green telecommunication networks and data center facilities. Speakers shared their insights, tips, and best practices. Plus, viewers from around the world glimpsed the latest green energy facilities for telecommunication networks and data centers, global best practices, and innovative solutions for new building facilities and modernization.

Ms. Yoly Crisanto, CSO of Globe Telecom — one of the largest and most advanced telecommunication operators in Asia Pacific, shared her experience in 5G deployment and site digitalization. Globe works to actively contribute to 10 out of 17 UN Sustainable Development Goals. This includes several carbon emissions management strategies, such as deploying over 7400 green solutions across the network and modifying 13 key building facilities in the Philippines to run on clean energy. Ms. Crisanto also explained that Globe is significantly reducing its carbon emissions through green energy transformation. Globe Telecom has set a remarkable example for telecommunication operators worldwide, aiming to reduce carbon emissions by 57% or 0.57 million tons by 2030.

Sanjay Kr Sainani, Global SVP & CTO of Huawei Digital Power highlighted key technologies for reduced Carbon Footprint in Data Centers. He said:  "Prefabricated & Modular Construction allow use of recyclable materials, reduced consumption & wastage and shortens time to deploy Data Center Facilities. Huawei has pioneered high efficiency converged power & cooling systems, embedded IoT, AI enabled O&M technologies that have been successfully implemented in Data Centers from China to Ireland to help reduce Data Center life-cycle Carbon footprint"

After the keynote sessions, the audience took a virtual tour of the Huawei Digital Power Innovation Experience Center, learning about the latest digital power solutions as well as the next-generation data center and telecommunication sites in Dongguan and Hangzhou.

The half-day summit brought global audiences together with industry and business leaders. Participants explored innovative solutions in the power industry along with case studies that have adopted leading power technologies in the ICT industry.

Carbon neutrality cannot be achieved if we work alone. Collective efforts are necessary. The impressive turnout at this summit has highlighted global interest in green energy. In response to market demand and increasing push toward clean energy, Huawei will continue to work with customers and partners to integrate and innovate power electronics, energy storage, cloud, and digital technologies to build a better, greener, and smarter world.

Related Links :

http://www.huawei.com/cn

HTC Global Services reveals new brand identity uniting CareTech and Ciber under one brand

TROY, Mich. and CHENNAI, India, Dec. 1, 2021 — HTC Global Services today announced that its companies, including CareTech Solutions and Ciber Inc., are uniting under one name and one brand – HTC Global Services. As part of this effort, the company has adopted a new identity that embodies its renewed ambitions and aspirations. It reflects both the transformation journey and the transformative impact it has for its customers, employees, and stakeholders, now and beyond.

HTC acquired CareTech Solutions, a Healthcare technology leader in North America, in 2014, and Ciber Inc., a global IT consulting services and outsourcing company, in 2017. These acquisitions strengthened and widened HTC’s expertise in emerging technologies, its ability to deliver exceptional customer service with a comprehensive set of services and solutions, and to fulfil its strategic growth objectives across industry verticals.

"At the heart of our decision to unify under a single brand is – as it always has been – our customer and our intention to simplify their experience. We have always championed the power of our three brands, and now we want to communicate our total value in a more compelling way. We will continue to develop and leverage our broad expertise in the many areas our business operates, as well as the specializations we offer," said Madhava Reddy, Founder and CEO, HTC Global Services.

HTC’s new Vision – "Reimagining a better shared world" and its new Mission – "Bring human expertise to tech in order to deliver purposeful solutions that amplify value" is a testament to HTC’s commitment to empower its customers, people, and partners in the era driven by digital transformation as encapsulated by its new motto, and tagline – Let’s make digital change happen.

Commenting on the new brand identity Nitesh Bansal, President, HTC Global Services said, "We are re-energizing our business. By becoming one business and one brand, we are further strengthening the essential focus that we have always had on our customers and sharpening our offerings to better serve their needs of the future. It means that we can extend and deepen our relationships and our human connections. This is what makes us truly unique."

About HTC Global Services

HTC Global Services is a leading global provider of innovative IT and Business Process Services and Solutions. Established in 1990 with headquarters in Troy, Michigan, USA, HTC combines its extensive technical and domain expertise along with its business partner approach to enable clients to realize business transformation and maximize business returns. For more information visit www.htcinc.com

Media Contact: Media.Relations@htcinc.com

Artmarket.com: Ahead of Art Basel Miami 2021, Art Market Gender Parity is Still Wanting; But Could NFTs Change That?


PARIS, Dec. 1, 2021 — Despite the big result for an exceptional (and relatively small) painting by Frida Kahlo, the Mexican artist was still only 18th in Artprice’s ranking of artists by auction turnover for the month of November 2021, behind 17 male artists. And while this trend was completely reversed for the generation of artists born after 1985 (the 8 top-selling signatures were all young women!), we ask: what is the gender parity situation on the NFT market?

Frida Khalo - Courtesy of Organ Museum / Abode of Chaos
Frida Khalo – Courtesy of Organ Museum / Abode of Chaos

thierry Ehrmann, CEO and Founder of Artmarket.com and its Artprice department: "The creation of the NFTs market should be an opportunity to achieve some sort of gender parity on the art market. The technology is revolutionizing an entire industry, as shown by Art Basel Miami Beach which opens its doors this year to Tezos ("home to one of the fastest growing NFT artist communities") and Scope Miami which has decided to issue its VIP invitations in the form of non-fungible tokens".

"World of Women"

It’s only a few years since NFTs first appeared on the web, and only a few months since the general public discovered non-fungible digital tokens; but some have already commented the lack of a female presence in this new world. Several projects have nevertheless been developed to try to correct this imbalance, starting with a collection of exclusively female PFPs (profile pictures) by World of Women: https://opensea.io/collection/world-of-women-nft

"World of Women was created to bring more diversity and inclusiveness to the NFT space while bridging the gap between collectibles and single edition art worlds".

Considering the traditional art market’s long-standing gender disparity, fears of a male-dominated digital world seem perfectly rational. New York’s prestige sales in November – driven by the Macklowe Collection at Sotheby’s and the Cox Collection at Christie’s – were once again dominated by the likes of Warhol, Van Gogh, Picasso, Monet, Twombly, Rothko, Giacometti, Richter, etc.

But things are changing…

Frida Kahlo was the top-selling female artist at the November auctions this year, but she was behind eighteen men. A study published by Ken Bromley Art Supplies in 2020 revealed that the Mexican painter ranked second among the world’s most searched artists on Google (first in 29 countries) behind Leonardo Da Vinci.

Diego y yo (1949) is one of the most important paintings by Frida Kahlo that doesn’t belong to a museum. On 16 November 2021 it fetched $34 million at Sotheby’s, 22 times its previous value in 1990. Although it was a very impressive result for the Mexican artist, Frida Kahlo is still not competing with Andy Warhol, whose signature generated $165 million at the November 2021 prestige auctions.

Top 10 female artists at auction in November 2021

Global ranking – Artist – Auction Turnover

18th – Frida KAHLO (1907-1954):                          

$34,883,000

28th – Agnes MARTIN (1912-2004):                       

$21,765,500

30th – Cecily BROWN (1969- ):                               

$20,706,150

32nd –  Joan MITCHELL (1926-1992):                   

$20,053,500

41st – Georgia O’KEEFFE (1887-1986):                  

$14,561,300

52nd – Yayoi KUSAMA (1929-):                             

$9,198,600

53rd  – Lee BONTECOU (1931-):                            

$9,176,500

58th – Helen FRANKENTHALER (1928-2011):    

$8,177,100

59th – Cindy SHERMAN (1954-):                           

$8,162,100

62nd – Tamara DE LEMPICKA (1898-1980):         

$7,896,300

Over the past decade, female artists under 40 have nevertheless established themselves as the most successful artists of their generation on the auction market. In 2013 – 2014, collectors became enamoured with the work of Tauba Auerbach (1981) represented by the Paula Cooper gallery. This trend has gradually intensified to the point where the turnover ranking of artists born after 1985 (for November 2021) is heavily dominated by female painters.

Top 10 artists born after 1985 at auction in November 2021

Global ranking – Artist – Auction turnover

1st –  Avery SINGER (1987-):                                  

$4,638,900

2nd – Toyin Ojih ODUTOLA (1985-):                     

$2,235,900

3rd – Flora YUKHNOVICH (1990 -):                     

$1,951,100

4th – Jadé FADOJUTIMI (1993-):                           

$1,053,400

5th – Christina QUARLES (1985-):                          

$948,000

6th – Jordan CASTEEL (1989-):                               

$806,500

7th – Issy WOOD (1993-):                                        

$768,750

8th – Allison ZUCKERMAN (1990-):                      

$636,600

9th – Ismail ISSHAQ (1989-):                                  

$589,300

10th – Oscar MURILLO (1986-):                             

$432,900

Copyright 1987-2021 thierry Ehrmann www.artprice.com – www.artmarket.com

About Artmarket:

Artmarket.com is listed on Eurolist by Euronext Paris, SRD long only and Euroclear: 7478 – Bloomberg: PRC – Reuters: ARTF.

Discover Artmarket and its Artprice department on video: www.artprice.com/video

Artmarket and its Artprice department was founded in 1997 by its CEO, thierry Ehrmann. Artmarket and its Artprice department is controlled by Groupe Serveur, created in 1987.

See certified biography in Who’s who ©:
Biographie_thierry_Ehrmann_2022_WhosWhoInFrance.pdf

Artmarket is a global player in the Art Market with, among other structures, its Artprice department, world leader in the accumulation, management and exploitation of historical and current art market information in databanks containing over 30 million indices and auction results, covering more than 770,000 artists.

Artprice by Artmarket, the world leader in information on the art market, has set itself the ambition through its Global Standardized Marketplace to be the world’s leading Fine Art NFT platform.

Artprice Images® allows unlimited access to the largest Art Market image bank in the world: no less than 180 million digital images of photographs or engraved reproductions of artworks from 1700 to the present day, commented by our art historians.

Artmarket with its Artprice department accumulates data on a permanent basis from 6300 Auction Houses and produces key Art Market information for the main press and media agencies (7,200 publications). Its 5.4 million (‘members log in’+social media) users have access to ads posted by other members, a network that today represents the leading Global Standardized Marketplace® to buy and sell artworks at a fixed or bid price (auctions regulated by paragraphs 2 and 3 of Article L 321.3 of France’s Commercial Code).

Artmarket with its Artprice department, has been awarded the State label "Innovative Company" by the Public Investment Bank (BPI) (for the second time in November 2018 for a new period of 3 years) which is supporting the company in its project to consolidate its position as a global player in the market art.

Artprice’s 2020/21 Contemporary Art Market Report by Artmarket.com:
https://www.artprice.com/artprice-reports/the-contemporary-art-market-report-2021

Artprice by Artmarket’s 2020 Global Art Market Report published in March 2021:
https://www.artprice.com/artprice-reports/the-art-market-in-2020

Index of press releases posted by Artmarket with its Artprice department:
serveur.serveur.com/press_release/pressreleaseen.htm

Follow all the Art Market news in real time with Artmarket and its Artprice department on Facebook and Twitter:

www.facebook.com/artpricedotcom/ (over 5,4 million followers)
twitter.com/artmarketdotcom
twitter.com/artpricedotcom

Discover the alchemy and universe of Artmarket and its artprice department https://www.artprice.com/video headquartered at the famous Organe Contemporary Art Museum "The Abode of Chaos" (dixit The New York Times): https://issuu.com/demeureduchaos/docs/demeureduchaos-abodeofchaos-opus-ix-1999-2013

L’Obs – The Museum of the Future: https://youtu.be/29LXBPJrs-o
www.facebook.com/la.demeure.du.chaos.theabodeofchaos999

(4.4 million followers)
https://vimeo.com/124643720

Contact Artmarket.com and its Artprice department – Contact: Thierry Ehrmann, ir@artmarket.com 


OPPO Reno6 Z 5G Gets Special Shiseido Collaboration

The OPPO Reno6 series of smartphones has been available for a little bit now. Being a Reno device, the main focus was its camera and its many portrait photo features. That said, OPPO is now partnering up with what they call “the perfect partner” – Shiseido. Shiseido is one of many renown cosmetic brands that have been focusing on creating and delivering products which allow anyone to look their best; and – as OPPO put it, “when Shiseido helps you look your best, the OPPO Reno6 Z helps you capture your best portrait pictures!”.

OPPO Collaborates with Shiseido for the Perfect Year End Gift
Source: OPPO

OPPO and Shiseido will be launching a special version of the OPPO Reno6 Z 5G which will be coming with a specially designed box filled with Shiseido goodies to complement the smartphone. The limited edition gift box comes in the Reno6’s signature, irridescent Reno Glow Aurora finish. Inside, you will find the Reno6 Z 5G, a limited edition OPPO x Shiseido phone case and the an OPPO x Shiseido Gift Box filled with goodies.

The special edition gift box will be going on sale for MYR1,699 – the regular price of a Reno6 Z. It is currently available for pre-order from OPPO’s online store. The first 300 pre-orders will also get an additional Shiseido Synchro Skin Radiant Lifting Foundation worth MYR210. This is on top of the already included gift box worth MYR450. The limited edition will be available on shelves starting on 2 December 2021.

OPPO Reno6 Z Shiseido2
Source: OPPO

OPPO launched the Reno6 Z 5G earlier in August 2021. The smartphone comes with a MediaTek Dimensity 800U. This is paired with 8GB of RAM and 128GB of internal storage. More importantly, the OPPO Reno6 Z comes with a triple camera sensor on the back; a 64-megapixel main sensor complemented by an 8-megapixel wide sensor and a 2-megapixel macro sensor. On the front, the smartphone is equipped with a 32-megapixel selfie camera.

Here Comes A New Challenger! Boost Makan brings Food Delivery to the eWallet

If there’s one thing anyone would tell you about Malaysians it’s that we love our food! That could be why it seems like every truly Malaysian app has forayed into the food delivery space. The latest app to do that is a very unassuming one – Boost eWallet. Boost is one of three major eWallets in Malaysia. They have also been one of the most experimental partnering with services like Samsung Pay.

Boost Makan
Source: Boost

It looks like the next adventure for the eWallet will be in the field of food delivery. The new service brings together Boost, its merchant partners and delivery partners in a joint venture that can take on current players. In fact, Boost is leveraging its high merchant adoption by making it easy for their current merchants to get on to the new service. Keep in mind, Boost has not only been working with shops and retail outlets, they have also been working with pasar malam vendors and hawkers. This could give the platform the upper hand when it comes to food choice.

To make things even more appealing, merchants are promised low platform fees and reliable delivery partners. In addition to this, Boost is also committing to quick turnover for payment settlements. At the time of announcement, they have committed to a 2-day turnover.

Boost Makan How To
Source: Boost

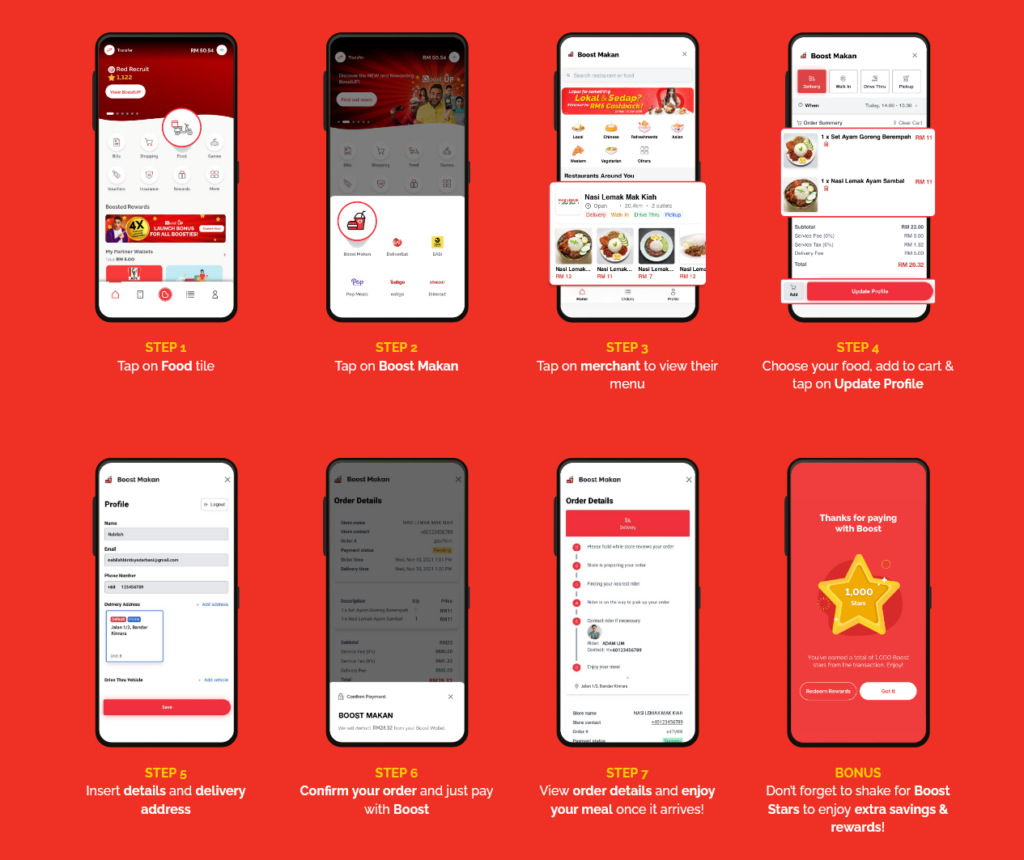
The Boost Makan service is also one of the most versatile apps when it comes to food service. Users can choose from delivery, pick up, drive thru or walk-in. Deliveries will list offerings from restaurants and merchants in a 20km radius from the user’s location. While pick up and drive-thru will need users to head to the merchant’s location. The latter gives the added advantage of being “delivered” the items as the merchant will be able to recognise user’s vehicles. Walk-in will allow merchants to provide customers with a contactless option for patrons to place their order.

Boost Makan is having a special promotion in conjunction with their launch. Users who place orders on Boost will be entitled to MYR5 cashback with their order. Merchants, on the other hand, will receive an MYR50 merchant incentive upon registered Boost Makan.

Boqii Announces Fiscal 2022 Second Quarter Unaudited Financial Results

Second Quarter Revenues of RMB282.1 million, up 23.1% year-over-year

Second Quarter GMV of RMB692.6 million, up 23.0% year-over-year

SHANGHAI, Nov. 30, 2021 — Boqii Holding Limited ("Boqii" or the "Company") (NYSE: BQ), a leading pet-focused platform in China, today announced its unaudited financial results for the second quarter of fiscal year 2022 (the quarter ended September 30, 2021).

Fiscal Q2 2022 Operational and Financial Highlights

  • Total revenues were RMB282.1 million (US$43.8 million), representing an increase of 23.1% from RMB229.2 million in the same quarter of fiscal year 2021.
  • Net loss was RMB44.5million (US$6.9 million), compared to net loss of RMB27.5 million in the same quarter of fiscal year 2021.
  • Adjusted net loss was RMB40.9 million (US$6.3 million), compared to adjusted net loss of RMB35.8 million in the same quarter of fiscal year 2021.
  • EBITDA[1] was a loss of RMB41.5 million (US$6.4 million), compared to a loss of RMB23.4 million in the same quarter of fiscal year 2021.
  • Total GMV[2] was RMB692.6 million (US$107.5 million), representing an increase of 23.0% from RMB563.3 million in the same quarter of fiscal year 2021.
  • Active buyers were 1.6 million, representing an increase of 23.5% from RMB1.3 million in the same quarter of fiscal year 2021.

[1] EBITDA refers to net loss excluding income tax expenses, interest expense, interest income, depreciation and amortization expenses, but including all the professional expenses in relation to initial public offering in the fiscal year of 2021. EBITDA is a Non-GAAP financial measurement. Please refer to "Non-GAAP financial measurement".

[2] GMV refers to gross merchandise volume, which is the total value of confirmed orders placed with us and sold through distribution model or drop shipping model where we act as a principal in the transaction regardless of whether the products are delivered or returned, calculated based on the listed prices of the ordered products without taking into consideration any discounts. The total GMV amount (i) includes GMV of products sold by Xingmu, (ii) excludes products sold through consignment model and (iii) excludes the value of services offered by us. GMV is subject to future adjustments (such as refunds) and represents only one measure of the Company’s performance and should not be relied on as an indicator of our financial results, which depend on a variety of factors.

CEO & CFO Quote

Mr. Hao Liang, Boqii’s Founder, Chairman and Chief Executive Officer commented, "We maintained strong topline growth in the second quarter of Fiscal 2022. As the company continues to expand its offering and drive customer engagement, number of active buyers grew by 23.5% year over year.In addition to our organic business growth, we announced a strategic partnership with Yongle Huazhu in October, to provide pet-friendly stays in its Blossom House hotels. This partnership further demonstrates our dedication to providing all-round user care. We look forward to working with more partners to enhance our service portfolio, better address growing needs in our user communities, and lead accelerated growth for all."

Ms. Yingzhi (Lisa) Tang, Boqii’s Co-Founder, Co-CEO and CFO, stated, "We generated healthy revenue growth of 23.1% year over year this quarter. Continuous growth momentum from online marketing, information services, and other revenue once again exhibited the strength of our vertical platform and unqique value propositions to other players in the industry chain. Our improved gross margin also demonstrated our ability to achieve high-quality topline growth. Looking ahead, we will remain committed to serving both our growing customer base and industry partners with seamless experience and elevated efficiency, and look forward to further strengthening our core capabilities to better capture the immense opportunities in the pet industry."

Fiscal Q2 2022 Financial Results

Total revenues were RMB282.1 million (US$43.8 million), representing an increase of 23.1% from RMB229.2 million in the same quarter of fiscal year 2021. The increase was primarily due to the continued organic growth of our business.

Revenues
(in million)

Three Months Ended

September 30

%

2021

2020

change

RMB

RMB

YoY

Product sales

266.1

227.9

16.8%

·         Boqii Mall

107.6

94.4

14.0%

·         Third party e-commerce platforms

158.5

133.5

18.7%

Online marketing and information services and other revenue

16.0

1.3

1123.8%

Total

282.1

229.2

23.1%

Gross profit was RMB55.7 million (US$8.6 million), representing an increase of 30.7% from RMB42.6 million in the same quarter of fiscal year 2021.

Gross margin was 19.7%, compared to 18.6% in the same quarter of fiscal year 2021.

Operating expenses were RMB96.8 million, representing an increase of 25.6 % from RMB77.1 million in the same quarter of fiscal year 2021. Operating expenses as a percentage of total revenues was 34.3%, compared to 33.6% in the same quarter of fiscal year 2021.

  • Fulfillment Expenses were RMB29.6 million, representing an increase of 2.0% from RMB29.0 million in the same quarter of fiscal year 2021. Fulfillment expenses as a percentage of total revenues was 10.5%, down from 12.7% in the same quarter of fiscal year 2021. The decrease was mainly due to: (i) the improved utilization of warehouses by adjusting inventory mix; (ii) more cost-efficient China warehouse relocations; and (iii) lower delivery service prices through renegotiation with third-party delivery service providers.
  • Sales and marketing expenses were RMB44.0 million, representing an increase of 40.3% from RMB31.3 million in the same quarter of fiscal year 2021. Sales and marketing expenses as a percentage of total revenue was 15.6%, compared to 13.7% in the same quarter of fiscal year 2021. The increase was primarily due to: (i) the increased personnel expense of RMB4.6 million related to the discontinued Covid government subdisies; (ii) the increased advertising expenses of RMB6.8 million for business expansion.
  • General and administrative expenses were RMB23.2 million, representing an increase of 39.0% from RMB16.7 million in the same quarter of fiscal year 2021. General and administrative expenses as a percentage of total revenue was 8.2%, compared to 7.3% in the same quarter of fiscal year 2021. The increase was primarily due to: (i) share-based compensation expense of RMB3.3 million; and (ii) the increased professional fees of RMB3.4 million incurred after we became a publicly traded company.

Operating loss was RMB41.0 million (US$6.4 million), compared to RMB34.2 million in the same quarter of fiscal year 2021.

EBITDA was a loss of RMB41.5 million (US$6.4 million), compared to a loss of RMB23.4 million in the same quarter of fiscal year 2021.

Net loss was RMB44.5 million (US$6.9 million), compared to net loss of RMB27.5 million in the same quarter of fiscal year 2021.

Adjusted net loss was RMB40.9 million (US$6.3 million), compared to adjusted net loss of RMB35.8 million in the same quarter of fiscal year 2021.

Diluted net loss per share was RMB0.64 (US$0.10), compared to diluted net loss per share of RMB3.06 in the same quarter of fiscal year 2021.

Total cash and cash equivalents and short-term investments were RMB339.4 million (US$52.7 million), compared to RMB415.7 million as of June 30, 2021.

Conference Call

Boqii’s management will hold a conference call to discuss the financial results at 8:00 AM on Tuesday, November 30, 2021, U.S. Eastern Time (9:00 PM on Tuesday, November 30, 2021, Beijing/Hong Kong Time).

To join the conference, please dial in 15 minutes before the conference is scheduled to begin using below numbers.

Phone Number

International

1-412-317-6061

United States

1-888-317-6003

Hong Kong

852 800 963-976

Mainland China

86 4001-206115

Passcode

6835046

A replay of the conference call may be accessed by phone at the following numbers until December 7, 2021.

Phone Number

International

1-412-317-0088

United States

1-877-344-7529

Replay Access Code

10161957

A live and archived webcast of the conference call will be available on the Company’s investor relations website at http://ir.boqii.com/.

About Boqii Holding Limited

Boqii Holding Limited (NYSE: BQ) is a leading pet-focused platform in China. We are the leading online destination for pet products and supplies in China with our broad selection of high-quality products including global leading brands, local emerging brands, and our own private label, Yoken and Mocare, offered at competitive prices. Our online sales platforms, including Boqii Mall and our flagship stores on third-party e-commerce platforms, provide customers with convenient access to a wide selection of high-quality pet products and an engaging and personalized shopping experience. Our Boqii Community provides an informative and interactive content platform for users to share their knowledge and love for pets.

Safe Harbor Statement

This press release contains forward-looking statements. These statements are made under the "safe harbor" provisions of the U.S. Private Securities Litigation Reform Act of 1995. Statements that are not historical facts, including statements about the Company’s beliefs and expectations, are forward-looking statements. Forward-looking statements involve inherent risks and uncertainties, and a number of factors could cause actual results to differ materially from those contained in any forward-looking statement. In some cases, forward-looking statements can be identified by words or phrases such as "may," "will," "expect," "anticipate," "target," "aim," "estimate," "intend," "plan," "believe," "potential," "continue," "is/are likely to" or other similar expressions. The Company may also make written or oral forward-looking statements in its reports filed with, or furnished to, the U.S. Securities and Exchange Commission, in its annual reports to shareholders, in press releases and other written materials and in oral statements made by its officers, directors or employees to third parties. Statements that are not historical facts, including statements about the Company’s beliefs and expectations, are forward-looking statements. Forward-looking statements involve inherent risks and uncertainties. Further information regarding such risks, uncertainties or factors is included in the Company’s filings with the SEC. All information provided in this press release is as of the date of this press release, and the Company does not undertake any duty to update such information, except as required under applicable law.

Non-GAAP Financial Measures

The Company uses non-GAAP financial measures, namely adjusted net loss, adjusted net loss margin, EBITDA and EBITDA margin, in evaluating its operating results and for financial and operational decision-making purposes. The Company defines (i) adjusted net loss as net loss excluding fair value change of derivative liabilities and share-based compensation expenses, (ii) adjusted net loss margin as adjusted net loss as a percentage of total revenues, (iii) EBITDA as net loss excluding income tax expenses, interest expense, interest income, depreciation and amortization expenses, (iv) EBITDA margin as EBITDA as a percentage of total revenues. The Company believes adjusted net loss, adjusted net loss margin, EBITDA and EBITDA margin enhance investors’ overall understanding of its financial performance and allow for greater visibility with respect to key metrics used by its management in its financial and operational decision-making.

These non-GAAP financial measures are not defined under U.S. GAAP and are not presented in accordance with U.S. GAAP. As these non-GAAP financial measures have limitations as analytical tools and may not be calculated in the same manner by all companies, they may not be comparable to other similarly titled measures used by other companies. The Company compensates for these limitations by reconciling the non-GAAP financial measures to the nearest U.S. GAAP performance measures, which should be considered when evaluating the Company’s performance. For reconciliation of these non-GAAP financial measures to the most directly comparable GAAP financial measures, please see the section of the accompanying tables titled, "Reconciliation of GAAP and Non-GAAP Results." The Company encourages investors and others to review its financial information in its entirety and not rely on any single financial measure.

Exchange Rate

This press release contains translations of certain RMB amounts into U.S. dollars ("USD") at specified rates solely for the convenience of the reader. Unless otherwise stated, all translations from RMB to USD were made at the rate of RMB6.4434 to US$1.00, the noon buying rate in effect on September 30, 2021 in the H.10 statistical release of the Federal Reserve Board. The Company makes no representation that the RMB or USD amounts referred to could be converted into USD or RMB, as the case may be, at any particular rate or at all.

For investor and media inquiries, please contact:

In China:

Boqii Holding Limited
Investor Relations
Tel: +86-21-6882-6051
Email: ir@boqii.com

The Blueshirt Group
Ms. Susie Wang
Email: susie@blueshirtgroup.com

In the United States:

The Blueshirt Group
Ms. Julia Qian
Email: julia@blueshirtgroup.com

BOQII HOLDING LIMITED

UNAUDITED INTERIM CONDENSED CONSOLIDATED BALANCE SHEETS

(All amounts in thousands, except for share and per share data, unless otherwise noted)

As of
March 31,
2021

As of
September 30,
2021

As of
September 30,
2021

RMB

RMB

US$

ASSETS

Current assets:

Cash and cash equivalents

292,237

210,199

32,622

Short-term investments

168,546

129,195

20,051

Accounts receivable, net

45,732

62,341

9,675

Inventories, net

91,551

97,294

15,100

Prepayments and other current assets

85,261

81,536

12,655

Amounts due from related parties

11,465

36,081

5,600

Total current assets

694,792

616,646

95,703

Non-current assets:

Property and equipment, net

8,386

7,731

1,200

Intangible assets

29,537

27,543

4,275

Operating lease right-of-use assets

29,234

44,405

6,892

Long-term investments

74,330

85,211

13,225

Goodwill

40,184

40,684

6,314

Other non-current asset

4,111

4,363

677

Total non-current assets

185,782

209,937

32,583

Total assets

880,574

826,583

128,286

LIABILITIES, MEZZANINE EQUITY AND SHAREHOLDERS’ DEFICIT

Current liabilities

Short-term borrowings

85,566

124,995

19,399

Accounts payable

71,848

82,838

12,856

Salary and welfare payable

6,309

5,307

824

Accrued liabilities and other current liabilities

30,055

26,732

4,149

Amounts due to related parties, current

910

9,495

1,474

Contract liabilities

3,866

3,893

604

Operating lease liabilities, current

8,063

9,945

1,543

Derivative liabilities

9,996

9,877

1,533

Total current liabilities

216,613

273,082

42,382

Non-current liabilities

Deferred tax liabilities

8,958

8,464

1,314

Operating lease liabilities, non-current

19,997

32,802

5,091

Long-term borrowings

68,075

24,837

3,855

Other debts, non-current

433,292

337,251

52,341

Total non-current liabilities

530,322

403,354

62,601

Total liabilities

746,935

676,436

104,983

Mezzanine equity

Redeemable non-controlling interests

5,946

6,229

967

Total mezzanine equity

5,946

6,229

967

Stockholders’ equity:

Class A ordinary shares (US$0.001 par value; 129,500,000 shares authorized,
     54,505,108 and 54,619,541 shares issued and outstanding as of March 31
     and September 30, 2021, respectively)

364

366

57

Class B ordinary shares (US$0.001 par value; 15,000,000 shares authorized,
     13,037,729 shares issued and outstanding as of March 31 and September,
     30, 2021, respectively)

82

82

13

Additional paid-in capital

3,272,612

3,283,708

509,623

Statutory reserves

3,047

3,163

491

Accumulated other comprehensive loss

(20,172)

(25,937)

(4,025)

Accumulated deficit

(2,759,882)

(2,838,493)

(440,527)

Receivable for issuance of ordinary shares

(413,377)

(322,369)

(50,031)

Total Boqii Holding Limited shareholders’ equity

82,674

100,520

15,601

Non-controlling interests

45,019

43,398

6,735

Total shareholders’ equity

127,693

143,918

22,336

Total liabilities, mezzanine equity and shareholders’ equity

880,574

826,583

128,286

Notes for all the condensed consolidated financial schedules presented:
Note 1: The conversion of Renminbi (RMB) into U.S. dollars (USD) is based on the certified exchange rate of USD1.00=RMB6.4434 on September 30, 2021 published by the Federal Reserve Board.


BOQII HOLDING LIMITED

UNAUDITED INTERIM CONDENSED CONSOLIDATED STATEMENTS OF COMPREHENSIVE LOSS

(All amounts in thousands, except for share and per share data, unless otherwise noted)

Three Months Ended September 30,

Six Months Ended September 30,

2020

2021

2021

2020

2021

2021

RMB

RMB

US$

RMB

RMB

US$

Net revenues:

Product sales

227,883

266,090

41,297

465,815

577,583

89,639

Online marketing and information services and
     other revenue

1,307

16,031

2,488

1,813

26,384

4,095

Total revenues

229,190

282,121

43,785

467,628

603,967

93,734

Total cost of revenue

(186,555)

(226,415)

(35,139)

(381,723)

(491,880)

(76,339)

Gross profit

42,635

55,706

8,646

85,905

112,087

17,395

Operating expenses:

Fulfillment expenses

(29,037)

(29,632)

(4,599)

(62,669)

(62,519)

(9,703)

Sales and marketing expenses

(31,342)

(43,969)

(6,824)

(66,286)

(89,454)

(13,883)

General and administrative expenses

(16,697)

(23,203)

(3,601)

(33,565)

(42,774)

(6,638)

Other income, net

258

55

9

305

67

10

Loss from operations

(34,183)

(41,043)

(6,369)

(76,310)

(82,593)

(12,819)

Interest income

4,487

4,677

726

6,203

9,864

1,531

Interest expense

(6,416)

(5,997)

(931)

(13,559)

(12,059)

(1,872)

Other (losses)/gain, net

879

(2,723)

(423)

3,776

405

63

Fair value change of derivative liabilities

8,303

249

39

10,409

411

64

Loss before income tax expenses

(26,930)

(44,837)

(6,958)

(69,481)

(83,972)

(13,033)

Income taxes expenses

(500)

238

37

(191)

1,247

194

Share of results of equity investees

(20)

68

11

(77)

834

129

Net loss

(27,450)

(44,531)

(6,910)

(69,749)

(81,891)

(12,710)

Less: Net (loss)/income attributable to non-
     controlling interest shareholders

617

(1,216)

(189)

896

(3,683)

(572)

Net loss attributable to Boqii Holding Limited

(28,067)

(43,315)

(6,721)

(70,645)

(78,208)

(12,138)

Less: Accretion on convertible redeemable
     preferred shares to redemption value

(39,925)

(75,062)

Less: Accretion on redeemable non-controlling
     interests to redemption value

(143)

(22)

(283)

(44)

Less: Deemed dividend to preferred shareholders

(12,547)

Net loss attributable to Boqii Holding
    
Limited‘s ordinary shareholders

(67,992)

(43,458)

(6,743)

(158,254)

(78,491)

(12,182)

Net loss

(27,450)

(44,531)

(6,910)

(69,749)

(81,891)

(12,710)

Other comprehensive income/(loss):

Foreign currency translation adjustment, net
     of nil tax

(10,716)

2,947

457

(11,517)

(5,765)

(895)

Unrealized securities holding gains

1,195

Total comprehensive loss

(38,166)

(41,584)

(6,453)

(80,071)

(87,656)

(13,605)

Less: Net comprehesive (loss)/income
     attributable to non- controlling interests s
     hareholders

617

(1,216)

(189)

896

(3,683)

(572)

Total comprehensive loss attributable to Boqii
     Holding
Limited

(38,783)

(40,368)

(6,264)

(80,967)

(83,973)

(13,033)

Net loss per share attributable to Boqii
     Holding
Limited’s ordinary shareholders

— basic

(3.06)

(0.64)

(0.10)

(7.12)

(1.16)

(0.18)

— diluted

(3.06)

(0.64)

(0.10)

(7.12)

(1.16)

(0.18)

Weighted average number of ordinary shares

— basic

22,238,454

67,703,830

67,703,830

22,238,454

67,703,830

67,703,830

— diluted

22,238,454

67,703,830

67,703,830

22,238,454

67,703,830

67,703,830

Notes for all the condensed consolidated financial schedules presented:
Note 1: The conversion of Renminbi (RMB) into U.S. dollars (USD) is based on the certified exchange rate of USD1.00=RMB6.4434 on September 30, 2021 published by the Federal Reserve Board.


Boqii Holding Limited

Reconciliation of GAAP and Non-GAAP Results

(In thousands)

Three Months Ended September 30

Six Months Ended September 30,

2020

2021

2020

2021

RMB

RMB

RMB

RMB

Net loss

(27,450)

(44,531)

(69,749)

(81,891)

Fair value change of derivative liabilities

(8,303)

(249)

(10,409)

(411)

Share-based compensation

3,917

9,903

Adjusted Net loss

(35,753)

(40,863)

(80,158)

(72,399)

Adjusted Net Loss Margin

(15.6%)

(14.5%)

(17.1%)

(12.0%)

Three Months Ended September 30,

Six Months Ended September 30,

2020

2021

2020

2021

RMB

RMB

RMB

RMB

Net loss

(27,450)

(44,531)

(69,749)

(81,891)

Income tax expenses

500

(238)

191

(1,247)

Interest expenses

6,416

5,997

13,559

12,059

Interest income

(4,487)

(4,677)

(6,203)

(9,864)

Depreciation and amortization

1,601

1,957

3,351

3,885

EBITDA

(23,420)

(41,492)

(58,851)

(77,058)

EBITDA Margin

(10.2%)

(14.7%)

(12.6%)

(12.8%)

Notes for all the condensed consolidated financial schedules presented:
Note 1: The conversion of Renminbi (RMB) into U.S. dollars (USD) is based on the certified exchange rate of USD1.00=RMB6.4434 on September 30, 2021 published by the Federal Reserve Board.

Samsung Silently Reveals the Galaxy A03 & the Galaxy A03 Core

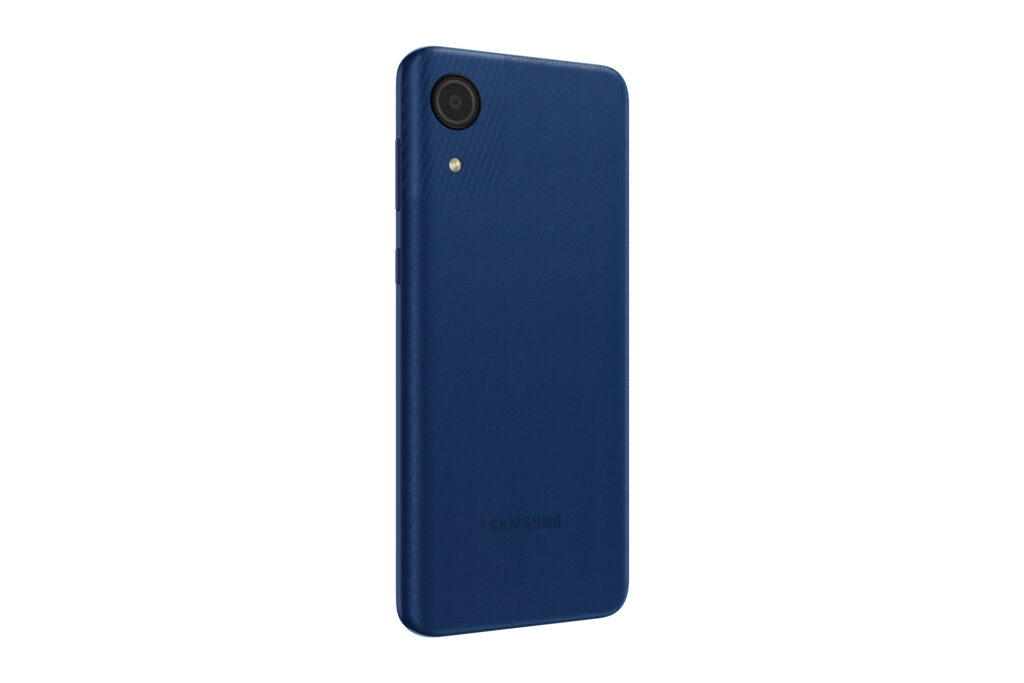
Samsung’s A series just got a little broader with the company silently announcing two new entries. The new entries seem to be meant for the entry-level segment. The addition of the new Galaxy A03 and Galaxy A03 core seems to bring even more choice when it comes to the lower end of the A series.

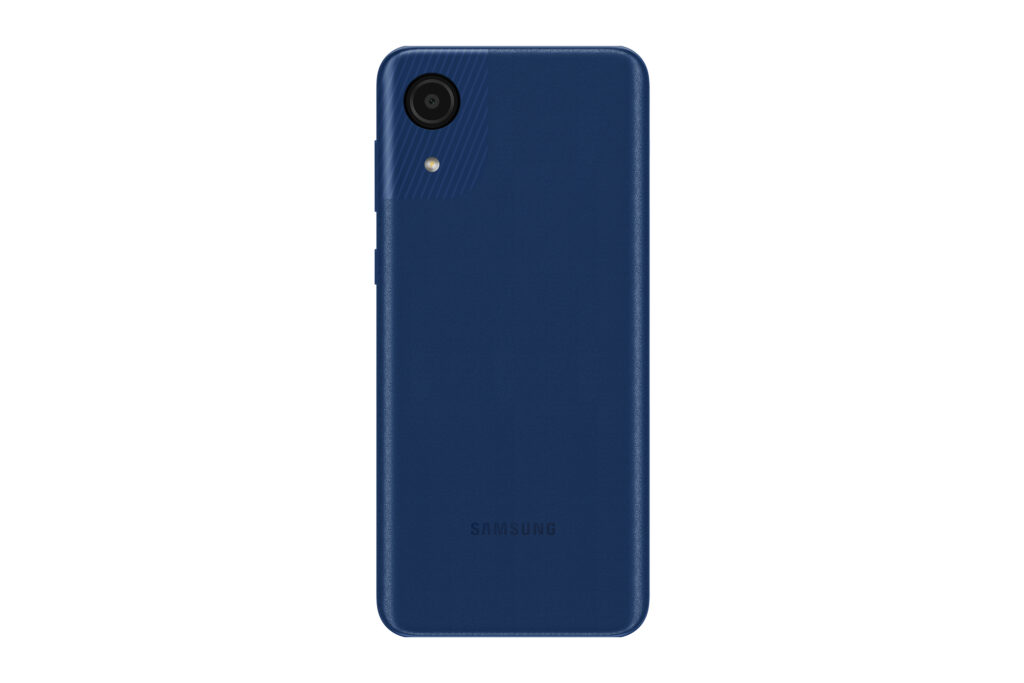
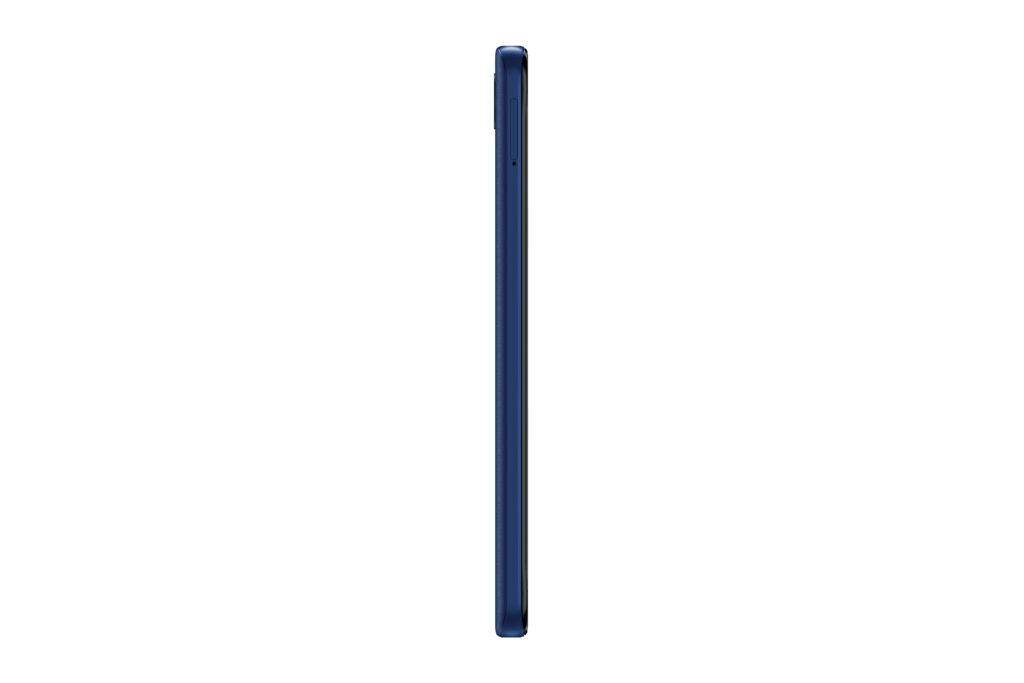
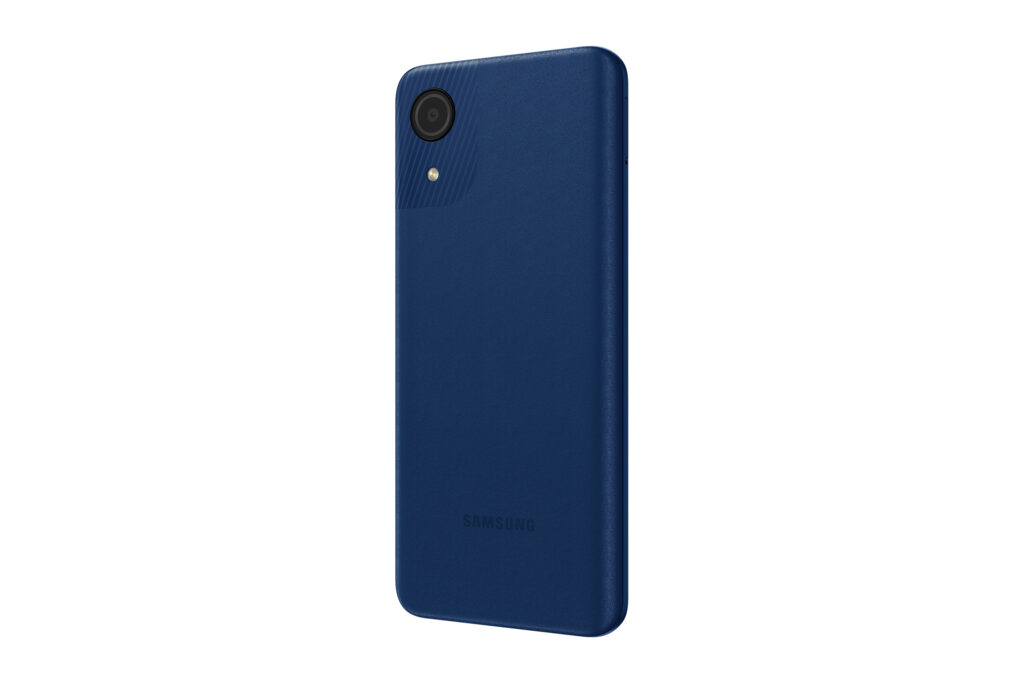
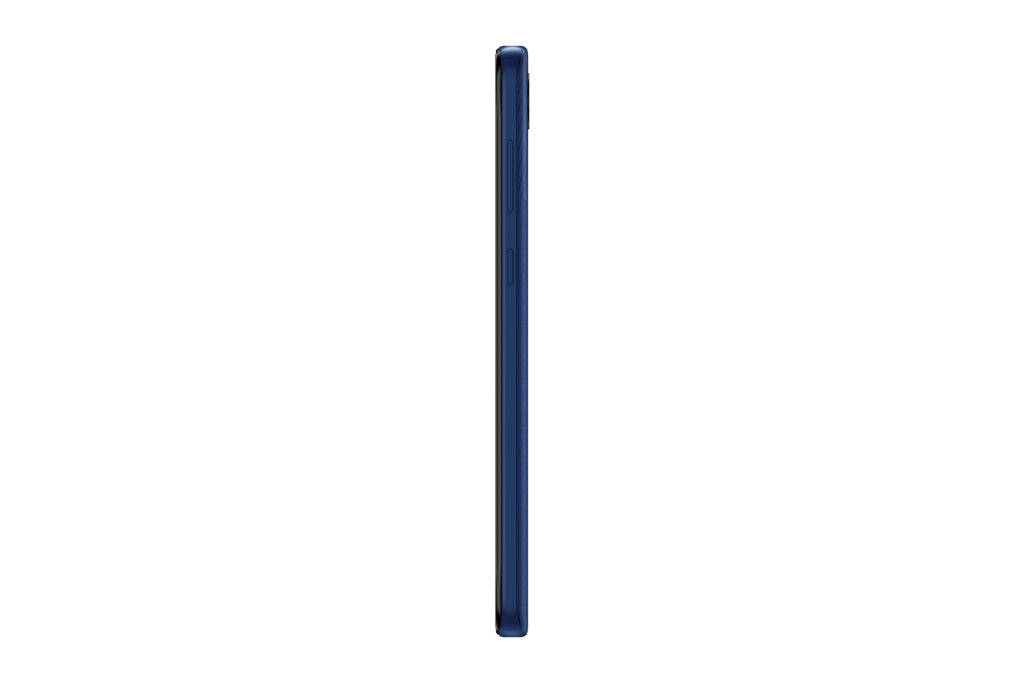
  • 010 galaxy a03 core blue back
  • 015 galaxy a03 core blue l side
  • 011 galaxy a03 core blue front l30
  • 014 galaxy a03 core blue back r30
  • 012 galaxy a03 core blue front r30
  • 013 galaxy a03 core blue back l30
  • 016 galaxy a03 core blue r side

The new Samsung Galaxy A03 comes with an unnamed octa-core processor and up to 4GB of RAM and 128GB of internal storage. On the display side of things, the smartphone comes with a 6.5-inch display with an HD+ resolution. The camera setup of the Galaxy A03 is a dual-sensor setup with a 48-megapixel main sensor with an f/1.8 aperture and a 2-megapixel depth sensor with an f/2.4 aperture. The phone is powered by a 5,000mAh battery. It also has support for Dolby Atmos.

Together with the A03, Samsung also silently listed the Galaxy A03 Core on its website. As the name suggests, the A03 Core is a stripped-down version of the A03. It looks to be coming with the same processor with a lower 2GB of RAM and 32GB of storage. It also has the bare essentials when it comes to the camera setup with a single 8-megapixel sensor with autofocus on the back and a single 5-megapixel fixed-focus sensor on the front.

01 a03 product specifications

It’s more than likely that the phones will be running on OneUI Core – Samsung’s barebones version of their OneUI OS. It will likely ship with no frills and features like other higher-end devices but focus on the bare essentials.

Pricing & Availability

The Galaxy A03 will be available in blue, red and black. The A03 Core, on the other hand, will be available in Black and Blue only.

Samsung hasn’t announced any pricing or availability just yet.

Spotify Retiring Car View

Spotify looks to be retiring its simplified UI for drivers. The Car View mode was initially announced in 2019 as a way to prevent drivers from being distracted while driving. Spotify’s approach was to strip away most of the superfluous elements on the UI giving users a simplified UI. The UI basically only allowed users to do basic actions like skip, pause and rewind when activated.

However, it looks like Car View is being removed from the app. Android users will realise that Car View no longer launches when connected to a Bluetooth speaker. The removal of Car View from the Spotify app was confirmed by a support thread moderator. In the statement, the moderator said that the feature is being retired to “make way for new innovations” and that they are “actively exploring a variety of new ways to deliver the best in-car listening experience”.

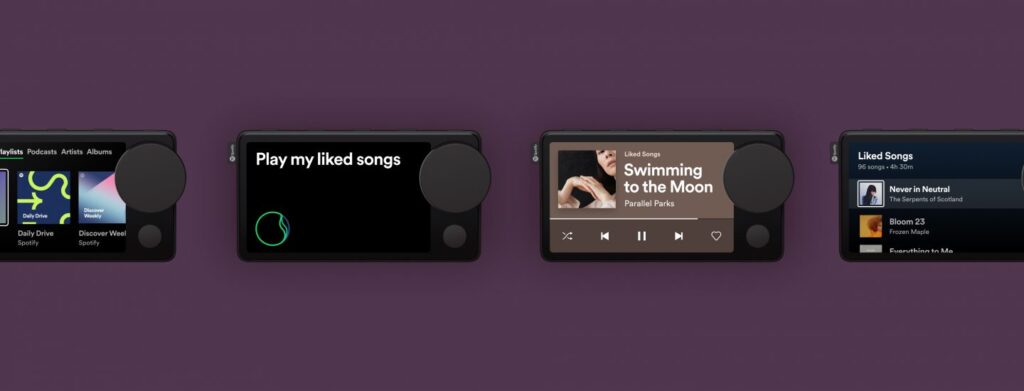
Spotify Car Thing
Spotify Car Thing // Source: Spotify

While the retiring of the feature seems counter-intuitive, it isn’t really a handicap to the app as users are also able to interact with app via Google Assistant or, if you have a car with CarPlay or Android Auto, you can simply use the app in the dash. However, the timing of Spotify’s move to silently retire the feature is a little sus. The company only just recently released “Car Thing” a display device meant for older vehicles. The device delivers a similar experience to users who can’t use in-dash apps. That said, the USD$80 device is currently only available in the U.S. and Canada.

We’ll just have to wait and see whether a new version of Car View is in the works.