Coming Soon, Maybe: Deleting that Three-Month Old Mistake on WhatsApp

WhatsApp is full of wonders. It is, despite the whole Facebook Privacy Policy debacle earlier this year, the most popular alternative messaging app we have seen. No manufacturer has ever seen this kind of success with their own messaging platform. This includes BlackBerry in their hey day mind you.

Being on top is not all sunshine and roses though. To stay on top, as they say, you have to keep pushing boundaries. WhatsApp, of course is constantly improving and adding new features to their app to keep users happy and excited at least. The most recent possible update to WhatsApp in the future? Deleting messages.

Yes, deleting messages used to be something you cannot do with WhatsApp. Before you say we are outdated, hear us out. We know that it is now a thing on WhatsApp. At this point of time, you can delete messages that are no older than an hour and eight minutes. At its early days, WhatsApp only allow you to delete fresh messages no older than seven minutes.

WA DELETE MESSAGE EVERYONE V2 ANDROID
Source: WABetaInfo

Recently though, WABetaInfo has spotted a new feature on the latest beta version of WhatsApp. The latest beta 2.21.220.15 for iOS as per available to WABetaInfo allows users to delete messages not two hours older, not even just a day older. It now allows you to delete messages that are three months old.

WABetaInfo speculates that the new update might point to one of two things. Either WhatsApp is looking to extend the time limit on their delete messages feature or remove the time limit completely. They are also speculating that the update may open up even more avenues to deleting messages even before the feature was introduced.

While all these are under development and that should be cause enough for excitement, there are no official word from Meta (formerly known as Facebook) and WhatsApp themselves just yet. The features in development remain as a potential feature to the app and not an actual feature until it is launched in any of WhatsApp many updates. In that sense, nobody knows when all these developments will become a feature, only time can tell.

Oriental Culture Holding LTD Announces First Half Year of 2021 Unaudited Financial Results

HONG KONG, Nov. 2, 2021 — Oriental Culture Holding LTD. ("OCG" or the "Company") (NASDAQ: OCG), a leading online provider of collectibles and artwork e-commerce services, today announced its unaudited financial results for the six months ended June 30, 2021.

First Half Year of 2021 Financial Highlights

  • Total revenues were approximately $24.5 million for the six months ended June 30, 2021, representing an increase of 891.1 % compared with the total revenues of approximately $2.5 million for the six months ended June 30, 2020.
  • Gross profit was approximately $23.1 million for the six months ended June 30, 2021, representing an increase of 1,011.2% compared with approximately gross profit of $2.1 million for the six months ended June 30, 2020.
  • Gross margin was 94.3% for the six months ended June 30, 2021, representing an increase of 10.2 % points compared with a gross margin of 84.1% for the six months ended June 30, 2020.
  • Income from operations was approximately $9.7 million for the six months ended June 30, 2021, representing an increase of 3,750.6 % compared with income from operations of approximately $0.3 million for the six months ended June 30, 2020.
  • Net income was approximately $10.1 million for the six months ended June 30, 2021, representing an increase of 2,601.8 % compared with net income of approximately $0.4 million for the six months ended June 30, 2020.

Mr. Yi Shao, Chief Executive Officer of the Company, commented "We are very excited to report that our revenues in the first half of 2021 increased by 891.1% year over year to $24.5 million and our net income in the first half of 2021 increased by 2,601.8% year over year to $10.1 million. We have seen a strong first half of this year comparing to the same period of last year as the art and collectible market has bounced back and our business operation has returned to normal as COVID-19 pandemic has mostly been under control in China. During the first half of 2020, our business and operation suffered material negative impact by the outbreak of COVID-19 with the closure of our offices, especially the closure of our warehouse which prevented us from taking in new collectibles and artwork products as well as the traffic control and logistics restrictions in China during the outbreak which delayed delivery of collectibles and artwork from clients for appraisal and listing on our platform."

Mr. Shao continued: "In addition, economic activities are returning to normal and new measures are introduced to stimulate domestic consumption in China which have strengthened art and collectible traders’ confidence. Internationally, the positive global financial market, encouraging signs of economic recovery, and continuing government stimulus measures, fueled investment market, including the investment in arts and collectibles. The rapid increase in new customers and our marketing activities helped driving up the number of new listings, volume of transactions as well as our revenue and profit." 

Results of Operations

The tables in the following discussion summarize our unaudited interim condensed consolidated statements of operations for the periods indicated. The operating results in any period are not necessarily of the results that may be expected for any future period.

For the Six Months Ended
June 30,

Variance

2021

2020

Amount

%

(Unaudited)

(Unaudited)

Net Revenues

$

24,331,668

$

2,373,250

$

21,958,418

925.2%

Net Revenues – related parties

129,071

94,713

34,358

36.3%

Cost of revenues

(1,397,828)

(392,424)

(1,005,404)

256.2%

Gross profit

23,062,911

2,075,539

20,987,372

1011.2%

Operating expenses

(13,339,262)

(1,823,019)

(11,516,243)

631.7%

Income from operations

9,723,649

252,520

9,471,129

3,750.6%

Other income

356,504

120,567

235,937

195.7%

Income before income taxes

10,080,153

373,087

9,707,066

2,601.8%

Provision for income taxes

Net income

10,080,153

373,087

9,707,066

2,601.8%

Foreign currency translation adjustment

(69,596)

(177,875)

108,279

(60.9)%

Comprehensive income

$

10,010,557

$

195,212

9,815,345

5,028.0%

Weighted average number of ordinary shares outstanding –
   basic and diluted

20,444,712

15,190,000

5,254,712

34.6%

Basic and diluted earnings per share

$

0.49

$

0.02

$

0.47

1,907.4%

Revenues:

The following table sets forth the principal components of our net revenues by amounts and percentages of our net revenues for the periods indicated:

For the Six Months Ended June 30,

Variance

2021

2020

Amount

%

(Unaudited)

(Unaudited)

Revenues

%

Revenues

%

Listing services fees (1)

$

4,487,953

18.3

$

466,668

18.9

$

4,021,285

861.7%

Transaction fee (2)

16,265,107

66.5

1,353,532

54.8

14,911,575

1101.7%

Marketing service fees (3)

3,416,630

14.0

387,407

15.7

3,029,223

781.9%

Other revenues(4)*

291,049

1.2

260,356

10.6

30,694

11.8%

Total operating revenues, net

$

24,460,739

100.0

$

2,467,963

100.0

$

21,992,776

891.1%


* Including $129,071 and $94,713 from related parties for the six months ended June 30, 2021 and 2020, respectively

(1) Listing service fees: Our performance obligation is to provide listing on our platform. Listing service fees are calculated based on a percentage of the listing value of collectibles and artwork. Listing value is the total offering price of the collectible, artwork or commodities when the ownership units are initially listed on our trading platform. We utilize an appraised value as a basis to determine the appropriate listing value for each piece of collectible or artwork, or portfolio of collectibles or artwork or commodities. In general, listing service fees are recognized upon completion of our performance obligation. Our standard listing fees range from 2.3% to 5.3% for artwork and collectibles and 1% to 6% for commodities of the initial listing value, the rate is dependent on the type of listings and is negotiated on a case by case basis. The average listing period is around three months.

Total listing service fees increased by approximately $4.0 million or 861.7% from $466,668 for the six months ended June 30, 2020 to $4,487,953 for the same period in 2021. The increase was due to large amount of newly listed artwork and collectibles which increased in the listing value and listing service fees. The number of types in collectibles/artwork and commodities were successfully listed on our platforms increased from 25 for the six months ended June 30, 2020 to approximately 187 for the six months ended June 30, 2021. Our total listing value of listed collectible/artwork increased from approximately $0.4 billion during the six months ended June 30, 2020 to approximately $1.8 billion for the same period in 2021.

(2) Transaction fee revenue: Transaction fee revenue is generally calculated based on the transaction value of collectibles or artwork per transaction for our services to facilitate the trading transactions. Transaction value is the dollar amount of the purchase and sale of the ownership units of the collectibles or artwork after they are listed on our platform. We typically charge from 0.15% to 0.3% of the transaction value per transaction from both the purchase and sale side of the transaction resulting in an aggregate of 0.3% to 0.6% of total transaction value. Sometimes, we charge a predetermined transaction rate, which is negotiated on a case by case basis, for selected traders with specific large transactions. Transaction fee revenue also includes predetermined monthly transaction fees, which are negotiated case by case for selected traders with high trading volume, and is recognized and earned over the specified service period.

Total transaction fee revenue increased by approximately $14.9 million or 1,101.7% from $1,353,532 for the six months ended June 30, 2020 to $16,265,107 for the same period in 2021. The increase was primarily due to the increasing number of traders that participated in trading on the platform as our customers and potential customers increased their expenditures and investment because of recovering economic activities from the pandemic in China. Our active traders increased from 27,020 for the six months ended June 30, 2020 to 116,709 active traders for the six months ended June 30, 2021. The increase in active trader led to increase in number of transactions. Our number of transactions increased from approximately 16.8 million for the six months ended June 30, 2020 to approximately 94.5 million for the same period in 2021. During the six months ended June 30, 2021 and 2020, total transaction value amounted to approximately $10.8 billion and $847 million respectively. Our current system could support up to 120,000 active  traders with over one billion transactions.

(3) Marketing service fees: Marketing service fee revenue is a fee that we charge for promoting and marketing our customers’ collectibles or artwork. The services include assisting our customers in connection with their listings and trading of their collectibles/artwork on our platform, which mainly include consulting and supporting services of the marketability for the collectibles/artwork; assessing their market value and market acceptance for the collectibles/artwork; and assisting in the application and legal protection required for the customers’ collectibles/artwork to be approved for listing on our platform. For marketing service contracts in which the related performance obligations can be completed within a short period of time, the Company recognizes the related revenue upon the completion of its performance obligations.

Marketing service agreements also includes providing promotion services for customers’ items as where to place ads on well-known cultural and/or art exchange websites in China, to provide online and offline marketing services including cooperation with auction houses and participate in industry-related exhibitions and fairs. The marketing service fees are charged on various fixed fee basis, which are based on the type of the listing session that the customer applies for and whether the customer has listed and sold its collectible on other platforms before, and they were not tied to the type or value of the underlying collectible/artwork. Marketing service contracts and fees are recognized upon the completion of all performance obligations. 

Marketing service fees increased by approximately $3.0 million or 781.9% from $387,407 for the six months ended June 30, 2020 to $3,416,631 for the same period in 2021. The increase was due to increase of types of collectibles/ artwork we promoted for customers. During the six months ended June 30, 2021 and 2020, 187 and 25 types of collectibles/artwork were successfully listed on our platforms, of which we promoted 51 and 4 types of newly listed collectibles and artwork for our customers, respectively.  

(4) Other revenues: Other revenues primarily includes services fees for IT technical support and revenue from termination of a cooperation agreement. IT technical support fee is negotiated on a case by case basis and is recognized when the related services have been performed based on the specific terms of the contract. Total other revenues increased by approximately $31,000 or 11.8% from $260,356, including $94,713 from providing technological services to our related parties for the six months ended June 30, 2020 to $291,049, including $129,071 from providing technological services to our related parties for the same period in 2021. In addition, we recognized approximately $69,000 other revenue when a third party terminated a cooperation agreement with us in developing an online platform for niche market. The deposit with us is recognized as revenue as we have no further obligation under the contract to develop the platform.

Cost of Revenues

Cost of revenues increased by approximately $1.0 million or 256.2% from $392,424 for the six months ended June 30, 2020 to $1,397,828 for the same period in 2021. The increase in cost of revenues was primarily due to the increase in storage fees of approximately $0.5 million due to the increase in the listing value of products. The warehouse storage fees were charged based on certain percentage of listing value of products. The increase in cost of revenues was also due to the increase in salary, cloud services fees and outside service fees for referral of products to the Company of approximately $0.5 million.

Gross Profit

Gross profit for the six months ended June 30, 2021 and 2020 amounted to $23,062,911 and $2,075,539, respectively. Gross profit increased by approximately $21.0 million or 1011.2%.  Gross margin for the six months ended June 30, 2021 and 2020 were 94.3% and 84.1%, respectively. The increase in gross margin was due to increase in higher transaction fee revenue when the cost (mainly salary and cloud services fees) generally did not increase proportionately with the increase in revenue.

Selling and Marketing Expenses

Selling expenses increased by approximately $9,387,751 or 1,104% from $850,462 including $57,935 to related party for the six months ended June 30, 2020 to $10,238,213 including $341,952 to related party for the same period in 2021. The increase was primarily due to the increase in marketing expenses of approximately $8,930,000 as we paid more commission to third parties to get more referral of traders. In addition, advertising expense with Kashi Jinwang Art Purchase E-commerce Co., Ltd.("Jinwang"), a related party, increased about $0.3 million due primarily to the increase in initial listing value of products advertised. Our marketing expenses was charged based on 1.5% of initial listing value of products advertised on the third party’s website. We expect our selling and marketing expenses to increase further as we recover from COVID-19 and we will continue to promote our products listed and getting more referral for traders.

General and Administrative Expenses

Our general and administrative expenses increased by approximately $2,128,492 or 219% from $972,557 including $27,059 to related party for the six months ended June 30, 2020 to $3,101,049 including $78,716 to related party for the same period in 2021. The increase in our general and administrative expenses was primarily due to the increase in professional fees and consulting fee of approximately $1.5 million, which included approximately $0.3 million for professional fees such as legal, audit, insurance and public relations as we became a public company in December 2020. The increase was also due to consulting fee for development for our new business of approximately $1.2 million including overseas business development and development in digital assets. The rest of the increase came mainly from increase in employee salary/benefits, office rent which totaled approximately $0.6 million. We expect our general and administrative expenses, including but not limited to, compensation, rent, depreciation and amortization to continue to increase in the foreseeable future as our business grows further.

Other Income

Total other income increased by approximately $0.2 million, or 195.7%, from $120,567 for the six months ended June 30, 2020 to $356,504 for the same period in 2021. Other income consists mainly of gain from short-term investment, interest income and other income. The increase was mainly due to the receipt of approximately $0.2 million of government grant for our business development.

Provision for Income Taxes

Our provision for income taxes amounted to nil for both the six months ended June 30, 2020 and 2021, respectively. We did not have any income taxes due to our preferential tax rate reduction from our profitable variable interest entities (VIEs), which were formed and registered in Kashi in Xinjiang Provence, China and they are not subject to income taxes for 5 years ending in 2023. We also have provided 100% allowance on net operating losses from our VIEs which incurred losses.

Net Income

Our net income increased by approximately $9.7 million, or 2,601.8%, from $373,087 for the six months ended June 30, 2020 to $10,080,153 for the same period in 2021. Such change was the result of the combination of the changes as discussed above.

Basic and diluted earnings per share

Basic and diluted earnings per share were $0.49 and $0.02 for the six months ended June 30, 2021 and 2020, respectively, representing a 1,907.4% increase.

Cash and cash equivalents, short-term investments

As of June 30, 2021, we had cash and cash equivalents as well as short-term investments in an aggregate amount of $45.1 million, compared to $25.1 million as of December 31, 2020.

Leases

The Company adopted ASU 2016-02 on January 1, 2021 and recognized operating lease liabilities of approximately $21,000, with corresponding right-of-use assets of approximately $23,000 based on the present value of the remaining minimum rental payments for existing operating leases with a remaining term longer than 12 months.

About Oriental Culture Holding LTD

Oriental Culture Holding LTD is an online provider of collectibles and artwork e-commerce services, which allow collectors, artists, art dealers and owners to access an art and collectibles trading market with a wider range of collectibles and artwork investors. Through its subsidiaries in Hong Kong, the Company provides trading facilitation for individual and institutional customers of all kinds of collectibles, artwork and certain commodities on its online platforms, as well as online and offline integrated marketing, storage and technical maintenance service to customers through its VIE and the subsidiaries of its VIE in China. For more information about the Company, please visit: www.ocgroup.hk.

Safe Harbor Statement

This press release contains forward-looking statements as defined by the Private Securities Litigation Reform Act of 1995. Forward-looking statements include statements concerning plans, objectives, goals, strategies, future events or performance, and underlying assumptions and other statements that are other than statements of historical facts. When the Company uses words such as "may, "will, "intend," "should," "believe," "expect," "anticipate," "project," "estimate" or similar expressions that do not relate solely to historical matters, it is making forward-looking statements.  Forward-looking statements are not guarantees of future performance and involve risks and uncertainties that may cause the actual results to differ materially from the Company’s expectations discussed in the forward-looking statements. These statements are subject to uncertainties and risks including, but not limited to, the following:  the Company’s goals and strategies; the Company’s future business development; financial condition and results of operations; product and service demand and acceptance; reputation and brand; the impact of competition and pricing; changes in technology; government regulations; fluctuations in general economic and business conditions in China and assumptions underlying or related to any of the foregoing and other risks contained in reports filed by the Company with the SEC.  For these reasons, among others, investors are cautioned not to place undue reliance upon any forward-looking statements in this press release. Additional factors are discussed in the Company’s filings with the SEC, which are available for review at www.sec.gov. The Company undertakes no obligation to publicly revise these forward-looking statements to reflect events or circumstances that arise after the date hereof.

For more information, please contact:

IR Department
Email: IR@ocgroup.hk
Phone: +852- 21103909


ORIENTAL CULTURE HOLDING LTD AND SUBSIDIARIES

UNAUDITED INTERIM CONDENSED CONSOLIDATED STATEMENTS OF INCOME AND
COMPREHENSIVE INCOME

For the Six Months
Ended
June 30,

2021

2020

(Unaudited)

(Unaudited)

OPERATING REVENUES:

Net revenues

$

24,331,668

$

2,373,250

Net revenues – related parties

129,071

94,713

Total operating revenues

24,460,739

2,467,963

COST OF REVENUES:

Cost of revenues

(789,302)

(274,477)

Cost of revenues – related party

(608,526)

(117,947)

Total cost of revenues

(1,397,828)

(392,424)

GROSS PROFIT

23,062,911

2,075,539

OPERATING EXPENSES:

Selling and marketing

(9,896,261)

(792,527)

Selling and marketing – related party

(341,952)

(57,935)

General and administrative

(3,022,333)

(945,498)

General and administrative – related parties

(78,716)

(27,059)

Total operating expenses

(13,339,262)

(1,823,019)

INCOME FROM OPERATIONS

9,723,649

252,520

OTHER INCOME

Gain from short-term investment

45,466

30,445

Interest income

87,251

84,156

Other income, net

223,787

5,966

Total other income, net

356,504

120,567

INCOME BEFORE INCOME TAXES

10,080,153

373,087

PROVISION FOR INCOME TAX

NET INCOME

$

10,080,153

$

373,087

OTHER COMPREHENSIVE LOSS

Foreign currency translation adjustment

(69,596)

(177,875)

COMPREHENSIVE INCOME

$

10,010,557

$

195,212

WEIGHTED AVERAGE NUMBER OF ORDINARY SHARES

Basic and diluted

20,444,712

15,190,000

EARNINGS PER SHARE

Basic and diluted

$

0.49

$

0.02


ORIENTAL CULTURE HOLDING LTD AND SUBSIDIARIES

UNAUDITED INTERIM CONDENSED CONSOLIDATED BALANCE SHEETS

June 30,

December 31,

2021

2020

(Unaudited)

ASSETS

CURRENT ASSETS

Cash and cash equivalents

$

42,631,671

$

24,036,174

Short-term investment

2,426,184

1,056,286

Accounts receivable, net

667,331

402,428

Account receivable – related parties

21,827

Other receivables and prepaid expenses

1,418,488

199,515

Deposit

13,333,538

Total current assets

47,165,501

39,027,941

PROPERTY AND EQUIPMENT, NET

731,755

372,215

OTHER ASSETS

Prepayment

928,778

Escrow

600,000

600,000

Investment

540,990

535,617

Right-of-use assets

23,050

Intangible assets, net

479,496

572,992

Total other assets

2,572,314

1,708,609

Total assets

$

50,469,570

$

41,108,765

LIABILITIES AND SHAREHOLDERS’ EQUITY

CURRENT LIABILITIES

Accounts payable

$

3,120,176

$

4,831,394

Accounts payable – related parties

106,263

1,229,381

Deferred revenue

3,109,528

243,355

Other payables and accrued liabilities

330,878

1,043,383

Lease liabilities

20,995

Other payables – related parties

6,707

7,312

Taxes payable

195,220

184,694

Total current liabilities

6,889,767

7,539,519

Total liabilities

6,889,767

7,539,519

COMMITMENTS AND CONTINGENCIES

SHAREHOLDERS’ EQUITY

Preferred shares, $0.00005 par value, 100,000,000 shares authorized, no shares
  issued and outstanding as of June 30,2021 and December 31, 2020, respectively

Ordinary shares, $0.00005 par value, 900,000,000 shares authorized,

30,054,712 shares issued, 20,444,712  shares outstanding

as of June 30, 2021 and December 31, 2020, respectively

1,503

1,503

Treasury shares, at cost, 9,610,000 shares issued

as of June 30,2021 and December 31, 2020, respectively

(481)

(481)

Additional paid-in capital

18,884,992

18,884,992

Statutory reserves

112,347

112,347

Retained earnings

23,727,923

13,647,770

Accumulated other comprehensive income

853,519

923,115

Total shareholders’ equity

43,579,803

33,569,246

Total liabilities and shareholders’ equity

$

50,469,570

$

41,108,765


Related Links :

http://www.ocgroup.hk

Asia Online Publishing Group Introduces On360, a Digital Content Management Platform

On360 enables users to create highly engaging digital content for an interactive online experience.

CYBERJAYA, Malaysia, Nov. 2, 2021 — Asia Online Publishing Group (AOPG), Asia’s leading independent IT news publisher and content marketing company, is pleased to announce the launch of On360° (onthreesixty.com).

Delivered as Marketing-as-a-Service (MaaS), On360° is a comprehensive online digital content engagement platform.

Melina Hwang, AOPG General Manager, explained, "In a world flooded with content, marketers need to rise above the noise by creating highly engaging online materials which attract relevant readers by delivering highly valuable and enriched interactive online experiences. That’s exactly what On360° allows marketers to do."

Melina shared that, "Marketing campaigns used to be about finding an audience and driving them to an offline (event) call to action. In today’s new norm,  the ‘experience or call to action’ needs to be online also. Think of On360° as a suite of online content options, all of which can act as a call to action in its own right."

Instead of using unproven black box type algorithms to guess at reader intent, On360° assets engage users and encourage them to share insights naturally as they engage with the content. The net result is to generate rich opt-ins furnished with deeper insight into each reader’s needs and requirements.

Currently, On360° has seven pillars delivered using the MaaS model. The pillars include enriched:

  1. Downloads.
  2. Academy builder/Training.
  3. Digital showcase.
  4. Virtual expo.
  5. Special focus feature.
  6. e-directory.
  7. Intelligent assessment.

Not only does the platform allow you to build these landing sites but, in addition, On360° subscribers get access to our editorial team to help them write and produce the content that is published to these pages.

Melina described how On360° evolved. "We are the leading IT news publisher in the region but we monetise by running online marketing and lead generation campaigns for our clients. As part of this process, we have developed multiple platforms over the years which have assisted our online lead generation efforts. We realised that this IP was valuable not just to us but to any marketers looking to modernise their marketing approach. On360° is a natural evolution. Using our own methods, techniques and IP, we have created a single platform that can be used by any online marketer in any industry."

She continued, "We see a bright future for the platform with the development path already defined for some time into the future, with advanced analytics and CRM integrations already being worked on."

AOPG will continue to use On360° as its own internal engine, powering marketing campaigns for its existing clientele. Melina points out that the really exciting aspect of this announcement is how she expects On360° to become an integral tool in an online marketer’s toolbox, akin to their webinar provider subscription.

To find out more, please visit the On360° site or watch this video to hear from the founders of On360°.

ASUS Announces Android 12 Upgrade Plans

With Google announcing the stable release of the latest version of their mobile operating system, Android 12, manufacturers have started announcing their own plans for the update to roll out to their stable of devices. The latest one to do so is ASUS.

ASUS has previously proven that they will be providing two years of updates for their phones. That roughly equates to two major updates. They have also provided security patches for about three years. That said, ASUS will continue to use this policy for their devices moving forward.

ROG Phone Android 12 RolloutPlan 1920x1080
Source: ASUS

With the rollout of Android 12, it looks like the Zenfone 6 has reached the end of its life; so there will be no update for the smartphone. According to their official press note, the phones receiving the update are the Zenfone 7, Zenfone 7 Pro, ROG Phone 3, ROG Phone 3 Strix Edition, Zenfone 8, Zenfone 8 Flip, ROG Phone 5, ROG Phone Ultimate, ROG Phone 5s, and ROG Phone 5s Pro. That’s pretty much their latest lineup of devices since 2019.

According to their announcement, the ASUS Zenfone 8 and 8 Flip will be the first of their devices to get the update. It is scheduled to get the update starting in December 2021. The ROG Phone 5 and 5s are slated for Q1 2022. The ROG Phone 3, ROG Phone 3 Strix Edition, Zenfone 7 and 7 Pro are set to have the update in the first half of 2022.

Zenfone Android 12 RolloutPlan 1920x1080
Source: ASUS

ASUS didn’t detail much when it came to features that will be coming with the Android 12 update. However, they did mention that “this update inherits the major functional changes introduced in the official version of Android 12, as well as continuing the popular ASUS battery- and performance-management features.”.

Foot Locker, Inc. Completes Acquisition of atmos


Digitally Led, Culturally Connected Business Immediately Expands Foot Locker’s Global Footprint, Provides Foothold in Rapidly Growing Asia-Pac and Extends Premium, Top-Tier Product Offering 

atmos to Maintain Unique Brand Ethos, Identity and Value Proposition Within Foot Locker Family of Brands 

NEW YORK, Nov. 2, 2021 — Foot Locker, Inc. (NYSE: FL) ("Foot Locker" or the "Company"), the New York-based specialty athletic retailer, today announced that, through certain subsidiaries, it has completed the acquisition of atmos, a digitally led, premium, global retailer headquartered in Japan, for $360 million, subject to certain customary adjustments.

Richard Johnson, Chairman and Chief Executive Officer of Foot Locker, said, "We are delighted to officially welcome atmos’s iconic founder, Hidefumi Hommyo, and the entire atmos team to the Foot Locker family. We deeply value atmos’s unique brand, innovative, experiential stores, premium offerings, collaborations and understanding of sneakerhead culture. atmos expands our global reach in the rapidly growing Asia-Pacific market, establishes a critical entry point in Japan and allows us to benefit from immediate scale. We are excited about the many opportunities we will collectively be able to capture as a result of this partnership as we continue creating significant long-term value for our shareholders, consumers, vendor partners, and employees." 

Mr. Hidefumi, CEO, Chief Creative Officer for atmos, said, "Today atmos enters a new era, well-positioned to bring our dynamic and exciting sneakers to more people around the world. atmos was founded with a love of sneakers and a passion for innovation, and with Foot Locker as our partner, we have the opportunity to drive global growth while maintaining what makes us unique. We have worked with Foot Locker for years on product collaborations and partnerships, and we are excited about what is ahead as we pursue our shared passion for sneaker culture, streetwear, creativity and self-expression." 

atmos will maintain its brand name, preserving the atmos identity, brand ethos, and unique value proposition as part of the Foot Locker family of brands. Foot Locker is committed to building on atmos’s strong foundation to propel the brand into its next phase of growth. 

As previously announced, Foot Locker expects atmos to generate low double-digit sales growth annually and low double-digits to mid-teens EBITDA margins over the next five years and be accretive to EPS in fiscal year 2021. As previously reported on August 20, 2021, the Company anticipates that the acquisitions of WSS and atmos combined will be accretive to EPS in the range of $0.44 to $0.48 per share in 2022. 

Advisors 
Evercore served as financial advisor to Foot Locker, and DLA Piper LLP served as its legal advisor. 

About Foot Locker, Inc. 
Foot Locker, Inc. leads the celebration of sneaker and youth culture around the globe through a portfolio of brands including Foot Locker, Kids Foot Locker, Champs Sports, Eastbay, atmos, WSS, Footaction, and Sidestep. With approximately 3,000 retail stores in 28 countries across North America, Europe, Asia, Australia, and New Zealand as well as websites and mobile apps, the Company’s purpose is to inspire and empower youth culture around the world, by fueling a shared passion for self-expression and creating unrivaled experiences at the heart of the global sneaker community. Foot Locker, Inc. has its corporate headquarters in New York. For additional information please visit https://www.footlocker-inc.com

Disclosure Regarding Forward-Looking Statements  
This press release contains forward-looking statements within the meaning of the federal securities laws. Other than statements of historical facts, all statements which address activities, events, or developments that the Company anticipates will or may occur in the future, including, but not limited to, such things as future capital expenditures, expansion, strategic plans, financial objectives, dividend payments, stock repurchases, growth of the Company’s business and operations, including future cash flows, revenues, and earnings, and other such matters, are forward-looking statements. These forward-looking statements are based on many assumptions and factors which are detailed in the Company’s filings with the U.S. Securities and Exchange Commission. 

These forward-looking statements are based on our current expectations and beliefs concerning future developments and their potential effect on us. The forward-looking statements contained in this press release are largely based on our expectations for the future, which reflect certain estimates and assumptions made by our management. These estimates and assumptions reflect our best judgment based on currently known market conditions, operating trends, and other factors. Although we believe such estimates and assumptions to be reasonable, they are inherently uncertain and involve a number of risks and uncertainties that are beyond our control. For additional discussion on risks and uncertainties that may affect forward-looking statements, see "Risk Factors" disclosed in the Company’s Annual Report on Form 10-K for the year ended January 30, 2021 filed on March 25, 2021. Any changes in such assumptions or factors could produce significantly different results. The Company undertakes no obligation to update forward-looking statements, whether as a result of new information, future events, or otherwise. 

Investor Contact: 
James R. Lance 
Vice President, Corporate Finance and Investor Relations 
Foot Locker, Inc. 
jlance@footlocker.com 
(212) 720-4600 

Media Contact: 
Cara Tocci 
Vice President, Corporate Communications 
Foot Locker, Inc. 
cara.tocci@footlocker.com 
(914) 582-0304 

Logo – https://mma.prnasia.com/media2/803716/Foot_Locker_Inc_Logo.jpg?p=medium600

Related Links :

http://www.footlocker-inc.com

The Apple M1 Extermination Quietly Continues with the 21.5-inch Intel iMac

Apple’s Silicon M1 chip has proven to be a popular choice for Apple fans. When it was introduced the MacBook Air and MacBook Pro line-up in 2020, the M1 counterpart managed to be cheaper than Apple’s Intel powered MacBook Pro. That could be a good explanation to its popularity. It was a lot more than that though.

The Apple M1 chip has proven itself to be a highly capable processor in both the MacBook and MacBook Pro. This year, Apple launched two more variants of the M1 chip, the M1 Pro and M1 Max. While Apple made the two M1 chips from 2021 sound like completely different processors, they are based on the same architecture and base design. They are still the same M1 chip, just a little oversized, hence more powerful.

2021 sees Apple starting to consider a complete M1 line-up though. They started with the MacBook Pro line-up of course. You will not be able to buy an Intel based MacBook Pro anymore officially starting from now. But the M1 transformation does not stop there. Earlier this year, Apple also introduced the new M1 powered Apple iMac. You still can buy an Intel powered version though, although at a smaller 21.5-inch size.

imac 215 config hero 201706 FMT WHH

As of November 2021 though, you can only buy an iMac powered by Apple’s own M1 chip starting at 24-inch. To be fair though, the 21.5-inch Apple iMac is a little outdated for 2021 and beyond. For a little under MYR 5,000, you are getting an older generation Intel processor. Not just one or two generations older though, if you consider the 11th Generation Intel, the 21.5-inch iMac sports a four-generation old Intel processor.

That does no mean that you cannot get an Intel powered Apple iMac though, you still can. Your only choice is the 27-inch iMac that starts at MYR 7,999. You get a 10th generation Intel Core i5 with up to 8GB of memory and 256GB in storage. For graphics you get an AMD Radeon Pro 5300 GPU. You get a brilliant 5K display with that though. Considering that the M1 powered iMac starts at MYR 5,599 though, the 27-inch Intel powered alternative looks expensive.

With the launch of the M1 Max and M1 Pro chips, we are guessing that Apple will also start shifting directions with their high-end computing solutions like the 27-inch iMac. In that case, we might see Apple axing the Intel powered 27-inch Apple iMacs in the coming year. Would you still want an Intel powered iMac though?

InvestCloud launches InvestCloud X

Next-generation product suite revolutionizes wealth management communication, planning and financial product distribution

LOS ANGELES, Nov. 1, 2021 — InvestCloud, the global leader in financial digital transformation, today unveiled InvestCloud X – its most significant product innovation yet. InvestCloud X is three revolutionary products packaged into one: a Digital Communication platform transforming the way advisors interact with clients, a Digital Planning platform designed to cover the simplest to the most sophisticated needs of all investors, as well as a Digital Shopping platform for financial products called the Financial Supermarket.

Co-founder and CEO John Wise said: "Combining three products into one is a game-changer. The ability to work on plans at different age and wealth moments, then immediately select financial products to achieve these plans, and then monitor, report and communicate in one platform and product is a game-changer."

Like everything InvestCloud has done in its 11 years since inception, InvestCloud X is deployed on InvestCloud’s financial cloud platform, which today supports $6.3 trillion in assets across over 20 million investor accounts in over 40 countries globally. As with all InvestCloud products, InvestCloud X has been designed and built using InvestCloud’s iProgram (formerly known as PWP), the patented AI code generating engine that is a revolution for cost and time to market. Connecting all aspects of InvestCloud X is of course the InvestCloud Digital Warehouse, the custom central data warehouse cataloging data for seamless search and access the world over.

Intuitive Digital Communications

The InvestCloud X Digital Communication platform is a digital platform for client and advisor communication. It enables the creation of custom experiences that can be optimized and refined for an unlimited number of personas and viewed on mobile or desktop, from anywhere, at any time. Using both gaming and decision theory, InvestCloud’s behavioral science offerings encouraging end-users to stay actively engaged in their financial wellness. The platform also leverages AI trained on historical information to serve up custom recommendations for products and actions in a client portfolio.

Intelligent Digital Planning

The InvestCloud X Digital Planning platform offers completely comprehensive financial plans, at any stage of the wealth continuum, from basic goal-based planning for the mass affluent to the sophisticated and complex needs of all investors – including tax and estate planning. As with the Digital Communication platform, the Digital Planning platform is entirely customizable to the end-user, allowing advisors to guide their clients in completing and maintaining their financial plans on their own terms.

Co-founder and Chief Product Officer for Digital Wealth Yaela Shamberg explains: "From Lifestyle to Goal-Based plans, Cashflow, Tax, Trust and Retirement, the Digital Planning platform in InvestCloud X is a fully digital experience, accessed using the InvestCloud X Communication Platform. These Planning tools leverage the same behavioral science techniques that are core to InvestCloud, encouraging engagement with a thorough eye on design and user experience."

A Revolutionary Financial Supermarket

The Financial Supermarket is an Amazon-like marketplace for the financial industry – a financial product marketplace for distributors and manufacturers. With the Financial Supermarket, all products are cataloged on one platform, allowing for simple search by advisors, simple addition by asset managers and simple execution by advisors for clients. The products can be marketed with detailed information – from historical performance data to rich media (video, podcast, etc.), which help paint a clearer picture of the opportunity.

Chief Product Officer for the Financial Supermarket Fred Duden adds: "This is our game-changer. Insights and due diligence are digitized and seamless within the Financial Supermarket. As with all things InvestCloud X, this product information is effortlessly shareable via the Digital Communication platform, and executable via the Digital Planning platform."

InvestCloud hosted a live stream launch event last week, and a recording of the product launch is now available on the InvestCloud website here.

About InvestCloud

InvestCloud is a global company specializing in digital platforms that enable the development of financial solutions, pre-integrated into the Cloud. The company offers on-demand client experiences and intuitive operations solutions using an ever-expanding library of modular apps, resulting in powerful products. Headquartered in Los Angeles, InvestCloud has over 20 global offices including New York, London, Geneva, Singapore and Sydney, supporting trillions in assets across hundreds of diverse clients – from the largest banks in the world to wealth managers, asset managers and asset services companies.

For more information, visit InvestCloud.com.

InvestCloud Media Contact:
Rich Went
Metia Group
+44 (0) 7745 496 065
Rich.Went@Metia.com / InvestCloudUK@Metia.com 

Zenly Lets You Track People and It’s Blowing Up on TikTok

It’s not every day that we see an app blow up because of a social media trend. However, it looks like Zenly is experiencing a spike in popularity thanks to a growing trend on TikTok. The app has seen a 121% growth in active users since the trend gained popularity.

IMG Zenly In App
Source: Zenly

Zenly is an app that allows you to track other people. The app began to see a spike when the trend of showing screen recordings of your loved ones moving on the map in real-time started to gain popularity. The screen recording is accompanied by the song “Segala” by Mohd Mentor. According to Zenly, the trend helped highlight one of the app’s key features which is to allow users to “look out for loved ones and know what they are up to and ensure they are safe”. In fact, the team at Zenly confirmed that the app is frequently used by couples. Some other demographics using the app include best friends, siblings, roommates, and colleagues.

If you recognise the app’s interface, don’t be too surprised. Zenly is part of the Snap Inc family so you probably recognise the interface from the Snapchat app. The app is popular in countries like Japan, Russia, Indonesia and France.

Android is FINALLY Optimizing for Larger Screens with Android 12L

Android tablets have long been a sore spot for the ecosystem. In fact, Android as an ecosystem has hardly made any progress to make the operating system more usable on tablets and larger displays. Currently, these devices use a supersized version of regular Android. Some manufacturers such as Samsung have added some software features to their tablets to further optimise the experience.

Android 12L 2
Source: Google

You may be wondering, “Didn’t Google introduce optimisations with Android Honeycomb?”. The short answer – yes they did. That said, since then, many of these changes have been rolled back. Years after the fact, it looks like Google is finally addressing the issue at a root OS level.

Mid-life Update for Android 12

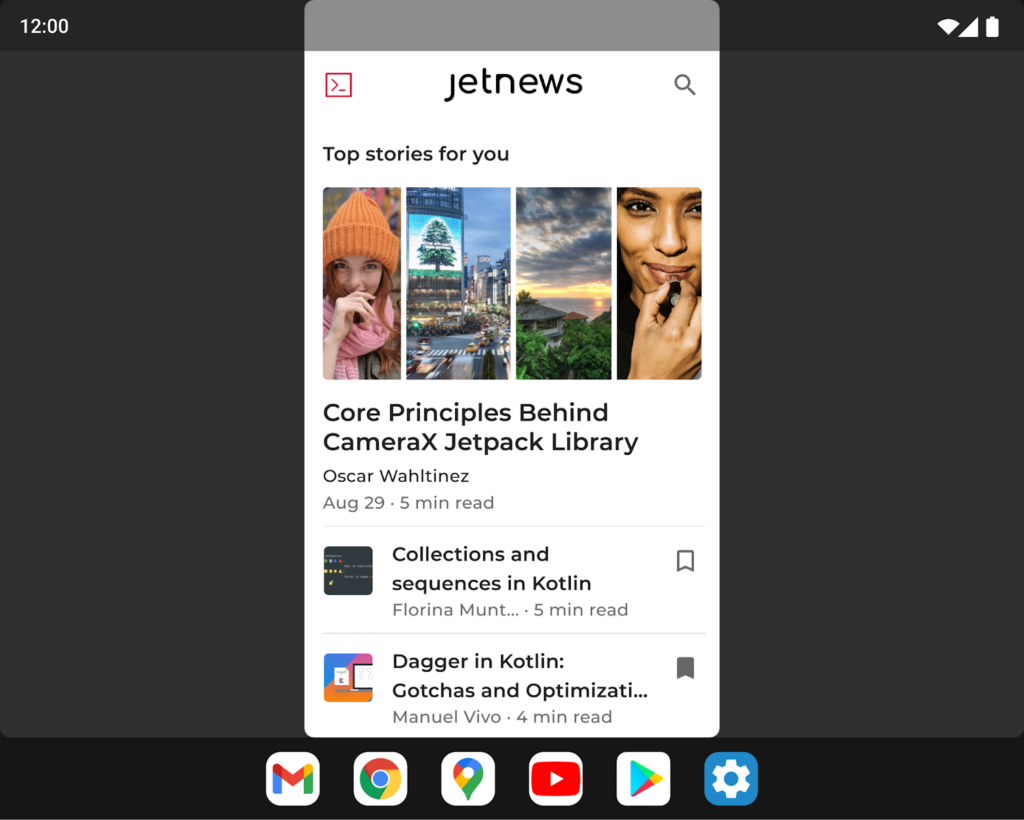
Android 12L is an upcoming update that will introduce changes that will optimise the operating system for tablets and foldable devices. Android 12L will be rolled out as a mid-life update for Android 12. L, of course, stands for Large. That said, the update to Android 12L is also bringing an update when it comes to SDK. The current Android 12 SDK is known to developers as API Level 32. The new API level brings significant changes in how Android deals with and recognises large screens and foldables.

Android 12L 2

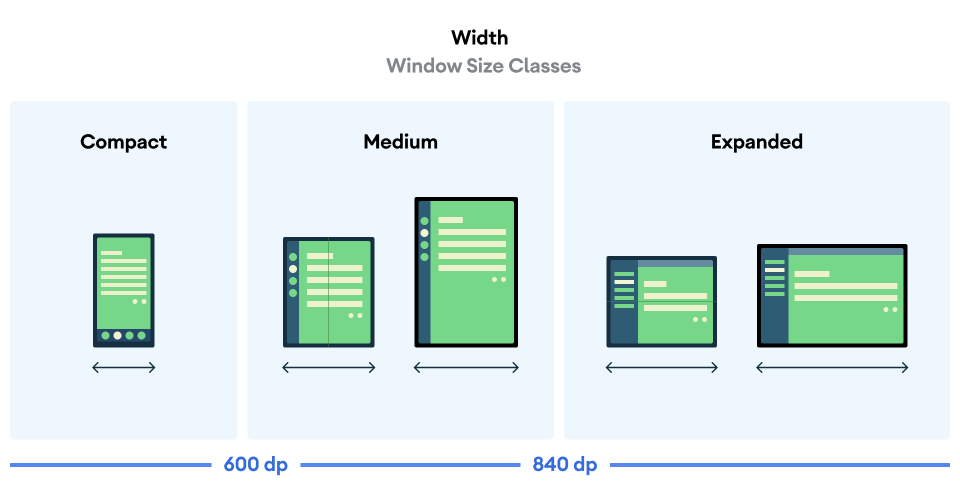
The new API level brings a focus on multitasking and maximising the additional forms and display space that comes with larger devices. The biggest change in the SDK is apps defaulting to multitasking mode for apps to help with compatibility and scalability. Google is also streamlining scalability. “WindowMetics” and “WindowSizeClasses” APIs will address developers’ woes in developing for the wide variety of different sizes present on Android devices. The new APIs will provide information and guides or “opinionated layout breakpoints” which will allow devs to better optimise and adapt.

Visually Improved and Geared for Productivity

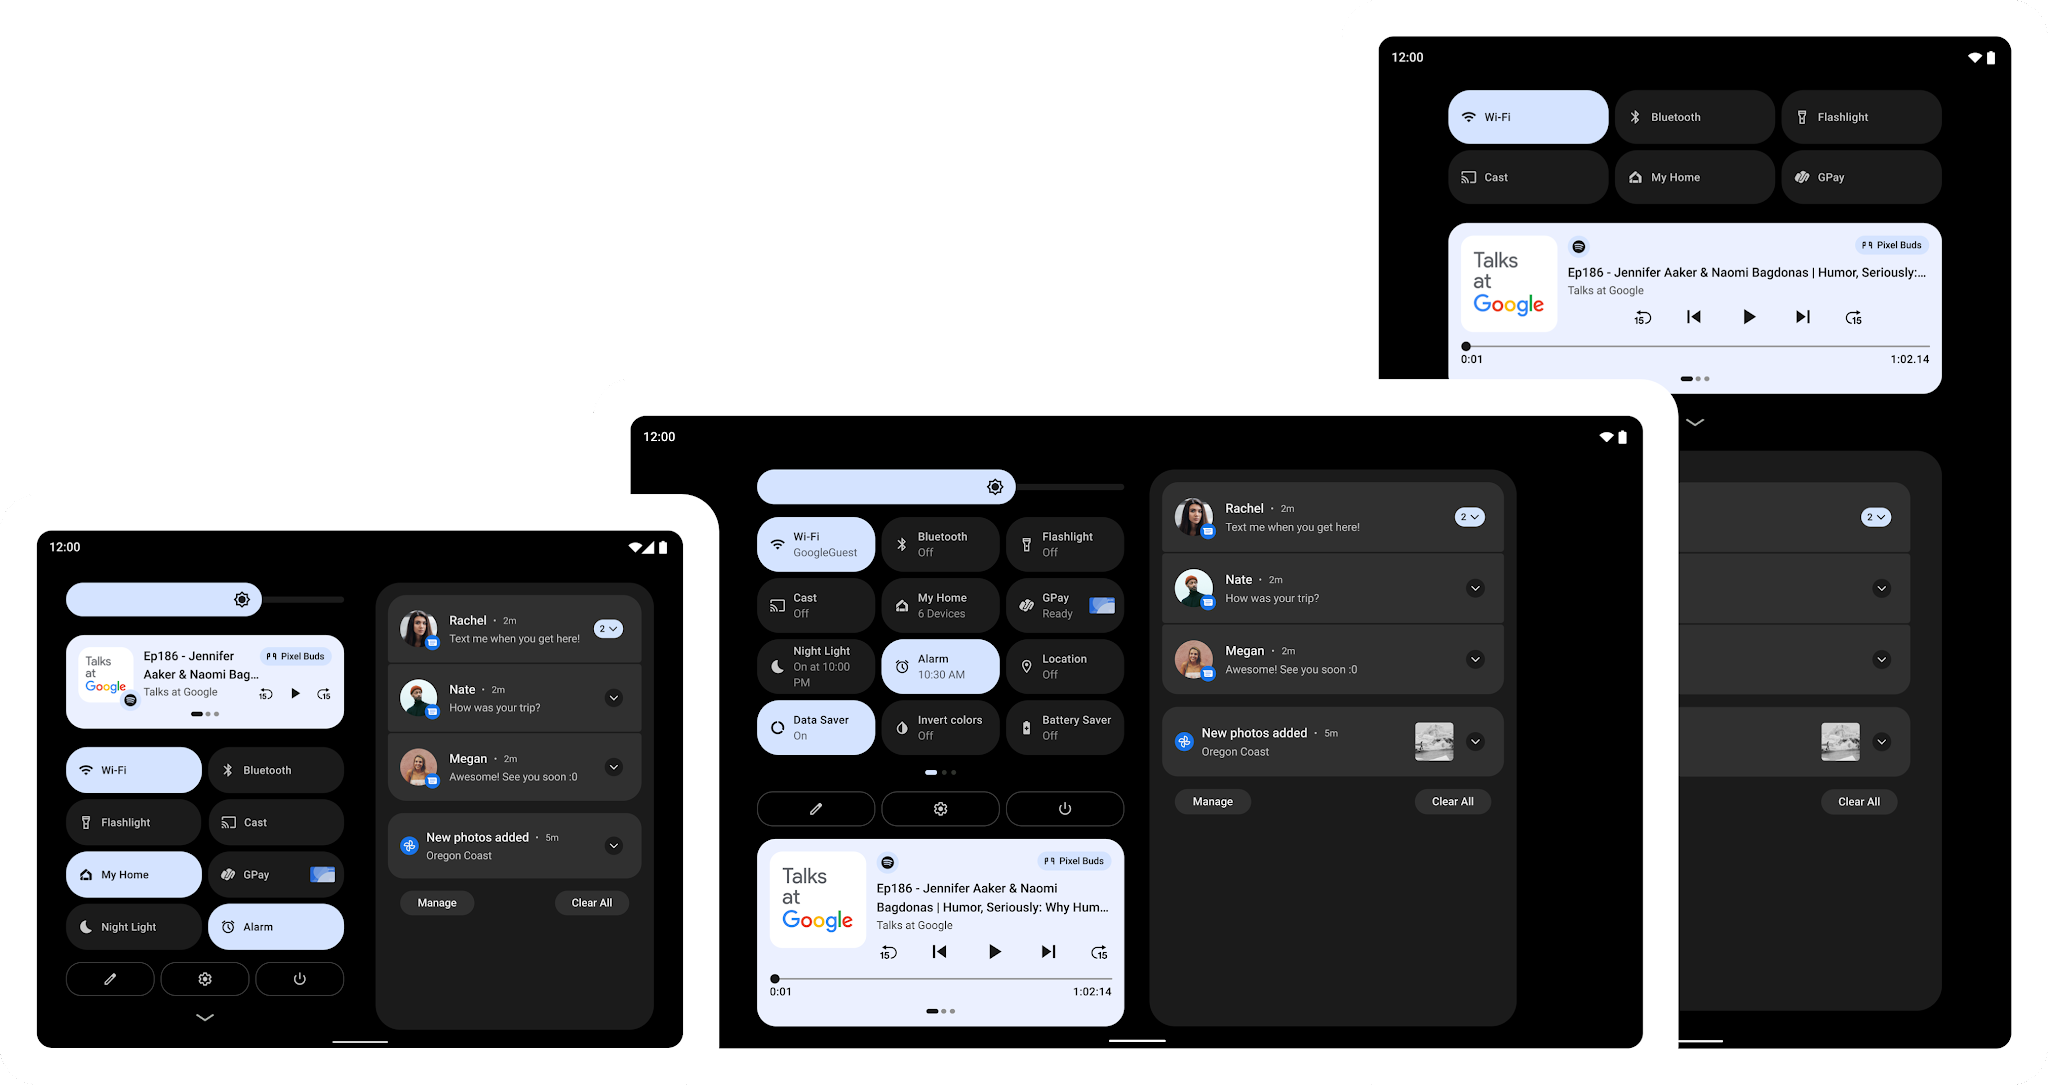
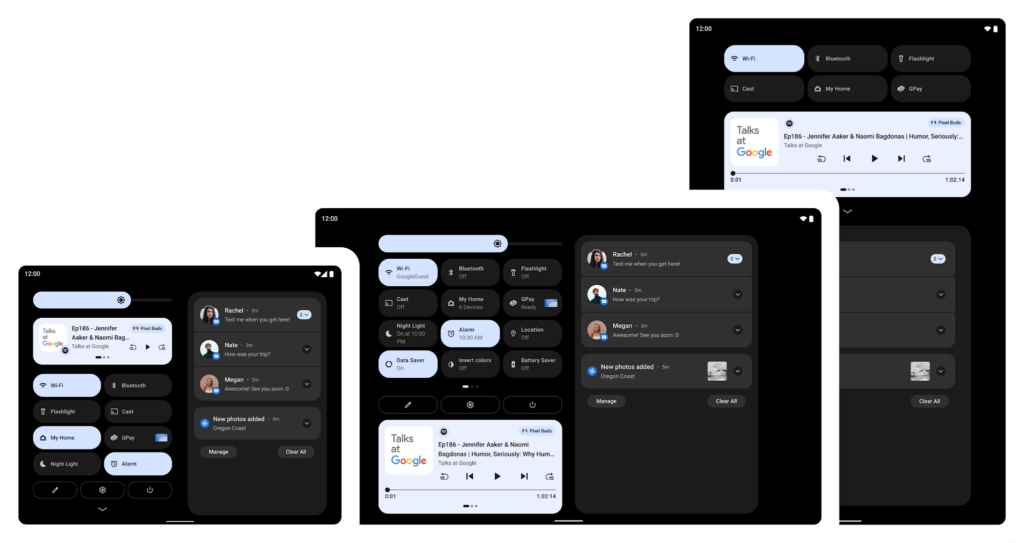
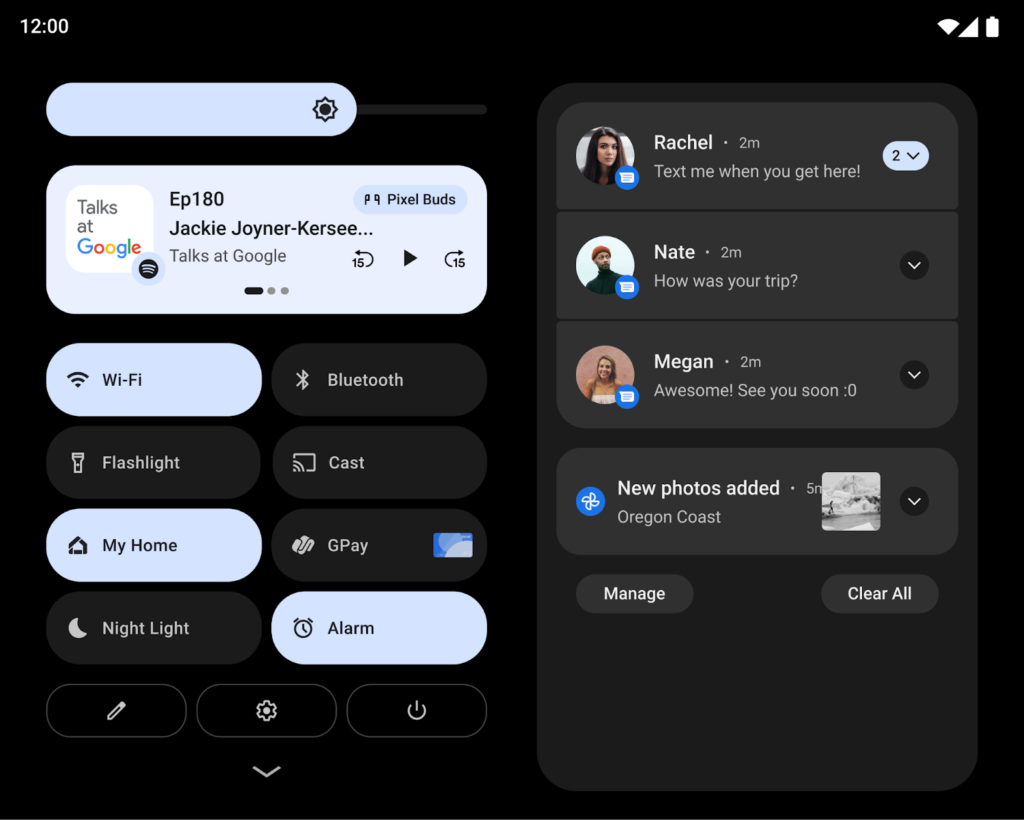
With the introduction of better app adaptability with “WindowsSizeClasses”, it comes as no surprise that Android 12L will come with graphical changes that help with multitasking. The biggest change comes in the system menus and UI elements. These have been updated to support two columns graphically. We’ve seen this layout previously in devices like the iPad and also Samsung’s Galaxy Tab S7 series. The two columns allow more actionable content to be shown at a glance making it easier to get to options. The new layout defaults also make their way to the notification shade allowing users to see and access more on larger screens.

Android 12L 4

12L is also bringing along a new taskbar. The taskbar is akin to the one Android had in Honeycomb but brings a sharper focus on multitasking. The new taskbar will allow users to drag apps into split-screen and multiwindow mode seamlessly. Apps across the board will be able to do this regardless of optimisations. Devs will need to optimise for the best compatibility. However, if the app isn’t updated, it will be forced into compatibility mode. In addition to behaving more like Windows and macOS taskbar, the navigation on larger screens will be relegated to the corner of the taskbar for more ergonomic accessibility.

Better App Visibility on the Google Play Store

In addition to the visual changes and software optimisation, Google is also finally addressing the app situation on the Google Play Store. Using some of the optimisation and new APIs available in Android 12L, Google will be surfacing apps better optimised for tablets and larger screens more efficiently. The Google Play Store itself is getting a visual update to better utilise large screens. Users will be able to have better access to different pages and options at a glance.

Google will also be introducing new checks to assess large-screen apps. These checks will allow Google to better surface properly optimised apps. In addition, they are introducing large-screen specific app ratings. Larger screen devices will also be prompted when apps are ill-optimised.

Release & Development

With the announcement of Android 12L, it comes as no surprise that we are eager to see these optimisations make their way to larger devices soon. According to the announcement, there will be a developer preview with three betas before the final release in Q1 2022. The developer preview is currently available for the Lenovo Tab P2 and Samsung’s Galaxy Z Fold3.

Call for Entries Issued for 9th Annual Asia-Pacific Stevie Awards

The only business awards to recognize innovation in business throughout the entire region

FAIRFAX, Va., Nov. 1, 2021 — The Stevie® Awards have issued the call for entries for the 2022 (9th annual) Asia-Pacific Stevie® Awards, the only business awards program to recognize innovation in business throughout the entire Asia-Pacific region. 


The early-bird entry deadline, with discounted entry fees, is November 23, 2021. The entry deadline is January 19, 2022, but late entries will be accepted through March 2 with the payment of a late fee. Complete entry details are available at http://Asia.StevieAwards.com.

The Asia-Pacific Stevie Awards are open to all organizations in the 29 nations of the Asia-Pacific region: large and small, for-profit and non-profit, public and private.

The awards focus on recognizing innovation in all its forms, wherever it is achieved in the workplace. Entries will be accepted in eight languages – Chinese, English, Indonesian, Japanese, Korean, Malay, Thai and Vietnamese – in the following awards category groups:

A new category group for 2022 will recognize Social Media innovations, in content creation and moderation, management, and marketing since July 1 2019.

Asia-Pacific Stevie Award winners will be announced on April 17. Winners will be celebrated and presented their awards during an awards banquet on May 27. In the event that we are unable to stage the banquet because of COVID-19, we will stage a virtual awards ceremony instead.

Scores of professionals from throughout the region will participate in the judging process to determine the Stevie winners.

Some of the Asia-Pacific region’s most innovative organizations have won Asia-Pacific Stevie Awards in the past five years including ABS-CBN Corporation, Cisco Systems, DHL Asia Pacific Shared Services, EventsAIR, Freelancer.com, Google, Great Eagle Holdings, Globe Telecom, HLC Group, Hong Kong Tourism Board, HP Inc., IBM, KEB HANA Bank, KEPCO, KT, MSLGROUP China, Ooredoo, PT Petrokimia Gresik, Singapore Power, SM Supermalls, Tata Consultancy Services, Telkom Indonesia, VNPT Vinaphone Corporation, Viettel, and more.

The Stevie Award is among the world’s most coveted prizes. The name Stevie is taken from the name Stephen, which is derived from the Greek for "crowned."

About the Stevie Awards
Stevie Awards are conferred in eight programs: the Asia-Pacific Stevie Awards, the German Stevie Awards, the Middle East & North Africa Stevie Awards, The American Business Awards®, The International Business Awards®, the Stevie Awards for Women in Business, the Stevie Awards for Great Employers and the Stevie Awards for Sales & Customer Service. Stevie Awards competitions receive more than 12,000 nominations each year from organizations in more than 70 nations. Honoring organizations of all types and sizes and the people behind them, the Stevies recognize outstanding performances in the workplace worldwide. Learn more about the Stevie Awards at www.StevieAwards.com.

– Stevie®, American Business Awards® and International Business Awards® are registered trademarks of Stevie Awards, Inc.

PR Newswire Asia is the official news release distribution partner of the 2022 Asia-Pacific Stevie Awards.

Related Links :

https://stevieawards.com/