MediaTek Unveils Its Newest 5G Chipset, Dimensity 700, For Mass Market 5G Smartphones

Dimensity 700 caters to growing consumer demand for 5G devices

HSINCHU, Taiwan, Nov. 11, 2020 — MediaTek today unveiled its new Dimensity 700 5G smartphone chipset, a 7nm SoC designed to bring advanced 5G capabilities and experiences to the mass market. The addition of the Dimensity 700 to MediaTek’s Dimensity family of 5G chips gives device makers a full suite of options for 5G smartphone models – from flagship and premium to mid-range and mass market devices – making 5G more accessible for consumers everywhere.

Dimensity 700
Dimensity 700

"With our expanded Dimensity portfolio we’re bringing the latest 5G capabilities to every smartphone tier so more people can enjoy 5G experiences," said Dr. JC Hsu, Corporate VP and GM of MediaTek’s Wireless Communications Business Unit. "The Dimensity 700 has an impressive mix of 5G connectivity features, advanced camera capabilities like night shot enhancements and multiple voice assistant support, all in a super power-efficient design."

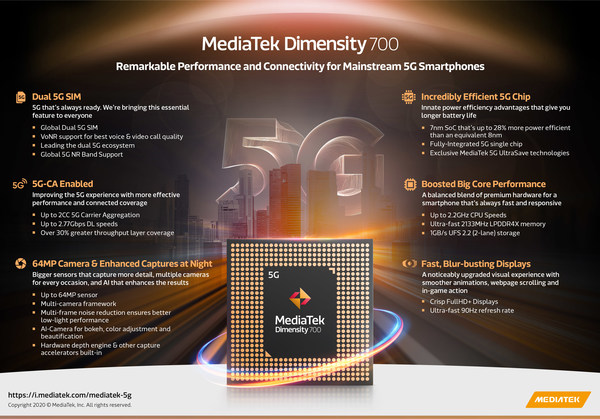
The Dimensity 700 packs advanced connectivity features including 5G Carrier Aggregation (2CC 5G-CA) and 5G dual SIM dual standby (DSDS), giving users access to the fastest speeds and 5G-exclusive Voice over New Radio (VoNR) services from either connection. On the processing power side, the chip integrates two Arm Cortex-A76 big cores in its octa-core CPU and operates at up to 2.2GHz.

Key features of Dimensity 700 include:

  • MediaTek 5G UltraSave: Delivers advanced power-saving technologies to improve battery life. It includes UltraSave Network Environment Detection, MediaTek 5G UltraSave OTA Content Awareness, Dynamic BWP and Connected Mode DRX. The built-in technology intelligently manages a device’s 5G connection so you can do more and charge your device less often.
  • Premium 90Hz Display: Brands can design smartphones with crisp, high resolution FullHD+ displays and ultra-fast refresh rates to reduce blur in animations, scrolling and games for the best user experience.
  • Up to 64MP Cameras & Night Shot Enhancements: Supports 48MP or 64MP main camera sensors with AI-bokeh, AI-color and AI-beauty features. Plus, the integrated hardware-based imaging accelerators enable multi-frame noise reduction so users can capture high quality shots with low noise, even at night.  
  • Multiple Voice Assistant Support: Supports voice assistants from global brands such as Alibaba, Amazon, Baidu, Google and Tencent to give device makers more configuration options.

Dimensity 700 Infographic

The Dimensity 700 continues MediaTek’s legacy of bringing advanced connectivity, multimedia and imaging features to consumers everywhere. MediaTek’s Dimensity 5G family of chips bring smart and fast together to power 5G devices across all tiers, and with the Dimensity 700 5G devices will now be accessible to even more consumers.

For full specifications and further details on MediaTek’s Dimensity 700 series and 5G portfolio visit: https://i.mediatek.com/mediatek-5g

About MediaTek Inc.

MediaTek Incorporated (TWSE: 2454) is a global fabless semiconductor company that enables 1.5 billion connected devices a year. We are a market leader in developing innovative systems-on-chip (SoC) for mobile device, home entertainment, connectivity and IoT products. Our dedication to innovation has positioned us as a driving market force in several key technology areas, including highly power-efficient mobile technologies, automotive solutions and a broad range of advanced multimedia products such as smartphones, tablets, digital televisions, 5G, Voice Assistant Devices (VAD) and wearables. MediaTek empowers and inspires people to expand their horizons and achieve their goals through smart technology, more easily and efficiently than ever before. We work with the brands you love to make great technology accessible to everyone, and it drives everything we do. Visit www.mediatek.com for more information.

MediaTek Press Office:

PR@mediatek.com
Kevin Keating, MediaTek
+1- 206-321-7295
10188 Telesis Ct #500, San Diego, CA 92121, USA

Related Links :

http://www.mediatek.com

Secoo reached cooperation with Moutai to further penetrate the high-end consumer demand for Chinese liquor

BEIJING, Nov. 10, 2020On September 17, 2020, Secoo (NASDAQ: SECO) and Kweichow Moutai reached cooperation whereby the 53 degrees Feitian Moutai, valued at RMB 1499 per bottle, will officially be launched on Secoo e-commerce platforms. The agreement will provide Moutai liquor access to over 36 million Secoo’s high-end users, delivering the concept of a premium quality lifestyle.

The cooperation reached by the two parties will enhance Secoo’s portfolio of liquor brands and also further satisfied Secoo’s high-end members’ strong demand for Kweichow Moutai. The alliance between Kweichow Moutai and Secoo will not only extend Moutai’s traditional sales & marketing channels but provide a targeted premium sales channel to service the premium Moutai fans.

About Secoo Holding Limited

Secoo Holding Limited ("Secoo") is one of Asia’s largest online integrated premium products and services platform. Secoo provides customers a wide selection of authentic upscale products and lifestyle services on the Company’s integrated online and offline shopping platforms, consisting of the Secoo.com website, mobile applications, and offline experience centers, offering over 400,000 SKUs, covering over 3,800 global and domestic brands. Supported by the Company’s proprietary database of upscale products, authentication procedures, and brand cooperation, Secoo can ensure every product’s authenticity and quality.  For more information, please visit ir.secoo.com.

About Kweichow Moutai

China Kweichow Moutai Distillery Group Co., LTD, is a state-owned enterprise. Moutai Group headquarters located in Moutai town, Zunyi, Guizhou province, China. Moutai’s top products have an established long history and have profoundly penetrated the Chinese culture, exemplary examples of Chinese white liquor, and classic representation of China’s liquor. Moutai is fully bioorganic and the representative of Chinese green organic food and geography-based liquor.

The first industrial community planning in Chengdu is being launched in Pidu

CHENGDU, China, Nov. 10, 2020On October 28, 2020, the development and governance planning of internationalization industry community of Jingrong Lake in Chengdu’s Pidu District was officially announced.

Centering on the electronic information industry function area and two IP status of "Snow Mountain mirring Jingrong Lake", According to the concept of park city, Focusing on Ching Yung Lake community, Pidu District is trying to deepen scene creation and scientific and systematic governance, so as to create an integrated industrial park city demonstration area in the whole area of Deyuan Street. It is worth mentioning that this is also the first industrial community planning in Chengdu. The plan is to be implemented in three stages between 2020 and 2025.

The internationalization industrial community of Jingong Lake in JingongTown of Pidu District is one of the representatives of the industry community in the city, which is most in line with the relevant indicators in the Status of The Guidelines. With a planned area of 22 square kilometers, over 30,000 industrial talents, the proportion of the upper-level population is rising gradually, and the age structure is getting younger. As a result, employment is likely to be in the direction of technology and RESEARCH and development.

Open the scene map of Jingrong Lake International Industrial Community. Sheraton Hotel and Ace International School are under construction. The layout of Guangdong, Hong Kong, Macao (Chengdu) International Convention and Exhibition Center and other high-end business forms was completed. Within a radius of 3 kilometers, there is a people’s Hospital in Pidu District, Chinese Medicine hospital in Pidu District, a government center, library, gym, food street, an intelligent residence in Pidu City, a kindergarten, a streetcar and other facilities. In this way, a convenient and complete "15-minute life circle" can be basically formed.

As an important functional supporting area for the electronic information industry of a trillion level, an industrial park city demonstration area integrating multiple functions including production, research and development, residence, consumption, service and ecology, and an example of the deep integration of high-quality ecological livable place and human-urban industry are rising rapidly.


Adyen to expand into the Middle East, opens Dubai office


AMSTERDAM, Nov. 10, 2020 — Adyen (AMS: ADYEN), the global payments platform of choice for many of the world’s leading companies, announced today that it will expand its offering to the Middle East. Supporting the momentum of innovation and diversification of the business landscape in the Middle East, the company has opened an office in Dubai. This will enable Adyen’s existing merchant base to easily move into the region and provide merchants from the region with access to the full strength of the Adyen platform.

"We’re very excited to open our Dubai office, this is an incredibly dynamic market," said Sander Maertens, Head of Middle East for Adyen. "For us, it’s important to be able to offer local expertise to our merchants — that’s why opening a local office is essential."

Offering a broad range of local payment methods, so shoppers can pay using their preferred payment methods, is vital to online success. To enable its merchants in best servicing their shoppers in the Middle East region, Adyen integrated with a host of key local payment methods – amongst which Fawry, Mada, Meeza, KNET, NAPS, BENEFIT, and OmanNet.

"Investing in our global reach to support our merchants is something we’re constantly working on — and this is a very interesting region for them," said Pieter van der Does, co-founder and CEO of Adyen. "There’s a lot happening in the Middle Eastern market, and we’re excited to be a part of it."

About Adyen
Adyen (AMS: ADYEN) is the payments platform of choice for many of the world’s leading companies, providing a modern end-to-end infrastructure connecting directly to Visa, Mastercard, and consumers’ globally preferred payment methods. Adyen delivers frictionless payments across online, mobile, and in-store channels. With offices across the world, Adyen serves customers including Facebook, Uber, Spotify, Casper, Bonobos and L’Oréal. The opening of new offices as described in this press release underlines Adyen’s continuous growth across geographies over the years.

Logo – https://mma.prnasia.com/media2/432569/Adyen_Logo.jpg?p=medium600  

Ericsson Capital Markets Day 2020

STOCKHOLM, Nov. 10, 2020

  • Turn-around completed establishing a strong platform to accelerate growth and investments in 5G enterprise applications
  • New long-term EBITA margin target, excluding restructuring, for the Group of 15% – 18%
  • New long-term Free Cash flow (before M&A) target of 9% – 12% of sales
  • The 2022 operating margin target, excluding restructuring, of 12 – 14% remains for the Group with some adjustments between segments

Ericsson (NASDAQ: ERIC) will outline revised strategic growth ambitions and new long-term financial targets at its Capital Markets Day 2020 on November 10, 2020.

Executives from across the business will join President and CEO, Börje Ekholm, to share insights from the company’s three-year focused turnaround, and articulate ambitions to strengthen the Group, with a particular emphasis on long-term growth in the enterprise market. 

Since the launch of the focused business strategy in 2017, the company has restored profitability, delivered organic growth and is on track towards its 2020 financial targets. With global technology leadership and growing market share in 5G the company is now turning to the next phase of its journey – growing the business through incremental core business growth and acceleration of enterprise focus.

Börje Ekholm, President and CEO, says: "The execution on our focused strategy has delivered a turnaround which creates a robust base for the future and delivered global leadership in 5G today. The Covid-19 pandemic is a humbling reminder that wireless connectivity fundamentally underpins future global growth and so urgent deployment is critical. It will support a global innovation opportunity for consumers and enterprise which touches every corner of our world and every sector of the economy. Our future value is inextricably linked to wider economic growth and we are well-positioned to play a lead role in the ecosystem of operators, businesses, and decision-makers on whose combined shoulders 5G’s full success rests."

Long-term targets

Beyond 2022, the long-term profitability target is an EBITA margin excluding restructuring charges of 15% – 18% for the Group. The company aims to achieve this through improvement activities across the Group. Growth as well as gross margin improvements, driven by software sales and operational leverage, will be the cornerstones in reaching the long-term targets.

The company will continue its focus on free cash flow (before M&A) with a target of 9% – 12% of sales.

2022 profitability targets

The 2022 profitability target for the Group remains unchanged with an operating margin of 12% – 14%, excluding restructuring charges. Each segment target for 2022 is updated with operating margin targets per segment detailed in the table below.

The increased target in segment Networks is mainly driven by our foot-print gains in the market. The 2022 operating margin target for Networks is raised to 16% – 18% (15% – 17%).

In segment Digital Services, the priority continues to be restoring profitability. Due to the increase in R&D spend in combination with the decline in legacy sales the Operating Margin target is adjusted to 4% – 7% (10% – 12%) in 2022.

In segment Managed Services, expected margin growth will be achieved through R&D investments in Artificial Intelligence and automation. The 2022 target for Managed Services is raised to 9% – 11% (8% – 10%).

In segment Emerging Business and Other focus continues to be on establishing new businesses which drive organic growth. Revenue growth will be targeted through the rapid and disciplined product deployment in 5G and IoT as well as the recent acquisition of Cradlepoint.

Financial targets 2022 and long-term

Investor Update 2019 numbers in brackets.

% of sales

Networks

Digital Services

Managed Services

Emerging Business and Other

Group

2022 EBIT excluding restructuring

16% – 18%

 (15% – 17%)

4% – 7%

(10% – 12%)

9% – 11%

(8% – 10%)

12%-14%

(no change)

Long-term target EBITA excluding restructuring

15% – 18%

Long-term Free Cash Flow (before M&A)

9% – 12%

Addition to Risk Factors (as published in Annual and Quarterly Reports)

Ongoing geopolitical and trade uncertainty from a range of factors may have a material adverse impact on Ericsson’s business, operations, business prospects and consequently on operating results, financial conditions and our ability to meet its targets.  These uncertainties, include the effects from ongoing trade disputes – notably between the US and China, and the uncertainty on how the change in US administration following the result of the 2020 Presidential Election may impact that trade dispute; and uncertainties for the future bilateral trading relationship between Sweden and China as a result of the decision of the Swedish Post and Telecom Authority to exclude Chinese vendors from participation in 5G.

Speakers and details of the event

Börje Ekholm, President and CEO, and Carl Mellander, CFO, will be joined by members of the company’s Executive Team. The speakers include Erik Ekudden, CTO, Fredrik Jejdling, Head of Business Area Networks, Jan Karlsson, Head of Business Area Digital Services, Peter Laurin, Head of Business Area Managed Services, Åsa Tamsons, Head of Business Area Technologies and New Businesses, Niklas Heuveldop, Head of Market Area North America, and Chris Houghton, Head of Market Area North East Asia.

Ericsson’s Capital Markets Day event can be accessed via the Ericsson website:

https://www.ericsson.com/en/investors/events-and-presentations/CMD2020  

Presentation materials can also be downloaded from the website once the webcast has started.

NOTES TO EDITORS:

FOLLOW US:

Subscribe to Ericsson press releases here.

www.twitter.com/ericsson

www.facebook.com/ericsson

www.linkedin.com/company/ericsson

FOR FURTHER INFORMATION, PLEASE CONTACT

Contact person
Peter Nyquist, Head of Investor Relations
Phone: +46 705 75 29 06
E-mail: peter.nyquist@ericsson.com

Additional contact
Stella Medlicott, Senior Vice President, Marketing and Corporate Relations
Phone: +46 730 95 65 39
E-mail: media.relations@ericsson.com

Investors
Stefan Jelvin, Director, Investor Relations
Phone: +46 709 86 02 27
E-mail: stefan.jelvin@ericsson.com

Lena Häggblom, Director, Investor Relations
Phone:  +46 72 593 27 78
E-mail:  lena.haggblom@ericsson.com

Media
Peter Olofsson, Head of Corporate Communications
Phone: +46 702 67 34 45
E-mail: media.relations@ericsson.com

Corporate Communications
Phone: +46 10 719 69 92
E-mail: media.relations@ericsson.com

About Ericsson

Ericsson enables communications service providers to capture the full value of connectivity. The company’s portfolio spans Networks, Digital Services, Managed Services, and Emerging Business and is designed to help our customers go digital, increase efficiency and find new revenue streams. Ericsson’s investments in innovation have delivered the benefits of telephony and mobile broadband to billions of people around the world. The Ericsson stock is listed on Nasdaq Stockholm and on Nasdaq New York. www.ericsson.com

Forward-looking statements

This release includes forward-looking statements, including statements reflecting management’s current views relating to the growth of the market, future market conditions, future events, financial condition, and expected operational and financial performance, including, in particular the following:

  • Our goals, strategies, planning assumptions and operational or financial performance expectations
  • Industry trends, future characteristics and development of the markets in which we operate
  • Our future liquidity, capital resources, capital expenditures, cost savings and profitability
  • The expected demand for our existing and new products and services as well as plans to launch new products and services including research and development expenditures
  • The ability to deliver on future plans and to realize potential for future growth
  • The expected operational or financial performance of strategic cooperation activities and joint ventures
  • The time until acquired entities and businesses will be integrated and accretive to income
  • Technology and industry trends including the regulatory and standardization environment in which we operate, competition and our customer structure.

The words "believe," "expect," "foresee," "anticipate," "assume," "intend," "likely," "projects," "may," "could," "plan," "estimate," "forecast," "will," "should," "would," "predict," "aim," "ambition," "seek," "potential," "target," "might," "continue," or, in each case, their negative or variations, and similar words or expressions are used to identify forward-looking statements. Any statement that refers to expectations, projections or other characterizations of future events or circumstances, including any underlying assumptions, are forward-looking statements.

We caution investors that these statements are subject to risks and uncertainties many of which are difficult to predict and generally beyond our control that could cause actual results to differ materially from those expressed in, or implied or projected by, the forward-looking information and statements.

Important factors that could affect whether and to what extent any of our forward-looking statements materialize include, but are not limited to, the factors described in the section "Risk Factors" in the latest interim report, and in "Risk Factors" in the Annual Report 2019.

These forward-looking statements also represent our estimates and assumptions only as of the date that they were made. We expressly disclaim a duty to provide updates to these forward-looking statements, and the estimates and assumptions associated with them, after the date of this release, to reflect events or changes in circumstances or changes in expectations or the occurrence of anticipated events, whether as a result of new information, future events or otherwise, except as required by applicable law or stock exchange regulations.

This information is information that Telefonaktiebolaget LM Ericsson is obliged to make public pursuant to the EU Market Abuse Regulation. The information was submitted for publication, through the agency of the contact person set out above at 10:00 pm CET on November 9, 2020.

This information was brought to you by Cision http://news.cision.com

https://news.cision.com/ericsson/r/ericsson-capital-markets-day-2020,c3234079

The following files are available for download:

https://mb.cision.com/Main/15448/3234079/1332731.pdf

Ericsson Capital Markets Day 2020


USI Strives Toward Industry 4.0 through the Deployment of Smart Manufacturing

SHANGHAI, Nov. 10, 2020 — The development of smart manufacturing and industry 4.0 concepts in the manufacturing industry has become a key strategy for companies seeking to improve quality, safety and advance their technology. USI (SSE: 601231), a leading electronics designer and manufacturer in the world, is improving productivity standards and manufacturing quality through the deployment of networked infrastructure, automatic data collection, real-time monitoring and analysis, big data analysis, electronic reports and parameter management. 

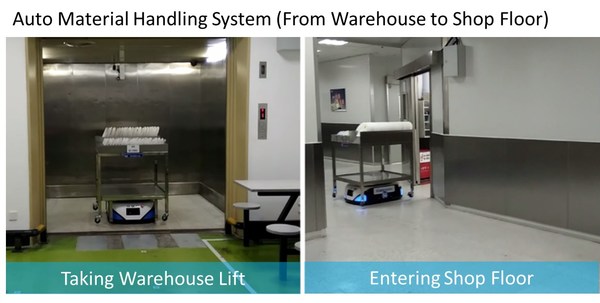
Auto Material Handling System (From Warehouse to Shop Floor)

In recent years, the manufacturing industry has undergone profound changes. A low-cost business model is no longer competitive enough to meet the rising demands of a transformed industry that has moved up the value chain, nor resist the advent of smart manufacturing. "USI is adopting smart manufacturing to enhance our competitiveness through the digitalization of our production processes including the automation of infrastructure and logistics using robotics and automated guided vehicles," said Jim Cao, General Manager of Greater Shanghai and Smart Manufacturing/SiM BU, USI. "In addition, we are establishing real-time management and control, online quality and parameter management systems, that will assist our engineers in preempting, troubleshooting and analyzing data, in order to achieve a smart manufacturing environment," he continued.

With the increasing complexity of SiP (System-in-Package) technologies and the need to maintain a competitive lead, USI established a flagship smart manufacturing factory at its Zhangjiang, Shanghai facility in 2013. USI’s smart manufacturing division and the R&D Engineering team have co-developed an integrated production facility test and inspection system that enables efficiency and quality in the production process. The implementation of equipment automation has already demonstrated significant positive impacts, and the number of automation programs introduced by USI will continue to increase at a rate of 20% each year.

USI adopts the IIoT (Industrial Internet of Things) concept to establish a smart manufacturing ‘5-star rating’ system (for example; 100% automation, over 80% of production lines adopting lights off manufacturing, less than 30% direct manpower) that combines big data and industry standards. USI has 9 factories in the world, among which is the Zhangjiang Factory in Shanghai that boasts the highest level of automation. USI is planning to transform all its factories into 3-star and 4-star levels by 2023 and upgrade four of its factories into lights out factories (5-star level) by 2025. By that time, all the machinery in the lights out factories will be connected to the internet, and a parameter management system will be established. Achieving complete automation in manufacturing will reduce human error and raise product quality, whilst an automated logistics system will help connect remote sites to enable real-time production monitoring and increase production efficiency.

About USI

USI (SSE: 601231, A constituent of CSI300 Index), Universal Scientific Industrial (Shanghai) Co., Ltd., is a global leader in electronic design and manufacturing as well as a leader in the field of SiP (System in Package) modules. USI provides D (MS)2 product services: Design, Manufacturing, Miniaturization, Industrial software and hardware Solutions, and material procurement, logistics and maintenance Services. With a sales and service network in America, Europe, and Asia; and manufacturing sites in Mainland China, Taiwan, Mexico and Poland, USI offers customer diversified products in the sectors of wireless communication, computer and storage, consumer, industrial, and automotive electronics worldwide. USI is one of subsidiaries of ASE Technology Holding Co., Ltd. which is the leading provider of semiconductor manufacturing services in assembly and test in the world. To learn more, visit www.usiglobal.com and engage with us on LinkedIn and YouTube.

Yalla Group Limited Announces Unaudited Third Quarter 2020 Financial Results

DUBAI, UAE, Nov. 10, 2020 — Yalla Group Limited ("Yalla" or the "Company") (NYSE: YALA), the leading voice-centric social networking and entertainment platform in the Middle East and North Africa (MENA), today announced its unaudited financial results for the three months ended September 30, 2020.

Third Quarter Ended September 30, 2020 Financial and Operating Highlights

  • Our revenues were US$33.8 million in the third quarter of 2020, representing an increase of 90.4% from the third quarter of 2019.
    – Revenues generated from chatting services in the third quarter of 2020 were US$30.3 million.
    – Revenues generated from games services in the third quarter of 2020 were US$3.5 million.
  • Net loss was US$31.0 million in the third quarter, and our net loss margin was 91.6%.
  • Non-GAAP Net income[1] was US$15.5 million in the third quarter of 2020, representing an increase of 68.3% from the third quarter of 2019. Our non-GAAP net margin was 45.8% in the third quarter of 2020.
  • Average MAUs[2] increased by 358.9% to 14.3 million in the third quarter from 3.1 million in the same period 2019.
  • The number of paying users[3] on our platform increased by 894.9% to 5.1 million in the third quarter of 2020 from 0.5 million in the same period of 2019.


[1] Non-GAAP net income represents net income (loss) before share-based compensation. Non-GAAP net income is a non-GAAP financial measure. See the sections entitled "Non-GAAP Financial Measures" and "Reconciliations of Non-GAAP Measures to the Nearest Comparable GAAP Measures" for more information about the non-GAAP measures referred to in this results announcement.

[2] "Average MAUs" refers to the average monthly active users in a given period calculated by dividing (i) the sum of active users for each month of such period, by (ii) the number of months in such period. "Active users" refers to registered users who accessed any of our mobile applications at least once during a given period.

[3] "Paying users" refers to registered users who purchased our virtual items or upgrade services using virtual currencies on our platform at least once in a given period, except for users who receive all of their virtual currencies directly or indirectly from us for free. "Registered users" refers to users who have registered accounts on our platform as of a given time; a registered user is not necessarily a unique user, however, as an individual may register multiple accounts on our platform, and consequently, the number of registered users we present in this prospectus may not equal the number of unique users who have registered on our platform as of a given time.


Key Operating Data

For the three months ended

September 30, 2019

September 30, 2020

Average MAUs (in thousands)

3,109

14,267

Yalla (in thousands)

2,716

5,500

Yalla Ludo (in thousands)

393

8,767

Paying users (in thousands)

510

5,074

Yalla (in thousands)

493

1,035

Yalla Ludo (in thousands)

17

4,039

"In the third quarter of 2020, we delivered robust group performance, further strengthening our position as the pioneering voice-centric mobile social networking and entertainment platform in MENA," said Mr.Yang Tao, Founder, Chairman and Chief Executive Officer of Yalla. "Our revenue and non-GAAP net income increased, 90.4% and 68.3% year-over-year respectively, which was driven by strong growth of Yalla and Yalla Ludo and the proliferation of our highly engaged and interactive community."

"In the third quarter, Yalla Ludo’s average MAUs and paying users increased significantly by over 20 and 200 times year-over-year, respectively. The rapidly growing popularity of Yalla Ludo, which was selected by numerous app stores to be displayed on their respective home pages, is a testament to its superior social features, which are grounded in the cultural norms of the region and enable users to enjoy real-time voice interactions while playing board games. For Yalla, our flagship mobile application, we maintained a sharp focus on building a tight-knit and high-quality user community. In the third quarter, Yalla’s average MAUs and paying users both more than doubled year-over-year. Moving forward, we will remain dedicated to strengthening our vibrant voice-centric online community and localizing our product offerings to further optimize the user experience," concluded Mr.Yang.

"We are very pleased to report our operating and financial performance for the first time as a public company, where our strong monetization capabilities led to healthy top and bottom line performance in the third quarter," said Ms. Karen Hu, Chief Financial Officer of Yalla. "Revenues reached US$33.8 million in the third quarter, while our non-GAAP net income was US$15.5 million. We were also able to maintain a high non-GAAP net margin of 45.8%. We are confident in our positioning and ability to capture further significant growth in MENA’s underserved online social networking and entertainment market."

Third Quarter 2020 Financial Results

Revenues

Our revenues were US$33.8 million in the third quarter of 2020, a 90.4% increase from US$17.8 million in the same period last year. The increase was primarily driven by the widening of Yalla’s and Yalla Ludo’s user base and the robust enhancement in Yalla Ludo’s monetization capability. Our average MAUs increased by 358.9% from 3.1 million in the third quarter of 2019 to 14.3 million in the third quarter of 2020. Another primary contributor to our solid revenues growth was the significant growth in the number of paying users, which increased from 510 thousand in the third quarter of 2019 to 5,074 thousand in the third quarter of 2020.

Our revenues generated from chatting services were US$30.3 million in the third quarter of 2020, and our revenues generated from the games services were US$3.5 million in the third quarter of 2020.

Costs and expenses

Our total costs and expenses were US$64.7 million in the third quarter of 2020, compared with US$8.6 million in the same period last year. The increase was primarily due to the recognition of share-based compensation of US$46.5 million upon our listing on the New York Stock Exchange on September 30, 2020. We granted substantial amount of share options before the IPO but did not recognize any share-based compensation in prior periods because exercisability of the options granted was conditional upon the completion of our IPO. Upon our listing on the NYSE, we immediately recognized a substantial amount of share-based compensation expenses associated with all outstanding options that were vested as of September 30, 2020.

Our cost of revenues was US$25.6 million in the third quarter of 2020, compared with US$5.4 million in the same period last year. The increase was mainly driven by (i) share-based compensation expenses of US$14.1 million recognized on September 30, 2020, and (ii) other components of cost of revenues of US$11.5 million for the third quarter of 2020, a 112.6% increase from US$5.4 million for the same quarter last year, which was in line with our revenue growth and primarily due to our expanding business scale. Other components of cost of revenues as a percentage of our total revenues increased from 30.6% in the third quarter of 2019 to 34.1% in the same period in 2020, primarily due to an increase in commission rate for third-party payment platforms.

Our selling and marketing expenses were US$8.5 million in the third quarter of 2020, compared with US$1.7 million in the same period last year. The increase was mainly driven by (i) share-based compensation expenses of US$4.5 million recognized on September 30, 2020, and (ii) other components of selling and marketing expenses of US$4.0 million for the third quarter of 2020, a 131.4% increase from US$1.7 million for the same quarter last year, which was primarily due to higher advertising and market promotion expenses as a result of our continued user acquisition efforts. Other components of selling and marketing expenses as a percentage of our total revenues increased from 9.9% in the third quarter of 2019 to 12.0% in the same period in 2020, primarily due to higher spending in marketing activities related to Yalla Ludo, which experienced substantial growth in year 2020.

Our general and administrative expenses were US$28.9 million in the third quarter of 2020, compared with US$1.0 million in the same period last year. The increase was mainly driven by (i) share-based compensation expenses of US$27.1 million recognized on September 30, 2020, and (ii) other components of general and administrative expenses of US$1.8 million for the third quarter of 2020, a 78.4% increase from US$1.0 million for the same quarter last year, which was primarily due to (i) an increase in salaries and other benefits for our general and administrative staff, which was in turn driven by an expansion of our general and administrative staff, and (ii) an increase in professional service fees. Other components of general and administrative expenses as a percentage of our total revenues remained stable at 5.3% in the third quarter of 2020.

Our technology and product development expenses were US$1.7 million in the third quarter of 2020, compared with US$0.4 million in the same period last year. The increase was mainly driven by (i) share-based compensation expenses of US$0.8 million recognized on September 30, 2020, and (ii) other components of technology and product development expenses of US$0.9 million for the third quarter of 2020, a 105.6% increase from US$0.4 million for the same quarter last year, which was primarily due to an increase in salaries and benefits for our technology and product development staff. Other components of technology and product development expenses as a percentage of our total revenues slightly increased from 2.4% in the third quarter of 2019 to 2.6% in the same period of 2020.

Operating loss

Operating loss was US$30.9 million in the third quarter of 2020, compared with an operating income of US$9.1 million in the third quarter of 2019.

Non-GAAP Operating income

Non-GAAP operating income (which exclude share-based compensation expenses) for the third quarter of 2020 was US$15.6 million, a 70.0% increase from US$9.1 million for the same quarter last year.

Income tax expense

Our income tax expense was US$0.11 million in the third quarter of 2020, compared with US$0.12 million in the third quarter of 2019.

Net loss

As a result of the foregoing, our net loss was US$31.0 million in the third quarter of 2020, compared with net income of US$9.2 million in the third quarter of 2019.

Non-GAAP Net income

Non-GAAP net income (which exclude share-based compensation expenses) for the third quarter of 2020 was US$15.5 million, a 68.3% increase from US$9.2 million for the same quarter last year.

Net Loss and Income Per Share

Basic and diluted net loss per ordinary share were US$0.43 for the third quarter of 2020, while basic and diluted net income per ordinary share was US$0.07 in the same period of 2019. Non-GAAP basic and diluted net income per ordinary share (which exclude share-based compensation expenses) were US$0.20, compared to US$0.07 in the same period of 2019.

Cash and cash equivalents

As of September 30, 2020, we had cash and cash equivalents of US$75.7 million, as compared to cash and cash equivalents of US$58.5 million as of June 30, 2020.

Outlook

For the fourth quarter of 2020, the management of the Company currently expects revenues to be between US$35.0 million and US$36.0 million, which would represent an increase of approximately 81.6% to 86.8% from US$19.3 million for the fourth quarter of 2019.

The above outlook is based on the current market conditions and reflects the Company management’s current and preliminary estimates of market and operating conditions and customer demand, which are all subject to change.

Conference Call

The Company’s management will host an earnings conference call on Monday, November 9, 2020 at 8:00 P.M. U.S. Eastern Time or 9:00 A.M. Beijing/Hong Kong time on Tuesday, November 10, 2020.

Dial-in details for the earnings conference call are as follows:

United States Toll Free: 

+1-888-317-6003

International:

+1-412-317-6061

Mainland China Toll Free:

400-120-6115

Hong Kong Toll Free: 

800-963-976

Access Code:

0133791

Additionally, a live and archived webcast of the conference call will be available on the Company’s investor relations website at http://ir.yallatech.ae/.

A replay of the conference call will be accessible until November 16, 2020, by dialing the following telephone numbers:

United States Toll Free:

+1-877-344-7529

International:

+1-412-317-0088

Access Code:

10149659

Non-GAAP Financial Measures

To supplement the financial measures prepared in accordance with generally accepted accounting principles in the United States, or GAAP, this press release presents non-GAAP financial measures, such as non-GAAP operating income, non-GAAP net income and non-GAAP basic and diluted net income per ordinary share, as supplemental measures to review and assess the Company’s operating performance. The presentation of the non-GAAP financial measures is not intended to be considered in isolation or as a substitute for the financial information prepared and presented in accordance with U.S. GAAP. We define non-GAAP operating income as operating income excluding share-based compensation. We define non-GAAP net income as net income (loss) excluding share-based compensation. We define non-GAAP net income attributable to ordinary shareholders as net income (loss) attributable to ordinary shareholders excluding share-based compensation. We define non-GAAP net income (loss) per ordinary share as non-GAAP net income (loss) attributable to ordinary shareholders of Yalla Group Limited, using the two-class method, divided by weighted average number of basic and diluted share outstanding. We define non-GAAP basic and diluted net income (loss) per ADS as non-GAAP basic and diluted net income (loss) per ordinary share as one ADS represent one ordinary share.

By excluding the impact of share-based compensation expenses, the Company believes that the non-GAAP financial measures help identify underlying trends in its business and enhance the overall understanding of the Company’s past performance and future prospects. The Company also believes that the non-GAAP financial measures allow for greater visibility with respect to key metrics used by the Company’s management in its financial and operational decision-making.

The non-GAAP financial measure is not defined under U.S. GAAP and are not presented in accordance with U.S. GAAP. The non-GAAP financial measure has limitations as analytical tools. One of the key limitations of using the non-GAAP financial measures is that they do not reflect all items of income and expense that affect the Company’s operations. Share-based compensation has been and may continue to be incurred in the Company’s business and is not reflected in the presentation of non-GAAP financial measures. Further, the non-GAAP financial measure may differ from the non-GAAP information used by other companies, including peer companies, and therefore their comparability may be limited.

The Company compensate for these limitations by reconciling the non-GAAP financial measure to the nearest U.S. GAAP performance measure, all of which should be considered when evaluating its performance. The Company encourages investors and others to review its financial information in its entirety and not rely on a single financial measure.

Reconciliation of each of these non-GAAP financial measures to the most directly comparable GAAP financial measure is set forth at the end of this release.

About Yalla Group Limited

Yalla Group Limited is the leading voice-centric social networking and entertainment platform in the Middle East and Northern Africa (MENA). The Company’s flagship mobile application, Yalla, is specifically tailored for the people and local cultures of the region and primarily features Yalla rooms, a mirrored online version of the majlis or cafés where people spend their leisure time in casual chats. Voice chats are more suitable to the cultural norms in MENA compared to video chats. The Company strives to maintain users’ equal status on its platform, thereby encouraging all of them to freely communicate and interact with each other. The Company also operates Yalla Ludo, a mobile application featuring online versions of board games that are highly popular in MENA, such as Ludo and Domino. In-game real-time chats and Ludo chat room functions are popular social networking features among users. Through close attention to detail and localized appeal that deeply resonates with users, Yalla’s mobile applications deliver a seamless user experience that fosters a loyal sense of belonging, creating a highly devoted and engaged user community.

For more information, please visit: http://ir.yallatech.ae/

Safe Harbor Statement

This press release contains statements that may constitute "forward-looking" statements pursuant to the "safe harbor" provisions of the U.S. Private Securities Litigation Reform Act of 1995. These forward- looking statements can be identified by terminology such as "will," "expects," "anticipates," "aims," "future," "intends," "plans," "believes," "estimates," "likely to," and similar statements. Statements that are not historical facts, including statements about Yalla Group Limited’s beliefs, plans, and expectations, are forward-looking statements. Forward-looking statements involve inherent risks and uncertainties. Further information regarding these and other risks is included in Yalla Group Limited’s filings with the SEC. All information provided in this press release is as of the date of this press release, and Yalla Group Limited does not undertake any obligation to update any forward-looking statement, except as required under applicable law.

For investor and media inquiries, please contact:

Yalla Group Limited
Investor Relations
Yuwei Gao – IR Director
Tel: +86-571-8980-7962
Email: ir@yallatech.ae

The Piacente Group, Inc.
Yang Song
Tel: +86-10-6508-0677
Email: yalla@tpg-ir.com

In the United States:

The Piacente Group, Inc.
Brandi Piacente
Tel: +1-212-481-2050
Email: yalla@tpg-ir.com


YALLA GROUP LIMITED

UNAUDITED CONDENSED CONSOLIDATED BALANCE SHEETS

As of

December 31, 2019

September 30, 2020

US$

US$

ASSETS

Current assets

Cash and cash equivalents

45,302,622

75,673,702

Term deposits

2,722,941

Short-term investments

1,506,985

293,681

Proceeds from Initial Public Offering

130,235,000

Prepayments and other current assets

3,930,306

17,138,560

Total current assets

53,462,854

223,340,943

Noncurrent assets

Property and equipment, net

453,923

907,940

Other assets

200,000

Total assets

54,116,777

224,248,883


LIABILITIES

Current liabilities

Accounts payable

724,487

1,524,962

Deferred revenue

6,010,874

10,917,719

Accrued expenses and other current liabilities

1,576,530

6,595,445

Total current liabilities

8,311,891

19,038,126

Total liabilities

8,311,891

19,038,126


YALLA GROUP LIMITED

UNAUDITED CONDENSED CONSOLIDATED BALANCE SHEETS (CONTINUED)

As of

December 31,
2019

September 30,
2020

US$

US$

MEZZANINE EQUITY

Series Angel Redeemable Convertible Preferred Shares

263,608

Series Pre-A Redeemable Convertible Preferred Shares

3,570,201

Series A Redeemable Convertible Preferred Shares

22,068,901

Total mezzanine equity

25,902,710


SHAREHOLDERS’ EQUITY

Ordinary Shares

7,339

Subscriptions receivable

(7,339)

Class A Ordinary shares

11,850

Class B Ordinary shares

2,473

Additional paid-in capital

201,507,357

Accumulated other comprehensive income

5,218

164,834

Retained earnings

19,896,958

3,524,243

Total shareholders’ equity

19,902,176

205,210,757

Total liabilities, mezzanine equity and shareholders’ equity

54,116,777

224,248,883


YALLA GROUP LIMITED 

UNAUDITED CONDENSED CONSOLIDATED STATEMENTS OF OPERATIONS

Three Months Ended

Nine Months Ended

September 30,

June, 30

September 30,

September 30,

September 30,

2019

2020

2020

2019

2020

US$

US$

US$

US$

US$

Revenues

17,763,112

31,683,103

33,826,313

44,193,200

86,583,940

Costs and expenses

Cost of revenues

(5,432,993)

(10,421,682)

(25,608,476)

(14,710,672)

(42,841,820)

Selling and marketing expenses

(1,749,879)

(2,723,798)

(8,533,096)

(5,169,682)

(14,080,556)

General and administrative expenses

(998,253)

(1,392,368)

(28,891,880)

(2,561,041)

(31,625,723)

Technology and product development

expenses

(435,179)

(1,037,108)

(1,698,495)

(1,157,255)

(3,586,659)

Total costs and expenses

(8,616,304)

(15,574,956)

(64,731,947)

(23,598,650)

(92,134,758)

Operating income (loss)

9,146,808

16,108,147

(30,905,634)

20,594,550

(5,550,818)

Interest income

154,551

76,955

22,199

324,807

189,131

Government grant

8,325

93,650

Investment income

12,621

4,661

3,946

18,785

12,047

Income (loss) before income taxes

9,313,980

16,189,763

(30,871,164)

20,938,142

(5,255,990)

Income tax expense

(119,603)

(234,729)

(109,112)

(302,627)

(529,654)

Net income (loss)

9,194,377

15,955,034

(30,980,276)

20,635,515

(5,785,644)

Accretion of redeemable

    convertible preferred shares

(494,345)

(523,602)

(541,568)

(1,434,440)

(1,577,026)

Dividends distributed to

    redeemable convertible

    preferred shareholders

(3,704,083)

(3,704,083)

Net income (loss) attributable to

ordinary shareholders

8,700,032

11,727,349

(31,521,844)

19,201,075

(11,066,753)


YALLA GROUP LIMITED 

UNAUDITED CONDENSED CONSOLIDATED STATEMENTS OF OPERATIONS (CONTINUED)

Three Months Ended

Nine Months Ended

September 30,

June, 30

September 30,

September 30,

September 30,

2019

2020

2020

2019

2020

US$

US$

US$

US$

US$

Net income (loss) per ordinary share

——Basic and diluted   

0.07

0.12

(0.43)

0.15

(0.10)

Net income (loss) per ADS*

——Basic and diluted

0.07

0.12

(0.43)

0.15

(0.10)

Weighted average number of shares

outstanding used in computing

earnings per ordinary share

——Basic and diluted

73,393,941

73,393,941

74,153,030

73,393,941

73,648,818

* Each ADS represents one Class A ordinary share.

Share-based compensation was allocated in cost of revenues, selling and marketing expenses, general and administrative expenses and

technology and product development expenses as follows:

Three Months Ended

Nine Months Ended

September 30,

June, 30

September 30,

September 30,

September 30,

2019

2020

2020

2019

2020

US$

US$

US$

US$

US$

Cost of revenues

14,058,822

14,058,822

Selling and marketing expenses

4,484,516

4,484,516

General and administrative expenses

27,111,157

27,111,157

Technology and product development

    expenses

803,977

803,977


YALLA GROUP LIMITED

RECONCILIATIONS OF NON-GAAP MEASURES 

TO THE NEAREST COMPARABLE GAAP MEASURES

Three Months Ended

Nine Months Ended

September 30,

June, 30

September 30,

September 30,

September 30,

2019

2020

2020

2019

2020

US$

US$

US$

US$

US$

Operating income (loss)

9,146,808

16,108,147

(30,905,634)

20,594,550

(5,550,818)

Share-based compensation expenses

46,458,472

46,458,472

Non-GAAP operating income

9,146,808

16,108,147

15,552,838

20,594,550

40,907,654

Net income (loss)

9,194,377

15,955,034

(30,980,276)

20,635,515

(5,785,644)

Share-based compensation expenses 

46,458,472

46,458,472

Non-GAAP Net income

9,194,377

15,955,034

15,478,196

20,635,515

40,672,828

Net income (loss) attributable

to ordinary shareholders

8,700,032

11,727,349

(31,521,844)

19,201,075

(11,066,753)

Share-based compensation expenses 

46,458,472

46,458,472

Non-GAAP Net income attributable

to ordinary shareholders

8,700,032

11,727,349

14,936,628

19,201,075

35,391,719

Non-GAAP Net income per ordinary

share

——Basic and diluted

0.07

0.12

0.20

0.15

0.53

Non-GAAP Net income per ADS

——Basic and diluted

0.07

0.12

0.20

0.15

0.53

Weighted average number of shares

outstanding used in computing

earnings per ordinary share

——Basic and diluted

73,393,941

73,393,941

74,153,030

73,393,941

73,648,818


i6 Group Secures Series A Funding Round

Series funding allows i6 to accelerate, expand and develop technology and service offering.

FARNBOROUGH, England, Nov. 10, 2020 — i6 Group Limited (i6), the leader in fuel management software for the aviation industry, announces that it has secured Series A funding round.

i6 teamed with Deloitte to architect an investment syndicate including International Airlines Group (IAG), Shell, World Fuel Services and JetBlue Technology Ventures, who invested in February 2020. This funding will allow i6 to continue its market expansion and accelerate exciting new product development.

Founded in 2013, i6’s platform connects stakeholders across all stages of the aircraft refuelling process to improve operational efficiency through real-time connectivity and data optimisation. This adaptable, scalable technology has the potential to expand to verticals in adjacent markets, such as military, logistics and retail. i6 technology enables the better management of fuelling operations with more accuracy, which in turn helps to reduce costs and emissions.

"We are thrilled to join a strong consortium of investors to support the growth of i6. The way their proprietary digital solutions enable the end-to-end digitalisation of the aviation fuel supply chain, while solving key friction points, adds tremendous value to their customer base." Eva Wan, General Manager Digital Strategy, Shell

"i6 is a leader in the development and deployment of transformational technologies for the aviation fuel industry. We are excited to join them on this journey, alongside a group of investors who are similarly committed to bringing such technologies to market." – Sukumar Pillai, Vice President Business Development, World Fuel Services Corporation

i6 is now deployed at over 150 international airports, including; London Heathrow, Amsterdam, Toronto Pearson, Boston Logan International, Dubai International and Bangalore. Its eHandshake® technology, which allows for a 100% paperless aircraft refuelling process and eliminates the manual and verbal information exchange between a flight crew and refuelling operatives, was awarded a patent this year. It is currently implemented at British Airways and Virgin Atlantic with plans to expand.

"Our work with i6 began with the development of a fuel management tool in 2016 and we are currently working with the company on a bespoke project to digitise operational aspects of our airport," said Roger Walker, Director Airport Operations for Farnborough Airport. "This includes not only our frontline operations, but also our back-office functions, such as finance and IT. The experience has allowed us to continue on our journey in providing Europe’s leading business aviation airport and we expect our relationship with i6 to continue to flourish in the future."

"We are very pleased to have concluded the investment process and are excited by the strategic value that we believe can benefit both i6 and the existing and future industries we serve."  Steven Uhrmacher (CEO) & Alex Mattos (COO), i6 Group

About i6

Founded in 2013, i6 provides a cloud-based, digital fuel management platform that enables fuel suppliers, airports, into-plane agents and airlines to better plan, control, monitor and optimize fuelling operations. Their software platform covers the entire fuel supply chain from "refinery to wing–tip."

Visit i6.io for more information.

Contact: 
Emily Loretto
E-mail – emily@i6.io  
Tel +44 (0) 1252 757159

RIGOL Technologies Unveils StationMax at electronica 2020

Enabling technology exploration across industries with RIGOL’s innovative products and solutions

MUNICH, Nov. 10, 2020 — RIGOL Technologies, a leading global provider of test and measurement instruments and solutions unveils StationMax, a new generation of high performance time domain studio that offers highly flexible test configurations tailored to answer varied needs of engineers, at the first-ever virtual electronica event.

Introducing the All-new StationMax

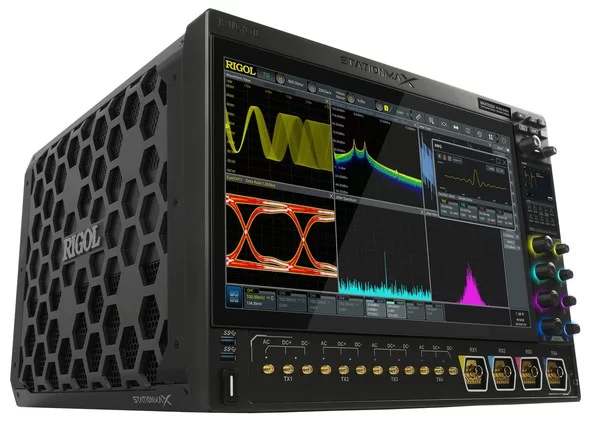
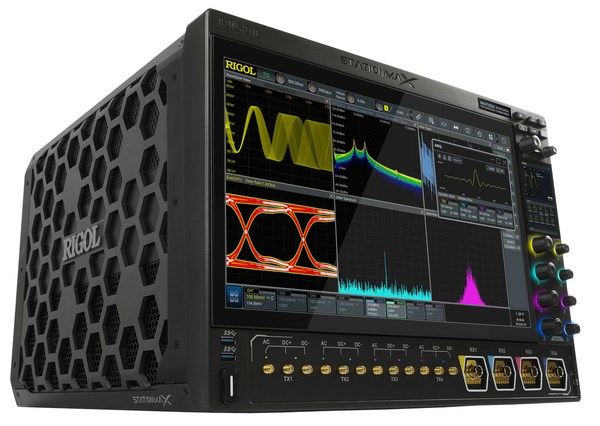
Powered by RIGOL’s proprietary Phoenix Chipset and built on RIGOL’s data analysis and signal synthesis technologies, the all-new StationMax is RIGOL’s latest measurement solution designed to provide uncompromised performance and quality to engineers across multiple industries. The StationMax comes with four receiving channels up to 4GHz analog bandwidth and four transmitting channels up to 5GHz analog bandwidth, delivering higher speed with accuracy.

StationMax Multifunctional Time Domain Studio

"We are very proud to introduce the StationMax at electronica this year. Committed to addressing customer needs, RIGOL has enabled technology exploration for many engineers, including with our latest generation of multifunctional time domain studio solutions which now simplifies T&M scenarios of engineers effectively," said Rico Wang, co-founder and president of RIGOL. "Designed by engineers for engineers, our belief in empowering possibilities and more continues to drive the team to achieve higher business value for our customers by turning innovations into practical solutions."

With a revolutionary, software-definable system that offers a wide range of application options for different functions, StationMax is designed with advanced features including high-definition touch screen with ergonomic design, split screen capabilities to meet the demands of multi-window and multi-signal tests, optical encoders to address demands for longer service life and a high-definition intelligent function dashboard.

Specifications Table for StationMax

Receive (RX) channel

Transmission (TX) channel

Analog Channels

4

4

Analog Bandwidth

4GHz

5GHz

Real-Time Sampling Rate

20GSa/s

12GSa/s

Vertical Resolution

8bit-16bit

16bit

Memory Depth

2Gpts

4Gpts

Innovative Products and Solutions to Meet Industry Needs

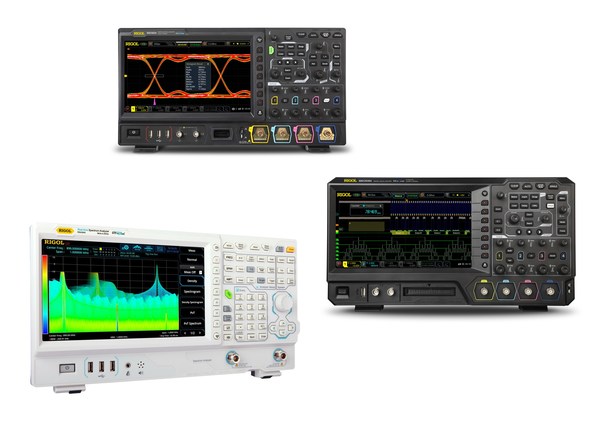
In the new digital era, device manufacturers and infrastructure providers are investing heavily in test and measurement solutions. Built on world-leading RIGOL UltraVision II oscilloscope architecture, some of RIGOL’s latest digital oscilloscopes include industry-leading DS8000-R, MSO5000 and MSO8000 that comes with significantly faster waveform capture rates, new filtering and triggering capabilities, and unprecedented memory depths and search capabilities.

Meeting stringent requirements for high performance in waveform generation, RIGOL also showcased its multi-function arbitrary waveform function generator under the DG2000 series.

To play a key role in helping IT and business leaders in the future 5G era, RIGOL introduced a new product series RSA5000N under the high performance real-time spectrum analyzer platform UltraReal, designed to solve modern RF technology challenges.

Setting another industry benchmark is RIGOL’s DSG800A RF signal generator. With a small footprint, light weight and superior portability, the DSG800A is winning reviews as an excellent choice for educational laboratories and industrial production lines, development and research applications.

RIGOL UltraVision II oscilloscope architecture RIGOL UltraReal with VNA mode and Advanced Analysis Capabilities

Positive Outlook with Global Footprint

While the unprecedented pandemic has brought about challenges to businesses around the world, RIGOL remains positive on the industry outlook of the global oscilloscope market with opportunities across consumer electronics, automotive, IT & telecommunications, aerospace, medical, and engineering industries.

As a global leading provider of test and measurement instruments and solutions today, RIGOL started as an innovator and remains one, enabling technology exploration to support innovations. Staying committed to enable the world’s future scientists, engineers and technicians in the testing and measurement field, RIGOL shall continue to play an important role in global market recovery to meet increasing demand for modular instrumentation and high-performance and power efficient electronic devices.

About RIGOL Technologies

Founded in 1998, RIGOL Technologies is a global leading provider of test and measurement instruments and solutions. With its unrelenting exploration of innovation and technological breakthroughs, RIGOL Technologies became a fast-growth player in the global test and measurement industry, with 587 patents and more than 1 million units sold worldwide. Committed to helping customers achieve business value through innovation, RIGOL Technologies has enabled technology exploration by providing high-quality products and reliable service with stringent standards. Our line of products includes Oscilloscopes, Spectrum Analyzers, Waveform Generators, RF-signal Generators, Multimeters, Data Acquisition Systems, DC Power, DC Load and application software. With nearly 500 employees including more than 100 engineers, working alongside customers in approximately 150 countries, RIGOL Technologies empowers possibilities and more for emerging business opportunities.

For more information, please visit www.rigol.com

Related Links :

http://www.rigol.com

Wondershare MirrorGo: Manage your Phone from a Computer

Now available for Windows

VANCOUVER, BC, Nov. 9, 2020 — Wondershare has launched Wondershare MirrorGo, a software which allows users to not only mirror their phone screen onto their computer but to transfer files and control their device from their PC.  

"People can almost forget that they’re using a phone when MirrorGo working," said Selena Li, Product Director of Wondershare MirrorGo. "MirrorGo is especially useful for professionals because it can help them think outside the box. The process is simple and it’s easy to get started. You can switch from mobile phone to computer seamlessly."

Here are the key features of MirrorGo:

  • Control Mobile Devices from a PC

Connect a PC to an iPhone or Android device for a simpler workflow.

  • Mirror a Phone’s Screen on a PC

Connect through Wi-Fi or a USB data cable to mirror an iPhone or Android device.

  • Easily Drag & Drop Files

Transfer photos, videos, and documents between Android devices and Windows quickly and easily via Bluetooth.

  • Shared Clipboard

Press CTRL+C and CTRL+V on Android to access the same clipboard as a Windows computer.

  • Record Phone Screen and Take Screenshots

Record and take screenshots of your phone screen using a PC for increased efficiency.

Wondershare MirrorGo is available on our website. Pricing is $5.95 USD/month or $16.95 USD/year. To learn more, please visit https://drfone.wondershare.com/android-mirror.html.

About Wondershare:

Founded in 2003, Wondershare is a global leader in software development and a pioneer in the field of digital creativity. Our technology is powerful, and the solutions we provide are simple and convenient. That’s why we’re trusted by millions of people in over 150 countries worldwide. We help our users pursue their passions so that, together, we can build a more creative world.  

www.wondershare.com

Media Contact
Ellen Cheng
Wondershare
ellenc@wondershare.com