Trip.com Group Reports Unaudited Second Quarter of 2020 Financial Results

Shanghai, Sept. 25, 2020 — Trip.com Group Limited (Nasdaq: TCOM) ("Trip.com Group" or the "Company"), a leading provider of online travel and related services, including accommodation reservation, transportation ticketing, packaged-tour and in-destination services, corporate travel management, and other travel-related services, today announced its unaudited financial results for the second quarter ended June 30, 2020.

Key Highlights

  • Our business has continued to show strong momentum of recovery in the China domestic market.
    —    Reservations for China domestic hotels achieved positive growth, with high-end domestic hotels leading the way over the past month.
    —    China domestic flight reservations achieved positive growth over the past months.
  • The Company’s results for the second quarter of 2020 were significantly and negatively impacted due to the ongoing COVID-19 pandemic.
    —    Net revenue for the second quarter of 2020 was RMB3.2 billion (US$448 million), representing a 64% decrease from the same period in 2019. The performance reflects a strong recovery of our China domestic businesses, offset by a steep decline of our international businesses.
    —    Operating loss for the second quarter of 2020 was RMB688 million (US$97 million). Excluding share-based compensation charges, non-GAAP loss from operations was RMB200 million (US$27 million).

"In the second quarter of 2020, the global travel industry continued to experience significant impact as a result of the ongoing COVID-19 pandemic. On a promising note, we have seen all of our domestic business lines recover to varying degrees during the quarter," said James Liang, Executive Chairman. "As global efforts intensify in this fight against COVID-19, we are increasingly optimistic that there will be more resumption of travel activity in major markets worldwide."

"Although the second quarter witnessed a full quarter impact of COVID-19 across business lines, our Company quickly adjusted operational priorities to suit the changing macro environment through minimizing operating expenses while meaningfully outpacing the industry in recovery," said Jane Sun, Chief Executive Officer. "We are glad to see that reservations for China domestic flights and hotels have reached a level of full recovery in succession during August, and we strive to make further progress as the travel industry continues to pick up more momentum."

Second quarter of 2020 Financial Results and Business Updates

The Company’s results for the second quarter of 2020 were negatively impacted by the COVID-19 pandemic. The pandemic continued to cause a decline in travel demands even though the travel restrictions have been lifted in some countries as the spread of the coronavirus has been contained to various degrees. Consumers are becoming more comfortable with traveling especially to domestic locations. This has led to more travel bookings compared to February and March 2020. Yet, travel demands remained significantly lower than the previous year especially for the China outbound and overseas markets.

For the second quarter of 2020, Trip.com Group reported net revenue of RMB3.2 billion (US$448 million), representing a 64% decrease from the same period in 2019. Net revenue for the second quarter of 2020 decreased by 33% from the previous quarter.

Accommodation reservation revenue for the second quarter of 2020 was RMB1.3 billion (US$178 million), representing a 63% decrease from the same period in 2019, and a 9% increase from the previous quarter, primarily due to the recovery of China domestic market.

Transportation ticketing revenue for the second quarter of 2020 was RMB1.2 billion (US$163 million), representing a 66% decrease from the same period in 2019, and a 52% decrease from the previous quarter.

Packaged-tour revenue for the second quarter of 2020 was RMB130 million (US$18 million), representing an 88% decrease from the same period in 2019, and a 75% decrease from the previous quarter.

Corporate travel revenue for the second quarter of 2020 was RMB162 million (US$23 million), representing a 47% decrease from the same period in 2019, and a 29% increase from the previous quarter, primarily due to the recovery of China domestic market.

Gross margin was 72% for the second quarter of 2020, which decreased from 79% for the same period in 2019 and 74% for the previous quarter.

Product development expenses for the second quarter of 2020 decreased by 32% to RMB1.8 billion (US$255 million) from the same period in 2019, primarily due to a decrease in expenses related to product development personnel. Product development expenses for the second quarter of 2020 increased by 6% from the previous quarter, primarily due to an increase in expenses related to product development personnel. Product development expenses for the second quarter of 2020 accounted for 57% of the net revenue for the same period. Excluding share-based compensation charges, non-GAAP product development expenses for the second quarter of 2020 accounted for 49% of the net revenue for the same period, which increased from 28% in the same period in 2019 and 32% in the previous quarter.

Sales and marketing expenses for the second quarter of 2020 decreased by 69% to RMB661 million (US$94 million) from the same period in 2019 and decreased by 52% from the previous quarter, primarily due to a decrease in expenses relating to sales and marketing activities. Sales and marketing expenses for the second quarter of 2020 accounted for 21% of the net revenue for the same period. Excluding share-based compensation charges, non-GAAP sales and marketing expenses for the second quarter of 2020 accounted for 20% of the net revenue for the same period, which decreased from 24% in the same period in 2019 and 29% in the previous quarter.

General and administrative expenses for the second quarter of 2020 decreased by 37% to RMB513 million (US$73 million) from the same period in 2019, primarily due to a decrease in personnel expenses, and decreased by 74% from the previous quarter because we accrued RMB1.2 billion bad debt provision in the first quarter of 2020. General and administrative expenses for the second quarter of 2020 accounted for 16% of the net revenue for the same period. Excluding share-based compensation charges, non-GAAP general and administrative expenses accounted for 10% of the net revenue for the same period, which increased from 8% in same period in 2019 and decreased from 38% in the previous quarter.

Loss from operations for the second quarter of 2020 was RMB688 million (US$97 million), compared to income of RMB1.3 billion in the same period in 2019 and loss of RMB1.5 billion in the previous quarter. Excluding share-based compensation charges, non-GAAP loss from operations was RMB200 million (US$27 million), compared to income of RMB1.7 billion in the same period in 2019 and loss of RMB1.2 billion in the previous quarter.

Operating margin was -22% for the second quarter of 2020, compared to 15% in the same period in 2019, and -32% in the previous quarter. Excluding share-based compensation charges, non-GAAP operating margin was -6%, compared to 20% in the same period in 2019 and -25% in the previous quarter.

Income tax expense for the second quarter of 2020 was RMB201 million (US$29 million), compared to expense of RMB336 million in the same period of 2019 and benefit of RMB254 million in the previous quarter. The change in our effective tax rate was primarily due to the non-taxable income of the fair value changes in equity securities investments.

Net loss attributable to Trip.com Group’s shareholders for the second quarter of 2020 was RMB476 million (US$67 million), compared to net loss attributable to Trip.com Group’s shareholders of RMB403 million in the same period in 2019 and RMB5.4 billion in the previous quarter, primarily due to the operating loss associated with impact of COVID-19, the fair value changes in equity securities investments, impairments of long-term investments, gains from other investing activities and equity in loss of our affiliates. Excluding share-based compensation charges and fair value changes of equity securities investments, non-GAAP net loss attributable to Trip.com Group’s shareholders was RMB1.2 billion (US$162 million), compared to net income of RMB1.3 billion in the same period in 2019 and net loss of RMB2.2 billion in the previous quarter.

Diluted losses per ADS were RMB0.80 (US$0.11) for the second quarter of 2020. Excluding share-based compensation charges and fair value changes of equity securities investments, non-GAAP diluted losses per ADS were RMB1.93 (US$0.27) for the second quarter of 2020.

As of June 30, 2020, the balance of cash and cash equivalents, restricted cash, short-term investment, held to maturity time deposit and financial products was RMB64.3 billion (US$9.1 billion).

Subsequent Events

In July, 2020, the Company has completed the put right offer relating to its 1.99% Convertible Senior Notes due 2025 (the "2025 Notes"). The aggregate purchase price of the 2025 Notes was US$395,240,000. Following the settlement of repurchase of 2025 Notes, the total number of ordinary shares of the Company on a fully diluted basis was reduced by 0.9 million shares.

In July, 2020, the Company’s 1.00% Convertible Senior Notes due 2020 (the "2020 Notes") with a principle amount of US$700 million matured and were repaid in cash. Following the settlement of the repayment of 2020 Notes, the total number of ordinary shares of the Company on a fully diluted basis was reduced by 1.6 million shares.

In July, 2020, the Company issued US$500 million in aggregate principal amount of its 1.50% Exchangeable Senior Notes due 2027 (the "2027 Notes"). The 2027 Notes will be exchangeable, at the option of the holders and subject to certain conditions, into cash, American depositary shares ("Huazhu ADSs") of Huazhu Group Limited (Nasdaq: HTHT) ("Huazhu"), each representing one ordinary share of Huazhu, par value $0.0001 per share, or a combination of cash and Huazhu ADSs, at the Company’s election subject to certain conditions.

Business Outlook

As a result of the continued negative impact due to COVID-19 in the third quarter of 2020, the Company expects net revenue to decrease by approximately 47%-52% year-over-year for the third quarter of 2020. This forecast reflects the current and preliminary view based on best information available at the time, which is subject to change.

Conference Call  

Trip.com Group’s management team will host a conference call at 8:00PM U.S. Eastern Time on September 24, 2020 (or 8:00AM on September 25, 2020 in the Shanghai/Hong Kong Time) following the announcement.

The conference call will be available on Webcast live and replay at: https://investors.trip.com. The call will be archived for twelve months at this website.

All participants must pre-register to join this conference call using the Participant Registration link below:
https://s1.c-conf.com/DiamondPass/10009786-invite.html

Upon registration, each participant will receive details for this conference call, including dial-in numbers, passcode and a unique access PIN. To join the conference, please dial the number provided, enter the passcode followed by your PIN, and you will join the conference instantly.

A telephone replay of the call will be available after the conclusion of the conference call until October 2, 2020.

The dial-in details for the replay:

International dial-in number:

+61-7-3107-6325

Passcode:

10009786

 Safe Harbor Statement

This announcement contains forward-looking statements. These statements are made under the "safe harbor" provisions of the U.S. Private Securities Litigation Reform Act of 1995. These forward-looking statements can be identified by terminology such as "may," "will," "expect," "anticipate," "future," "intend," "plan," "believe," "estimate," "is/are likely to," "confident" or other similar statements. Among other things, quotations from management and the Business Outlook section in this press release, as well as Trip.com Group’s strategic and operational plans, contain forward-looking statements. Forward-looking statements involve inherent risks and uncertainties. A number of important factors could cause actual results to differ materially from those contained in any forward-looking statement. Potential risks and uncertainties include, but are not limited to, the potential impact of the COVID-19 to Trip.com Group’s business operations, severe or prolonged downturn in the global or Chinese economy, general declines or disruptions in the travel industry, volatility in the trading price of Trip.com Group’s ADSs, Trip.com Group’s reliance on its relationships and contractual arrangements with travel suppliers and strategic alliances, failure to compete against new and existing competitors, failure to successfully manage current growth and potential future growth, risks associated with any strategic investments or acquisitions, seasonality in the travel industry in the relevant jurisdictions where Trip.com Group operates, failure to successfully develop Trip.com Group’s existing or future business lines, damage to or failure of Trip.com Group’s infrastructure and technology, loss of services of Trip.com Group’s key executives, adverse changes in economic and political policies of the PRC government, inflation in China, risks and uncertainties associated with PRC laws and regulations with respect to the ownership structure of Trip.com Group’s affiliated Chinese entities and the contractual arrangements among Trip.com Group, its affiliated Chinese entities and their shareholders, and other risks outlined in Trip.com Group’s filings with the U.S. Securities and Exchange Commission. All information provided in this press release and in the attachments is as of the date of the issuance, and Trip.com Group does not undertake any obligation to update any forward-looking statement, except as required under applicable law.

About Non-GAAP Financial Measures

To supplement Trip.com Group’s unaudited condensed consolidated financial statements presented in accordance with United States Generally Accepted Accounting Principles ("GAAP"), Trip.com Group uses Non-GAAP financial information related to product development expenses, sales and marketing expenses, general and administrative expenses, income from operations, operating margin, net income attributable to Trip.com Group’s shareholders, and diluted earnings per ordinary share and per ADS, each of which (except for net commission earned) is adjusted from the most comparable GAAP result to exclude the share-based compensation charges recorded under ASC 718, "Compensation-Stock Compensation" and its share-based compensation charges are not tax deductible, and fair value changes of equity securities investments, net of tax, recorded under ASU 2016-1. Trip.com Group’s management believes the Non-GAAP financial measures facilitate better understanding of operating results from quarter to quarter and provide management with a better capability to plan and forecast future periods.

Non-GAAP information is not prepared in accordance with GAAP and may be different from Non-GAAP methods of accounting and reporting used by other companies. The presentation of this additional information should not be considered a substitute for GAAP results. A limitation of using Non-GAAP financial measures is that Non-GAAP measures exclude share-based compensation charges and fair value changes of equity securities investments that have been and will continue to be significant recurring expenses in Trip.com Group’s business for the foreseeable future.

Reconciliations of Trip.com Group’s Non-GAAP financial data to the most comparable GAAP data included in the consolidated statement of operations are included at the end of this press release.

About Trip.com Group Limited

Trip.com Group Limited (Nasdaq: TCOM) is a leading one-stop travel service provider consisting of Trip.com, Ctrip, Skyscanner, and Qunar. Across its platforms, Trip.com Group enables local partners and travelers around the world to make informed and cost-effective bookings for travel products and services, through aggregation of comprehensive travel-related information and resources, and an advanced transaction platform consisting of mobile apps, Internet websites, and 24/7 customer service centers. Founded in 1999 and listed on Nasdaq in 2003, Trip.com Group has become one of the largest travel companies in the world in terms of gross merchandise value.

Trip.com Group Limited

Unaudited Consolidated Balance Sheets

(In millions, except share and per share data)

December 31, 2019

June 30, 2020

June 30, 2020

RMB (million)

RMB (million)

USD (million)

(unaudited)

(unaudited)

(unaudited)

ASSETS

Current assets:

Cash, cash equivalents and restricted cash

21,747

18,896

2,674

Short-term investments

23,058

23,886

3,381

Accounts receivable, net 

7,661

5,129

726

Prepayments and other current assets 

15,489

15,583

2,205

Total current assets

67,955

63,494

8,986

Property, equipment and software

6,135

5,985

847

Intangible assets and land use rights

13,264

13,324

1,886

Right-of-use asset

1,207

795

113

Investments (Includes held to maturity time deposit and
financial products of RMB15,056 million and RMB21,538
million as of December 31,2019 and June 30, 2020,
respectively)

51,278

53,659

7,595

Goodwill

58,308

59,327

8,397

Other long-term assets

1,046

551

79

Deferred tax asset

976

1,360

193

Total assets

200,169

198,495

28,096

LIABILITIES

Current liabilities:

Short-term debt and current portion of long-term debt

30,516

42,097

5,958

Accounts payable

12,294

4,478

634

Advances from customers

11,675

8,013

1,134

Other current liabilities

14,697

11,969

1,695

Total current liabilities

69,182

66,557

9,421

Deferred tax liability

3,592

3,567

505

Long-term debt

19,537

28,067

3,973

Long-term lease liability

749

536

76

Other long-term liabilities

264

206

29

Total liabilities

93,324

98,933

14,004

MEZZANINE EQUITY

Redeemable non-controlling interests 

1,142

SHAREHOLDERS’ EQUITY

Total Trip.com Group Limited shareholders’ equity

103,442

97,529

13,804

Non-controlling interests

2,261

2,033

288

Total shareholders’ equity

105,703

99,562

14,092

Total liabilities, mezzanine equity and shareholders’
equity

200,169

198,495

28,096


Trip.com Group Limited

Unaudited Consolidated Statements of Comprehensive Income

(In millions, except share and per share data)

Quarter Ended

Quarter Ended

Quarter Ended

Quarter Ended

June 30, 2019

March  31, 2020

June 30, 2020

June 30, 2020

RMB (million)

RMB (million)

RMB (million)

USD (million)

(unaudited)

(unaudited)

(unaudited)

(unaudited)

Revenue:

Accommodation reservation 

3,410

1,155

1,254

178

Transportation ticketing 

3,407

2,393

1,150

163

Packaged-tour 

1,051

523

130

18

Corporate travel

309

126

162

23

Others

524

538

466

66

Total revenue

8,701

4,735

3,162

448

Less: Sales tax and surcharges

(10)

(4)

(3)

0

Net revenue

8,691

4,731

3,159

448

Cost of revenue

(1,798)

(1,220)

(872)

(123)

Gross profit

6,893

3,511

2,287

325

Operating expenses:

Product development **

(2,642)

(1,696)

(1,801)

(255)

Sales and marketing **

(2,108)

(1,382)

(661)

(94)

General and administrative **

(810)

(1,942)

(513)

(73)

Total operating expenses

(5,560)

(5,020)

(2,975)

(422)

Income/(loss) from operations

1,333

(1,509)

(688)

(97)

Interest income 

562

513

603

85

Interest expense

(426)

(448)

(461)

(65)

Other (expense)/income *

(1,412)

(3,827)

1,766

250

Income/(loss) before income tax expense and
equity in income of affiliates

57

(5,271)

1,220

173

Income tax (expense)/benefit  *

(336)

254

(201)

(29)

Equity in loss of affiliates

(123)

(321)

(1,491)

(211)

Net loss

(402)

(5,338)

(472)

(67)

Net loss attributable to non-controlling interests

7

9

12

2

Accretion to redemption value of redeemable non-
controlling interests

(8)

(24)

(16)

(2)

Net loss attributable to Trip.com Group Limited

(403)

(5,353)

(476)

(67)

Comprehensive loss attributable to Trip.com
Group Limited

(308)

(5,924)

(515)

(73)

Losses per ordinary share

– Basic

(5.81)

(71.86)

(6.36)

(0.90)

– Diluted

(5.81)

(71.86)

(6.36)

(0.90)

Losses per ADS 

– Basic

(0.73)

(8.98)

(0.80)

(0.11)

– Diluted

(0.73)

(8.98)

(0.80)

(0.11)

Weighted average ordinary shares outstanding

– Basic

69,484,264

74,494,148

74,968,727

74,968,727

– Diluted

69,484,264

74,494,148

74,968,727

74,968,727

– Diluted-non GAAP

77,807,991

74,494,148

74,968,727

74,968,727

** Share-based compensation included in Operating expenses above is as follows:

  Product development 

215

180

252

36

  Sales and marketing 

34

30

41

6

  General and administrative 

144

133

195

28

* Fair value changes of equity securities investments included in Net loss is as follow:

Fair value loss/(income) of equity securities
investments, net of tax

1,339

2,790

(1,167)

(165)


Trip.com Group Limited

Reconciliation of  GAAP and Non-GAAP Results

(In millions, except % and per share data)

Quarter Ended June 30, 2020

GAAP Result

% of Net
Revenue

Non-GAAP
Adjustment

% of Net
Revenue

Non-GAAP
Result

% of Net
Revenue

Share-based compensation included in Operating expense is as follows:

Product development 

(1,801)

-57%

252

8%

(1,549)

-49%

Sales and marketing 

(661)

-21%

41

1%

(620)

-20%

General and administrative 

(513)

-16%

195

6%

(318)

-10%

Total operating expenses

(2,975)

-94%

488

15%

(2,487)

-79%

(Loss)/income from operations

(688)

-22%

488

15%

(200)

-6%

Fair value changes of equity securities investments, net of tax
expense of RMB27 million

1,167

37%

(1,167)

-37%

0%

Net loss attributable to Trip.com Group’s shareholders

(476)

-15%

(679)

-21%

(1,155)

-37%

Diluted losses per ordinary share (RMB)

(6.36)

(9.06)

(15.42)

Diluted losses per ADS (RMB)

(0.80)

(1.13)

(1.93)

Diluted losses per ADS (USD)

(0.11)

(0.16)

(0.27)

Quarter Ended March 31, 2020

GAAP Result

% of Net
Revenue

Non-GAAP
Adjustment

% of Net
Revenue

Non-GAAP
Result

% of Net
Revenue

Share-based compensation included in Operating expense is as follows:

Product development 

(1,696)

-36%

180

4%

(1,516)

-32%

Sales and marketing 

(1,382)

-29%

30

1%

(1,352)

-29%

General and administrative 

(1,942)

-41%

133

3%

(1,809)

-38%

Total operating expenses

(5,020)

-106%

343

7%

(4,677)

-99%

(Loss)/income from operations

(1,509)

-32%

343

7%

(1,166)

-25%

Fair value changes of equity securities investments, net of tax
benefit of RMB209 million

(2,790)

-59%

2,790

59%

0%

Net (loss)/income attributable to Trip.com Group’s shareholders

(5,353)

-113%

3,133

66%

(2,220)

-47%

Diluted (losses)/earnings per ordinary share (RMB)

(71.86)

42.05

(29.81)

Diluted (losses)/earnings per ADS (RMB)

(8.98)

5.25

(3.73)

Diluted (losses)/earnings per ADS (USD)

(1.27)

0.74

(0.53)

Quarter Ended June 30, 2019

GAAP Result

% of Net
Revenue

Non-GAAP
Adjustment

% of Net
Revenue

Non-GAAP
Result

% of Net
Revenue

Share-based compensation included in Operating expense is as follows:

Product development 

(2,642)

-30%

215

2%

(2,427)

-28%

Sales and marketing 

(2,108)

-24%

34

0%

(2,074)

-24%

General and administrative 

(810)

-9%

144

2%

(666)

-8%

Total operating expenses

(5,560)

-64%

393

5%

(5,167)

-59%

Income from operations

1,333

15%

393

5%

1,726

20%

Fair value changes of equity securities investments, net of tax
benefit of RMB48 million

(1,339)

-15%

1,339

15%

0%

Net (loss)/income attributable to Trip.com Group’s shareholders

(403)

-5%

1,732

20%

1,329

15%

Diluted (losses)/earnings per ordinary share (RMB)

(5.81)

23.81

18.00

Diluted (losses)/earnings per ADS (RMB)

(0.73)

2.98

2.25

Diluted (losses)/earnings per ADS (USD)

(0.11)

0.44

0.33

Notes for all the condensed consolidated financial schedules presented:

Note 1: The conversion of Renminbi (RMB) into U.S. dollars (USD) is based on the certified exchange rate of USD1.00=RMB7.0651 on June 30, 2020 published by the
Federal Reserve Board.


Related Links :

https://www.ctrip.com/

Ultromics Lauded by Frost & Sullivan for Pioneering AI-based Cardiovascular Suite, EchoGo

The SaaS suite helps physicians automate key measurements and predict the occurrence of CAD, enabling clinicians to proactively recommend preventive actions that improve patient outcomes

LONDON, Sept. 25, 2020 — Based on its recent analysis of the global AI-based echocardiography market, Frost & Sullivan recognizes Ultromics with the 2020 Global New Product Innovation Award for enhancing diagnostic quality in cardiac care units with its AI suite, EchoGo. The FDA and CE-cleared solutions (respectively EchoGo Core and EchoGo Pro) not only automate measurements for heart functions but also empower physicians to predict the occurrence of coronary artery disease (CAD). With a cloud-based Software-as-a-Service (SaaS) format, they enable quick deployment, minimal training, and hassle-free upgrades.

2020 Global AI-based Echocardiography New Product Innovation Award

Click here to download the full report: https://ultromics.com/best-practices-award/

"Ultromics’ EchoGo Core performs cardiac measurements, including ejection fraction (EF), global longitudinal strain (GLS), left ventricular (LV) volume, and myocardial strain reporting. By automating these measurements, Ultromics eases one of the most tedious steps in cardiovascular conditions’ diagnosis, thus saving time and removing inter-operator variability," said Parth Shah Research Analyst. "Meanwhile, EchoGo Pro serves as a clinical decision support tool for physicians by assessing the risk profiles of patients. As an industry-first solution within cardiac echocardiography, it enables early detection and prevention of CAD supported by evidence at the point of care."

Furthermore, being a cloud-based solution, it can be delivered as a SaaS model, which allows deployments to be completed faster than with traditional PACS software integrations. The SaaS model also does away with the need for future upgrades, patches, and associated fees. The solution is designed to be intuitive, minimizing the need for substantial user training required by other solutions. Once usage begins, it employs a zero-click, off-the-cart usage approach, eliminating the need for users to manually upload or cross-launch scans.

Being a vendor-neutral solution, Ultromics can target any provider, regardless of the echocardiography equipment they use, across regions. While the EchoGo solutions are currently available in the western markets, Ultromics will target the Asia-Pacific market in the future. Its adoption in developed markets received a major boost in 2020 when the Strain procedure obtained a CPT code that allows physicians to report and bill myocardial strain diagnosis. It is also one of the very few AI solutions in the imaging space to qualify for reimbursement.

"EchoGo’s pricing structure delivers significant return on investment with no upfront costs. While competitors offer comparable price points, their need for additional software upgrades and associated installation costs and efforts make them more expensive in the long term. Ultromics adopts a pay-per-use pricing model but can also offer a subscription model depending on the volume of procedures being conducted," noted Shah. "EchoGo automates the entire process, allowing physicians to save on costs while having zero user interactions to obtain results. Overall, Ultromics’ price-value proposition helps it capture a larger share of the market and positions it for continued growth globally."

Each year, Frost & Sullivan presents this award to the company that has developed an innovative element in a product by leveraging leading-edge technologies. The award recognizes the value-added features/benefits of the product and the increased return on investment (ROI) it gives customers, which, in turn, raises customer acquisition and overall market penetration potential.

Frost & Sullivan Best Practices awards recognize companies in a variety of regional and global markets for demonstrating outstanding achievement and superior performance in areas such as leadership, technological innovation, customer service, and strategic product development. Industry analysts compare market participants and measure performance through in-depth interviews, analysis, and extensive secondary research to identify best practices in the industry.

About Frost & Sullivan

For over five decades, Frost & Sullivan has become world-renowned for its role in helping investors, corporate leaders and governments navigate economic changes and identify disruptive technologies, Mega Trends, new business models and companies to action, resulting in a continuous flow of growth opportunities to drive future success. Contact us: Start the discussion.

Contact:
Harley Gadomski
P: 12104778469
E: harley.gadomski@frost.com

About Ultromics

Ultromics is a global health technology firm which provides autonomous echocardiography analysis through innovative AI solutions empowering physicians to make fast, accurate decisions when diagnosing cardiovascular disease. EchoGo, the world’s first autonomous echocardiography service provides cloud-based artificial intelligence services to support cardiac imaging diagnosis without any variability or need to touch software. Our technology was born at the University of Oxford and built in partnership with the NHS, and has since raised over £20 million to help improve patient care, and bring diagnostic quality and resource savings to hospitals. Cardiovascular disease is the leading cause of mortality, with an estimated 17 million deaths each year. www.ultromics.com

CONTACT:       
Kyle Souligne
Director of Marketing – Ultromics
Kyle.Souligne@Ultromics.com 

Photo – https://techent.tv/wp-content/uploads/2020/09/ultromics-lauded-by-frost-sullivan-for-pioneering-ai-based-cardiovascular-suite-echogo.jpg

Related Links :

Frost New Home page v2

Huawei Strives to Build industry Intelligent Twins with Intelligent Connectivity

SHANGHAI, Sept. 24, 2020 — At HUAWEI CONNECT 2020, Huawei announced its all-scenario intelligent connectivity solutions for technology, network, and industry scenarios. These solutions will help Huawei deliver intelligent connectivity that is characterized by ubiquitous gigabit, deterministic experience, and hyper-automation in order to build industry Intelligent Twins. Huawei also launched autonomous driving network (ADN) solutions for enterprises, propelling enterprise networks into the ADN era and accelerating the intelligent upgrades of industries.

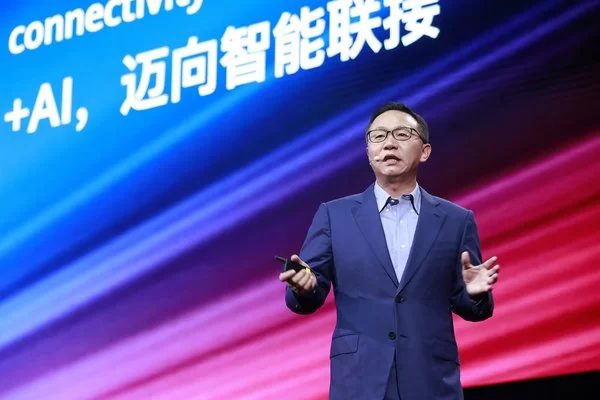
David Wang, Huawei Executive Director and Chairman of the Investment Review Board, delivered a keynote speech titled "Building industry Intelligent Twins with intelligent connectivity." According to Mr. Wang, connectivity is productivity. It is not mere computing power, but strong connectivity that makes Intelligent Twins smarter.

Huawei believes that ubiquitous gigabit, deterministic experience, and hyper-automation are the three major characteristics of intelligent connectivity.

David Wang, Huawei Executive Director and Chairman of the Investment Review Board, announces all-scenario intelligent connectivity solutions

Intelligent Twins raise five new requirements for connectivity

The four key components of Intelligent Twins are intelligent interactions, intelligent connectivity, intelligent applications, and the intelligent hub. Among these, intelligent connectivity is like the body of Intelligent Twins. What new requirements do Intelligent Twins place on intelligent connectivity?

There are three types of connectivity scenarios for Intelligent Twins. One is connectivity within the intelligent hub, such as the connection of AI cluster servers and cloud data centers. The second is connectivity between the intelligent hub and intelligent interaction devices; connecting the "brain" and the "limbs", so to speak. The last type is connectivity between intelligent interaction devices, such as the connection of AI cameras, 4K drones, and robotic arms.

Overall, Intelligent Twins have five major requirements for connectivity: High reliability, zero packet loss, differentiated services, real-time high bandwidth, and smart O&M.

To meet the connectivity needs of Intelligent Twins, Huawei defined the three major characteristics of intelligent connectivity:

The first is ubiquitous gigabit. Bandwidth is the basis of connectivity. The wide application of AI cameras, drones, industrial cameras, and industrial VR/AR services has made ubiquitous gigabit connectivity essential.

The second is deterministic experience. Connectivity for Intelligent Twins mainly targets things and diverse production scenarios. For example, during peak times in 2019, there was one aircraft departing or arriving at Shenzhen Airport every less than one minute, making it essential to guarantee real-time networking. In another example, electric power companies must assure "six nines", or even higher reliability, and less than two minutes of power outage per household per year. Therefore, deterministic connectivity is vital to the security and reliability of enterprise services.

The third is hyper-automation. As industries become intelligent, the service types as well as scale and complexity of networks will multiply, making network O&M more difficult. The application of big data and AI will transform traditional and semi-automated O&M into hyper-automated O&M, and leave all these complexities to be handled by digital intelligence.

Huawei’s all-scenario intelligent connectivity solutions

In terms of technology, Huawei’s all-scenario intelligent connectivity solutions will provide ubiquitous gigabit and low latency connectivity for intelligent interaction devices, and apply AI to achieve deterministic network experience and hyper-automated O&M. In terms of networks, these solutions will provide Intelligent Twins with campus, data center, WAN, and security networks. As for industries, intelligent connectivity will be combined with intelligent interactions, the intelligent hub, and industry know-how to build scenario-specific, intelligent solutions for industries.

  • 5G intelligent connectivity: Gigabit uplink speed, 20ms latency, and submeter-level location

To support the intelligent upgrade of industries, Huawei will continue enhancing its 5G intelligent connectivity capabilities in terms of uplink bandwidth, latency, and location accuracy. For example, in the smart manufacturing domain, Huawei used its Super Uplink technology to provide gigabit uplink speeds for HD video uploads. For scenarios that require remote operation and control, such as ports, Huawei’s 5G intelligent connectivity technology has introduced features such as pre-scheduling and mini-slot to reduce latency to 20ms and replace 90% of manual labor with automated operations. Thanks to UTDOA and higher bandwidth, Huawei’s 5G intelligent connectivity can support submeter-level location accuracy for smart manufacturing, enhancing the efficiency of production and management at industrial parks.

  • Intelligent IP networks: High bandwidth and lossless for all services

Based on a three-layer AI architecture comprised of network elements, networks, and clouds, Huawei’s intelligent IP networks facilitate the upgrade of campus, WAN, and data center networks to Version 2.0.

Huawei’s CloudCampus 2.0 solution takes campus networks into the gigabit era, providing any application with gigabit connectivity via any device and allowing the intelligent scheduling of network resources. The CloudWAN 2.0 solution brings intelligence to WAN networks. With CloudWAN 2.0, synergy can be achieved between clouds and networks, meeting the needs for differentiated services. CloudFabric 2.0 enables zero packet loss in data center networks and increases both AI compute and storage efficiency by over 30%, helping data center networks become intelligent.

  • F5G intelligent all-optical networks: High bandwidth interconnection and flexible pipes

Huawei has proposed the all-optical network strategy for the F5G era, and launched three intelligent all-optical network solutions.

The first is the Campus OptiX solution. Campus OptiX offers high bandwidth access to meet campus needs for new services such as 4K cameras and VR/AR.

The second is Single OptiX. This solution can meet transmission needs at different rates while greatly increasing efficiency.

The third is DC OptiX. IT staff can deploy DC OptiX with just one click, making it a plug-and-play solution for enterprise scenarios.

Through this strategy, Huawei is committed to extending optical connectivity to the network edge, and bringing the ultimate service experience to every person, home and organization.

Huawei’s ADN solutions target enterprises

Huawei’s ADN solutions bring intelligence to networks. By integrating AI into network elements, networks, and clouds, Huawei’s ADN networks are self-organizing, self-healing, and self-optimizing. These solutions will make digital industry services and hyper-automated operations a reality.

Network elements + AI: AI is applied to upgrade traditional network elements into digital, intelligent network elements, allowing for more agile data sensing and processing of every network element.

Network + AI: Huawei uses AI to redefine network management. The intelligent management and control system helps build network digital twins, and enables the dynamic control and closed-loop management of networks, such as automatic deployment, pre-event simulation, post-event verification, prediction and prevention, and proactive optimization.

Cloud + AI: Huawei provides cloud-based AI training and model services for networks, and continues upgrading the software systems and AI models that are already embedded into its equipment and networks. This constantly improves autonomous driving networks and makes networks smarter.

Huawei’s customers from Shenzhen Airport, China Southern Power Grid, and SPD Bank shared the application of Huawei intelligent connectivity across the transportation, electricity, and finance sectors.

Mr. Wang concluded his speech by saying: "Over the past 40 years, Huawei has worked with all stakeholders to connect the unconnected and build a fully connected world. Over the next 40 years, we are committed to building industry Intelligent Twins with intelligent connectivity."

HUAWEI CONNECT 2020 is an annual flagship event hosted by Huawei for the global ICT industry, and is being held in Shanghai from September 23 to 26, 2020. HUAWEI CONNECT is an open platform designed to help our customers and partners navigate these changes, share experience, and work together to create new value. At this year’s event, we will explore trends and opportunities in industry digitization; showcase advanced ICT technologies, products, and solutions; give you an insider’s look at the fruits of joint innovation; and share best practices in digital transformation. Our ultimate goal is to build an open and sound industry ecosystem that will benefit all stakeholders and create new value for all industries. For more information, please visit:

https://www.huawei.com/en/events/huaweiconnect2020/

Photo – https://photos.prnasia.com/prnh/20200924/2927780-1?lang=0

Related Links :

http://www.huawei.com/cn

Fisker Inc. To Establish New Technology Center In San Francisco


 – ‘Source Code’ office will support design and engineering of software systems to support the Fisker Ocean SUV and future portfolio expansion products

 – Downtown San Francisco location configured to enable employees to work flexibly between remote and office bases

LOS ANGELES, Sept. 24, 2020 — Fisker Inc. – designer and manufacturer of the world’s most emotion-stirring, eco-friendly electric vehicles and advanced mobility solutions – today announced details surrounding its first dedicated engineering and technology center, to be located in the Mission District of San Francisco. This facility will be the focal point and development center for the company’s software and vehicle electronics, including both in-car and Fisker data center elements.

"With the development of our first vehicle progressing at speed and the company scaling accordingly, we are now establishing the facilities that can support our expansion," said Henrik Fisker, chairman and CEO of Fisker Inc. "As a company born in California, we wanted to draw on all the diversity, creativity and technical capability this state is famous for. We’re calling the San Francisco office ‘Source Code’ – which also marks the start of a naming convention for all our facilities going forward."

Fisker Inc.’s recently appointed Chief Technology Officer, Burkhard Huhnke added: "The design and development of the software and vehicle interfaces will be an important differentiator for all our products, and our new facility in San Francisco will be central to that process. Having a presence in the Bay Area gives us access to the right talent at the right time."

Fisker is planning a portfolio expansion to a four-vehicle range by 2025. In addition to the Ocean SUV, the four-vehicle lineup will include a super-sports sedan based on the EMotion concept, an extreme sports crossover and a new segment-changing lifestyle pickup truck. Each vehicle will be delivered utilizing durability-tested platforms, battery packs and component systems from industry-leading technology suppliers and automotive firms, with specific Fisker engineering input.

Fisker’s Design and Engineering teams are developing Fisker specific IP and customer features, consistent with the Fisker brand. In creating its FF-PAD (Fisker Flexible – Platform Adaptive Design) development process, the company has enabled itself to be platform agnostic and intends to make the final selection on the platform for the Ocean shortly, consistent with the intended start of production, projected for Q4 2022.

For more information, or for interview inquiries, contact Fisker@GoDRIVEN360.com.

About Fisker Inc. 
California-based Fisker Inc. is revolutionizing the automotive industry by developing the most emotionally desirable and eco-friendly electric vehicles on Earth. Passionately driven by a vision of a clean future for all, the company is on a mission to become the No. 1 e-mobility service provider with the world’s most sustainable vehicles. To learn more, visit www.FiskerInc.com – and enjoy exclusive content across Fisker’s social media channels: Facebook, Instagram, Twitter, YouTube and LinkedIn. Download the revolutionary new Fisker mobile app from the App Store or Google Play store.

Logo – https://techent.tv/wp-content/uploads/2020/09/fisker-inc-to-establish-new-technology-center-in-san-francisco.jpg

Related Links :

http://www.fiskerinc.com

The Samsung Galaxy S20 Fan Edition – The Better Value S20 Launched at MYR 3,399

The Samsung Galaxy S20 was launched earlier this year in March. It was touted as a very capable device with what plenty of fans wanted from a Samsung Galaxy device. In theory, it sounded like the Samsung Galaxy S20 was a capable smartphone with all its bells and whistles. In reality, its price point is a little steep for its price point and that made it a little less desirable.

It has come to this, the new smartphone that will correct all the problems with the ultra-premium S20 line-up. The regular Samsung Galaxy S20 line-up starts at MYR 3,599. The new Samsung Galaxy S20 Fan Edition (FE) will go for MYR 3,399 instead, even cheaper than the regular Samsung Galaxy S20 device.

Source: Samsung

What do you get for MYR 3,399? You get the best parts of the Samsung Galaxy S20 device in a package at a more reachable price point, in short. You get a 32-Megapixel front-facing camera greeting you as you lift the device to face you. This is an even higher resolution than what you are getting from a regular Samsung Galaxy S20.

The display might seem like a little bit of a downgrade at first with no curved edges. It is not technically a downgrade though as you are still working with a Full HD+ 120Hz display for a super smooth experience. It is not like you are getting a much smaller display with the Super AMOLED Infinity-O display measuring at 6.5-inch.

Source: Samsung

Turn it around and you see a sort of matte textured back that makes it stand out in the crowd a little bit. It comes in six funky colours too, to fit your personalities and moods. It comes in Cloud Red, Cloud Orange, Cloud Lavender, Cloud Mint, Cloud Navy, and Cloud White. These colours are completely new to the Samsung Galaxy S line up and is more inline with the Samsung Galaxy Note20 series colours as well, so some premium touch there.

The matte backing surrounds a triple camera module that is the Samsung Galaxy S20 FE’s main shooters. It houses a main 12-Megapixel camera flanked by a 12-Megapixel ultra-wide sensor and an 8-Megapixel telephoto sensor making the photo trinity. You can take advantage of all the cameras at a single touch via Samsung’s Single Take feature in the camera app. The telephoto lens and main shooter combination give the Samsung Galaxy S20 FE the very impressive 30X Space Zoom capabilities too.

Within all the prettiness and IP68 rated body is an immensely powerful Qualcomm Snapdragon 865. No Exynos here, they have listened to the fans. Paired to the chipset is an ample 8GB of RAM too (up to). Thanks to the chipset too, you get 5G connectivity out of the box.

To top it all off is a big 4,500mAh battery that should keep the device running all day. The large internal battery is also a Super-Fast Charging capable battery as well, so if you do have a charger capable of 25W of output, your device can charge from an empty battery to full in less than one hour and a half. The charger that is included with the Samsung Galaxy S20 FE though is a 15W charger, a regular Fast Charging wall adapter.

Specifications

Display6.5-inch flat FHD+ Super AMOLED Infinity-O Display (1080×2400), 407ppi 120Hz refresh rate
Dimensions & Weight74.5 x 159.8 x 8.4mm, 190g
CameraFront 32MP Selfie Camera – Pixel size: 0.8μm – F2.2(80˚)
Rear Triple Camera 12MP Ultra Wide Camera – Pixel size: 1.12μm – F2.2(123 ˚)   12MP Wide-angle Camera – Dual Pixel AF, OIS – Pixel size: 1.8μm  – F1.8(79˚)   8MP Telephoto Camera – Pixel size: 1.0μm – F2.4(32˚)   Space Zoom – 3x Optical Zoom – Up to 30x Super Resolution Zoom – OIS (Optical Image Stabilization) – Tracking AF
ProcessorQualcomm Snapdragon 865
7nm 64-bit Octa-Core Processor – 2.8GHz(Maximum Clock Speed) + 2.4GHz + 1.8GHz   7nm 64-bit Octa-Core Processor – 2.7GHz (Maximum Clock Speed) + 2.5GHz + 2GHz
Memory[5G] 8GB RAM (LPDDR5) with 256GB internal storage
Expandable Memory & SIM CardDual SIM model (Hybrid SIM slot) – One Nano SIM and one Nano SIM or one MicroSD slot (up to 1TB)
Battery4,500mAh (typical)
ChargingFast Wireless Charging 2.0 USB PD 3.0 (PPS) certified Fast Charging for wired charging (AFC and QC2.0 compatible) *WPC certified Wireless charging *Wireless PowerShare
OSAndroid 10
Network[5G] 5G Non-Standalone (NSA), Sub6 [LTE] Enhanced 4×4 MIMO, Up to 5CA, LTE D/L Cat.19 (1.6Gbps),LTE U/L Cat.18 (211Mbps) [Wi-Fi] Wi-Fi 802.11 a/b/g/n/ac/ax 2.4G+5GHz, HE80, MIMO, 1024-QAM, Up to 1.2Gbps Download / Up to 1.2Gbps Upload [Bluetooth] Bluetooth® v 5.0, USB type-C, NFC, Location (GPS, Galileo, Glonass, BeiDou)
PaymentNFC, MST
SensorsOptical Fingerprint sensor, Accelerometer, Barometer, Gyro sensor, Geomagnetic sensor, Hall sensor, Proximity sensor, Ambient Light Sensor
AuthenticationLock type: pattern, PIN, password, Fingerprint sensor, Face recognition
Audio[Stereo speakers sound by AKG] Surround sound with Dolby Atmos technology (Dolby Digital, Dolby Digital Plus included.) – [Ultra high quality audio playback] UHQ 32-bit &DSD64/128 support PCM: Up to 32 bits, DSD: DSD64/128 * DSD64 and DSD128 playback can be limited depending on the file format.   [Audio playback format] MP3, M4A, 3GA, AAC, OGG, OGA, WAV, WMA, AMR, AWB, FLAC, MID, MIDI, XMF, MXMF, IMY, RTTTL, RTX, OTA, APE, DSF, DFF   [Bluetooth] Dual Audio: connect two Bluetooth devices to the Galaxy S20 FE to play audio through the two devices simultaneously. * The two connected devices may exhibit a slight difference in sound output.   Scalable Codec: Enhanced Bluetooth connection under ambient radio frequency interference. * Available only for certain accessories made by Samsung.   [Recording] Recording quality is improved with the High AOP Mic that minimizes distortion in noisy environments. * AOP: Acoustic Overload Point
Video[Video playback format] MP4, M4V, 3GP, 3G2, WMV, ASF, AVI, FLV, MKV, WEBM   [TV connection] Wireless: Smart View (screen mirroring 1080p at 30 fps) Wired: supports DisplayPort over USB type-C. Supports video out when connecting via HDMI Adapter. (DisplayPort 4K UHD at 60 fps)
Water ResistanceIP68

Price and Availability

The Samsung Galaxy S20 FE is now available for pre-order from Samsung Experience Stores, Authorised Partners and Samsung Malaysia’s E-Store until the 8th of October 2020. As mentioned, there are six colours available for the Samsung Galaxy S20 FE – Cloud Red, Cloud Orange, Cloud Lavender, Cloud Mint, Cloud Navy, and Cloud White. If you pre-ordered your device, you get a UV Sterilizer Wireless Charger box, Samsung’s One-Time Screen Crack Protection, and a Clear Standing Cover worth MYR 586 in total. You can get your hands on one for MYR 3,399 (US$ 699.99*) onward.

*Official U.S. pricing based on Samsung U.S. website

Challenge Student’s Creativity with Learning at Karl and Johan Experimental Schools

HSINCHU, Sept. 24, 2020 — With the transformation of school curriculum underway, the way students learn are becoming more diverse and internationalized. The 108-curriculum set by the Ministry of Education allows educators to select various learning methods freely to invigorate the rigid education system in Taiwan. With an aim to provide innovative classes for students, Karl International Experimental Education Institute and Johan International Experimental Education Institute adopt creative and effective class designs, and deliver those classes with experienced teachers from around the globe. Through hands-on learning, students are encouraged to thinking critically, develop problem-solving skills, and embrace diversity.

Over the summer Karl and Johan Schools in Zhubei, Hsinchu offered 3 summer camps that were sold-out and highly praised by parents and students alike. Bilingual classes were designed and carried out by local Taiwanese teachers and foreign teachers together in order to provide a comprehensive learning experience that connects different aspects on a given topic. Not only can students immerse in amusing themes, but also learn effectively in different academic areas. The first summer camp, held at Karl, centered around artificial intelligence (AI) and Python in the morning, followed by culture and science in the afternoon. The second summer camp was held at Johan elementary and allowed children from grades 1 to 6 to travel the world and visit ancient empires like ancient Egypt and China. Children were also able to make and enjoy different cuisines from around the globe. The third and final summer camp combined English speaking classes that focuses on topics like music, movies, and TV in the morning, with equestrian classes every afternoon for two weeks.

Over the summer Karl and Johan Schools in Zhubei, Hsinchu offered 3 summer camps that were sold-out and highly praised by parents and students alike. Bilingual classes were designed and carried out by local Taiwanese teachers and foreign teachers together in order to provide a comprehensive learning experience that connects different aspects on a given topic. Not only can students immerse in amusing themes, but also learn effectively in different academic areas.

Jessica W. (Parent): "This was the first time my child joined Johan’s summer camp. She came home happy everyday, and told us about the vocabulary, maker, art, music, cooking classes she had each day, not to mention the many new friends she has made in school. Thanks to Karl and Johan Experimental Education for their dedication, they truly are a different school.

Parents: "The classes are fulfilling and interesting. Students were motivated to learn, and they truly learn as they play. Teachers were passionate. We love it!"

Student: "The classes were exciting, unlike the other summer camp out there. It was fun!"

The bilingual summer camps at Karl and Johan schools had been carefully designed to offer hands-on learning experiences and arouse students’ passion in learning. Experienced teachers from 15 different countries regularly participates in course development sessions to design teaching materials. During the regular school year, Karl school also offer different pathways that students can take to continue their undergraduate studies locally and internationally. They believe students can learn effectively only if they become self-motivated and passionate about learning. Education is no longer just a one-way street; through the help of experimental schools in Taiwan, teaching becomes more flexible, and students become independent learners.

Photo – https://photos.prnasia.com/prnh/20200924/2927581-1?lang=0

Panchshil Realty Celebrates Strong Sales Growth at Its Flagship Residential Project-Panchshil Towers, Pune


PUNE, India, Sept. 24, 2020 — Panchshil Realty today announced that it has achieved strong sales growth and seen excellent demand for its flagship residential project Panchshil Towers, located in Pune’s eastern IT corridor.

Panchshil Towers Clubhouse Render

To view the Multimedia News Release, please click:  https://www.multivu.com/players/uk/8769551-panchshil-realty-sales-at-panchshil-towers/

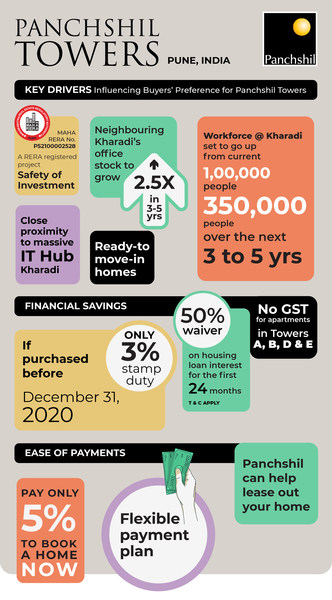
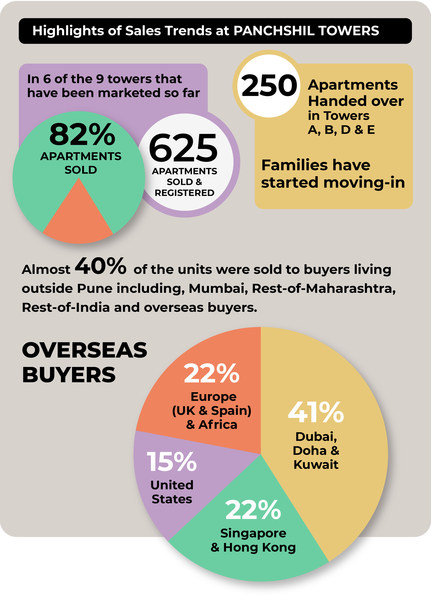
Over the last year, sales at Panchshil Towers have seen encouraging double-digit growth in the domestic market and sales to NRIs have tripled. The sales momentum has in fact picked up post the onset of the pandemic as discerning home buyers are now seeking spacious and well planned homes.

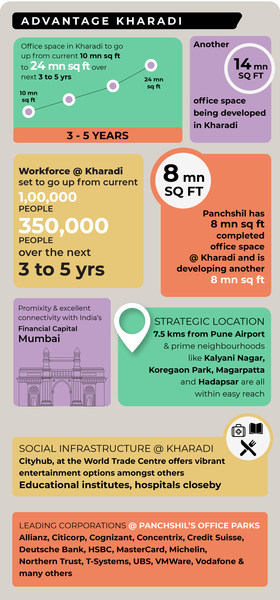
Panchshil Towers’ proximity to Kharadi is one of the many key drivers of sales growth. Over the next 3 to 5 years the total office stock at Kharadi is expected to reach 24 Million Sq Ft with 3,50,000 people expected to work there.

Panchshil Towers is a premium residential destination comprising 9 towers spread over 14 acres with 60% open spaces.  3.5 and 4.5 bedroom-hall-kitchen (BHK) residences are available here with typical apartments ranging in size from 1900 square feet to 2200 square feet (all areas are RERA carpet areas). (MahaRERA No. P52100002528)

Towers A, B, D & E are ready-to-move-in. Apartments at Panchshil Towers (Towers A, B, D & E) start at INR 2.45* Cr. while apartments in the other towers start at INR 1.93 Cr.

Sharing his insights on the sales trends of Panchshil Towers, Mr. Sagar Chordia, Director, Panchshil Realty said, "There has been an increase in demand for larger homes and families want spacious homes to be safe and comfortable post the pandemic. Besides, buyers are increasingly choosing ready-to-move-in homes to fulfill their aspirations for better living in a community setting."

To know more about Panchshil Towers, please click here

Panchshil Realty’s total completed real estate portfolio is around 23 million square feet with another 20 million square feet under development. Panchshil Realty’s three main business verticals are Residential, Commercial and Hospitality. A significant chunk of Panchshil Realty’s office portfolio is anchored by Blackstone Real Estate Private Equity Fund, sponsored and managed by Blackstone Group LP.For more information about Panchshil Realty, please visit www.panchshil.com

For sales enquires related to Panchshil Towers, Pune, please contact Himanshu Rathore on +91-99230-55555 or via email at Himanshu.rathore@panchshil.com

For more detailed disclaimers about Panchshil Towers, please click here.

Photo – https://mma.prnasia.com/media2/1279116/panchshil_towers_clubhouse.jpg?p=medium600  
Infographic – https://techent.tv/wp-content/uploads/2020/09/panchshil-realty-celebrates-strong-sales-growth-at-its-flagship-residential-project-panchshil-towers-pune-4.jpg
Infographic – https://techent.tv/wp-content/uploads/2020/09/panchshil-realty-celebrates-strong-sales-growth-at-its-flagship-residential-project-panchshil-towers-pune-5.jpg
Infographic – https://mma.prnasia.com/media2/1279118/sales_trends_infographic.jpg?p=medium600
Logo – https://mma.prnasia.com/media2/1042836/Panchshil_Realty_Logo.jpg?p=medium600

ADVANTAGE KHARADI
ADVANTAGE KHARADI


KEY DRIVERS Influencing buyers' preference for Panchshil Towers.
KEY DRIVERS Influencing buyers’ preference for Panchshil Towers.


Highlight of Sales Trends at PANCHSHIL TOWERS


Related Links :

http://www.panchshil.com/

Picosun’s ALD technology boosts UVC LED performance

ESPOO, Finland, Sept. 24, 2020 — Picosun Group, the leading supplier of AGILE ALD® (Atomic Layer Deposition) thin film coating technology, reports excellent results in UVC (ultraviolet-C) LED performance, achieved with the company’s ALD solutions.

Excellent reliability and lifetime improvements of UVC LEDs have been obtained at Picosun’s customer and collaboration partner site, National Chiao Tung University (NCTU), Taiwan, using passivation and barrier films deposited with PICOSUN® ALD equipment(*). ALD passivation layer could potentially replace the expensive hermetic seal package of the LEDs and thus lower the costs of the final device.

"We have used Picosun’s ALD technology already for years with great success. Our PICOSUN® ALD equipment yields superior quality films which has helped us to achieve several breakthroughs in our LED research. Picosun has local presence in Taiwan and we appreciate the prompt response of their customer support if we ever have any issues. At the phase when R&D results are to be ramped up to industrial-level production, the scalability of Picosun’s ALD technology is a huge benefit," comments Professor Hao-Chung Kuo from NCTU.

In order to reach maximum light output and long operating lifetime, LED chips require surface passivation to eliminate parasitic currents caused by traps and defects. Also barrier coating is typically needed as LED materials are sensitive to moisture. ALD is an ideal technique to manufacture both the passivation and barrier films – and when the LED size diminishes to micrometer dimensions, the only coating method capable of producing high enough quality films on the required minuscule scale. Ultra-thin, pinhole-free ALD films do not suppress the LED light intensity and they provide reliable protection against ambient conditions, whereas their superior conformality ensures no thickness variations between the facets of the LED chip. Thickness variations, typical side effect of other coating methods, can potentially lead to uneven distribution of film stress or thermal expansion behavior and risk physical damage of the chip.

Short-wavelength UVC radiation destroys bacteria and viruses so UVC LED technology is particularly topical now during the still ongoing COVID-19 pandemic. Small, lightweight LEDs enable versatile design of portable, compact disinfecting equipment, they consume less power than other UVC sources, they are durable, and they pose no risk of hazardous material leaks such as e.g. mercury lamps.

"We are happy of the achievements of Professor Kuo’s group at NCTU, and how Picosun’s ALD technology has helped them to achieve their goals in UVC LED development. Our long-term collaboration and networking with both the academia and prominent industries in this field gives us the perfect synergy advantage to facilitate implementation of these solutions in industrial manufacturing," says Mr. Edwin Wu, CEO of Picosun Asia Pte. Ltd.

(*) UVC LED with 50 nm ALD Al2O3 passivation and normal LED packaging (no hermetic seal) maintained 80% of its original efficiency even after 500 hours environmental test at 85% humidity and 85 oC temperature.

Picosun provides the most advanced AGILE ALD® (Atomic Layer Deposition) thin film coating solutions for global industries. Picosun’s ALD solutions enable technological leap into the future, with turn-key production processes and unmatched, pioneering expertise in the field – dating back to the invention of the technology itself. Today, PICOSUN® ALD equipment are in daily manufacturing use in numerous leading industries around the world. Picosun is based in Finland, with subsidiaries in Germany, USA, Singapore, Taiwan, China, Korea and Japan, offices in India and France, and a world-wide sales and support network. Visit www.picosun.com.

More information:

Mr. Edwin Wu
CEO, Picosun Asia Pte. Ltd.
Tel: +358 40 480 3449
Email: info@picosun.com
Web: www.picosun.com 

CONTACT:

Minna Toivola
D.Sc., Marketing Manager, Picosun Oy
Email: minna.toivola@picosun.com
Tel: +358 40 758 8748


This information was brought to you by Cision http://news.cision.com

https://news.cision.com/picosun-oy/r/picosun-s-ald-technology-boosts-uvc-led-performance,c3201590

The following files are available for download:

https://mb.cision.com/Main/16058/3201590/1309927.pdf

Picosun’s ALD technology boosts UVC LED performance

AUTOCRYPT Announces Official Partnership with NXP for Integrated V2X Security Solutions

SEOUL, South Korea, Sept. 24, 2020 — AUTOCRYPT Co., Ltd., a leading V2X and autonomous vehicle security solutions provider, announced its partnership with NXP Semiconductors in several automotive security related applications beginning with secure V2X.

As an official partner of NXP, support for AutoCrypt V2X will be streamlined across NXP’s V2X-related offerings, including the SAF5X00 modem chipsets and the SXF1800 Secure Element IC for V2X Communication, as well as the i.MX 8 Series Application Processor. By integrating AUTOCRYPT’s IEEE 1609.2-compliant V2X security solution onto NXP’s platform, secure exchange of V2X messages as well as performance optimization can be achieved more effectively.

Regarding the partnership, AUTOCRYPT CEO and co-Founder Daniel ES Kim stated, "As an increasing number of vehicles and infrastructure rely on connectivity, it is tantamount that processors have the highest ability to secure V2X communication. As a major player in the automotive market, NXP values security as much as AUTOCRYPT. We are looking forward to joint solution development to continue to progress in our target to keep connected cars secure."

AUTOCRYPT’s offerings across V2X, V2D, and V2G security are a natural match for NXP’s expansive automotive portfolio, paving the way for further joint solution development as global interoperability continues to become a crucial factor for enabling safe transportation and mobility.

AUTOCRYPT is the leading player in autonomous vehicle security. Recognized by TU-Automotive as the Best Auto Cybersecurity Product/Solution of 2019, AUTOCRYPT continues to pave the way in transportation and mobility security through a multi-layered, holistic approach. Through security solutions for V2X/C-V2X, V2G (including Plug & Charge security), in-vehicle security, and Fleet Management, AUTOCRYPT ensures that security is prioritized before autonomous vehicles hit the road.

Visit www.autocrypt.io for more information, and contact marketing@autocrypt.io for partnership inquiries.

Related Links :

Home

Nintex Receives 2020 Tech Cares Award for its COVID-19 Customer Response


Organisations around the world turned to Nintex for valuable resources and software solutions to quickly improve business processes with process mapping and to automate work with workflow automation, digital forms, RPA and more

AUCKLAND, New Zealand, Sept. 24, 2020 — Nintex, the global standard for process management and automation, today announced that TrustRadius has recognised the company’s efforts to support Nintex customers and partners during COVID-19, with a 2020 Tech Cares Award. This award celebrates software vendors that have gone above and beyond to provide their communities, clients and front-line workers with valuable resources and critical support during the pandemic.


  • To access free downloadable Nintex process maps and workflow templates for business continuity, remote work, reopening the workplace, and more visit: https://gallery.nintex.com/ 

"In anticipation of the pandemic’s impact on business globally we formulated a response aimed at helping our customers and partners successfully manage opportunities and challenges including everyone’s need to go digital faster," said Nintex CEO Eric Johnson. "By making key resources freely available, organisations in every geography of the world were easily equipped to further leverage their investment in the Nintex Process Platform and were able to navigate rapid change, quickly improve processes, and build and deploy automated solutions with RPA, digital workflows and forms with ease and speed." 

To be accepted for the Tech Cares Award, each nominated organisation had to be a B2B technology company that demonstrated above-and-beyond caring during the COVID-19 pandemic. All nominations were thoroughly vetted by the TrustRadius research team.

Beginning in March 2020, Nintex quickly rolled-out no cost training and certification programs, free process and workflow templates, and coaching services to help organisations digitally transform faster, create and shift processes, and automate work. Nintex business continuity resources for COVID-19 include:

  • Instructor-led training
    Nintex offered free instructor-led training through the end of August 2020 to support customers needing to quickly ramp up automation. Over the past six months, Nintex has seen nearly 10,000 classroom enrolments, resulting in more than 1,520 new certifications attained. Following the success of the training promotion, Nintex introduced a new affordable subscription-based training program, which offers the entire catalogue of Practitioner and Expert-level on-demand courses, enrolment in any live virtual class, and access to all certifications.
  • COVID-19 solution accelerators
    Nintex created and released more than 20 COVID-19 related templates, from process maps to workflows, in the Nintex Process Accelerator Gallery, which have been download more than 1,200 times. The process accelerator templates can be leveraged by organisations to rapidly automate a broad range of business processes with the Nintex Process Platform.
  • Coaching initiative
    Nintex launched a coaching initiative which provides customers access to experts who help them apply Nintex Forms, Nintex Workflow, Nintex Promapp®, Nintex RPA, Nintex Sign® powered by Adobe Sign, and more to their business processes. The program has resulted in nearly 100 coaching engagements to support COVID-19 related solutions across the public sectors, financial services, and more.

Earlier this year, Nintex earned a 2020 Top Rated Award from TrustRadius, the customer insights platform, based on high satisfaction reviews and ratings from customers.

To experience the easy-to-use and powerful capabilities of the Nintex Process Platform, request a demo at https://www.nintex.com/request-demo/.

Media Contact
Laetitia Smith
Nintex
laetitia.smith@nintex.com
cell: +64 21 154 7114

About Nintex
Nintex is the global standard for process management and automation. Today more than 8,000 public and private sector clients across 90 countries turn to the Nintex Platform to accelerate progress on their digital transformation journeys by quickly and easily managing, automating and optimising business processes. Learn more by visiting www.nintex.com and experience how Nintex and its global partner network are shaping the future of Intelligent Process Automation (IPA).

Product or service names mentioned herein may be the trademarks of their respective owners.

Logo – https://techent.tv/wp-content/uploads/2020/09/nintex-receives-2020-tech-cares-award-for-its-covid-19-customer-response.jpg  

Related Links :

http://www.nintex.com