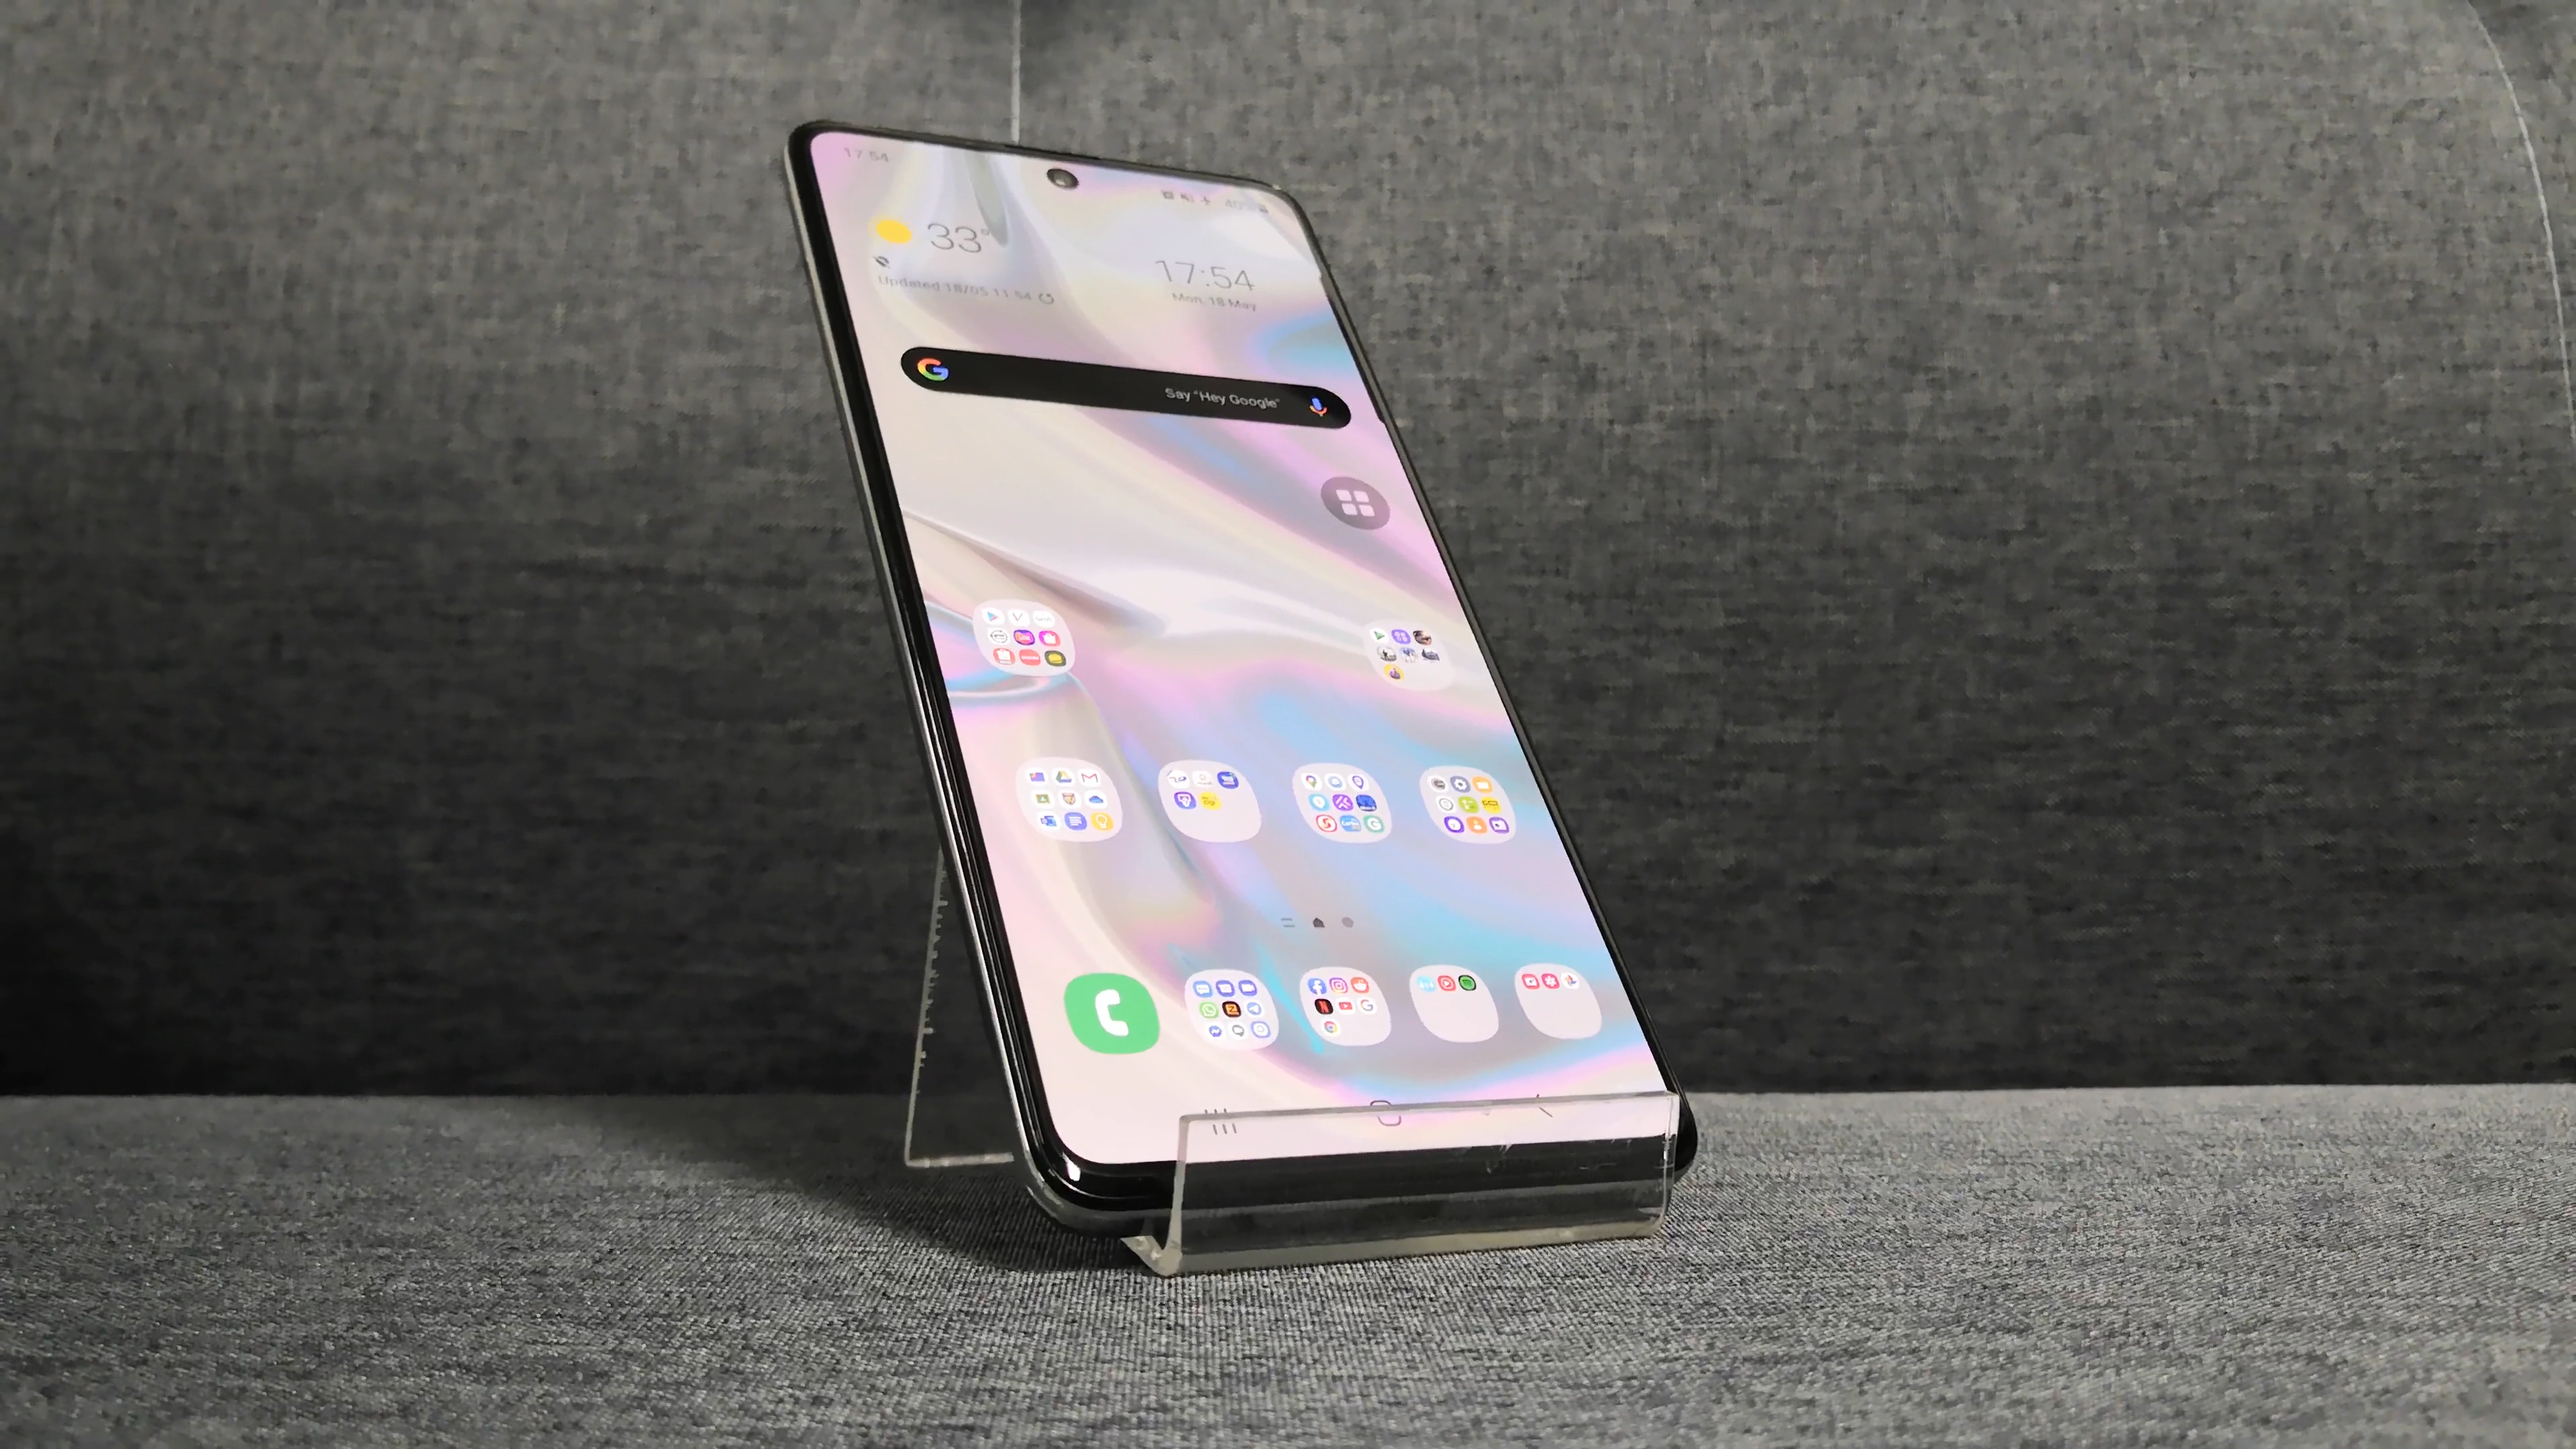
Samsung Galaxy A71 In-Depth Review The Affordable Jack of All Trades?

The Samsung Galaxy A(w-Suh-m) series is full of awesome goodies from the front of the Super AMOLED screen all the way to the camera array on the back. The A series has always been about variety; ranging from the Samsung Galaxy A01 all the way up to the Samsung Galaxy A80. We’re taking a look at the Samsung Galaxy A71 – the latest and greatest Galaxy A series phone at the time of writing in Malaysia. Above the Galaxy A71, we are met with Samsung’s next tier consisting of the Samsung Galaxy Note 10 Lite and the Galaxy S10 Lite. The Note 10 lite is MYR500 (USD$118) more while right under is the A51 which is MYR500 cheaper than the A71. This beckons the question, how awesome is this phone, really?

Hardware and Performance

Let’s start off with the hardware. Just because it is a mid-tier phone does not mean it does not have the goods. The phone comes with a Qualcomm Snapdragon 730 Octa-core processor that handles heavy apps and games like a breeze. This is paired with either 6GB or 8GB of RAM to let you run all the applications you need. Last but not least 128GB of internal storage which seems decent but let’s not forget like most Samsung, it can host a micro SD card to expand its storage. This is bolstered by a pretty respectable camera setup that would suffice for most users.

As the Galaxy A71 is a mid tier phone, I did not have much expectations of the phone. Maybe some freezing and lag after heavy load applications such as games but the use of the Snapdragon 730 really packs a punch for the performance of the phone. It felt as if I was using a phone with a top of the line processor, giving me the ability to jump back and forth between apps without much hiccups.

Call Quality and Connectivity

Phone calls on the A71 works just as well like every other phone on the market. Giving you clear sound quality from its earpiece and speakers while picking up every sound around you from a teeny tiny mic in the phone. These days many youngsters do not call one another anymore unless its an emergency and couples prefer video calls to see each other. With a better selfie camera the receiving end of the video calls of the A71 user gets a much clearer video quality.

However, the antenna on this phone does not pick up signal as good compared to other phones. In an area with expected weak connectivity the phone could barley register any signal leaving you stranded with no connectivity at all. Videos calls would lag as you cannot load what’s coming from the other end and regular phone calls would be half muffled and cut off.

Specifications

ProcessorQualcomm Snapdragon 730
Operating System (OS)Android 10
One UI 2.0
Display Super AMOLED+
capacitive touchscreen
16M colours
6.7 inches
87.2% screen to body ratio
Memory6GB RAM, 128GB Storage
8GB RAM, 128GB Storage
Rear Camera64-megapixel wide camera, f/1.8, 26mm, PDAF 
12-megapixel ultrawide, f/2.2, 12mm
5-megapixel macro, f/2.4, 25mm
5 -megapixel depth, f/2.2
Front Camera32 -megapixel wide, f/2.2, 26mm
ConnectivityWi-Fi 802.11 a/b/g/n/ac, dual-band
Wi-Fi Direct
Bluetooth 5.0,
A2DP, LEA-GPS, GLONASS, GALILEO, BDS
NFC
USB Type-C (v1.0)
AudioSingle loud speaker
3.5 mm jack
Battery4,500 mAh battery
25W fast charging
MiscellaneousFingerprint (under display, optical)
Accelerometer
Gyro Sensor
Proximity Sensor
Compass

Camera

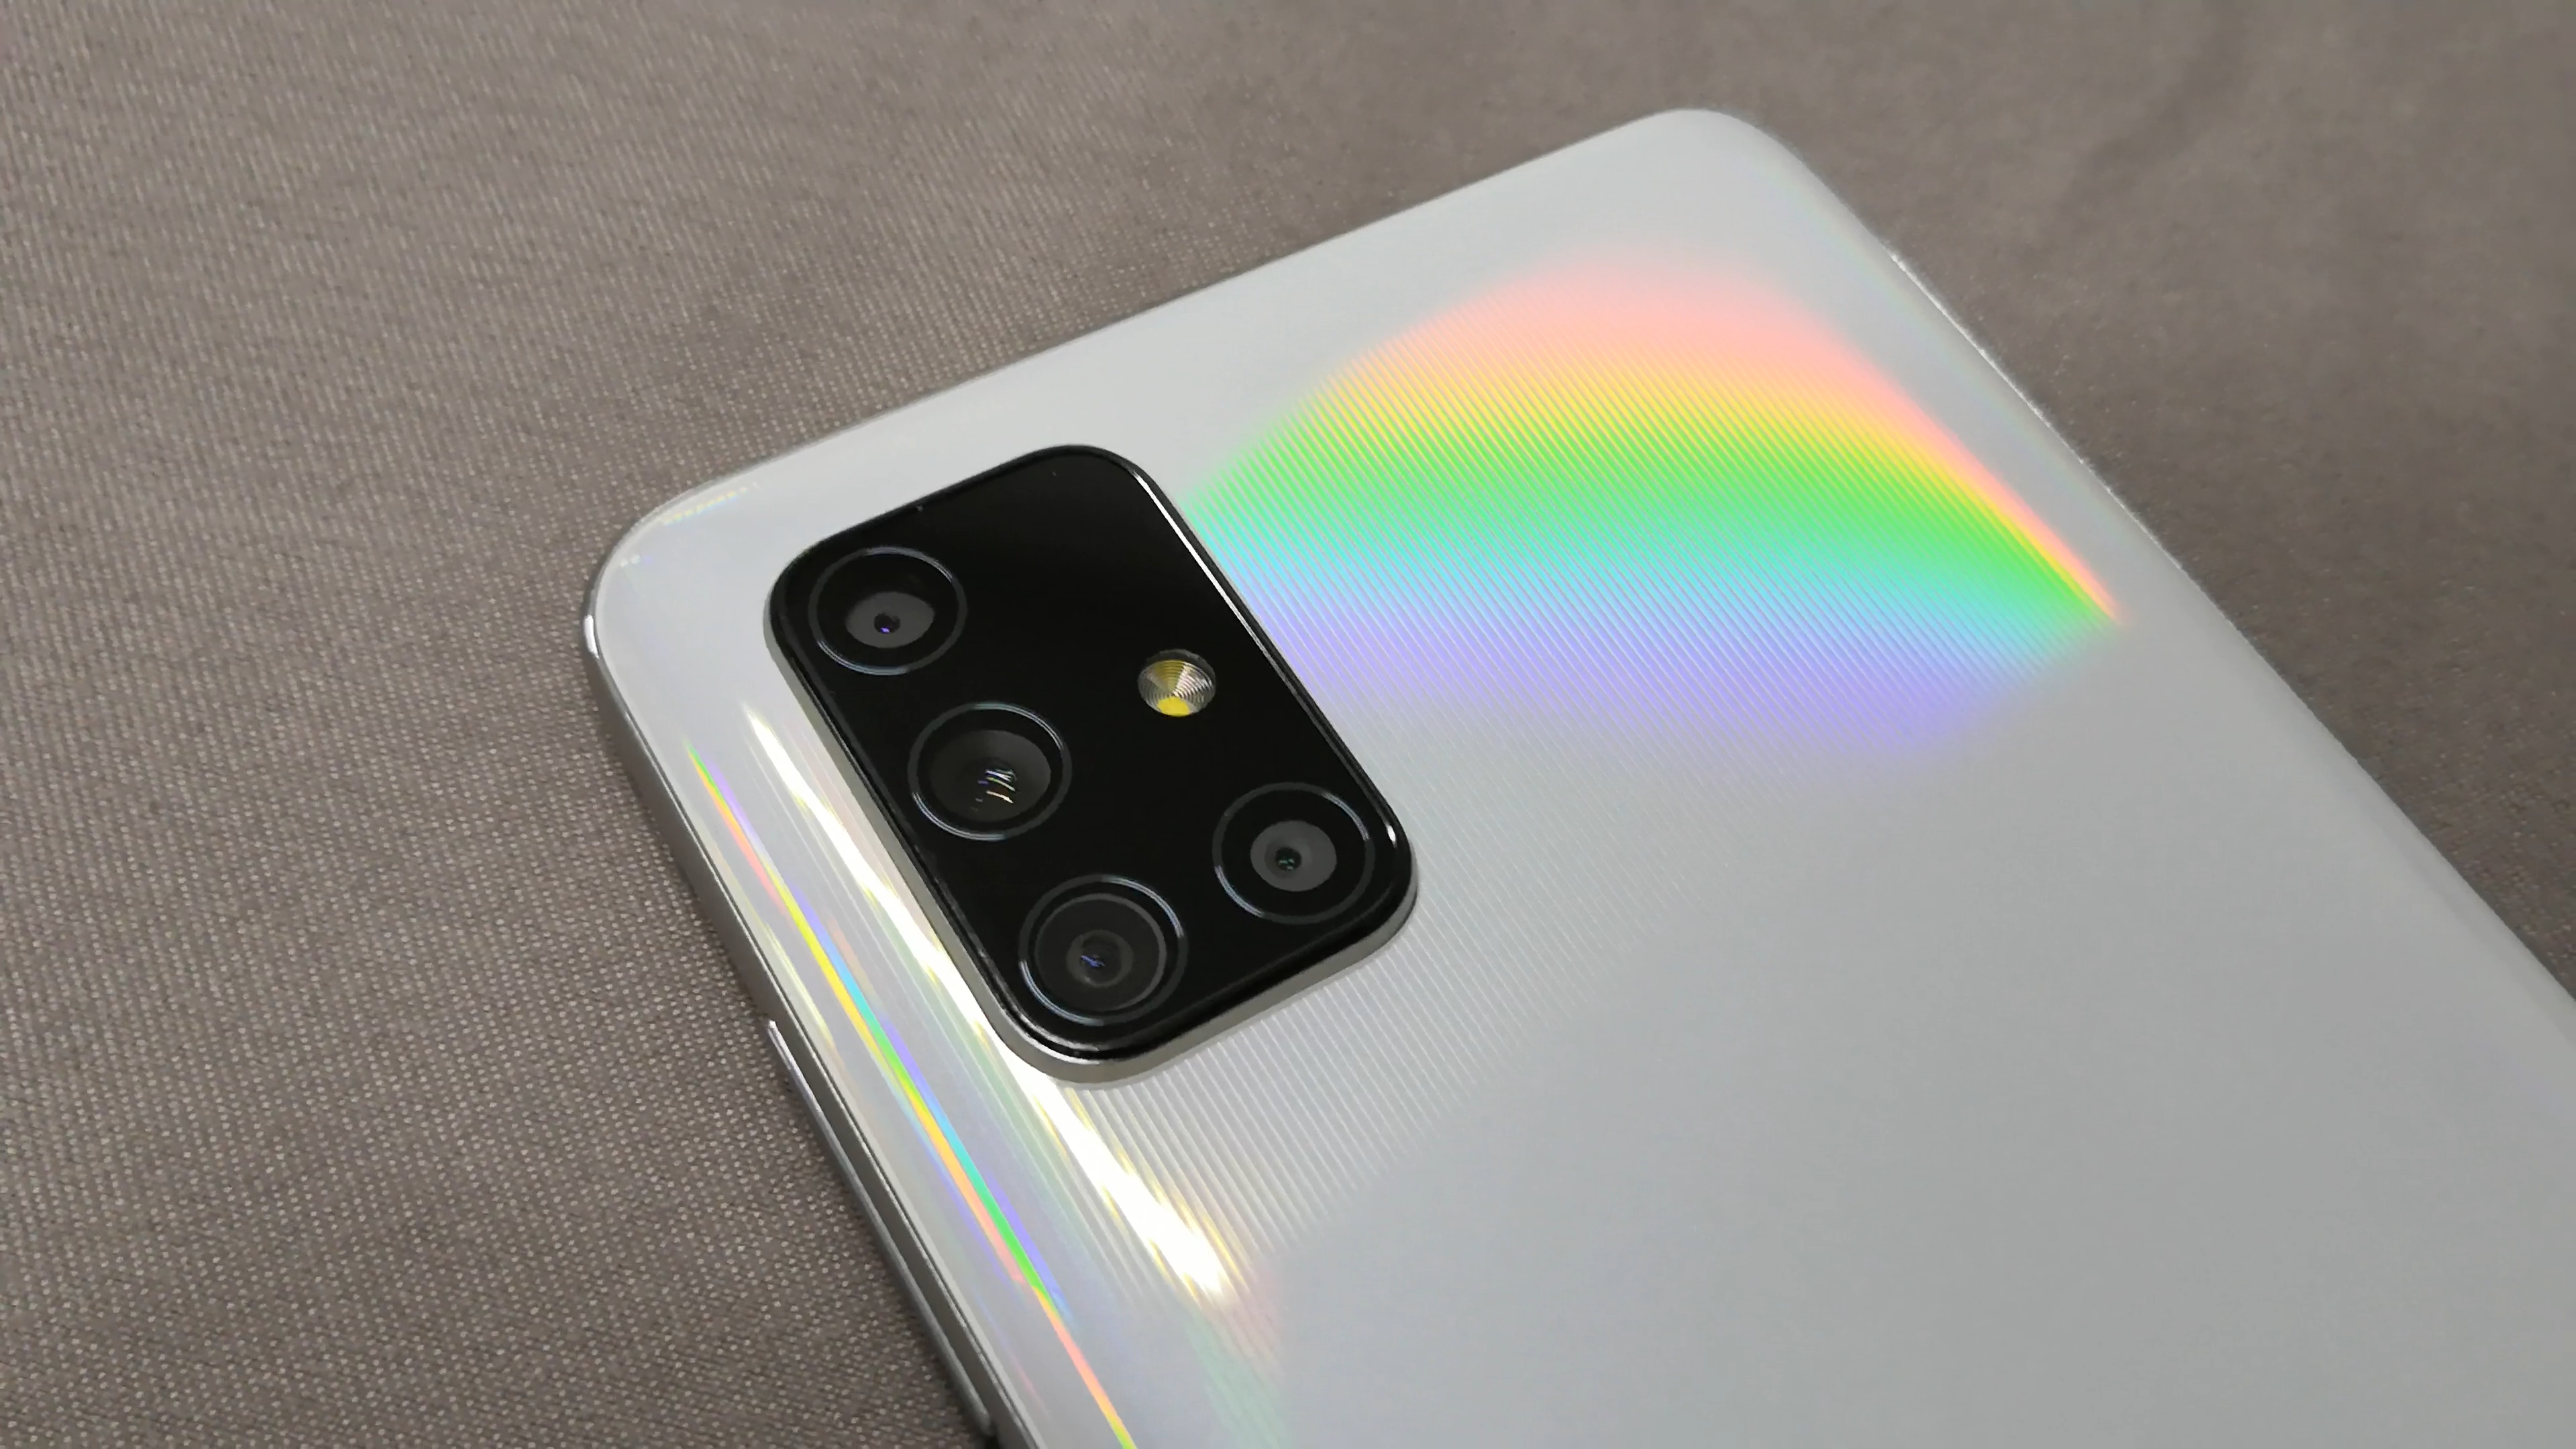
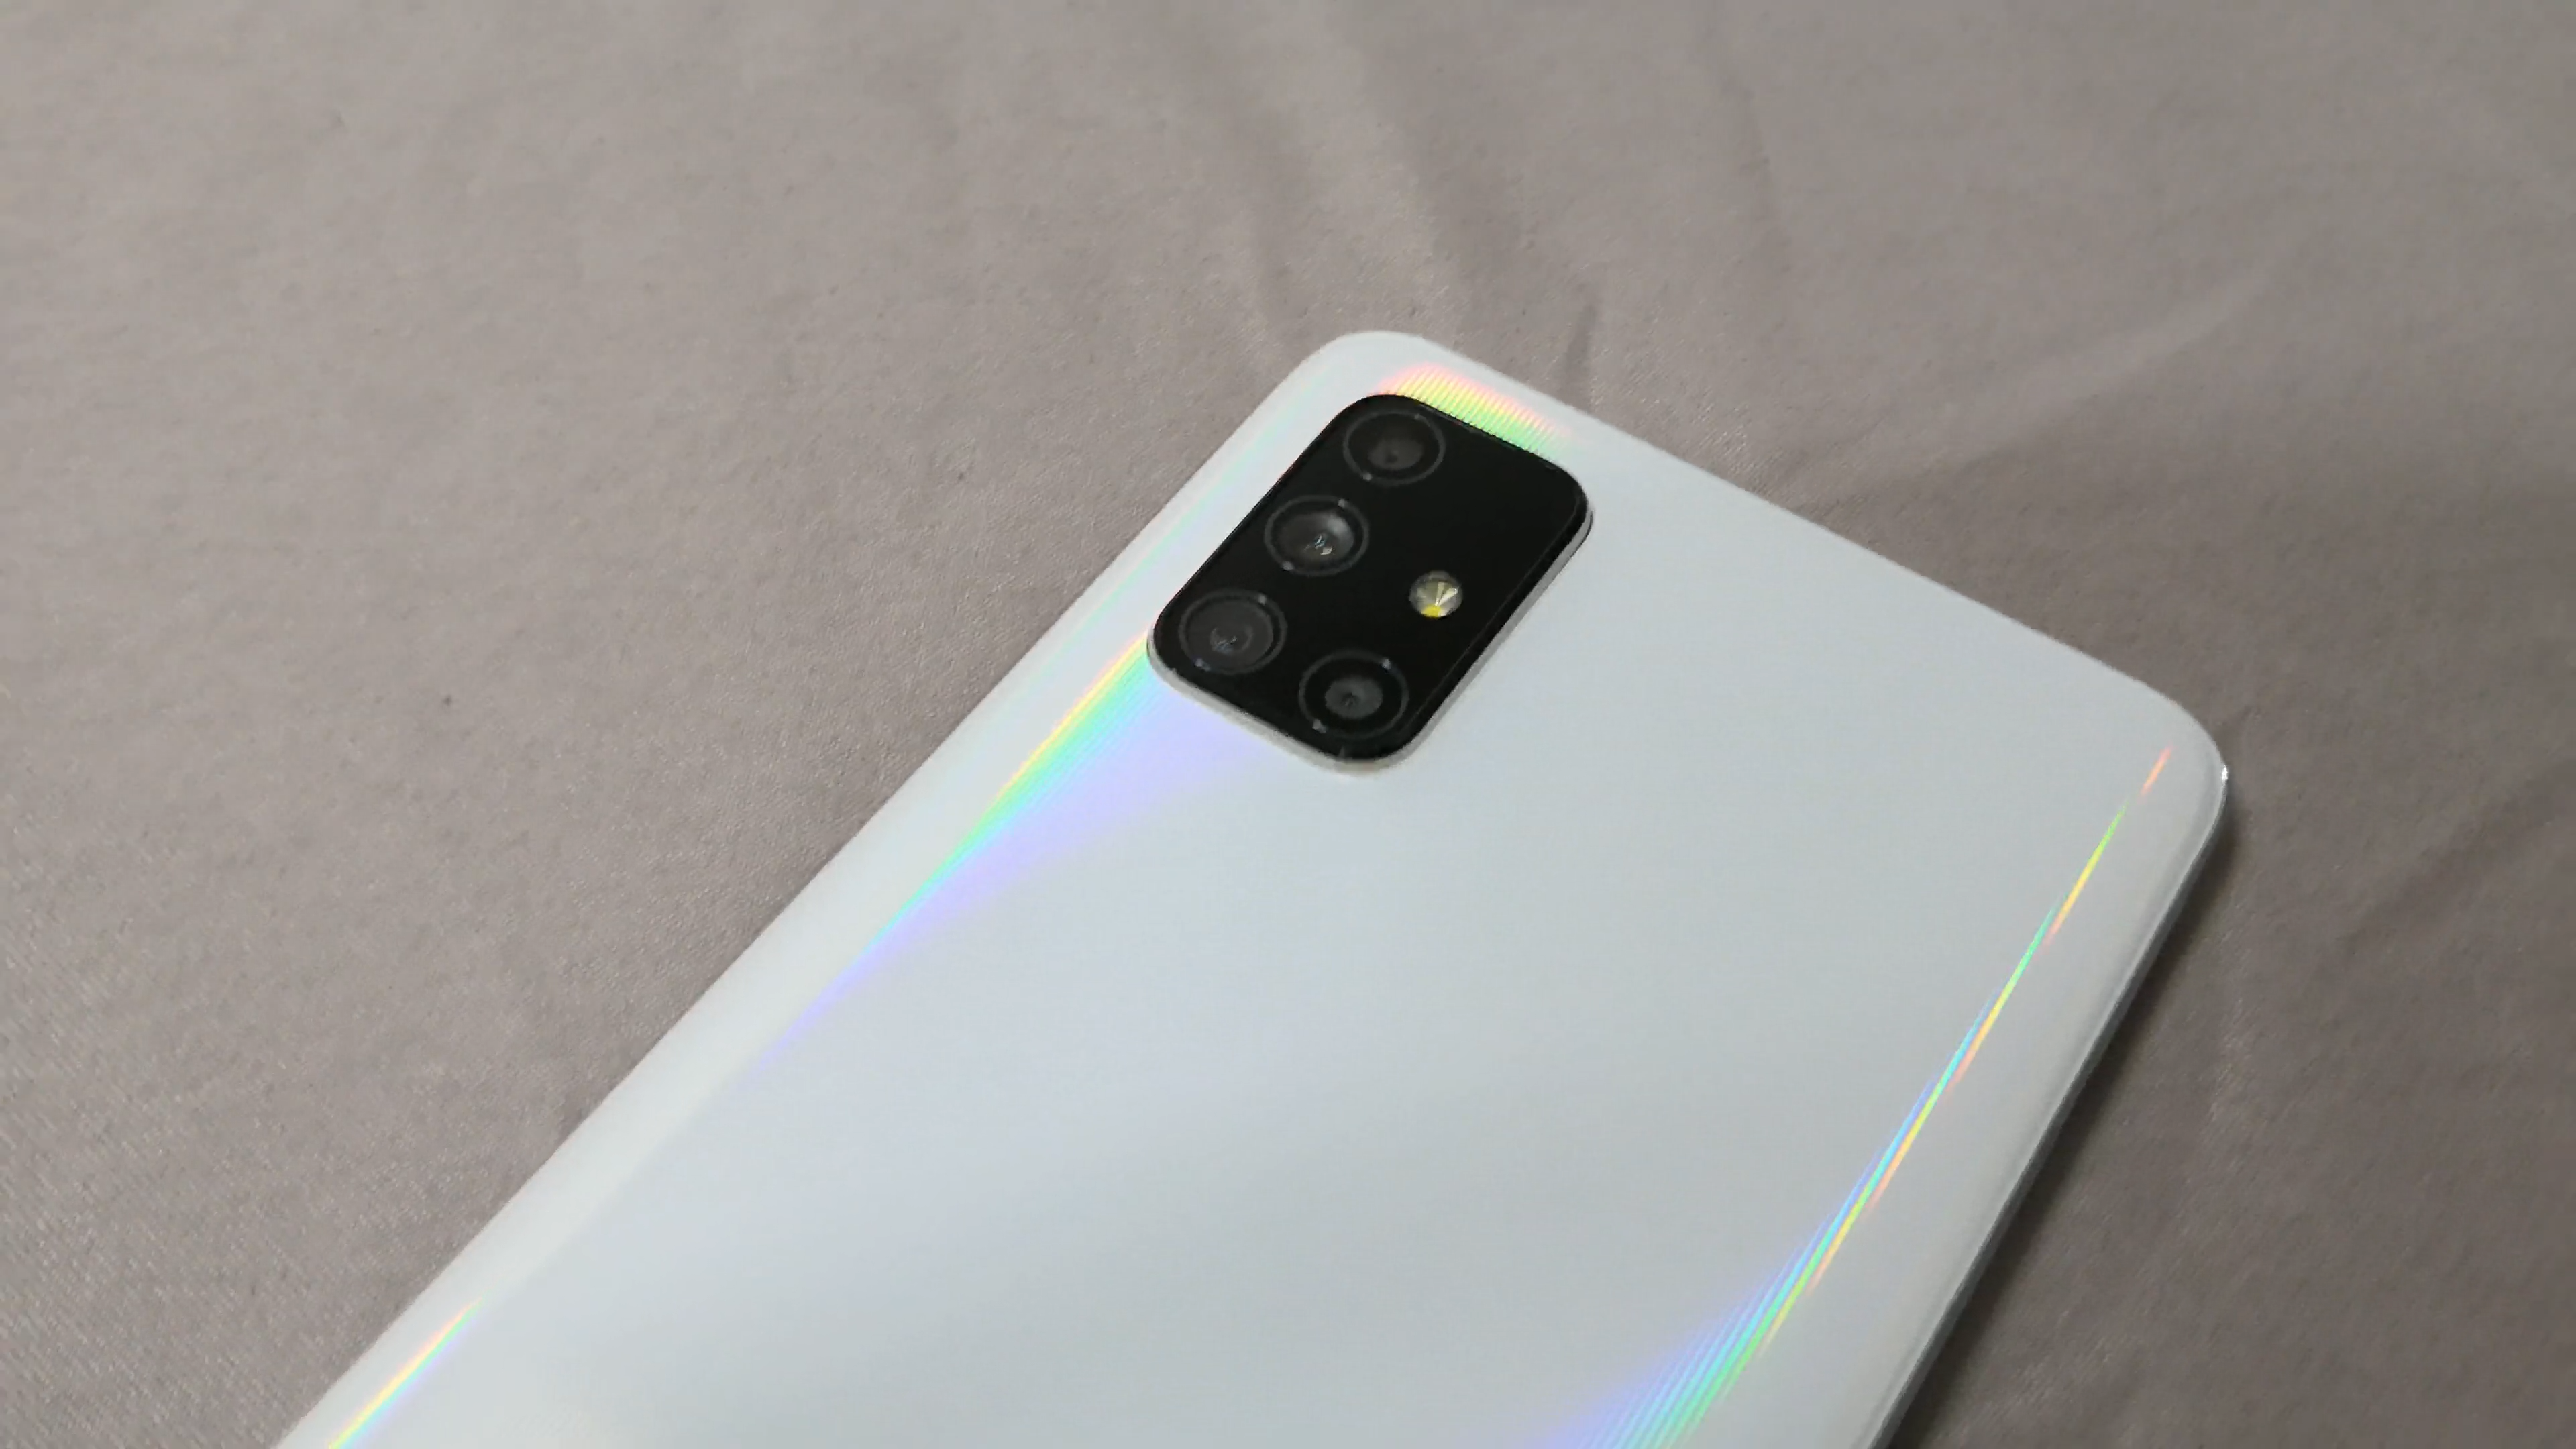
The Samsung Galaxy A71 comes with a quad-camera set up that has a 64-megapixel main sensor! This is complemented by three other cameras: a 12-megapixel ultrawide sensor, a 5-megapixel macro lens, and lastly a 5-megapixel depth sensor. This setup raises a few questions particularly since Samsung has already stepped up its camera game by having a 48-megapixel sensor in the S10 Lite. This is contrasted to the 12-megapixel main sensor in the S20. Take those and contrast it to the fact that Samsung has equipped the A71 with the 64-megapixel sensor. Now that is Aw-Suh-m approved. Upfront, the Galaxy A71 comes with a single, 32-megapixel camera up similar to many other Samsung phones.

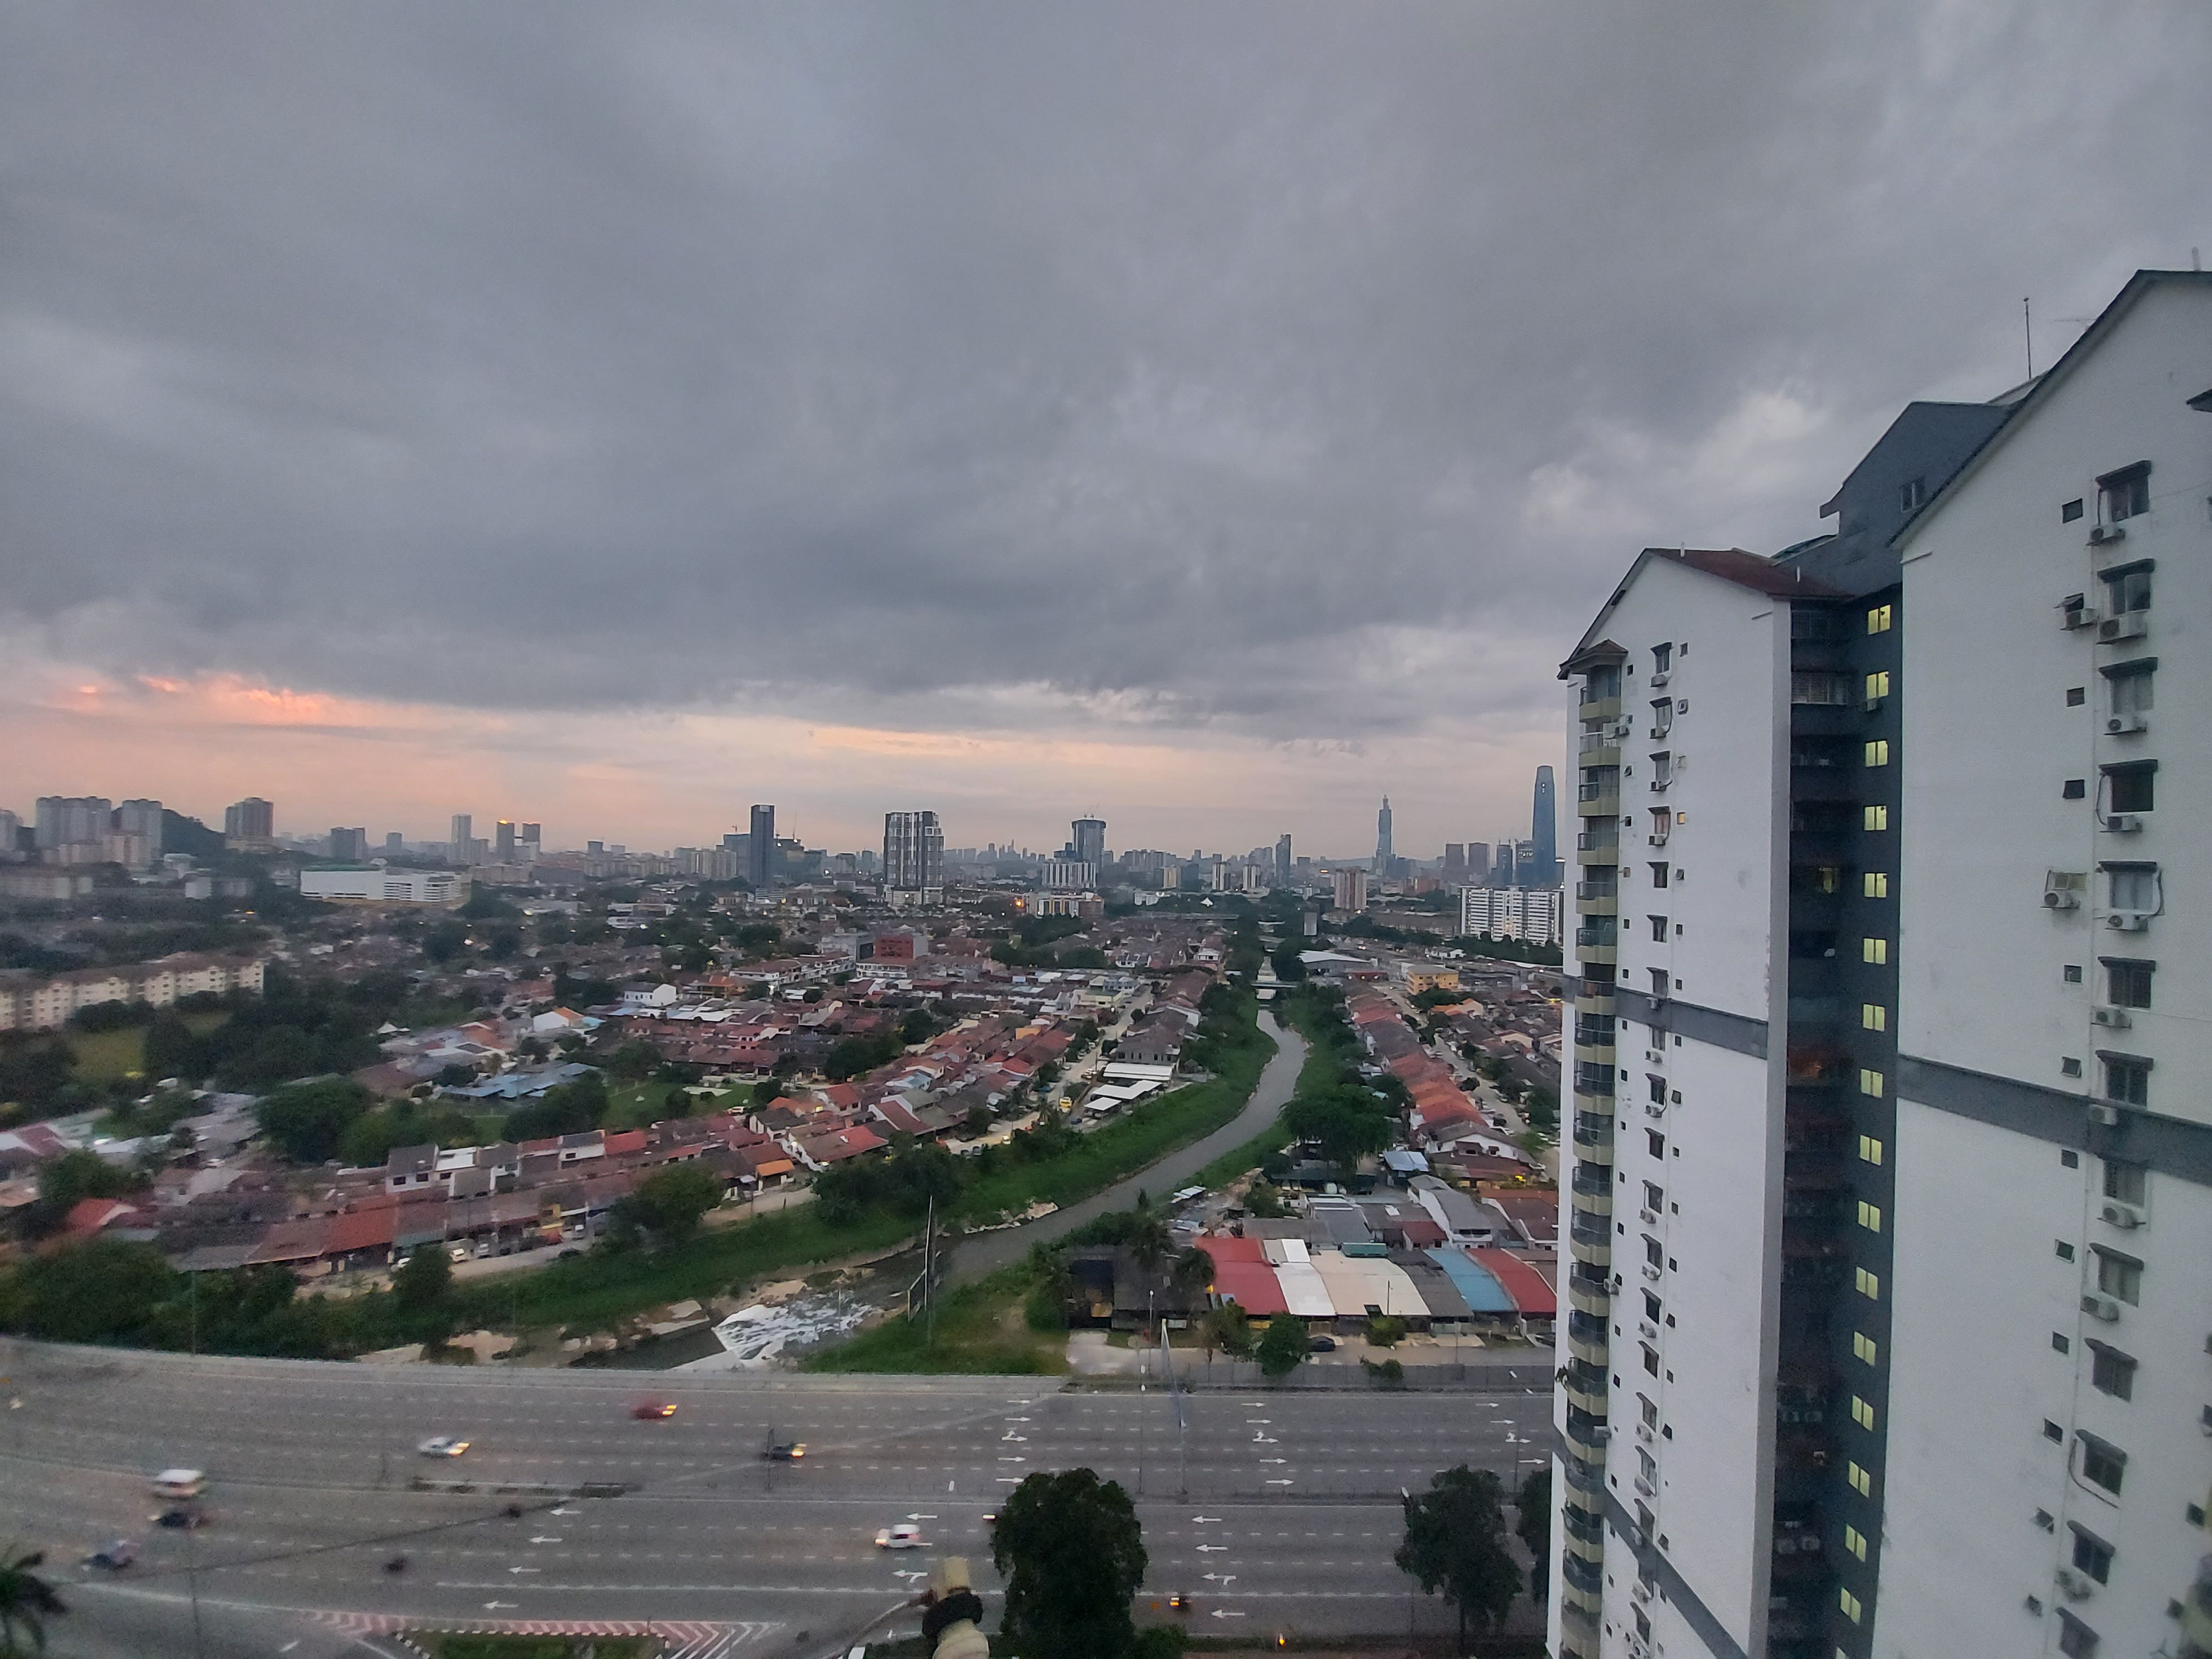
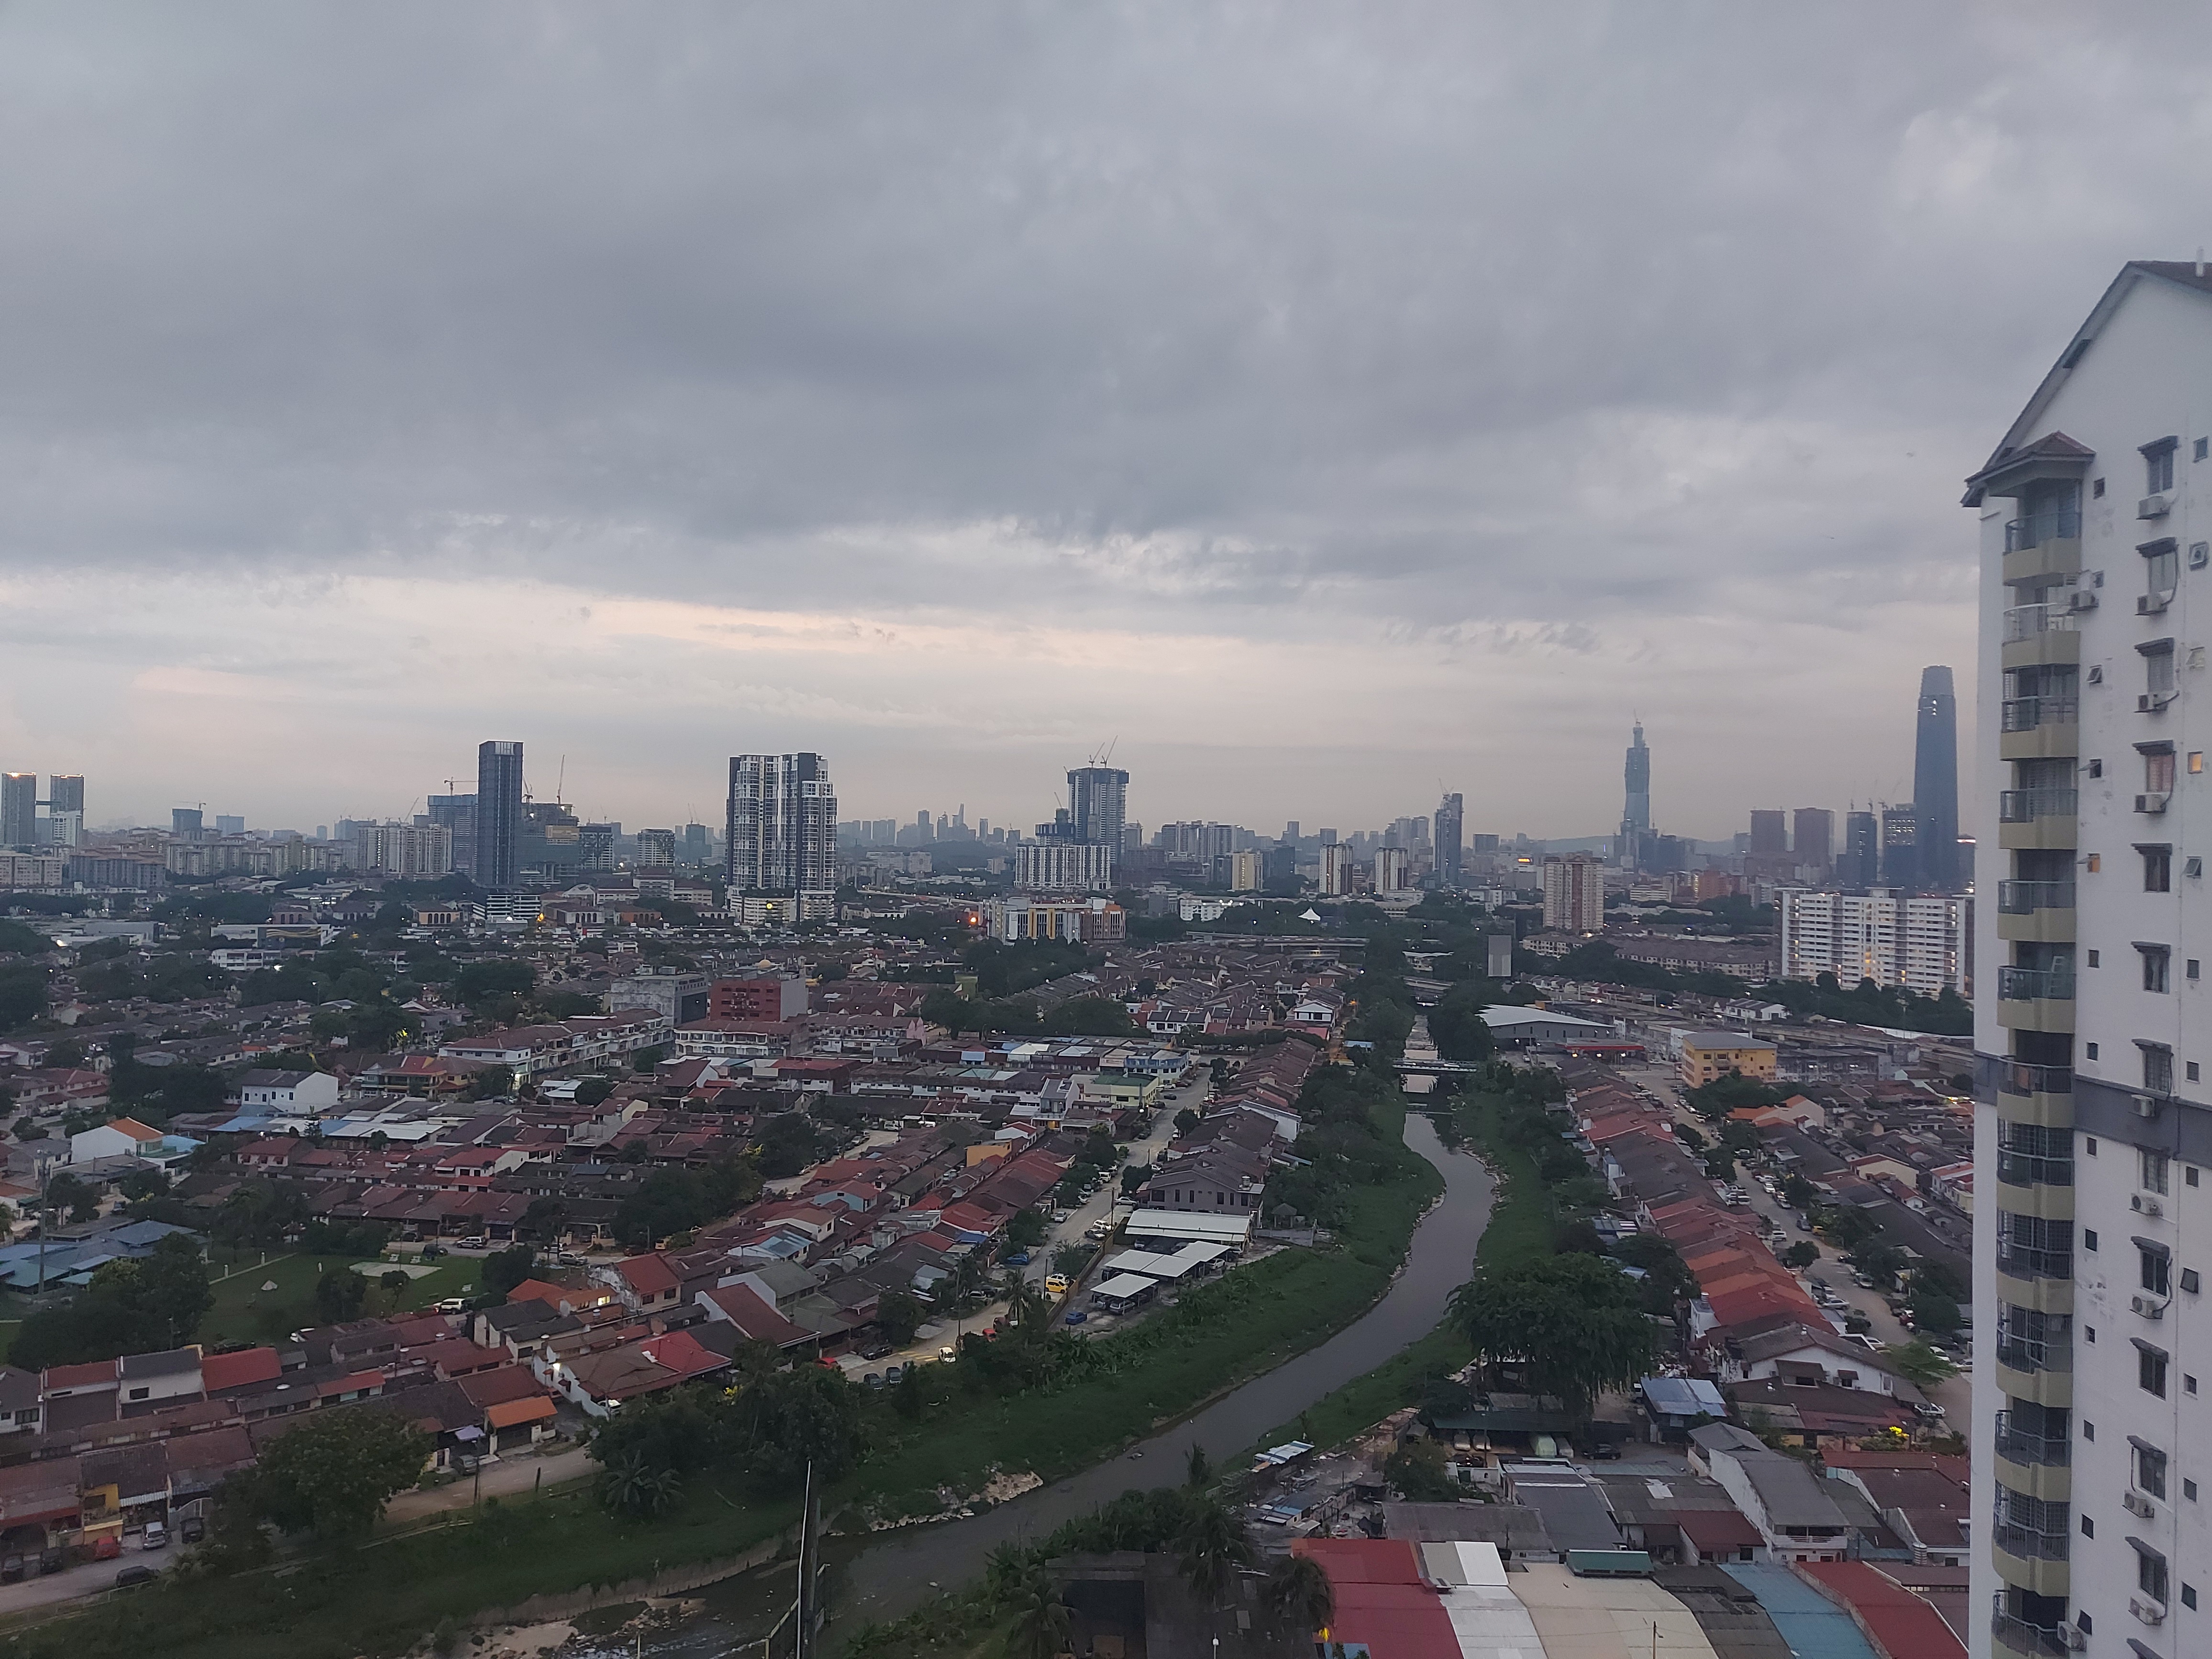
However, let’s not get ahead of ourselves when it comes to the pixels in the camera. The camera looks like it captures pictures really well at the first glance but after deeper inspection. The only reason the pictures looks good is due to its colour contrast where it makes the colours pop. If you zoom into the pictures the textures seem like it is blended and mixed together. The camera also pics up a lot of noise giving the pictures a very grainy look. This is quite disappointing as there are phone with smaller megapixel sensor which can perform better. 

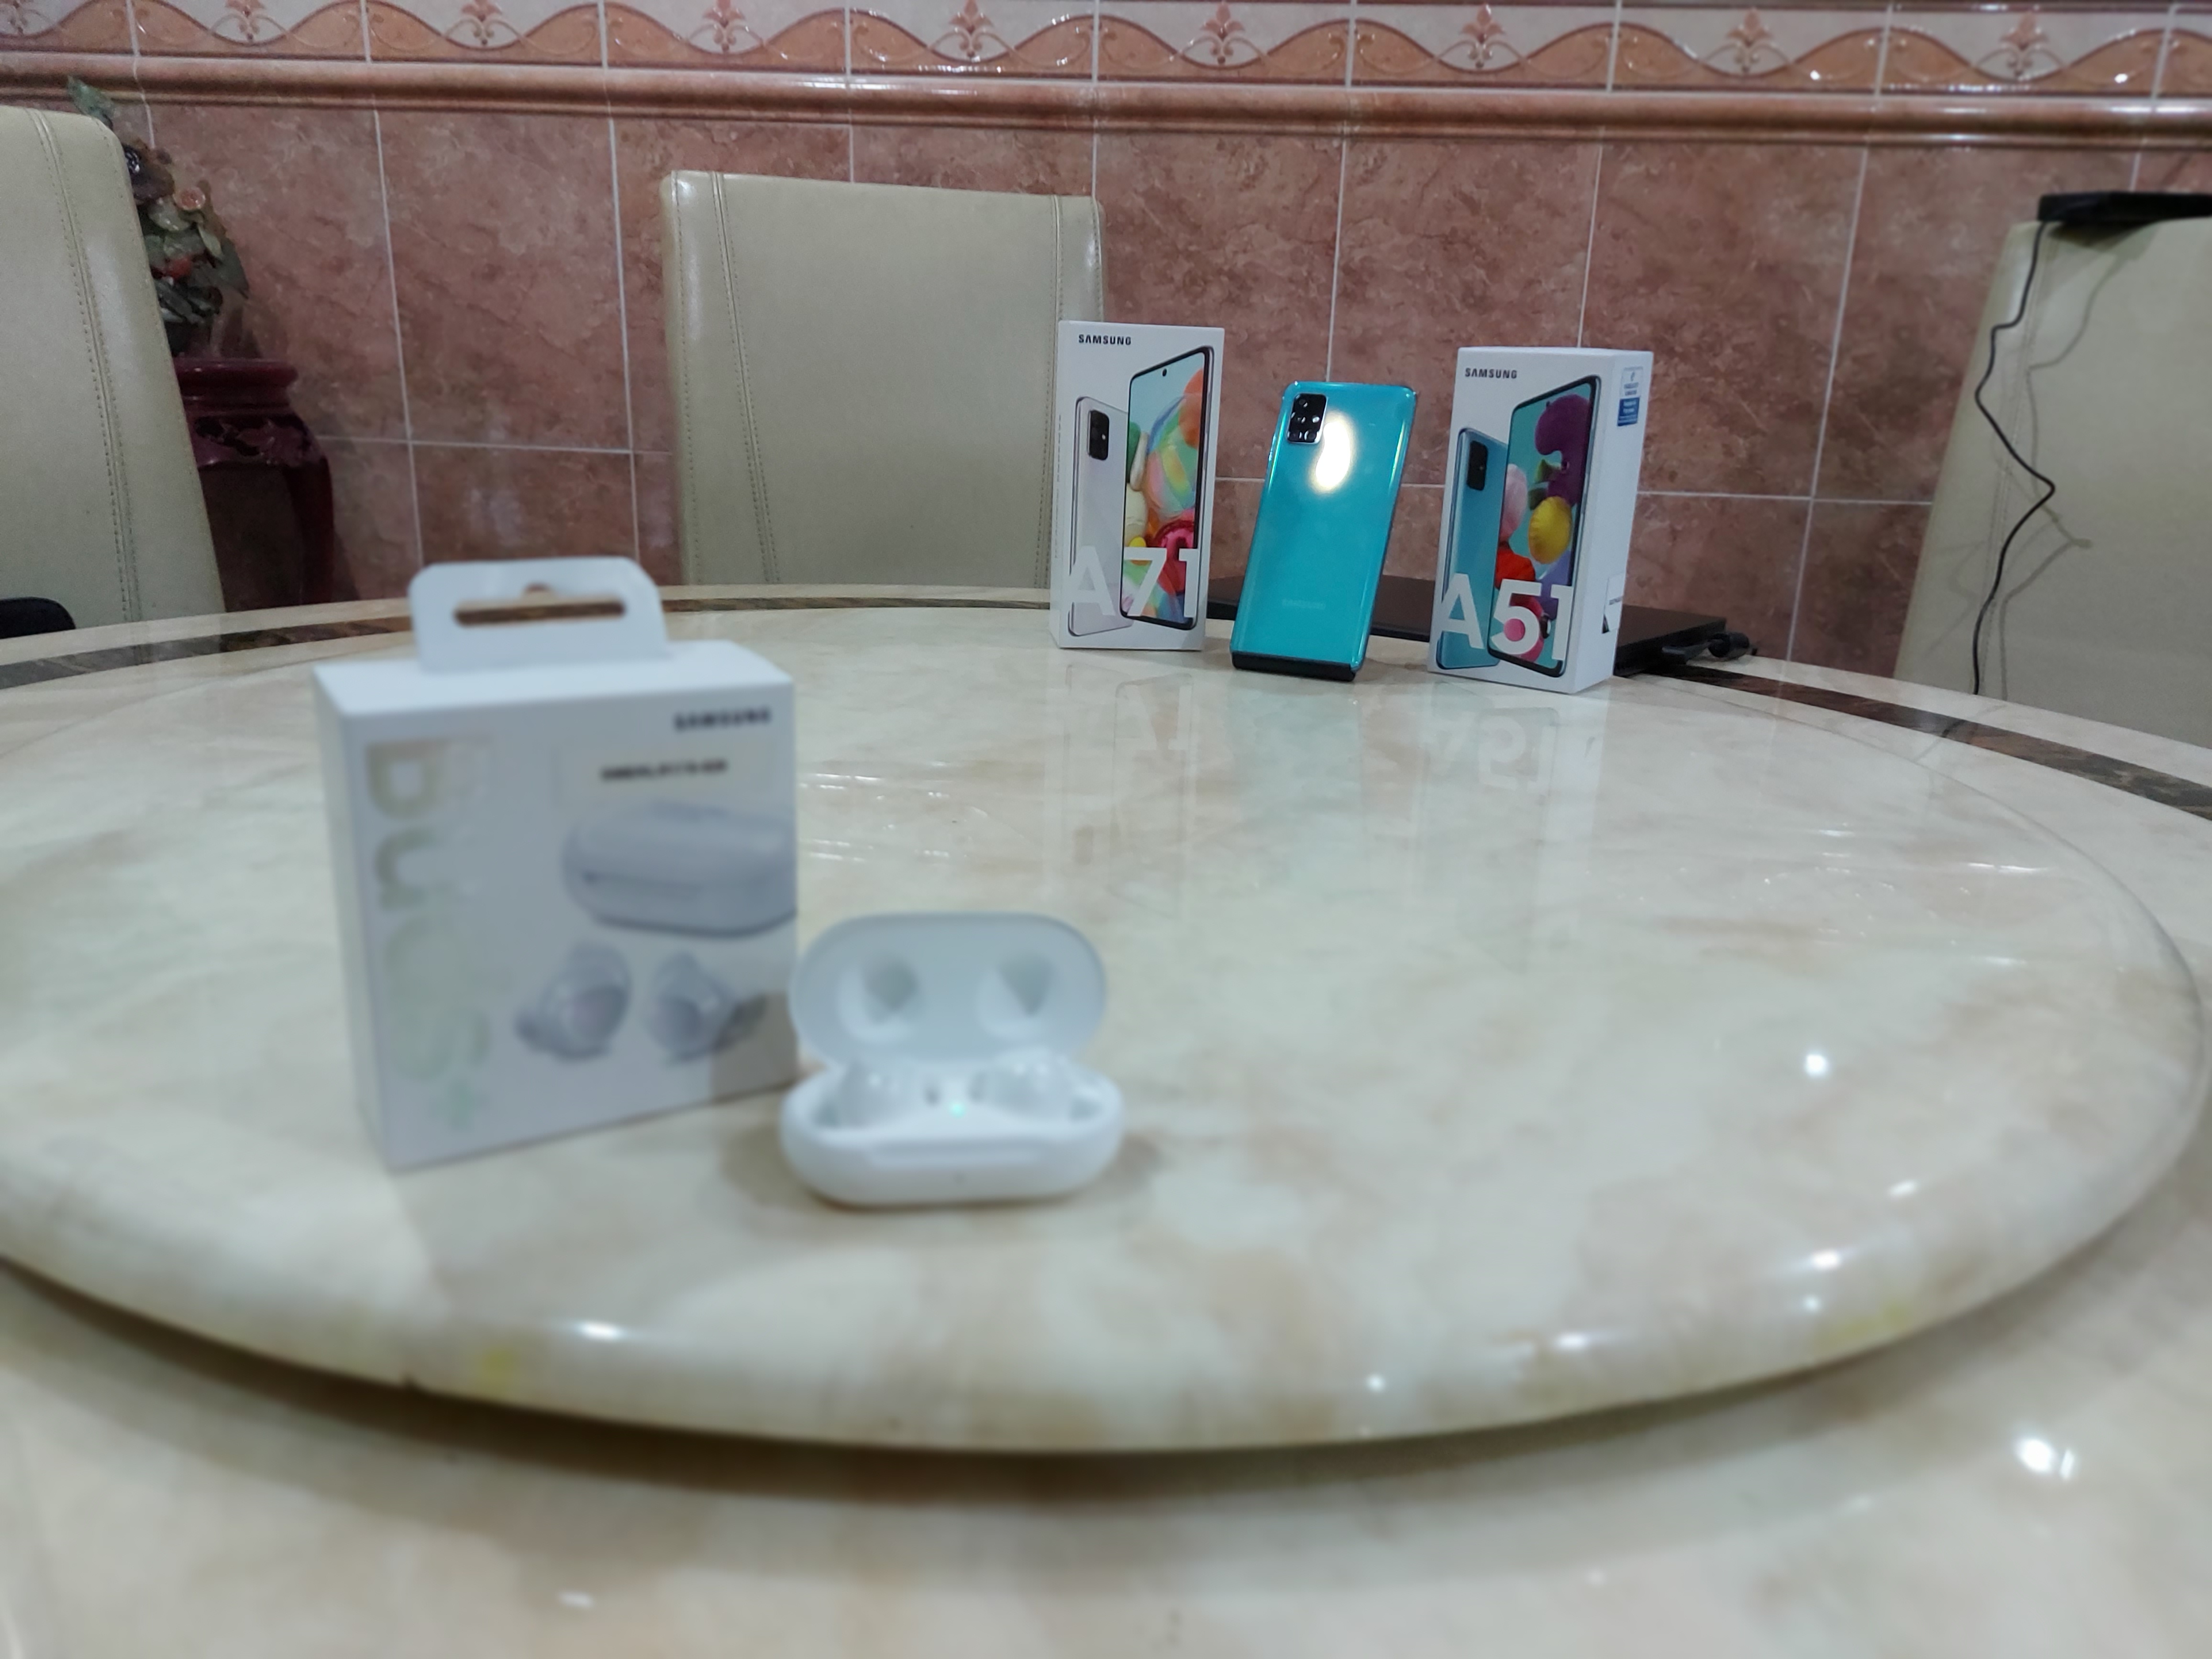
It also has a Live Focus mode where it focuses on the object and blurs out the background. It works well as long as the object in focus is large enough for the software to figure out between the object and background. The objects also have to be 1 to 1.5 meters away from the phone. You can also adjust the intensity of the background blur to give it a more realistic effect. Another cool effect is the super slow-motion option. This is cool, but it is very hard to use as the video clip that is recorded is not fully slow motion but only a few seconds between the clips.

Display

The Samsung Galaxy A71 comes with a Super AMOLED+ display. As with all Super AMOLED+ displays, the picture quality is crisp and sharp. However, my biggest gripe with the display is that the display is way too bright and using it in dark environments can be straining to the eyes even on the lowest brightness settings – and if you’re like me, you tend to be blinded when you’re on the phone in bed or turning it on first thing in the morning.

The screen is 6.7 inches with an 87.2% screen-to-body ratio and 393 pixels per inch. The bezels do not seem to be as thin or sensitive as my hands did not manage to accidentally touch or trigger it while still maintaining the look of having really thin bezels. The display is protected by Corning Gorilla Glass 3. This allowed the phone to hold up pretty well in my pocket which is usually cramped with my keys, keeping me worry free of accidentally scratching the screen. It does come with a thin plastic protector that has been taking all the beating from the keys. 

The irregular 20:9 aspect ratio on the Galaxy A71 makes watching videos is a weird mix. Most videos on YouTube are still at the aspect ratio of 16:9, thus users will get big black bars on the top and bottom the videos. Whereas most movies on the other hand would fit perfectly in the display as most cinematic aspect ratio is at 21:9, giving users a really immersive cinematic experience.

Gaming

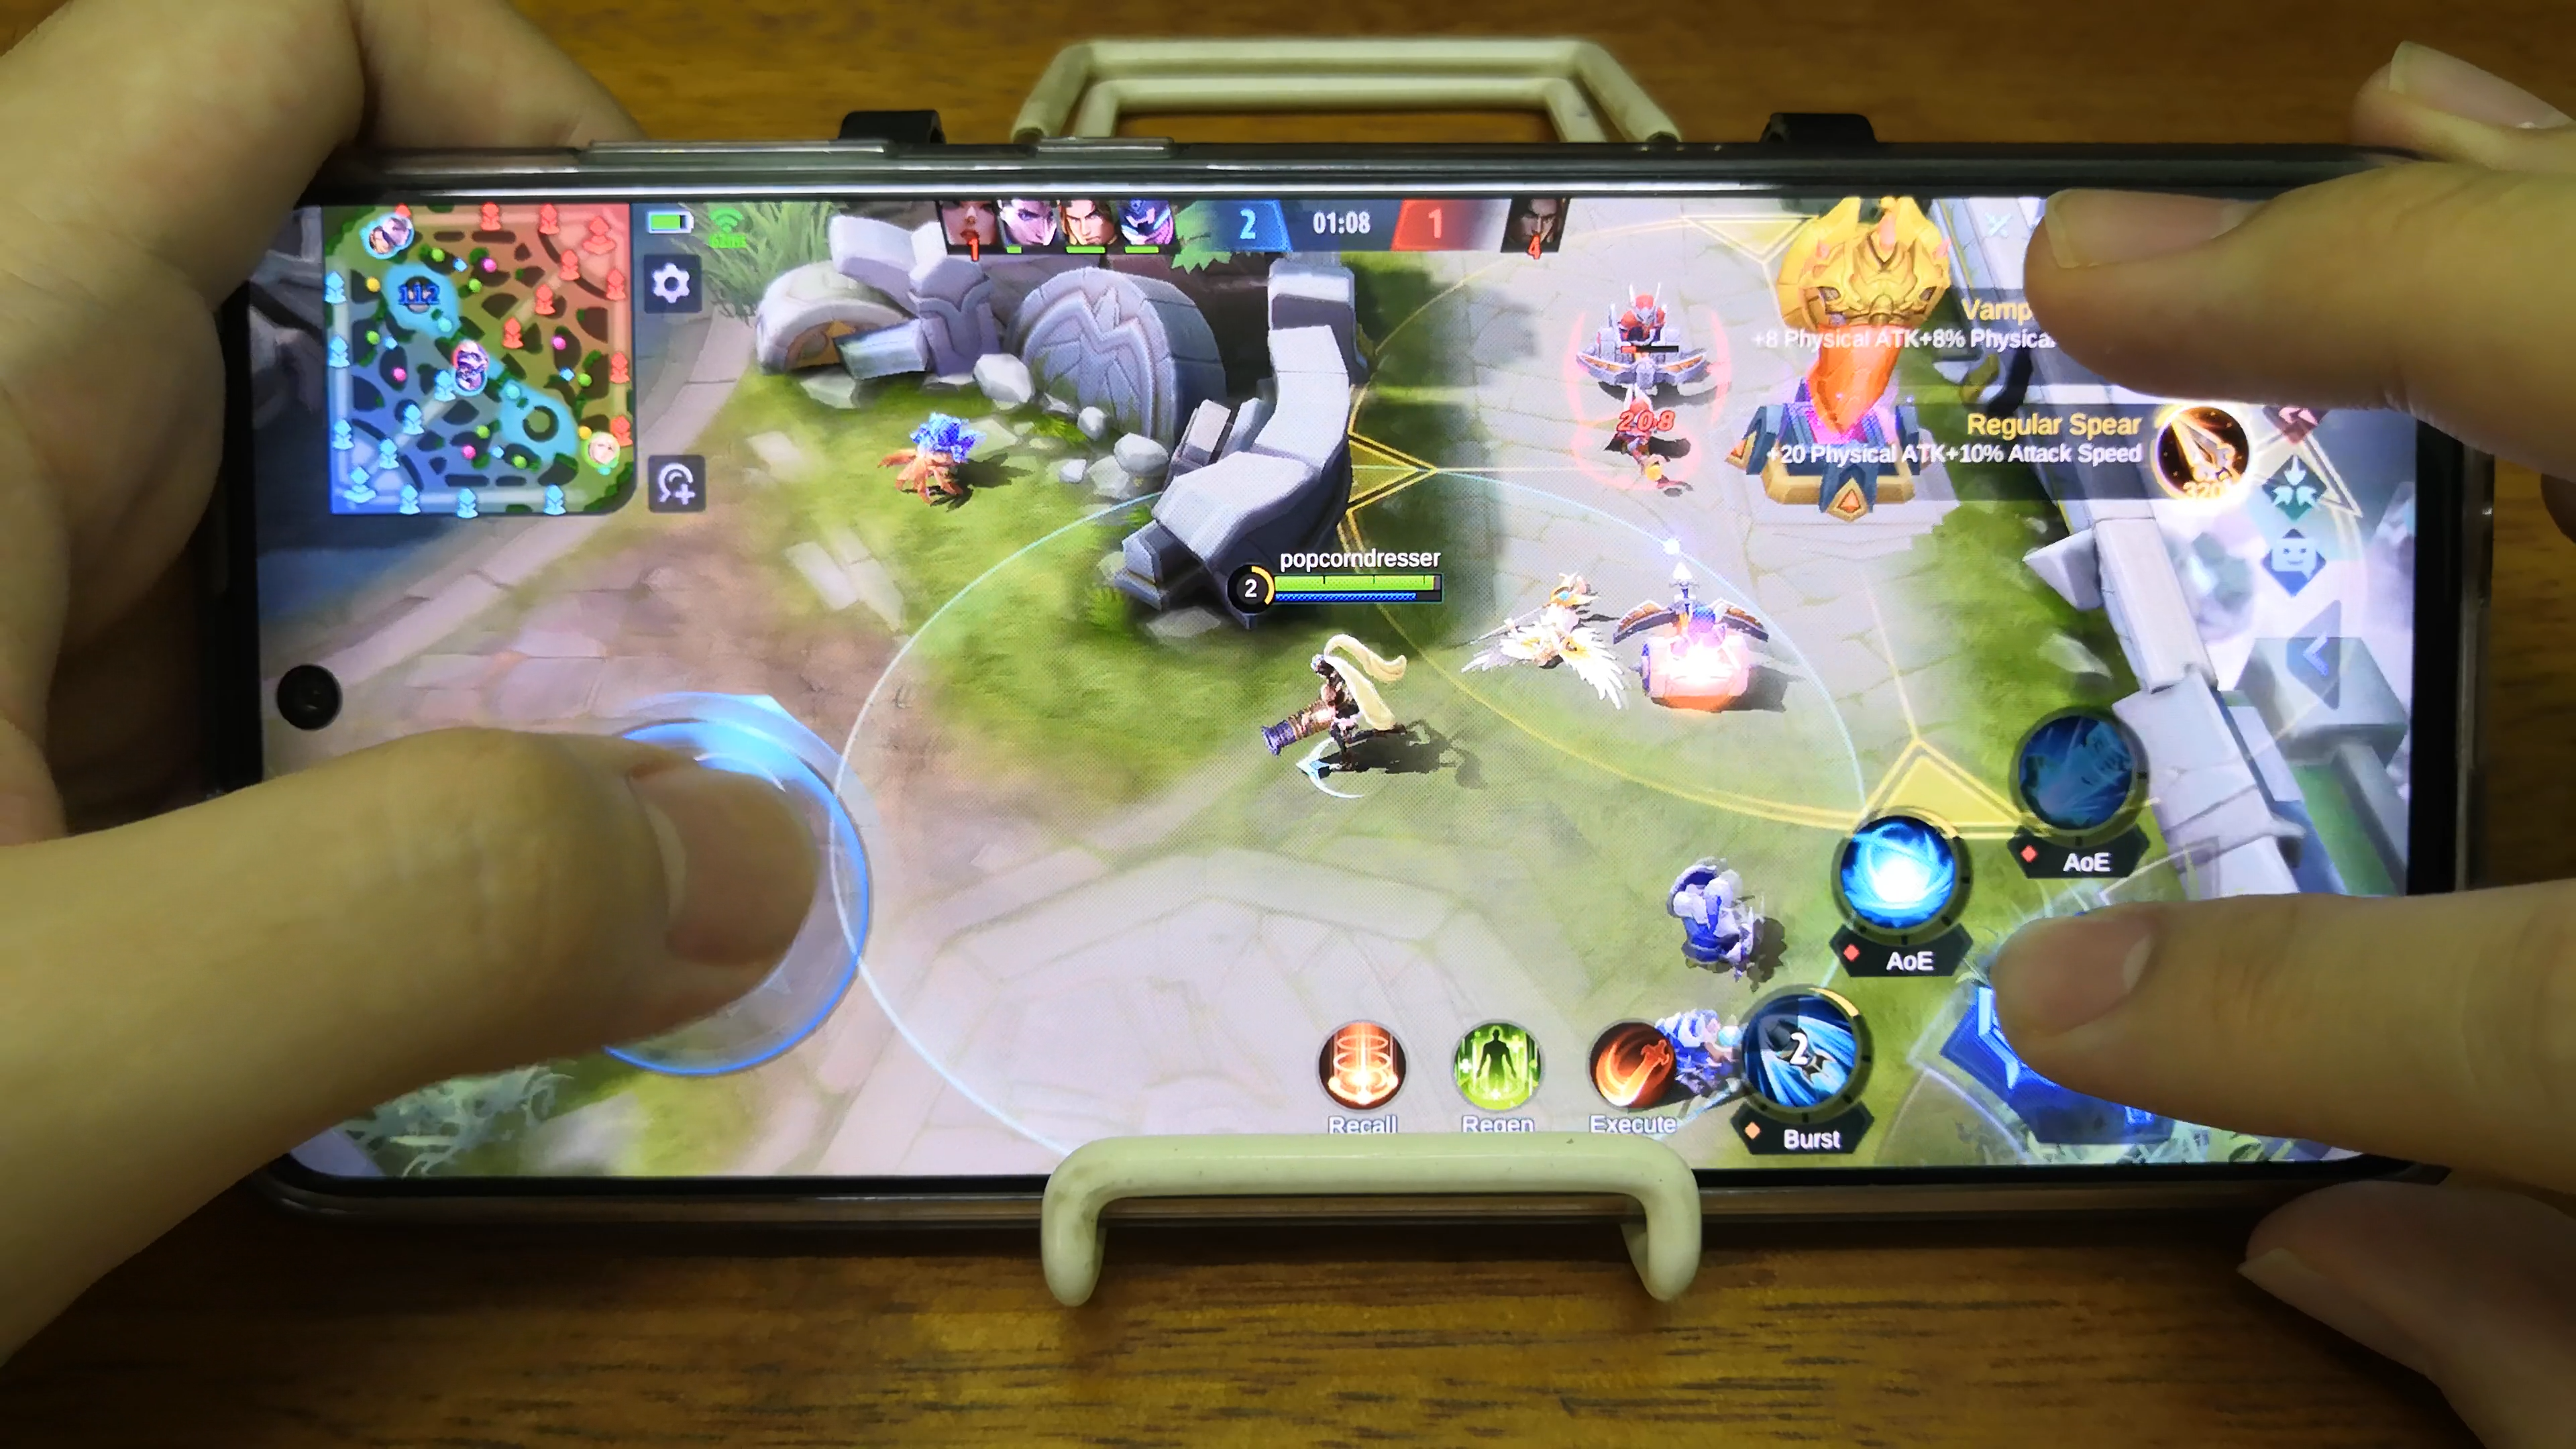
Gaming experience was smooth and I did not have many hiccups. Together with A71’s large screen estate, the controls do not get in the way which gives you a slight advantage. Software side, it automatically places games into full screen, or it blacks out the notification bar. I’m a little annoyed that I cannot choose if I want the game to take up the entire screen or have the notification bar blacked out as it is automatically decided by the system itself. That said, I, personally, prefer the notification bar blacked out as the camera punch hole doesn’t interrupt the display providing a more immersive experience. 

If you are gaming with the phone’s speakers it should not be a problem as it is loud and clear. But during gaming, your hand placement might accidentally block the speaker with your index finger and muffle out the sound. So keep that in mind or use headphones with the 3.5mm jack for the best gaming experience. Yeap, that’s right! The phone comes with a 3.5mm headphone jack. Praise the  jack lords! Headphone users rejoice! You can now have the most useful accessory back when you’re gaming! However, the wires can get in the way of holding your phone, it is still in an acceptable position as it does not strain your fingers to game.

Security and Privacy

To keep your phone safe and secure and have the convenience of unlocking the phone easily, there are two biometric ways to unlock the phone. There is face recognition and fingerprint. The face recognition works really well, it unlocks within seconds after waking the phone. 

But for the under-display fingerprint sensor, It is not as good as a physical mounted fingerprint sensor. The under display fingerprint sensor does not detect the fingerprints as fast. I found myself having to make multiple tries before it can finally be unlocked which makes you more dependent on facial recognition.

Battery

Waking up in the morning with only 20% battery life would cause one to panic but with the 25W fast charging of the A71, it can charge the phone to full capacity  slightly over an hour. The phone packs a pretty big battery with 4,500mAh that is ready to last you the entire day. However, being a mid-tier phone, it does not come with wireless charging capabilities and it charges with USB Type-C 2.0.

It actually surprised me how well the battery sustained throughout the day as I would scroll through social media aimlessly and launch games just to collect daily rewards. Even with all those activities by the end of the day I would still have around 25% to 30% of battery life, where I would just leave it throughout the night and when I wake up, it still has enough battery life to do other activities before really needing to charge it.

Software

The Galaxy A71 runs on Android 10 using Samsung’s OneUI 2.0. With the skin, it has various features that the bare android does not have. Even though OneUI 2.0 is heavily skinned, it brings along with it various conveniences such as our all time favourite dark theme, a more intuitive user interface in the camera app, Knox and even device care. There are also various tiny little details that you can configure on the phone to make it suit to your liking.

It does not seem to have an impact on the phone’s performance. The phone still runs smoothly and launches applications without any issue. With a third party skin the battery usually performs worse but Samsung has optimised OneUI 2.0 so well the battery performance barely takes a hit. 

Design

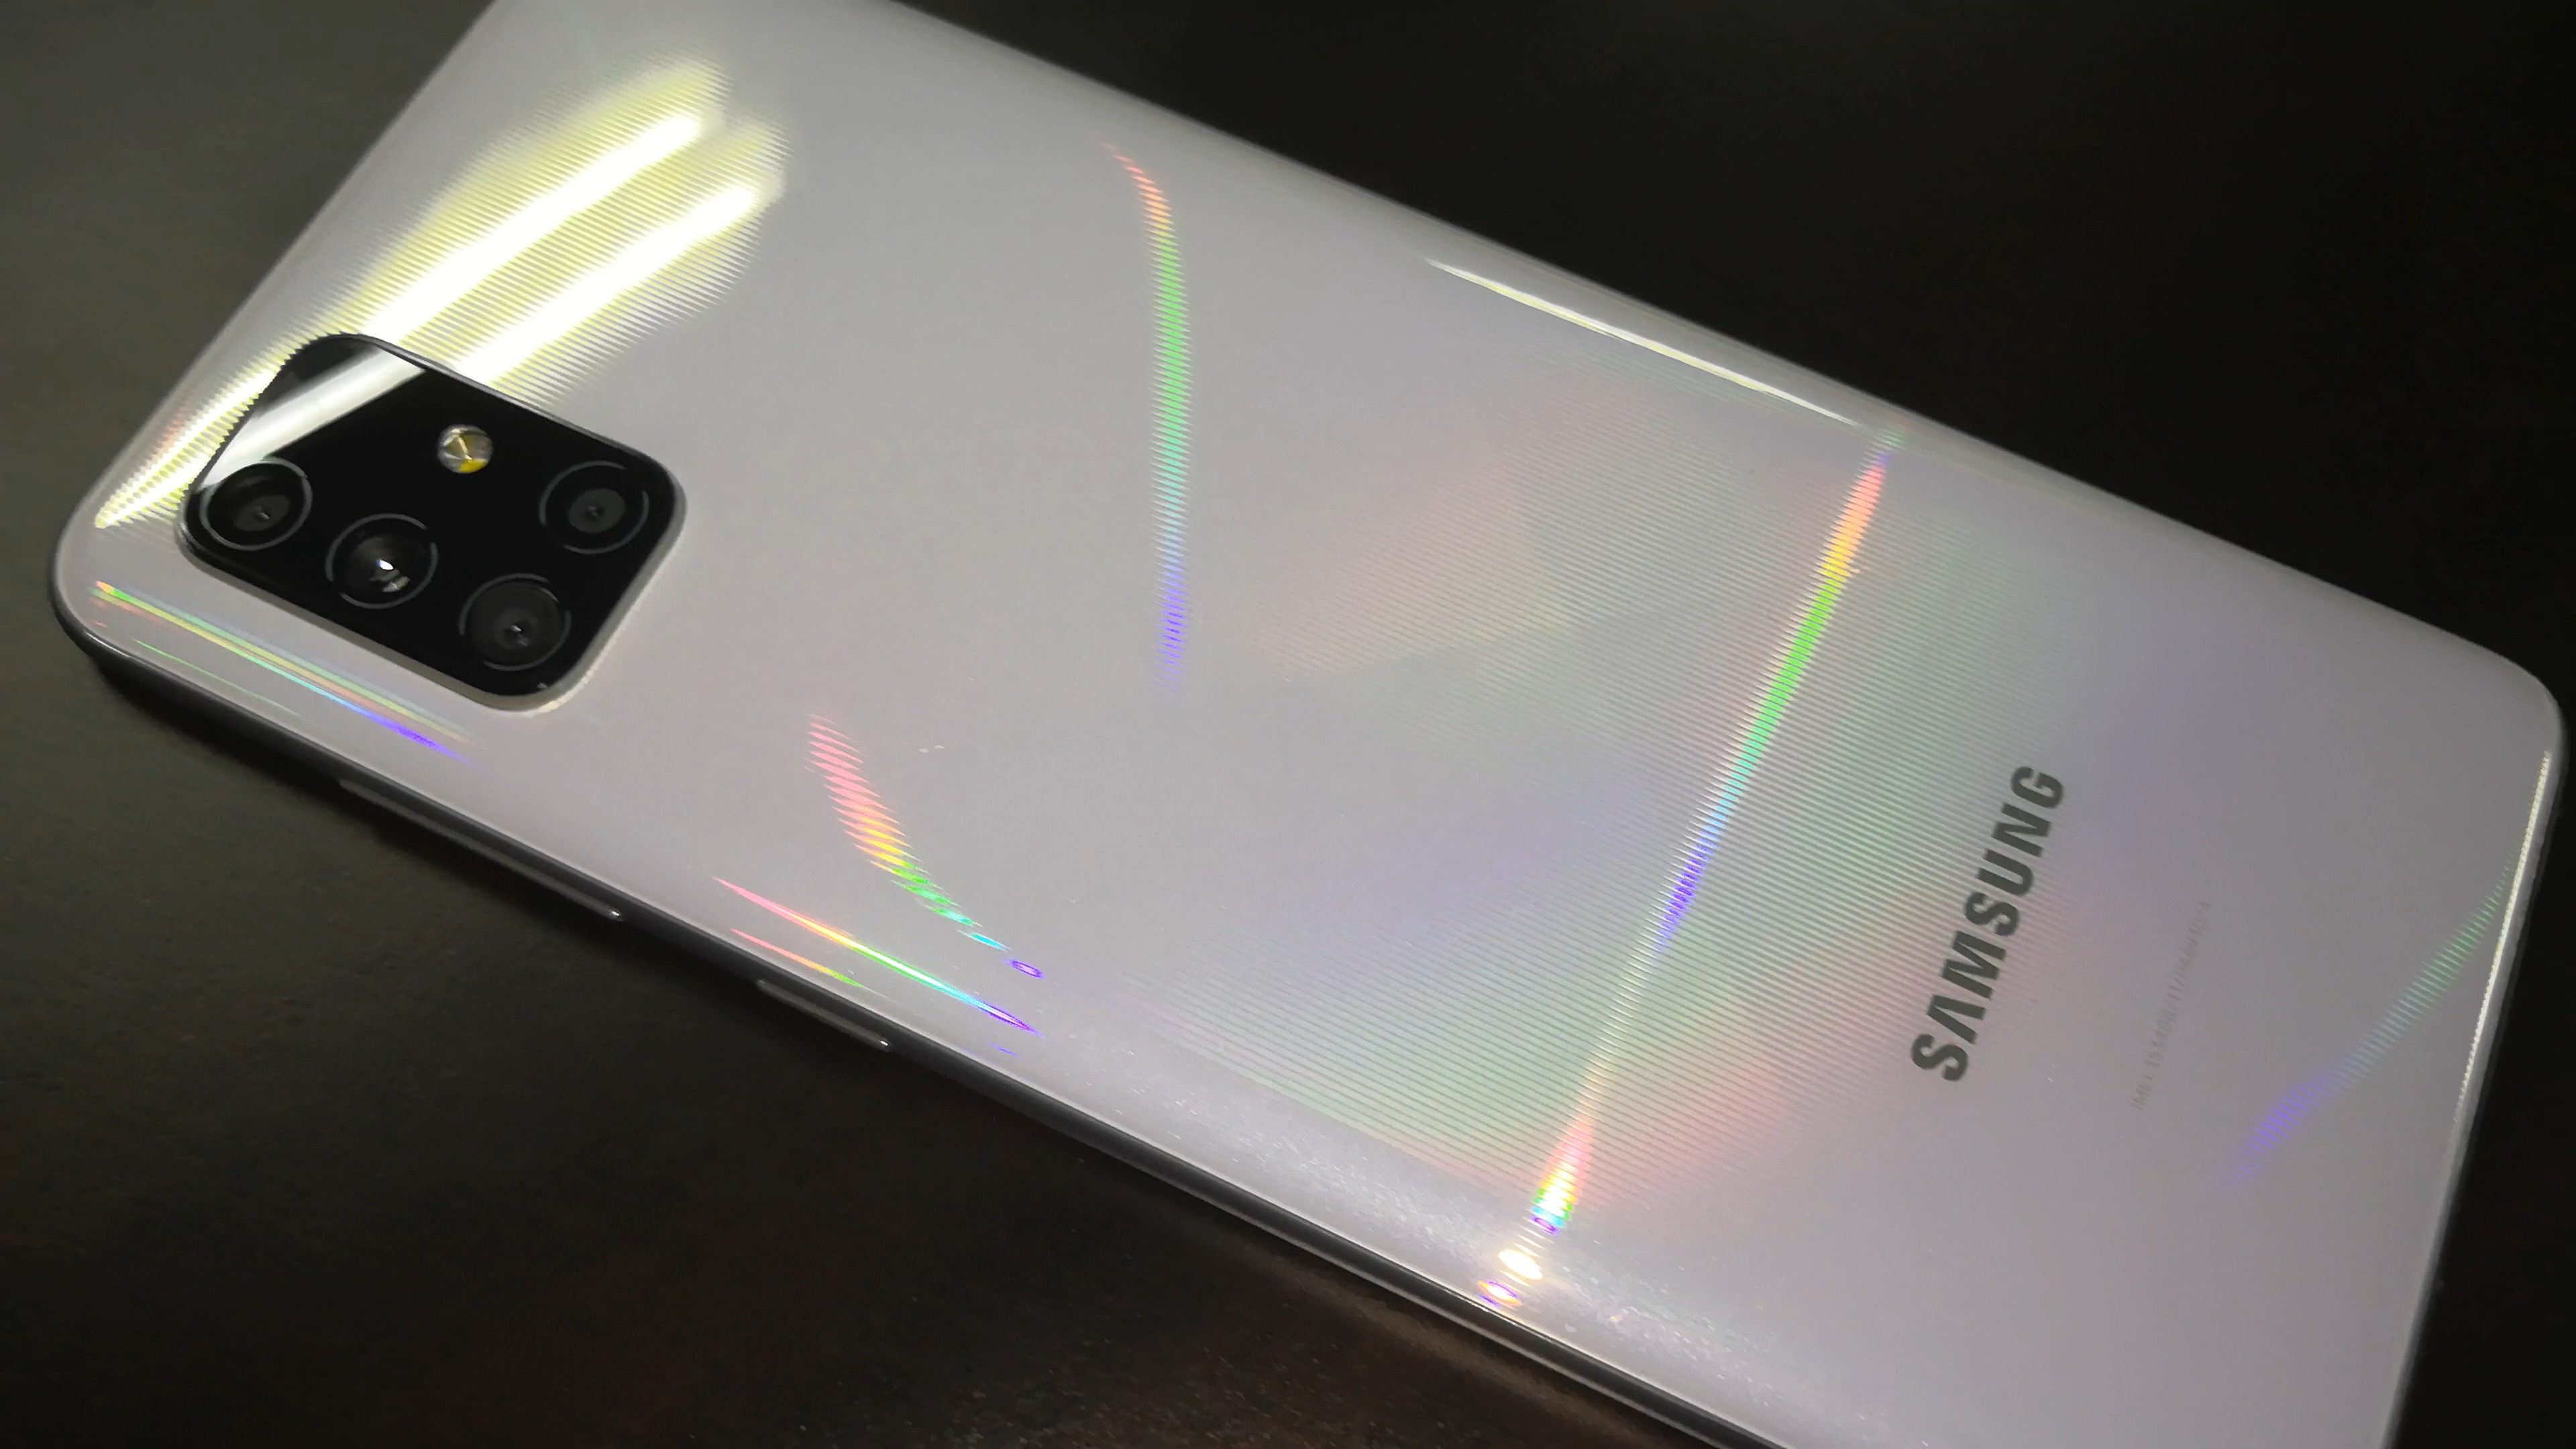
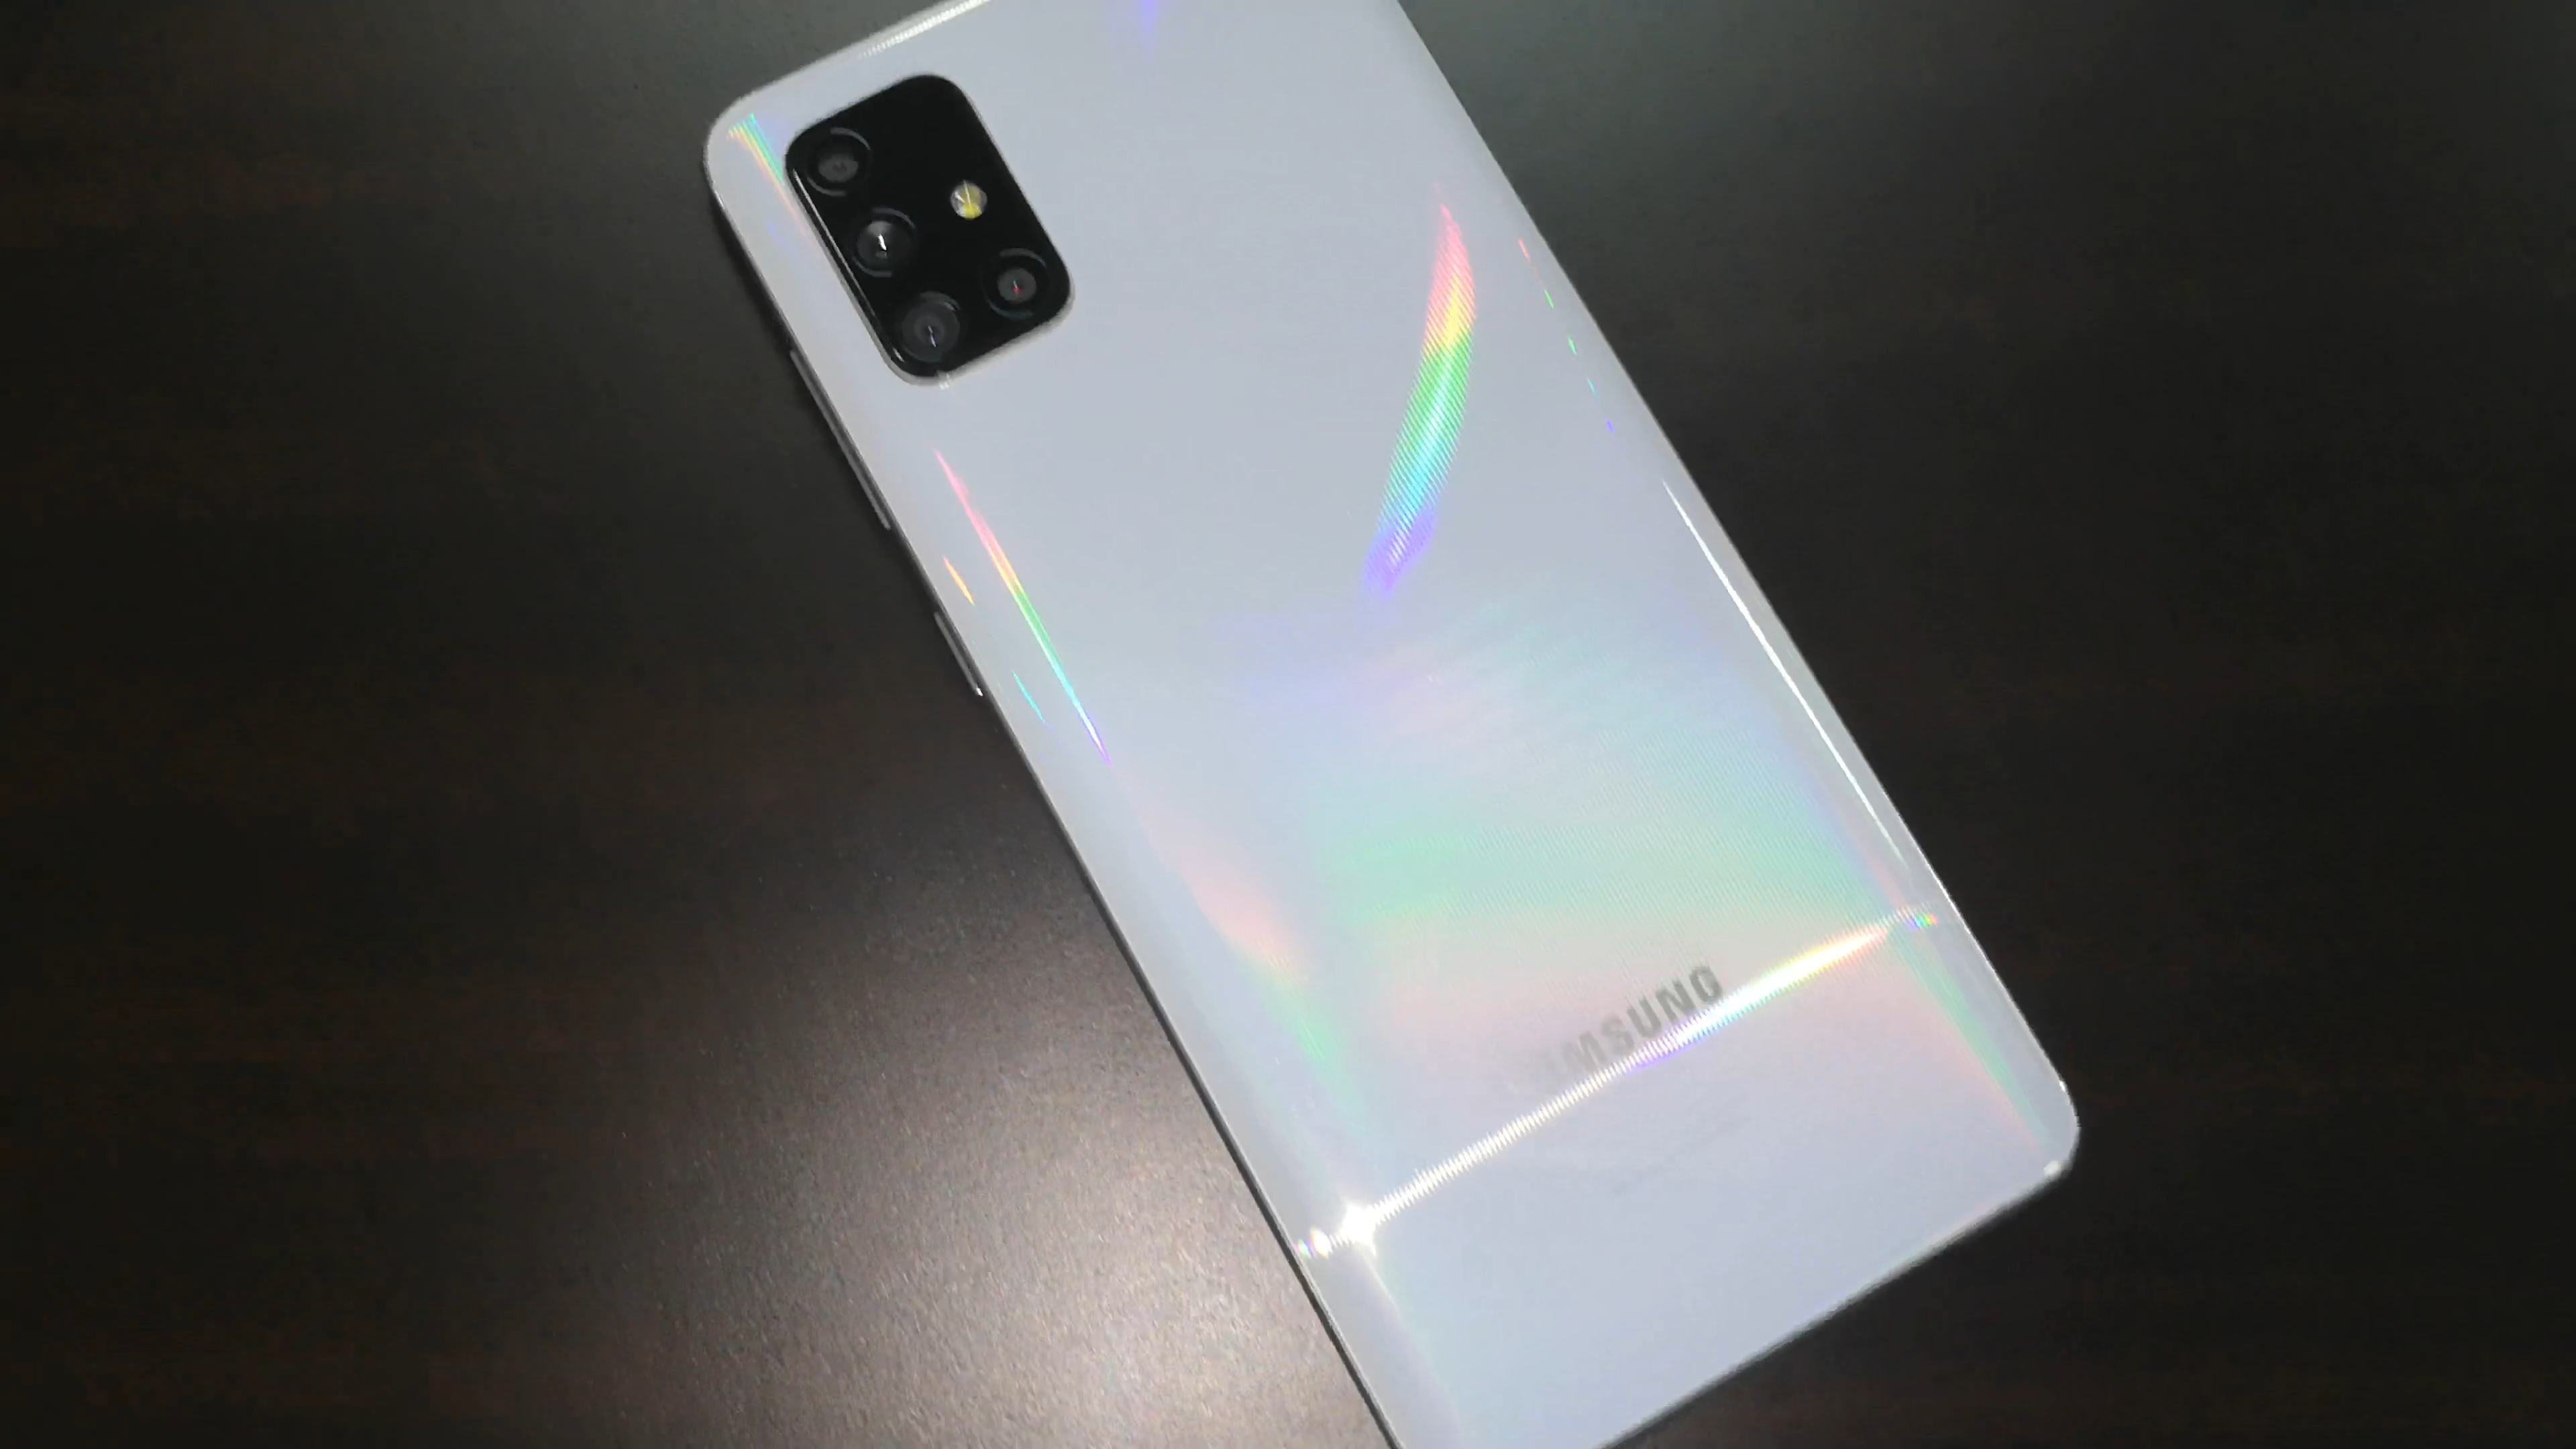
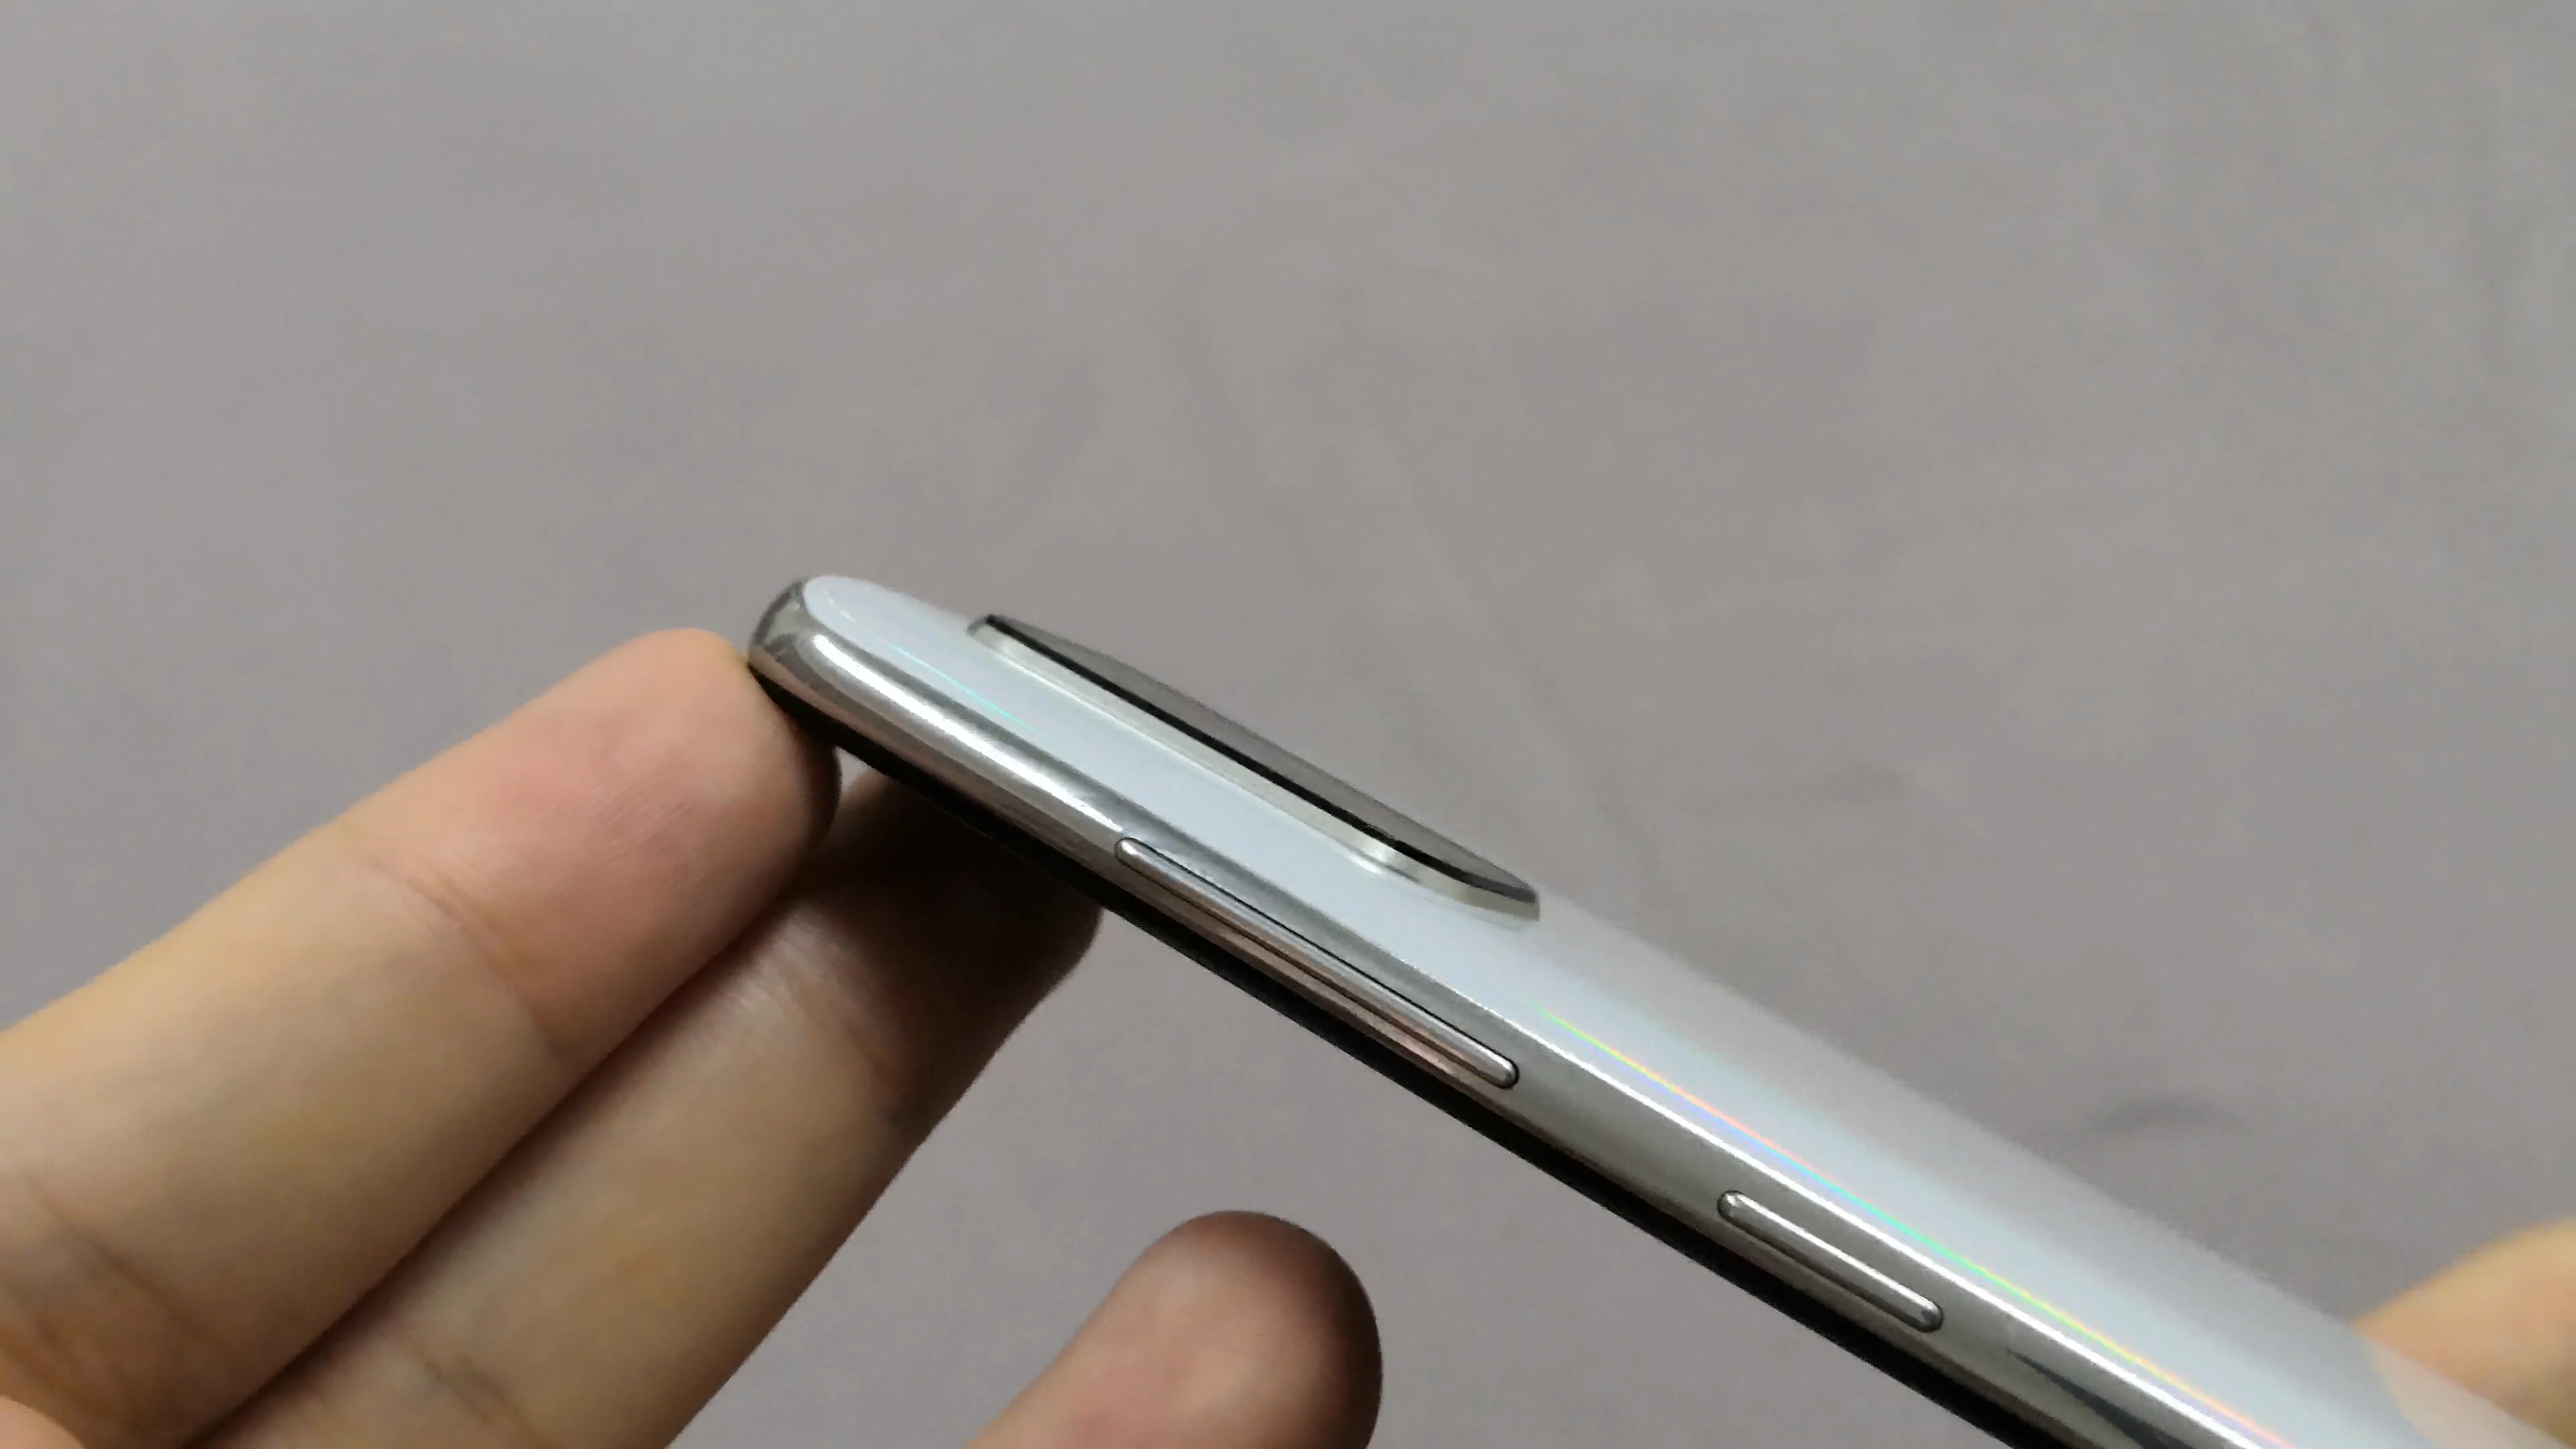
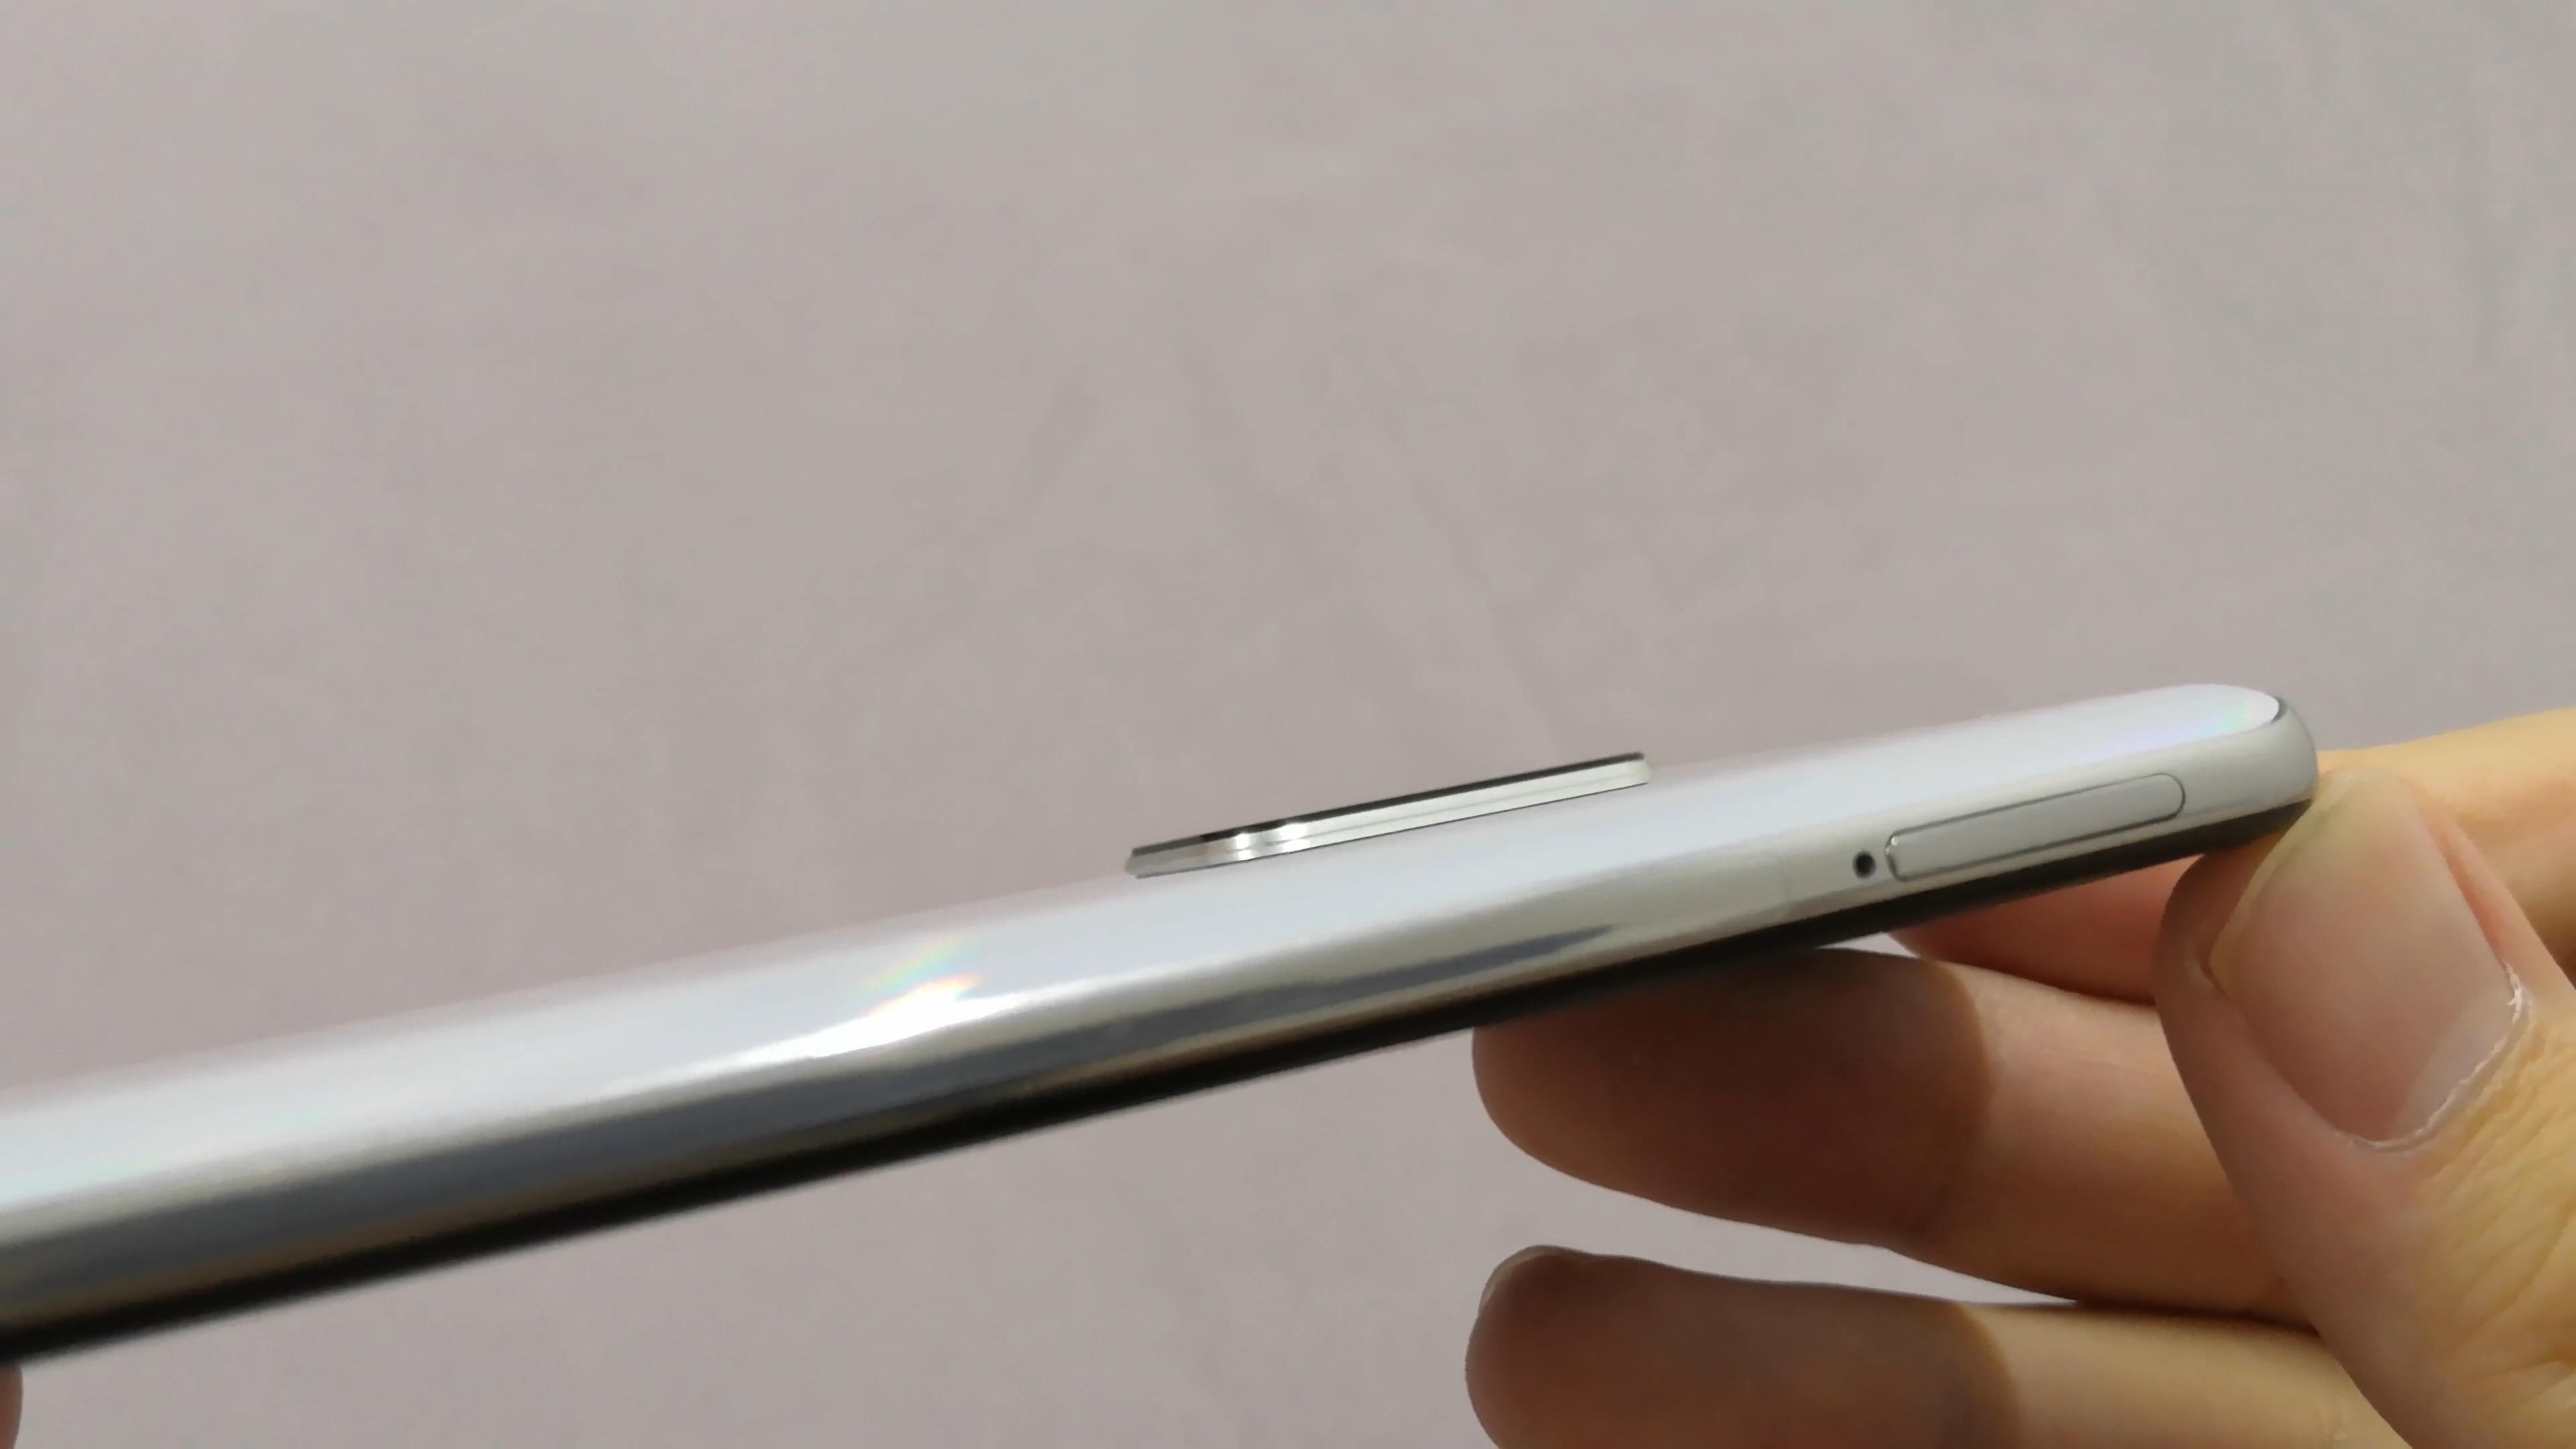
Last but not least, the design of the phone. Almost all of Samsung’s phones look alike this time around with Samsung’s new design language; Now with its now-signature bulky rectangular camera casing that is sticking out of the top right of its back. This has to be the single annoyance of any Samsung device but it has an easy fix that is to put on a case on the phone. Even the polyurethane (PU) case that comes in the box makes the camera bump more seamless and flush with the casing which makes it easier to fit into your pockets without it getting snagged onto anything.

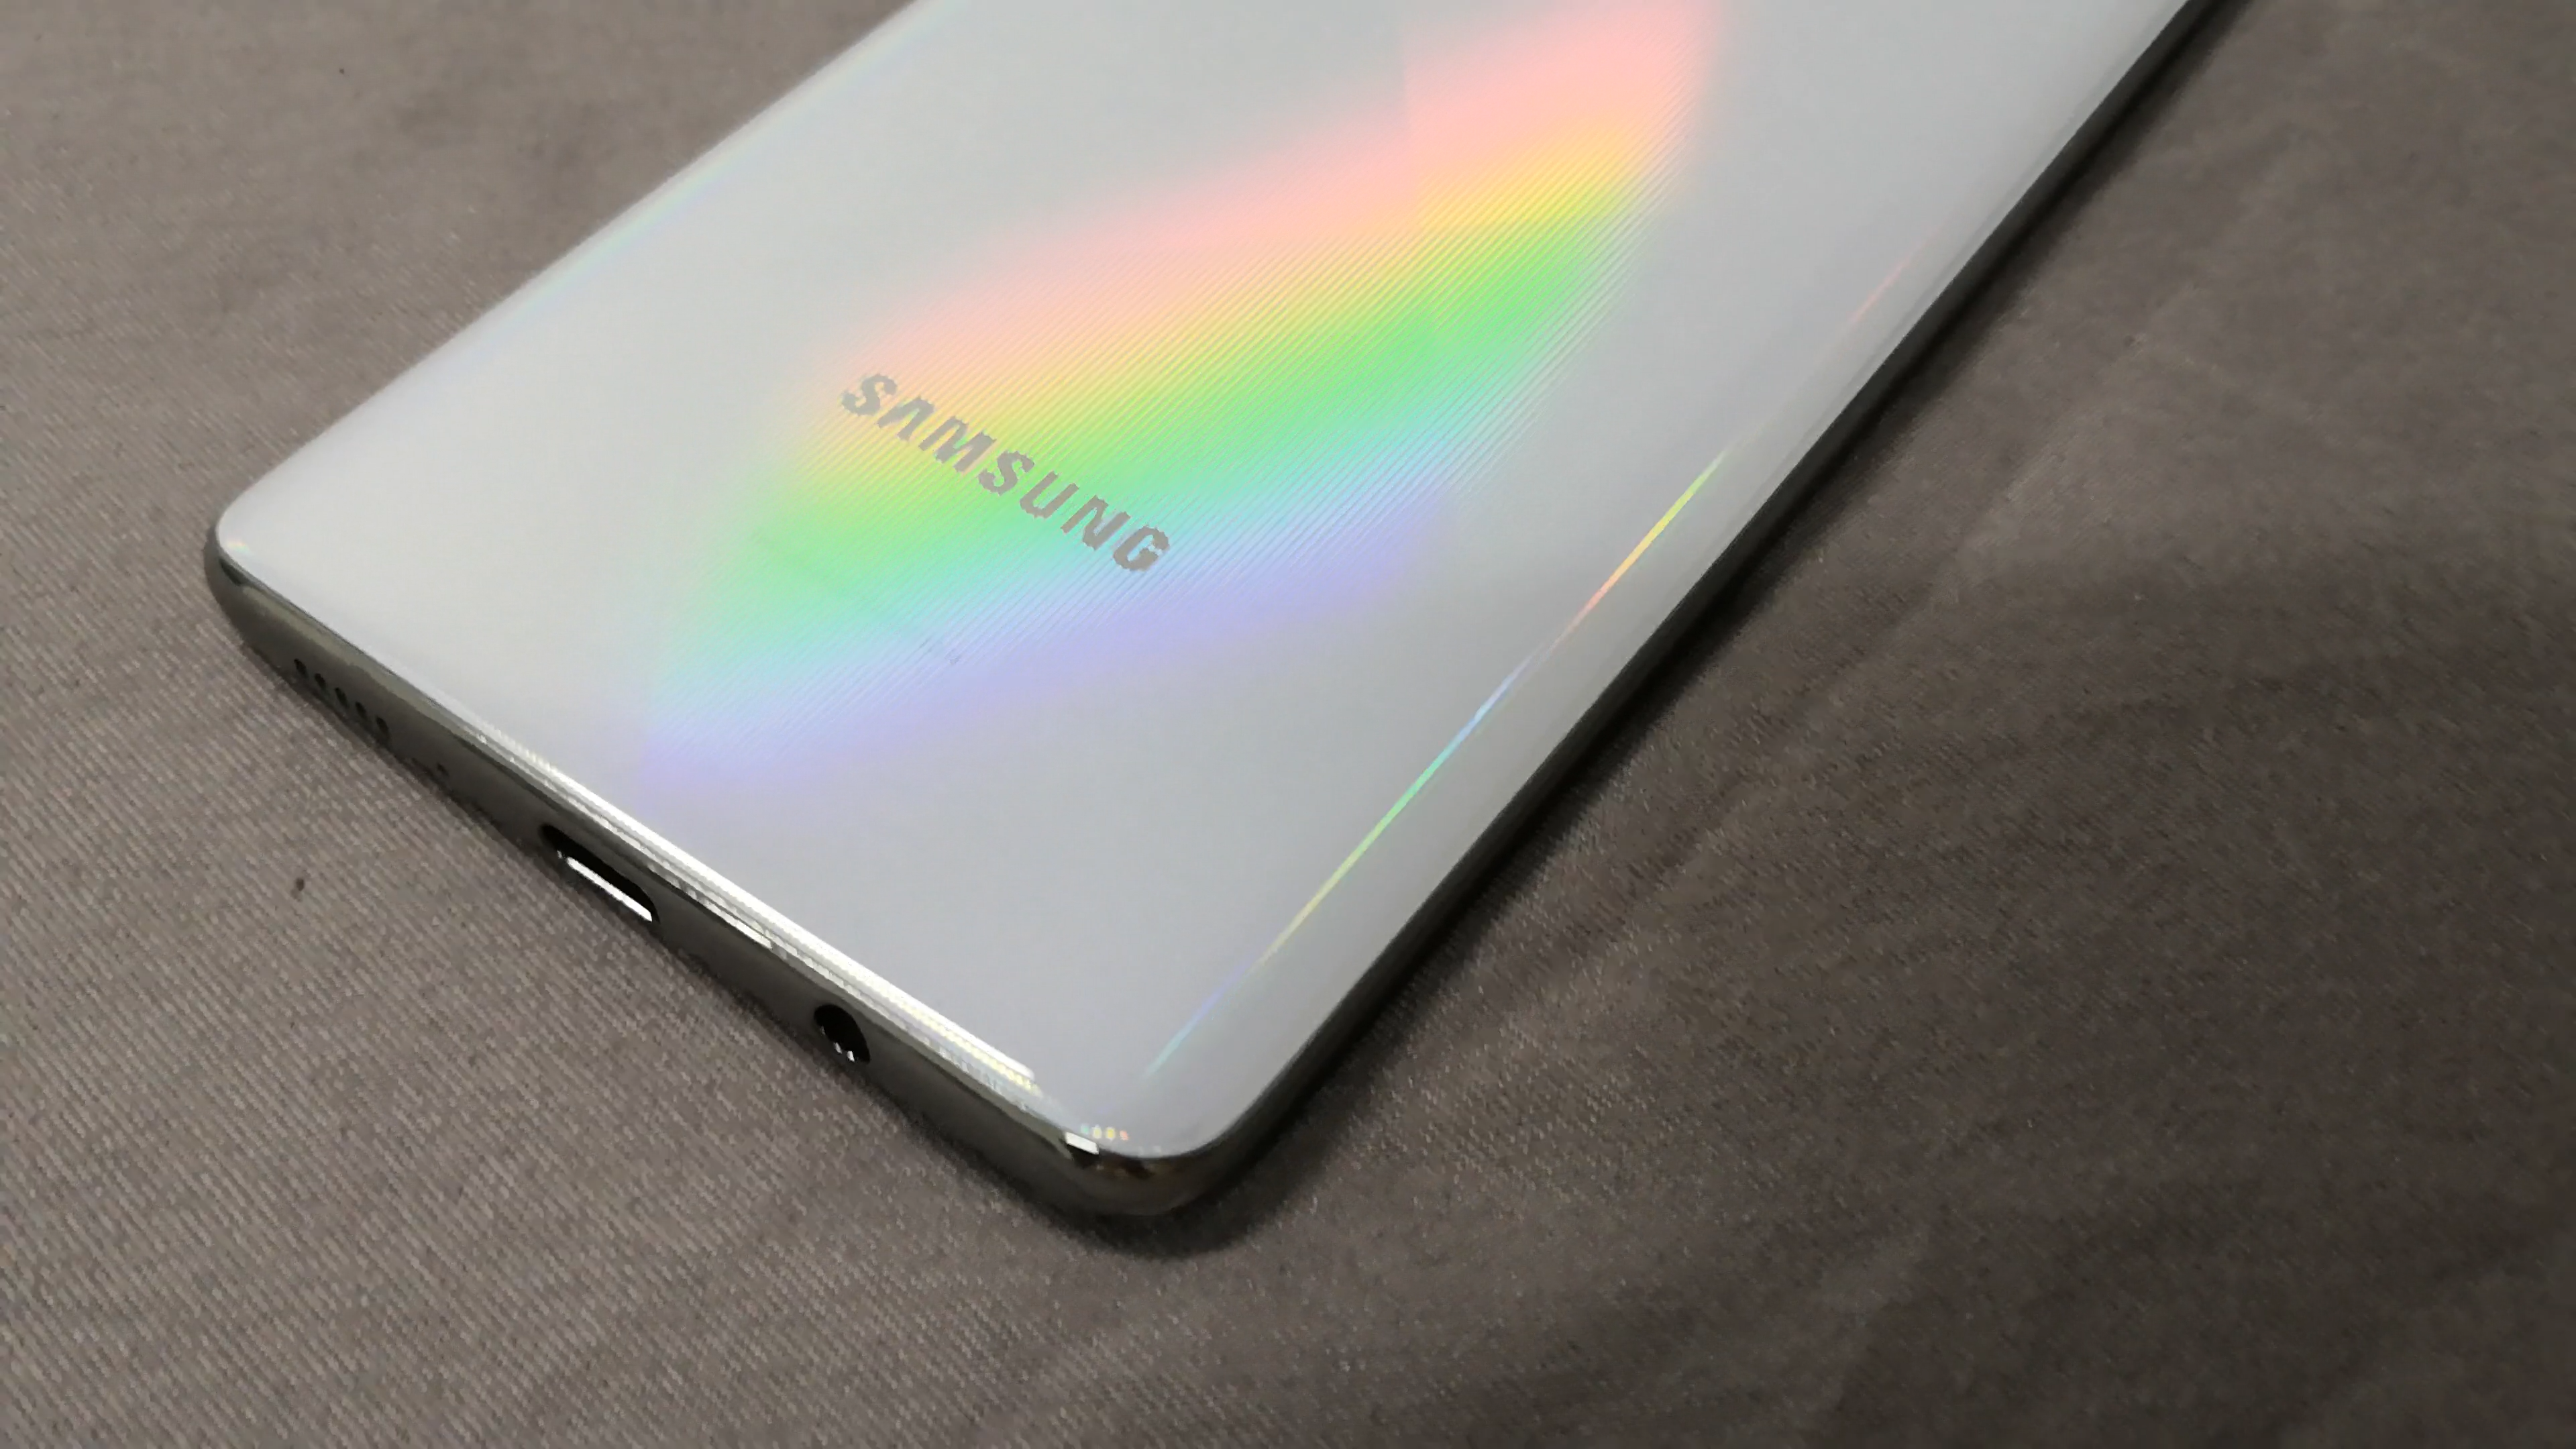
The A71 carries the same basic frame and back casing but it has its own unique flair and design to keep it different from the rest of the Samsung series. There is a slash and two strokes across the phone as its design pattern. The back does refract light to give you the effect of light breaking down, allowing you to see all of the shades of red, green, and blue hues on the back.

The phone is on the larger side but it still fits into your hands comfortably and, if you’re like me, one handed usage shouldn’t be a problem; although, people with smaller hands may have a slight issue. One design decision that I have a gripe with is the placement of the 3.5mm headphone jack. While I’m grateful for its inclusion, the headphone jack is placed on the bottom of the phone where the charging port is also located. You can’t use the earphones while keeping the phone upright. This also applies to using the phone while charging particularly if you’re in a video call. You’ll have to tip in on its head for things to work.

Affordability

Now comes the price, the phone is priced at RM1,799 which I believe is a very reasonable price for a mid range phone but a shocking price for what it is packing.  With all three of its Aw-Suh-m-ness, from its Super AMOLED+ screen that gives you clear and vibrant colours, a 64MP main camera that captures every detail to the inch, and battery life that will last you throughout the day leaving you worry free of battery anxiety. All these specs would have easily placed the A71 in a tier above with a hefty price tag. Plus a bonus with Samsung’s OneUI 2.0 software that enables customisation that makes that phone truly personal. All these goodies for only RM1,799?! Not only is it worth every penny, but it’s an absolute steal, especially when it’s a Samsung!

Final Thoughts

Personally, I think it’s a phone that you should definitely get. For its specification and its price tag this is perfect for someone who is constantly on the phone who needs battery power that can survive the endless scrolling or gaming throughout the day. This is a perfect daily driver for you if you . As mentioned above, the Galaxy A71’s specifications and performance definitely matches its price tag, and dare I say it would still be worth even if it was higher. But, if you are someone who prioritizes the camera and picture quality, then the Note10 Lite and S10 Lite would be a better choice for you. It may come with a lower megapixel sensor but the picture processing is so much better with less noise, better colour and texture right off the bat. 
Alienware Unveils New Gaming Keyboard

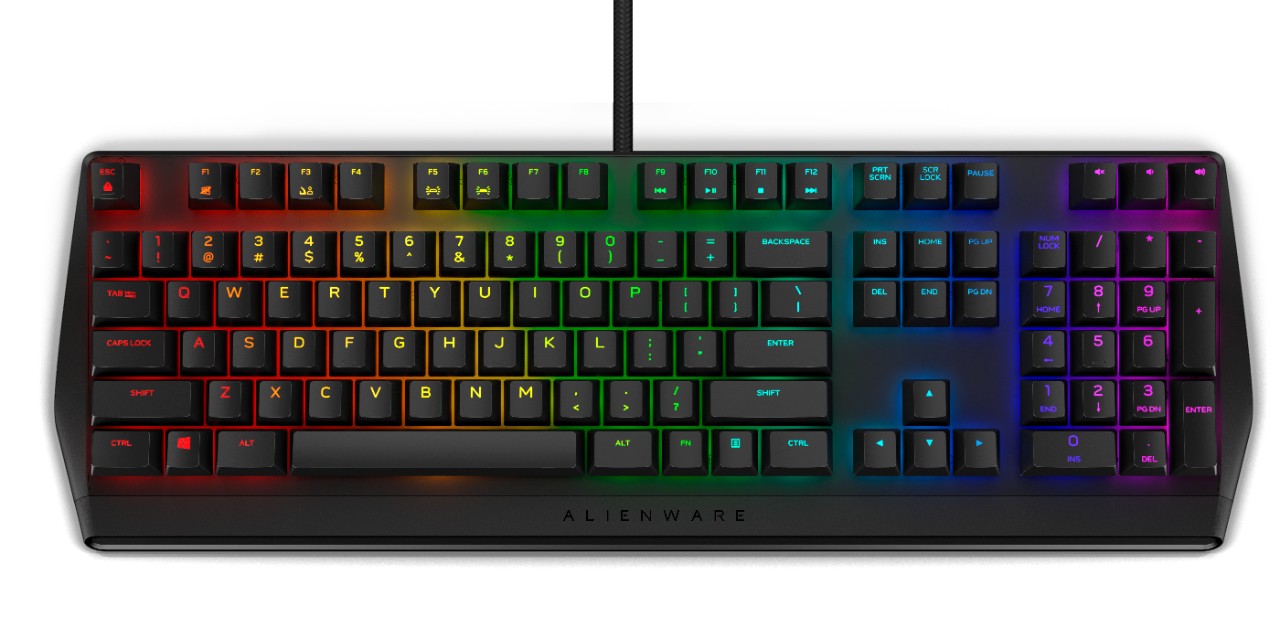
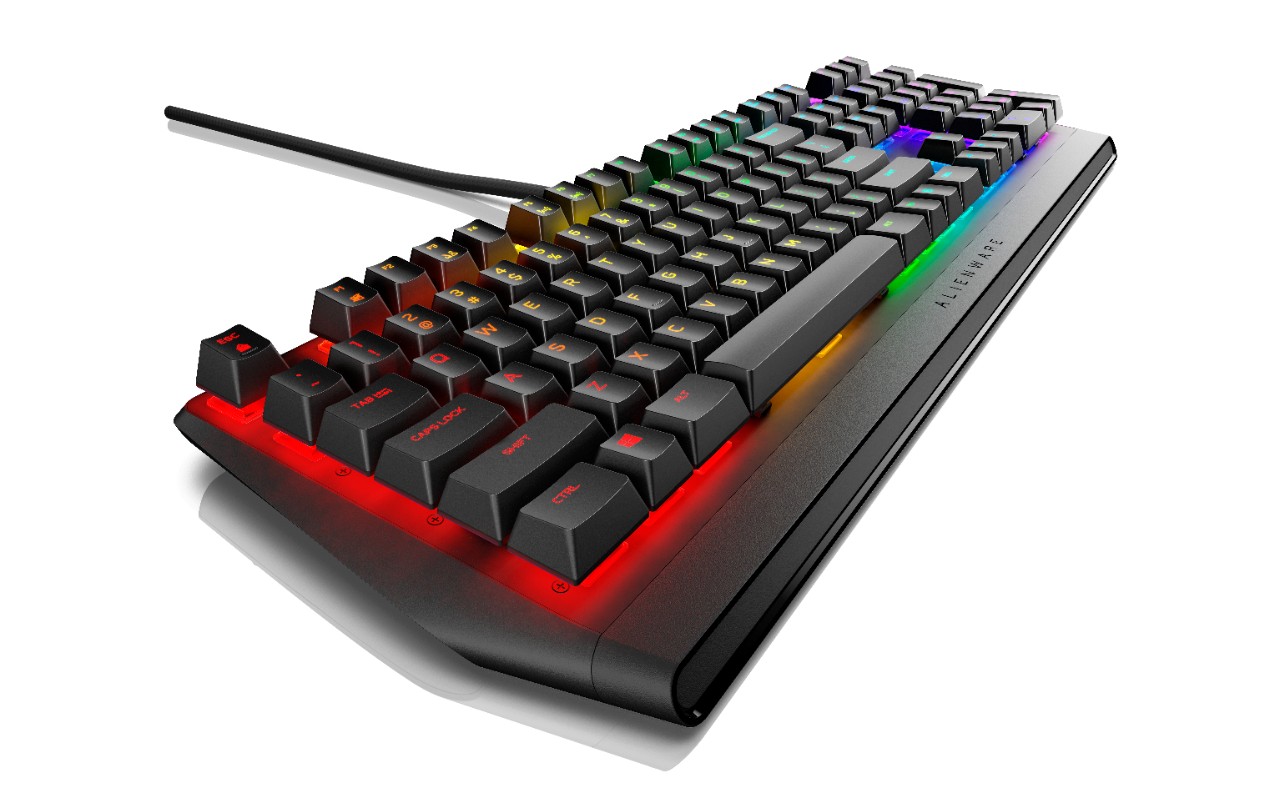
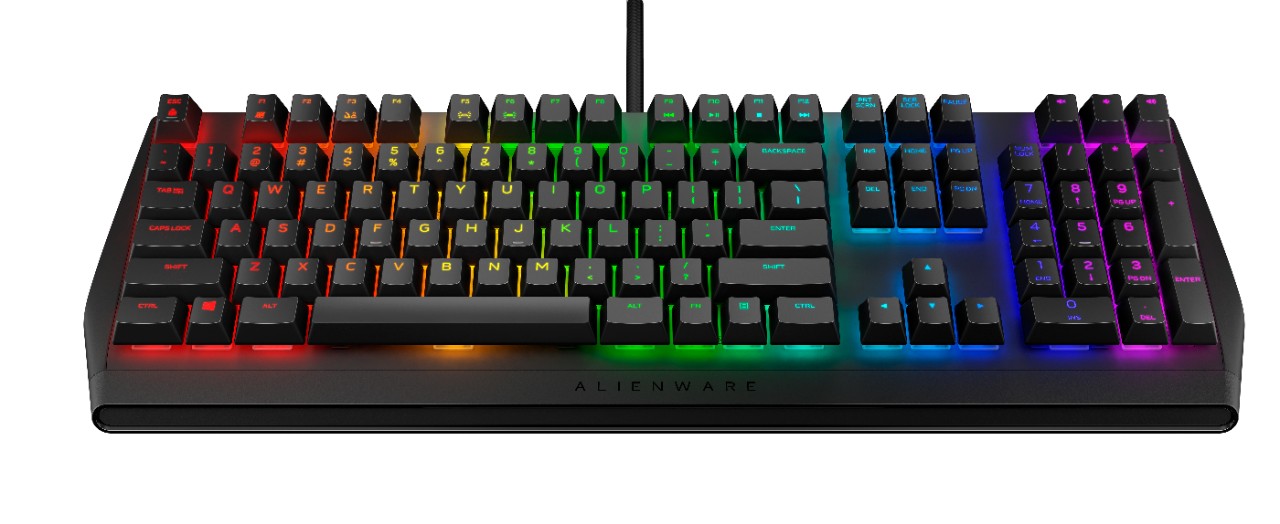
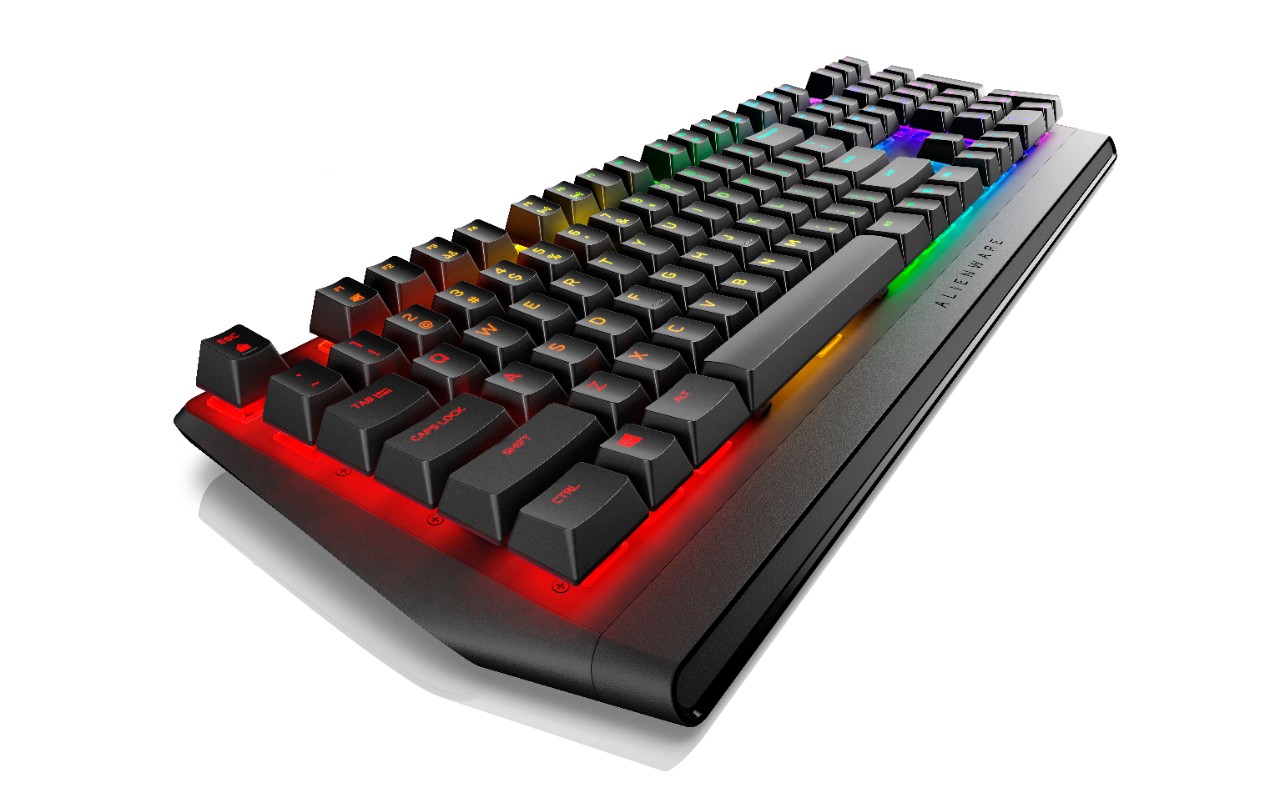
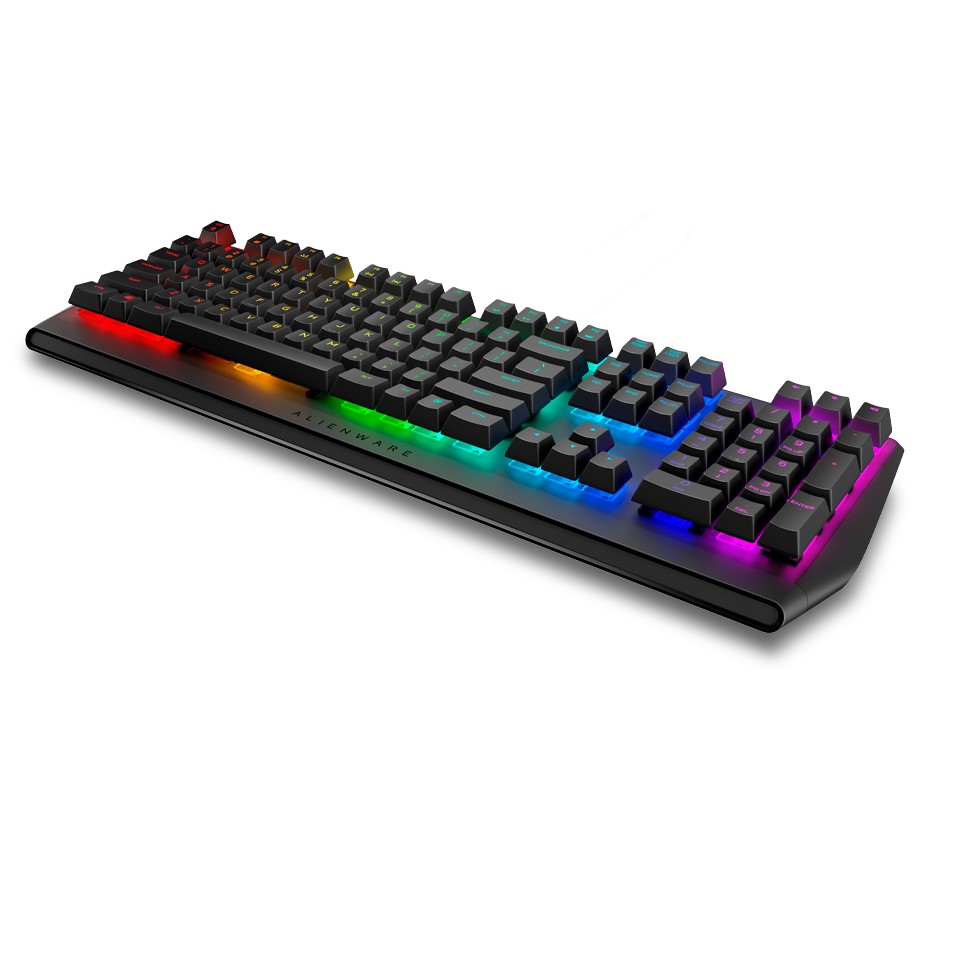
Alienware has become a really well known brand for their many offerings in the gaming space; ranging from laptops to desktops and even monitors and headphones, the brand has all their bases covered when it comes to the gamer’s experience. Well, all except one: gaming keyboards. That changes with the announcement of their new gaming keyboard: the Alienware RGB Mechanical Gaming Keyboard.

The new keyboard comes equipped with Cherry MX Brown switches which provide the optimal amount of travel for both productivity and gaming. It also strikes a unique balance between providing enough tactile feedback and keeping things quiet while players game or type.

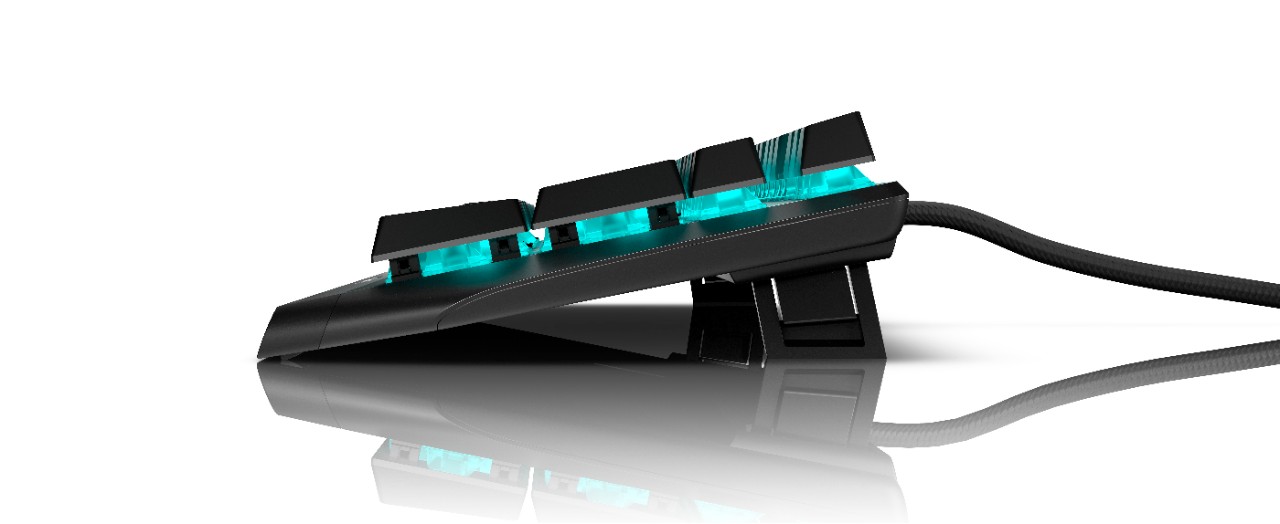
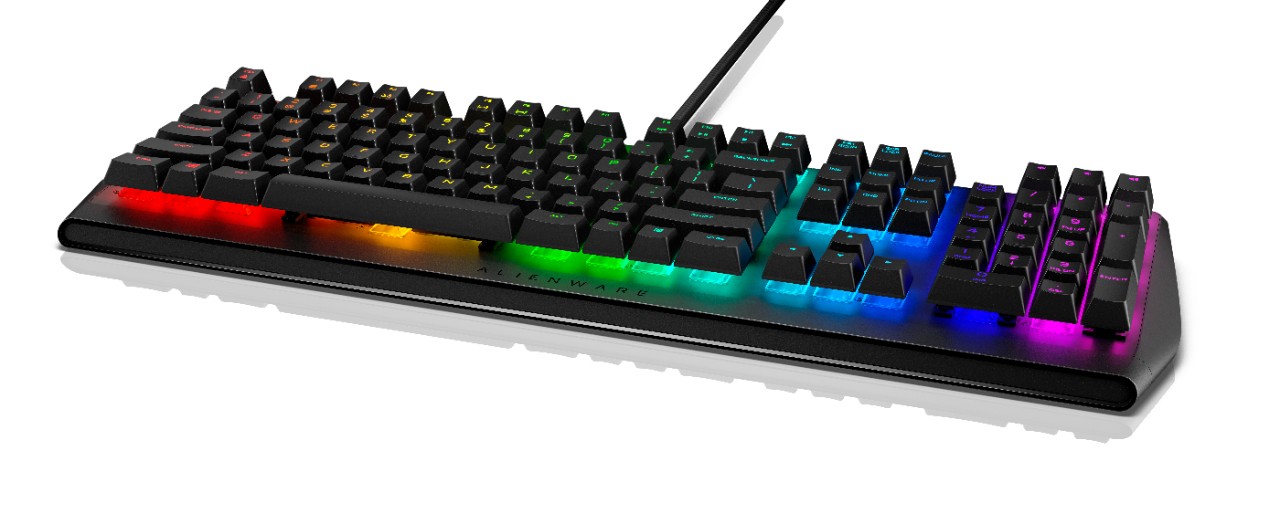
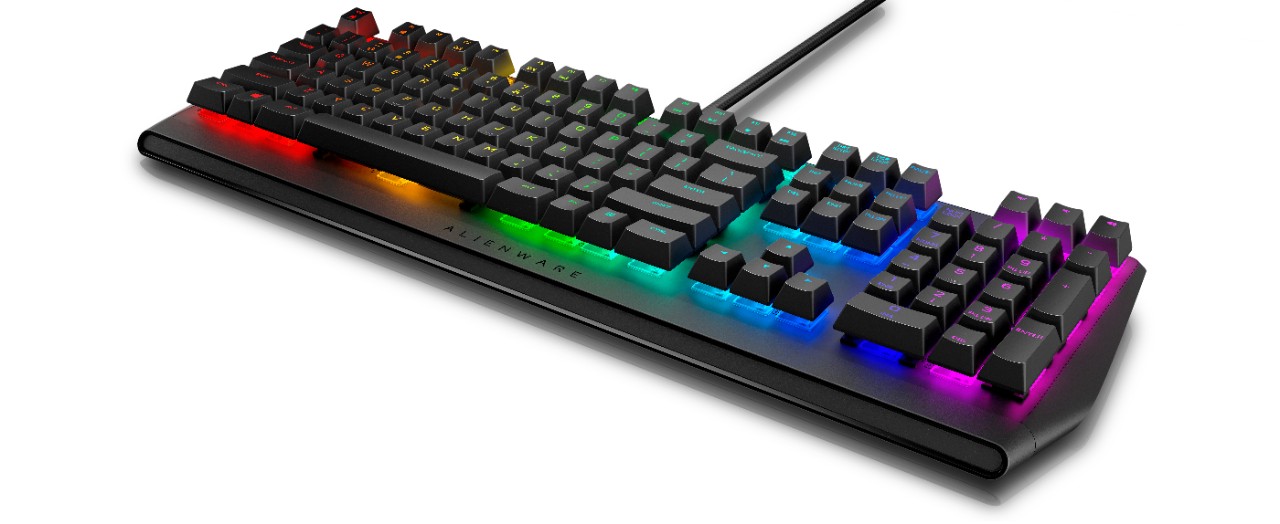
The Alienware keyboard comes with fully programmable keys which allow gamers to program their own, customized macros and personalised key assignments via their Alienware Command Centre. Need a little more customisation? The keyboard comes with AlienFX per key lighting which allows you to customise your key backlight colour from a choice of 16.8 million colours for a bespoke keyboard which is uniquely you. It also has 3 height adjustments to allow for greater comfort when typing and gaming.

It’s a fully metal keyboard with floating keys atop. This allows users to better clean and maintain their keyboards to optimal usability and comfort. It comes equipped with a USB passthrough which allows easy access to USB connectivity without needing to navigate through the nooks and crannies of your desk. Also along for the ride are dedicated media keys for easy control during gaming and convenience for a better overall experience.
Pricing & Availability

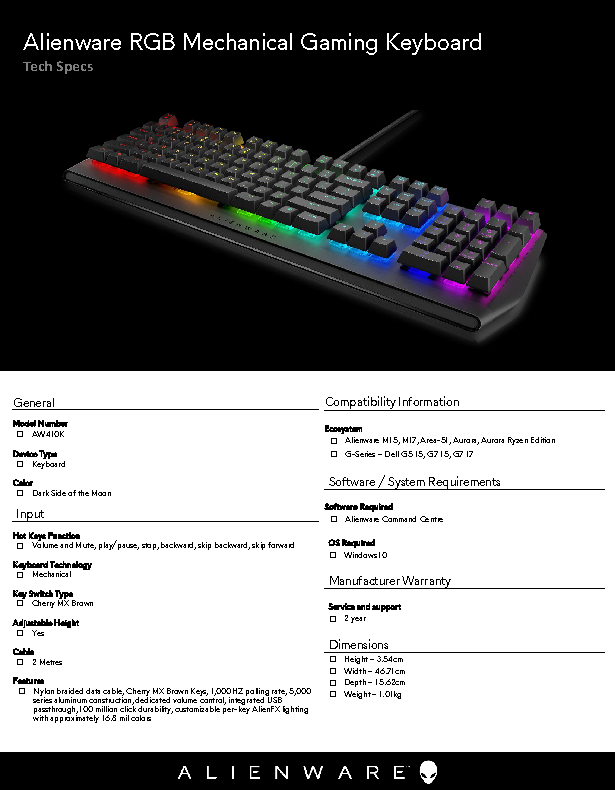
The Alienware Keyboard (AWK410K) will be available starting on August 4, 2020 with prices starting at USD$129.99 (MYR555.38). No official pricing has been announced for the Malaysian market just yet.
Official Specifications

Utilities must accept payments online after the lockdowns, warns IT billing expert

BLOOMSBURG, PA., June 24, 2020Thomas Tobin, Pennsylvania based software developer and President of Diversified Technology Corp, issued the following statement:

“Utility organizations who resisted moving to online payment systems in the past must now take that crucial step,” said Tom Tobin. “To help them, we’ve streamlined the transition process and flattened the learning curve, so even organizations with no online exposure can still confidently make the move.” Diversified set up an information page at: https://diversifiedbilling.com/go-online to help managers understand the process.

“Utility organizations must take this seriously for two reasons,” said Mr. Tobin,

  • “The COVID-19 lockdowns have forced people to rely on online payment systems.
  • COVID-19 still remains a threat and some level of social distancing will probably be a part of everyday life for some time to come.”

“The lockdowns have changed consumer behavior forever,” said Mr. Tobin. “People who would previously tolerate standing in a line to pay a cashier now expect everything to be online and this is not going to change.”

Mr. Tobin’s company, Diversified Technology has seen an increase in Utility organizations ready to move their billing systems online. While Americans have been able to pay most of their accounts online for over a decade, this has often not been the case with utility bills. Some utility organizations have been resistant to change, with long term staff fearing they will be made obsolete, by any move to an automated system.

“But the recent crisis has been a catalyst for them to move,” Mr. Tobin said. “Aside from appeasing dissatisfied customers, moving online is now popular with key staff who worry about being exposed to the virus.” Mr. Tobin explained that utility organizations typically have a large percentage of aging staff, people who are most at risk of becoming seriously ill or dying from the disease.

Mr Tobin said the key component of their system was the flexibility. Being able to switch utilities from inhouse LAN based software to cloud based, and back to their LAN at any time, gives managers the reassurance they need to be able to make the move. They also discover a new layer of safety with online billing. Real time reporting results in fewer delinquent accounts and a reduction in phone calls from irate customers. When people can view their statistics online, they are more likely to understand their charges.

Diversified Technology Corp is a Pennsylvania based software development company, who have built utility billing and management systems for the past twenty years. You can call them on 800-537-8903 x1004 or visit their website at: https://diversifiedbilling.com/go-online

Related Links :

https://diversifiedbilling.com

[Next@Acer 2020] Acer unveils ConceptD 100 Desktop Together with Three new Monitors

Acer has been hard at work looking into the needs of designers since it first announced its ConceptD line up last year. This year, the line up is being expanded with more options that make sense for the artistically inclined and design heavy consumer with their new ConceptD 3 Ezel and even their new line up of monitors and the new ConceptD 100 desktop.

ConceptD 100 Desktop

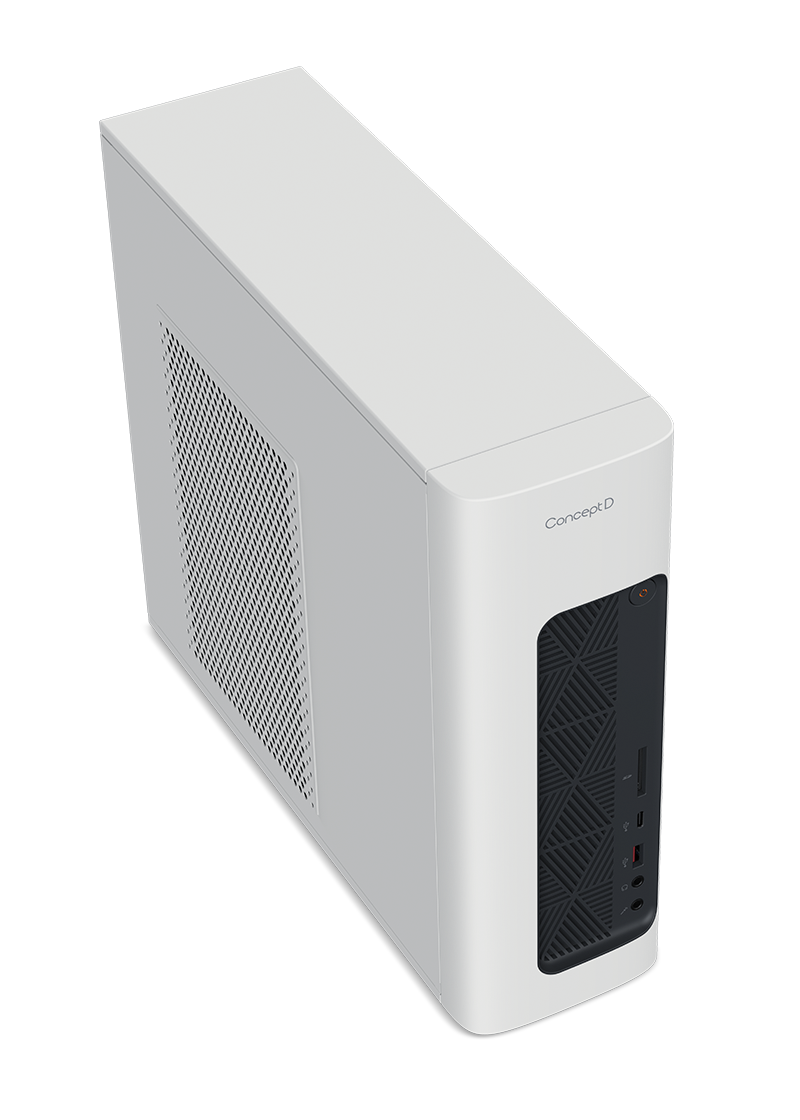
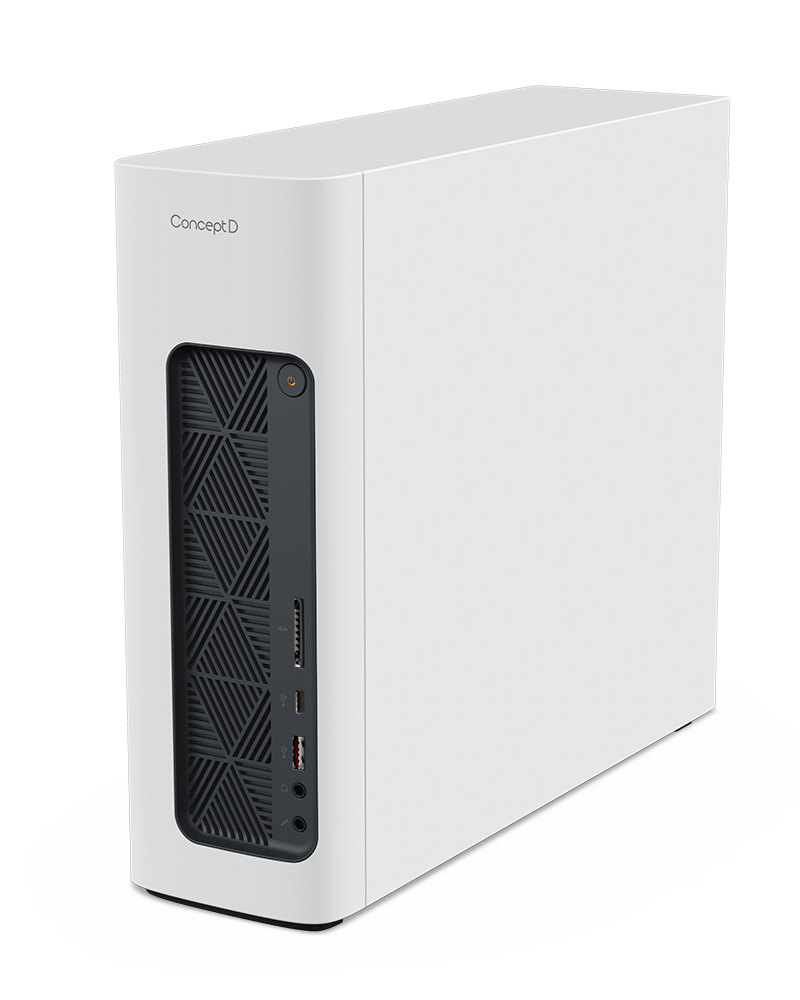
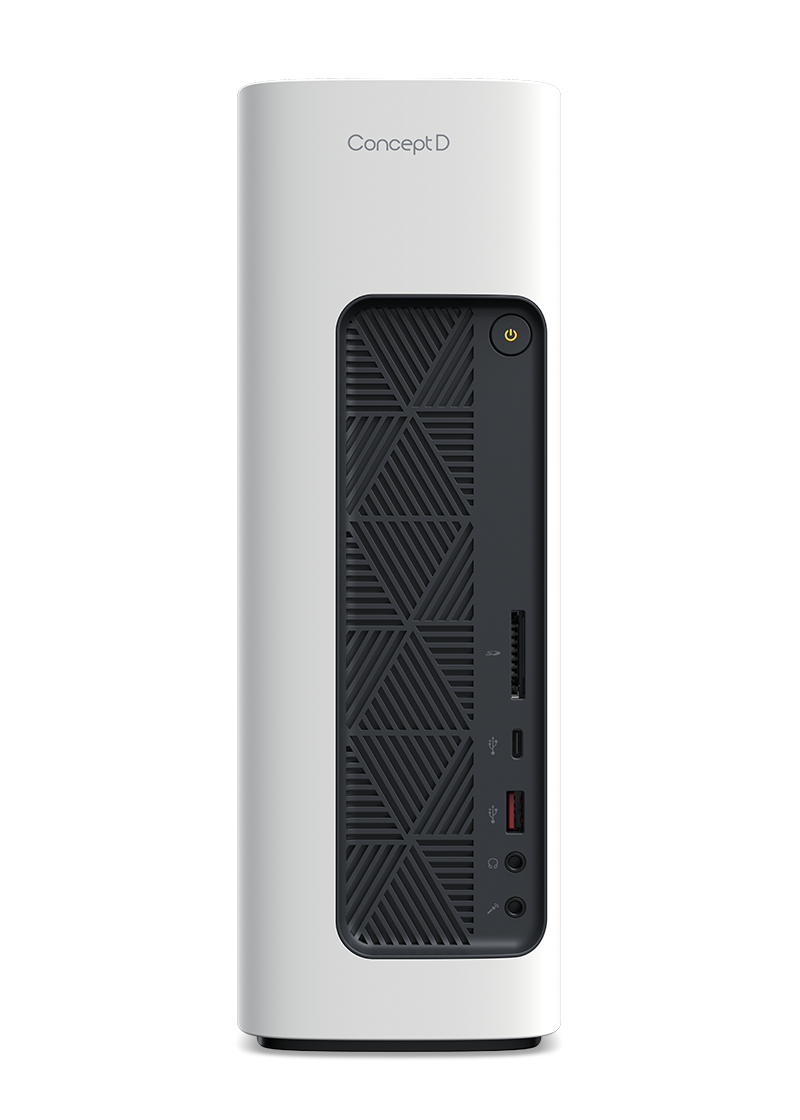
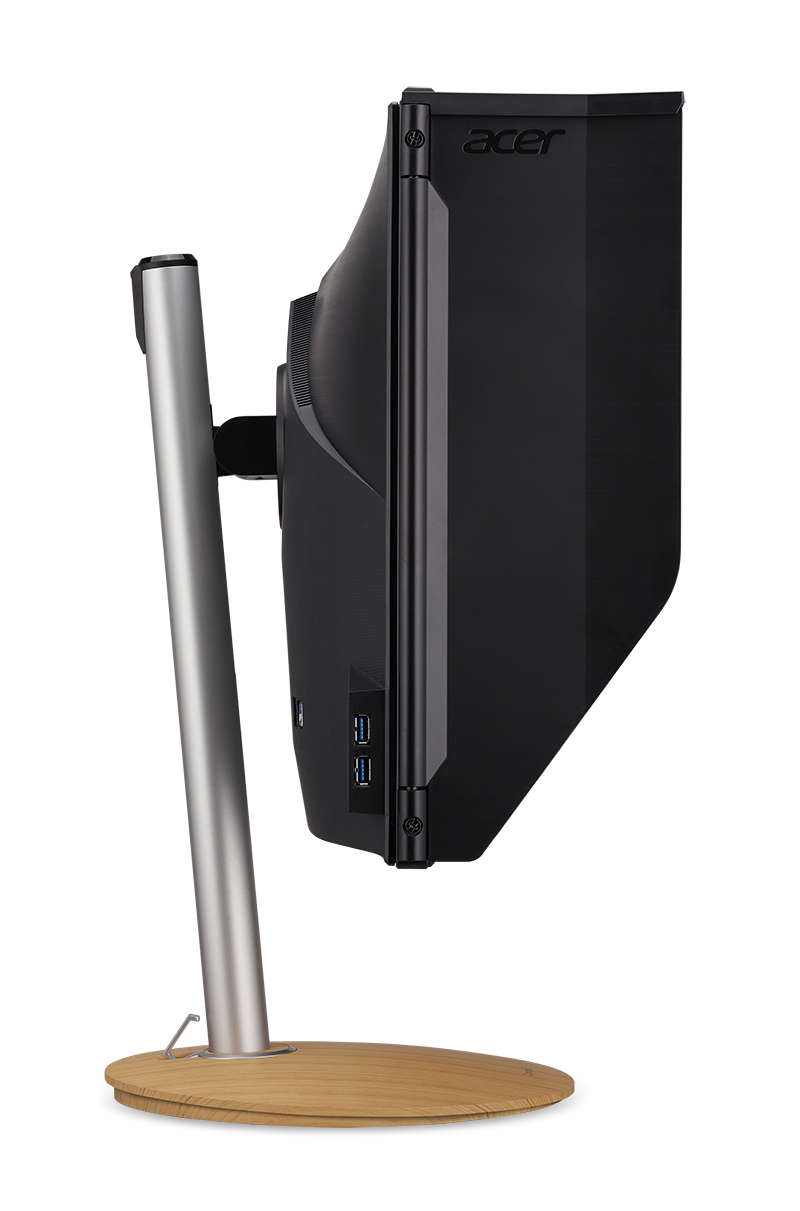
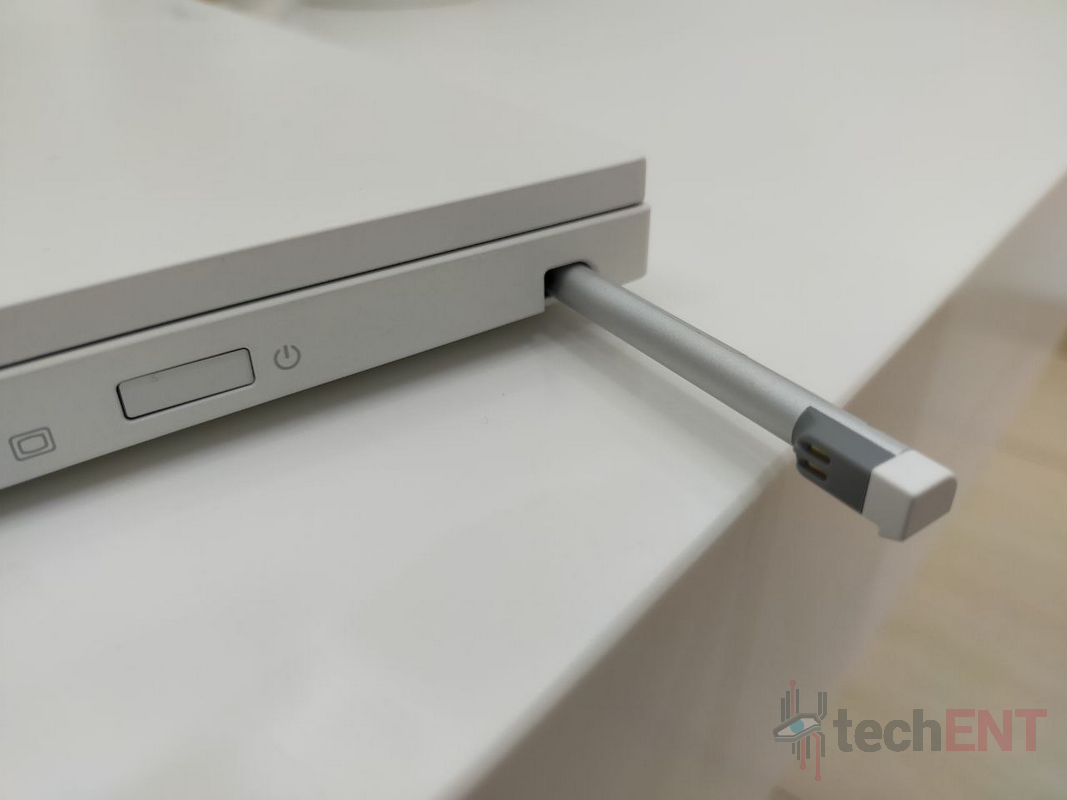
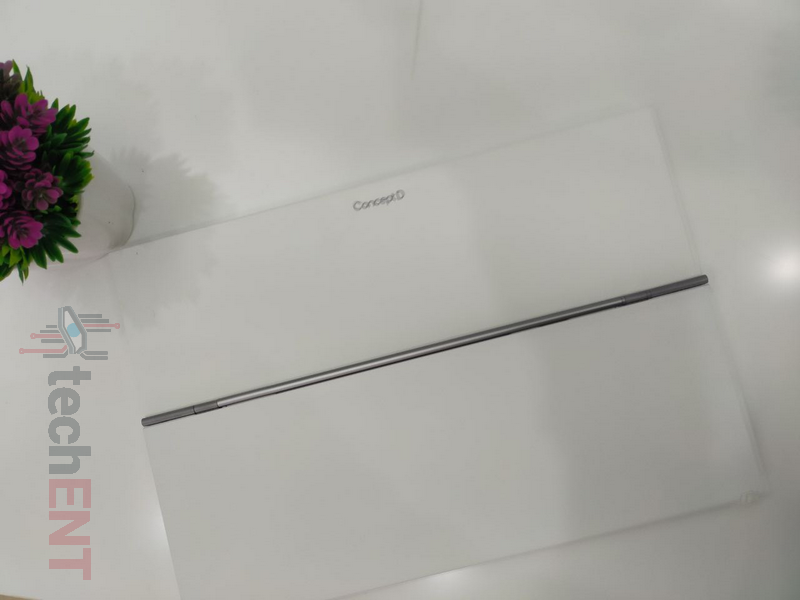
The ConceptD 100 desktop takes the design cues of the ConceptD line up and puts them into a rather unique, sleek and eye catching design. The pristine white finish is accented by a deep black panel which houses most of the functional buttons.

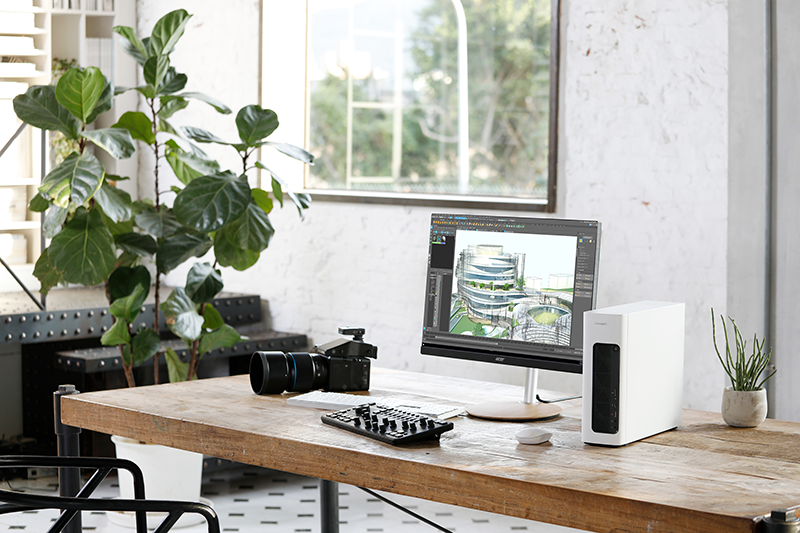
That said, the package isn’t just pretty. It has some substance with Acer gearing the ConceptD 100 Desktop for 2D rendering and entry level 3D CAD workloads. It comes equipped with 9th generation Intel Core i5 processor and is equipped with up to 16GB of RAM and up to 2TB of storage. To help with the graphical workloads, the ConceptD 100 comes equipped with the NVIDIA GeForce GT 1030 or NVIDIA Quadro P620 graphics cards. When it comes to connectivity, it supports 802.11ac/a/b/g/n WiFi and Bluetooth 5.0.

Official Specifications

ConceptD Monitors

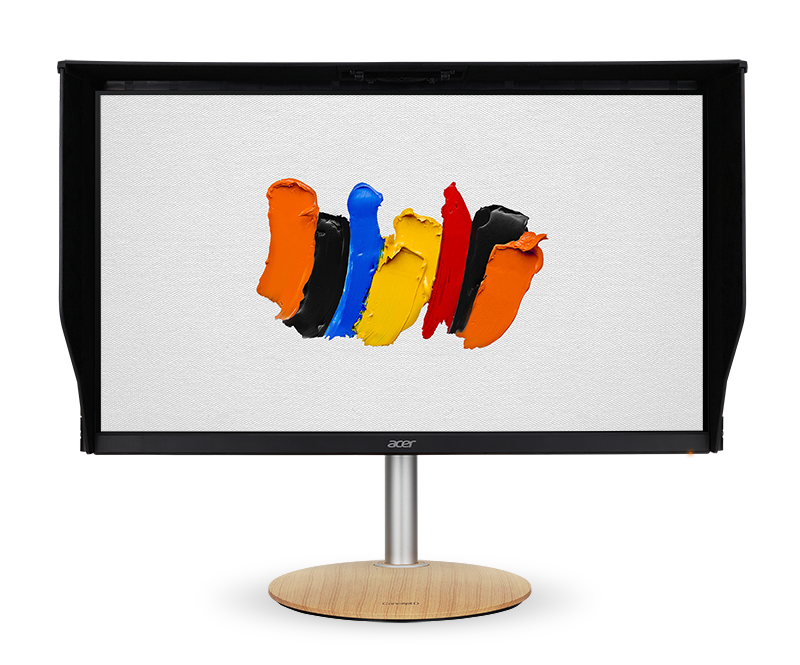
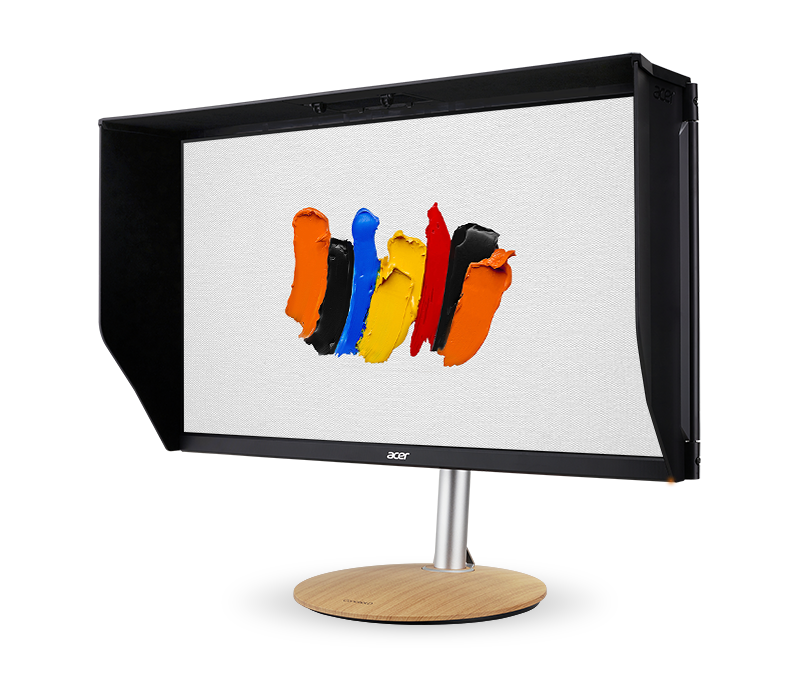
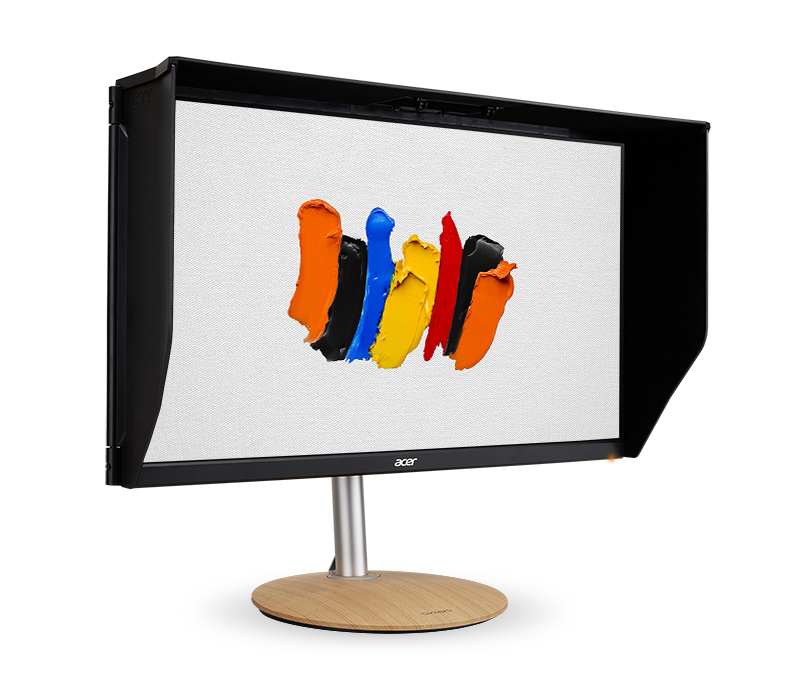
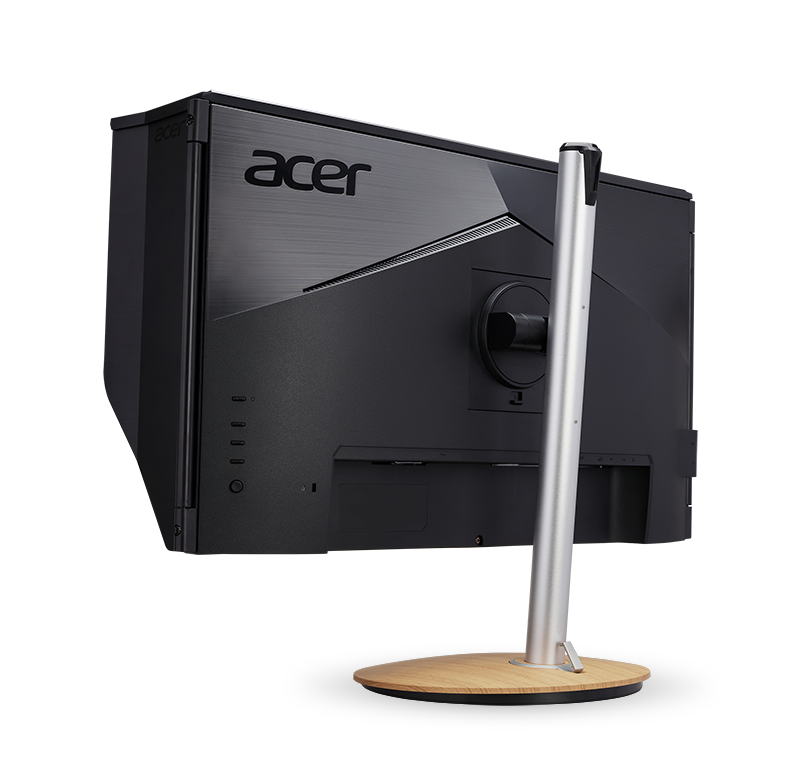
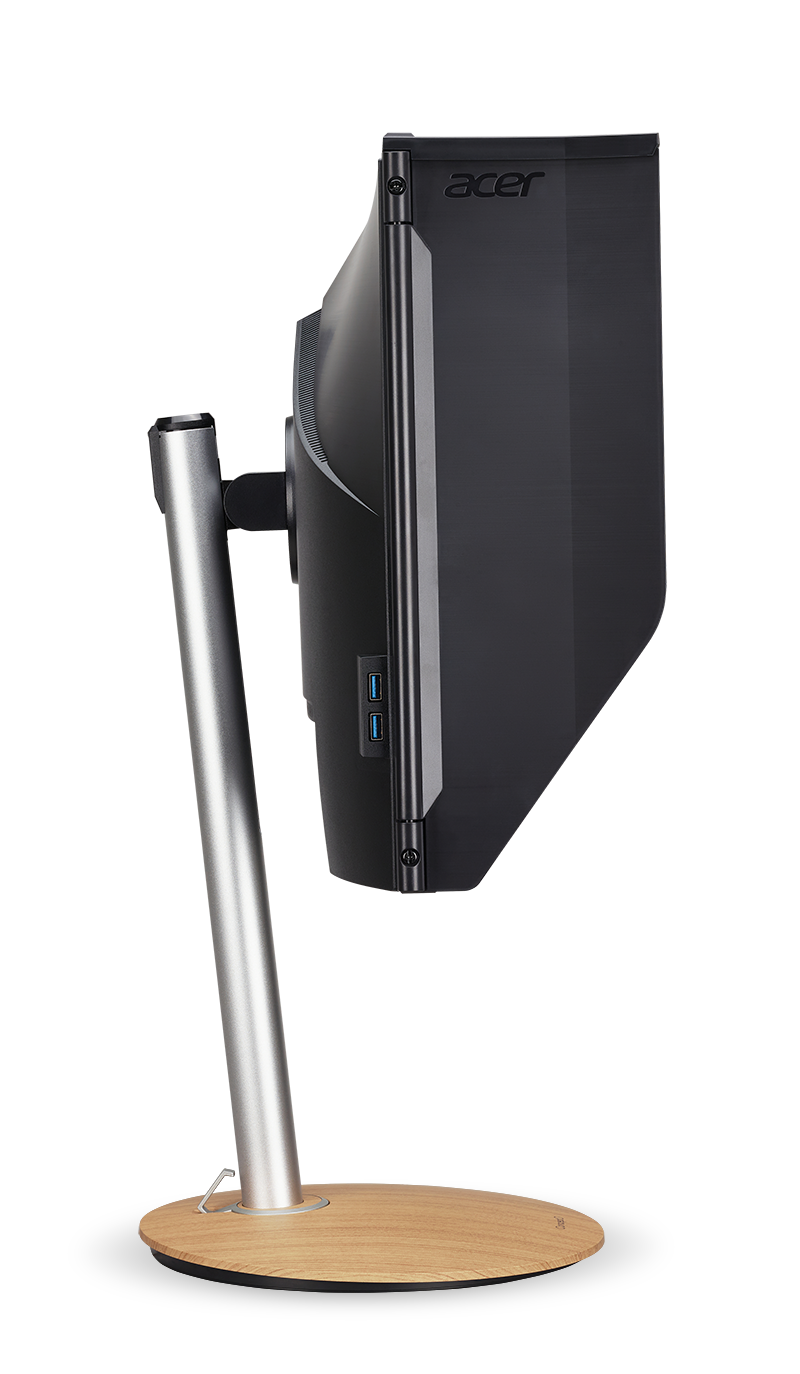
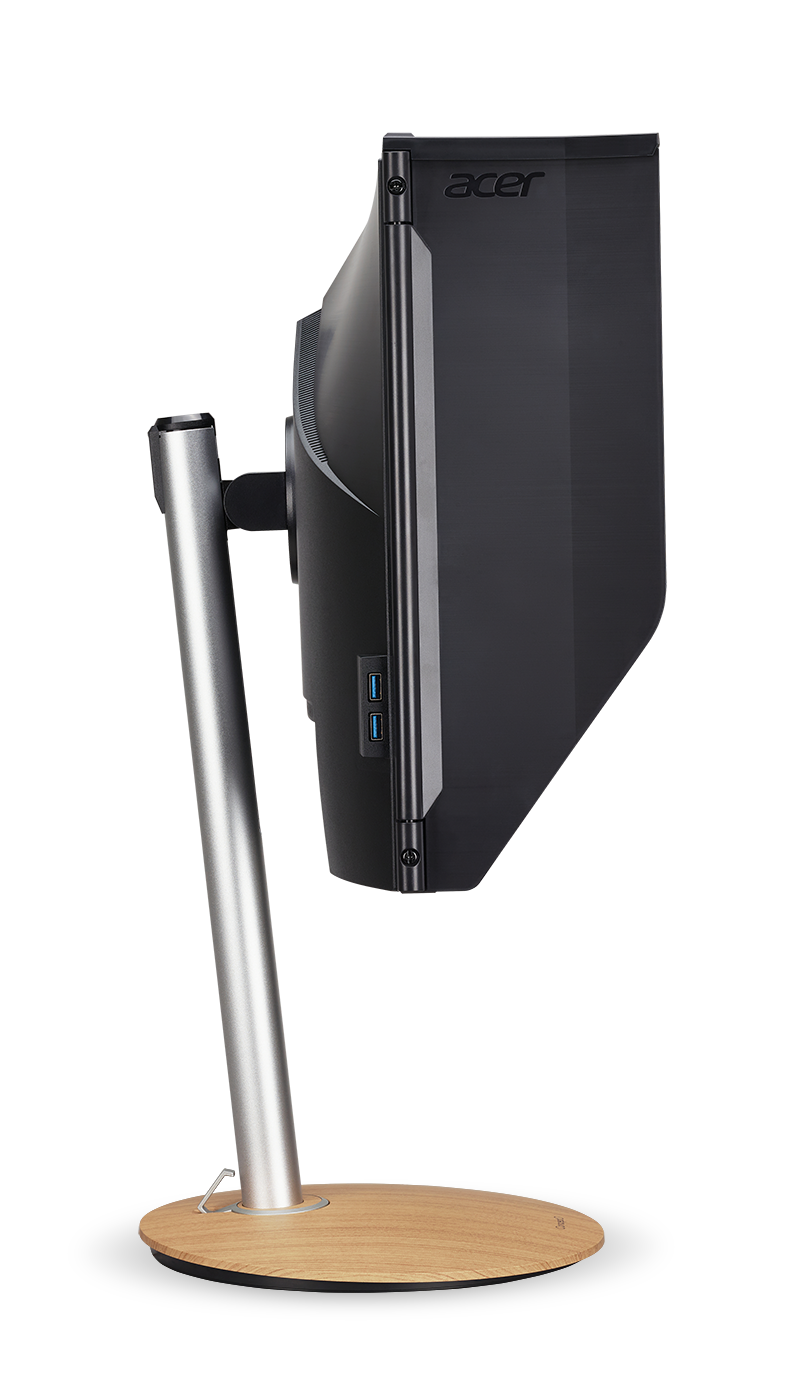
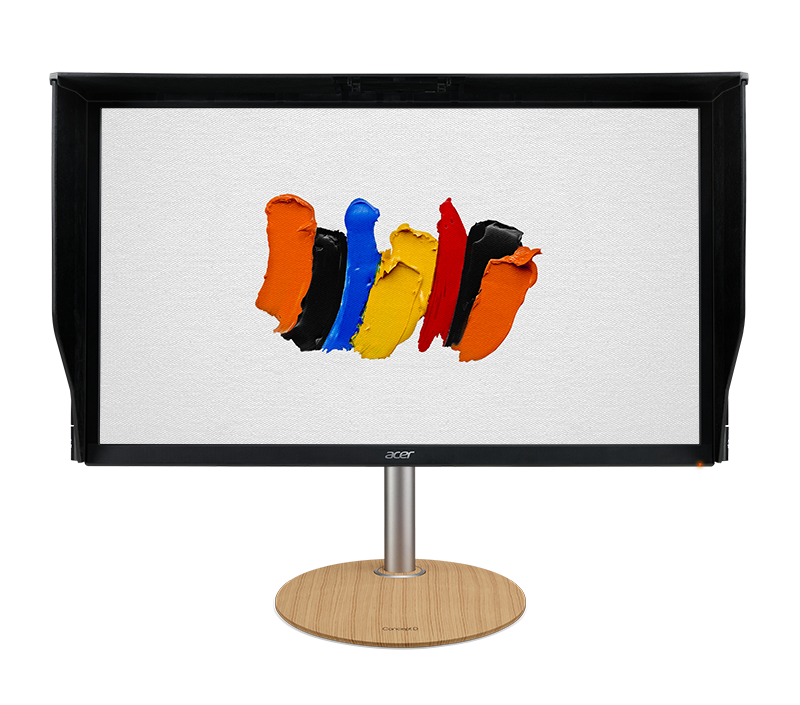
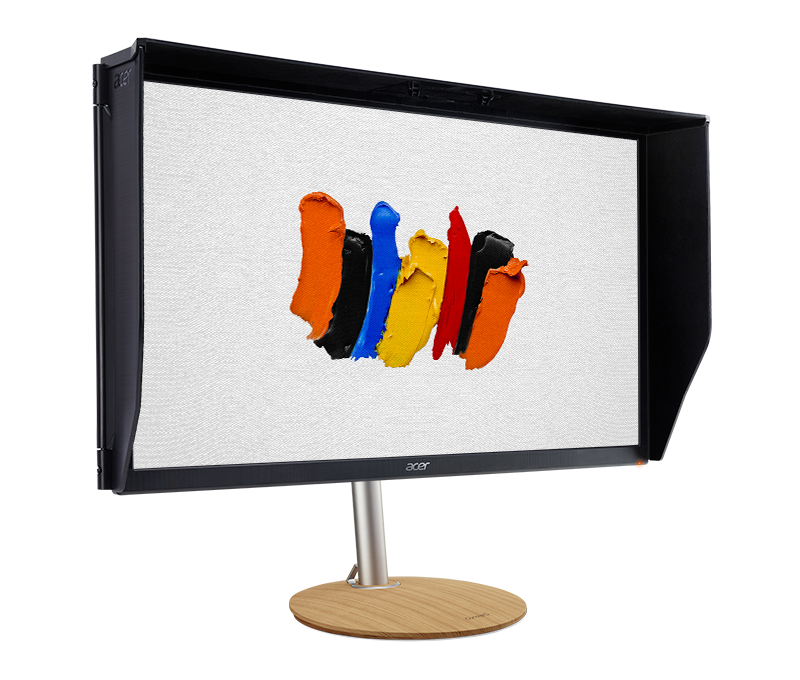
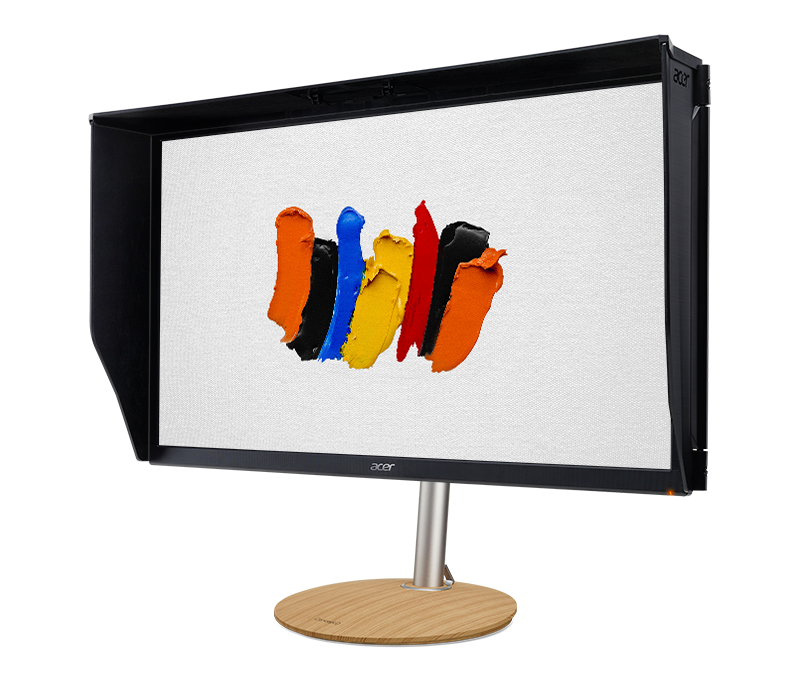
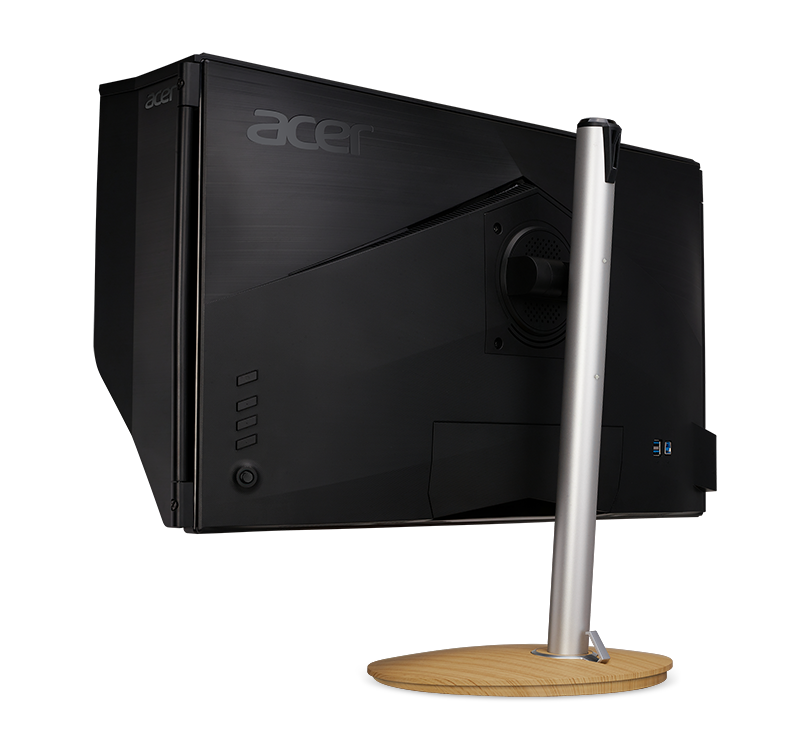
Keeping in line with catering for the needs of the prosumer, the ConceptD monitors are built to cater to the needs of graphics intensive workloads which require an increased colour accuracy and higher refresh rates.

ConceptD CP5 & CP3

The ConceptD CP5 and CP3 monitors are catered specifically to computer graphics creators, video editors and animators.

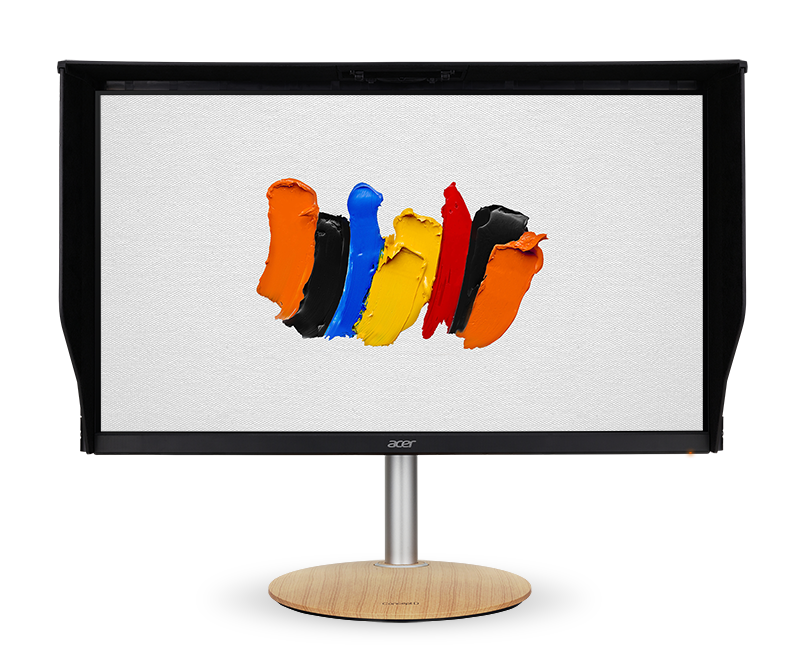
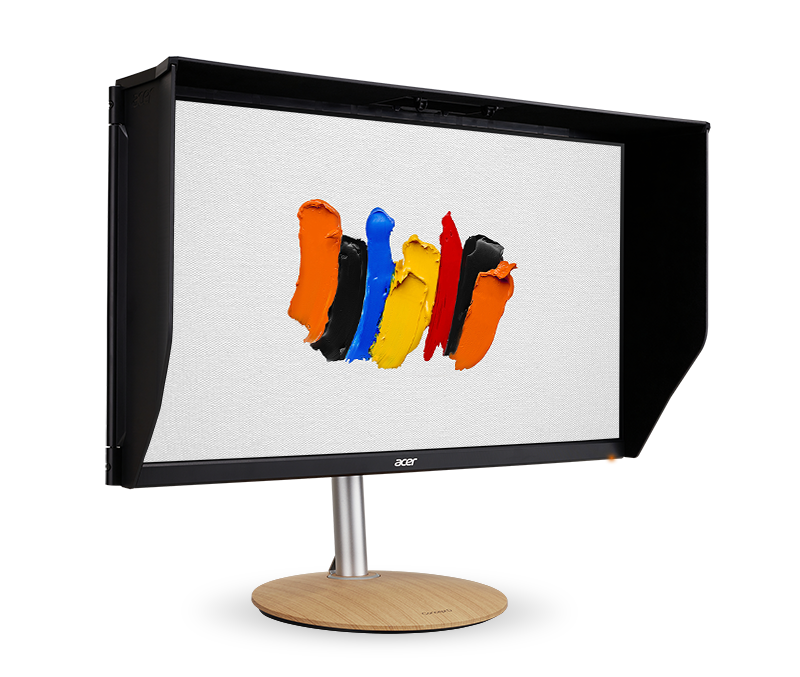
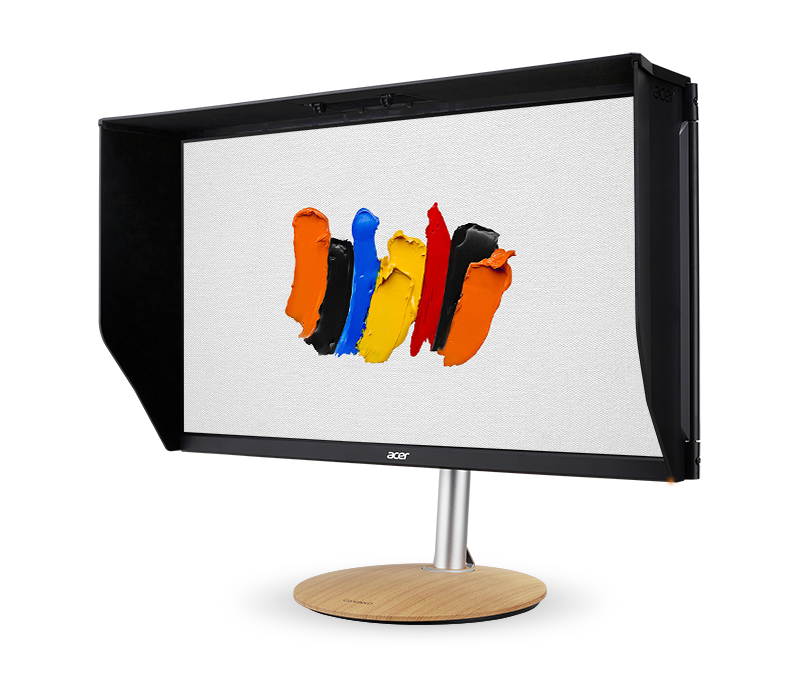
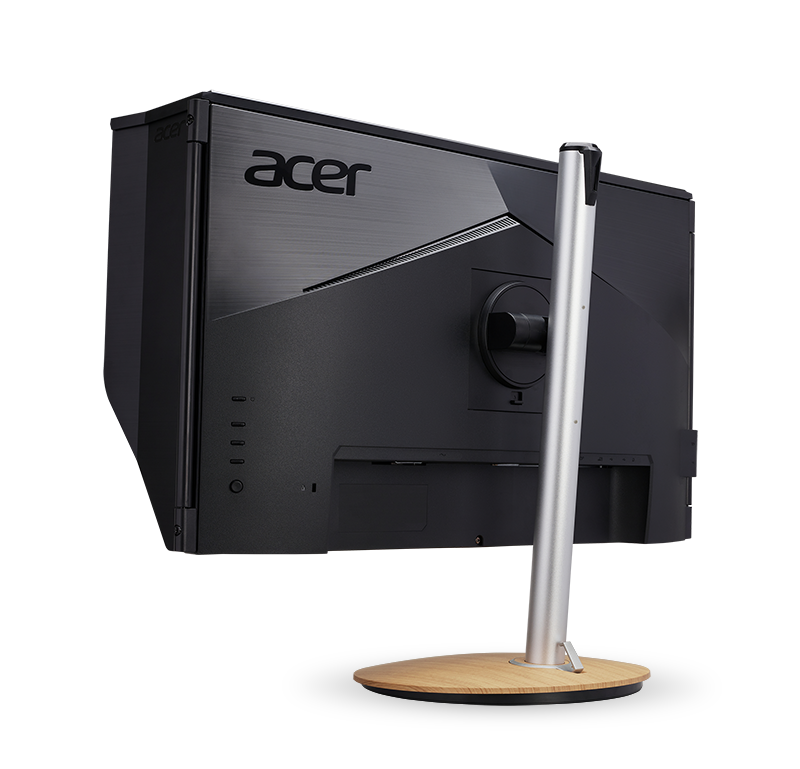
The CP5 is equipped with a WQHD resolution of 2560×1440 pixels and is HDR compatible with the VESA DisplayHDR 600 standard. It comes with Adaptive Sync technology and can be overclocked to 170Hz refresh rate. The high-performance monitor comes with a high degree of colour accuracy with ΔE values well below 1 and PANTONE validaton. The monitors come with a colour depth of 1.07 million colours covering 99% of the Adobe sRGB gamut.

The CP3 carries similar specifications with support for 98% of the DCI-P3 colour gamut and a refresh rate of up to 165Hz. It comes with a WQHD resolution of 3840×2160 pixels and is certified with HDR support according to the VESA DisplayHDR 400 standard.

ConceptD CM3 Monitor

The ConceptD CM3 monitor zooms in on professional creators looking for a more capable monitor to handle the precision based workloads they are used to. The monitor comes with support for 99% of the Adobe RGB colour space and is Pantone Validated with a ΔE of less than 2. It also has VESA DisplayHDR 400 support and is compatible with AMD FreeSync.

Pricing & Availability

The ConceptD 100 Desktop will be available in Europe, Middle East and Asia (EMEA) in June with prices starting at EUR799 (MYR4,834.10).

The ConceptD CP3 monitor will be available in China starting in June with prices starting at RMB3,999 (MYR); in North America (NA) and EMEA starting in August with prices starting at USD$619.99 (MYR2,649.86) and EUR629 (MYR3,043.90) respectively.

The CP5 monitor will be available in China starting in July with prices kicking off at RMB4,999 (MYR3,022.49); in NA and EMEA starting August with prices starting at USD$749.99 (MYR3,205.52) and EUR759 (MYR3,673.34) respectively.

The CM3 will be available in China starting July with prices kicking off at RMB4,999 (MYR3,022.49); in NA and EMEA starting August with prices starting at USD$709.99 (MYR3,034.54) and EUR719 (MYR3,480.01) respectively.

Lenovo ThinkPad E Series Empowering the New Work From Home Culture with AMD’s Ryzen in Malaysia

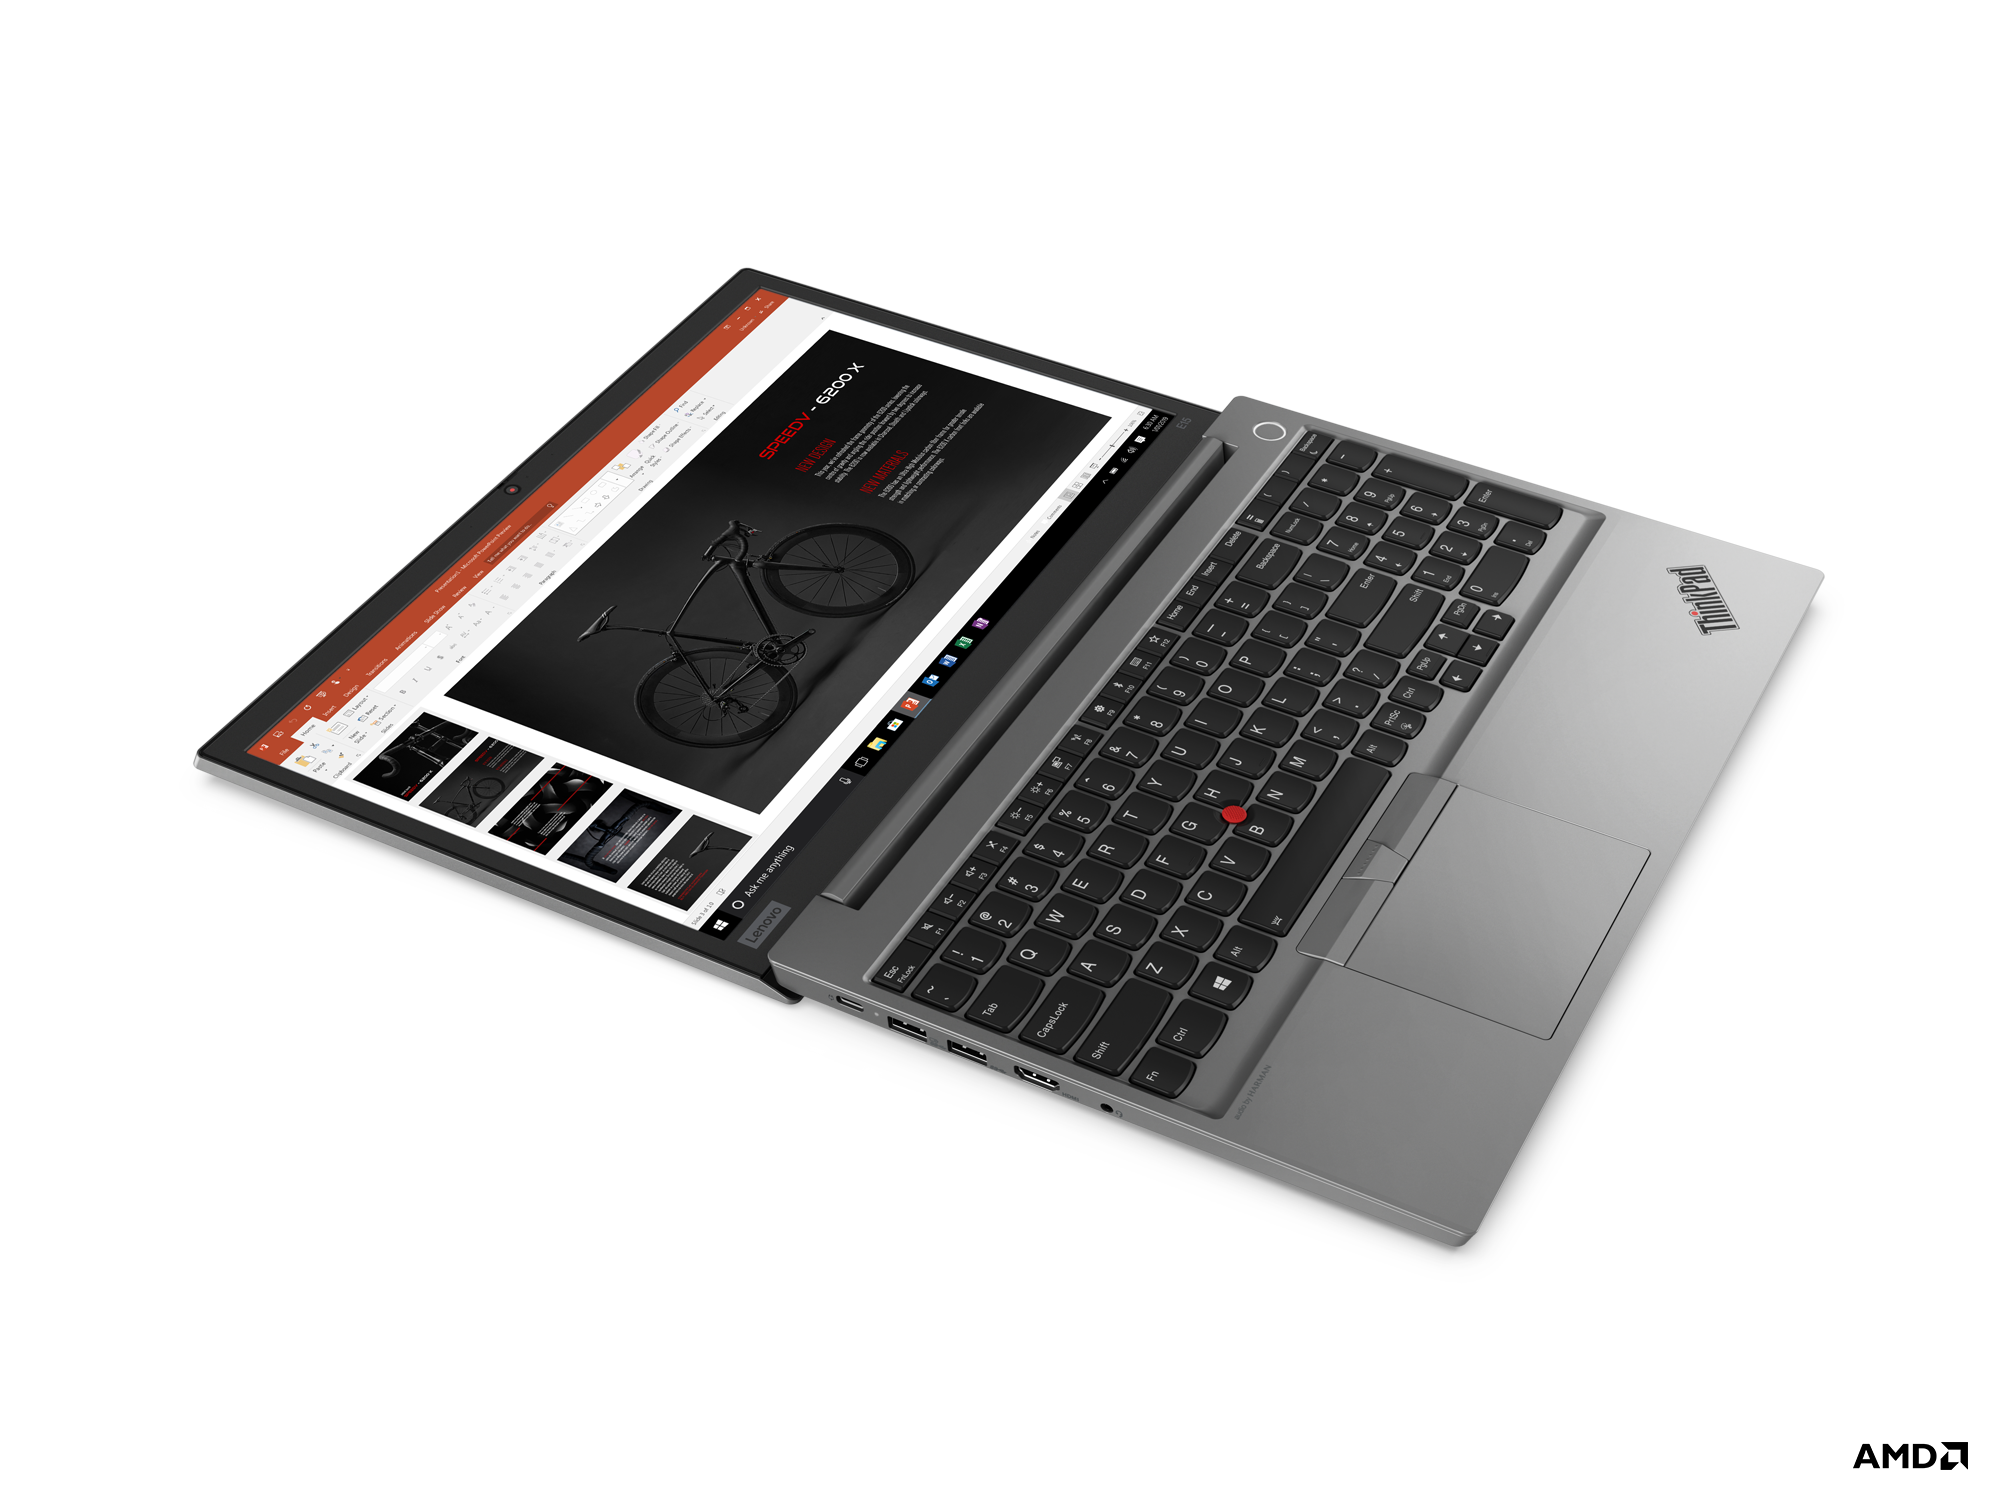
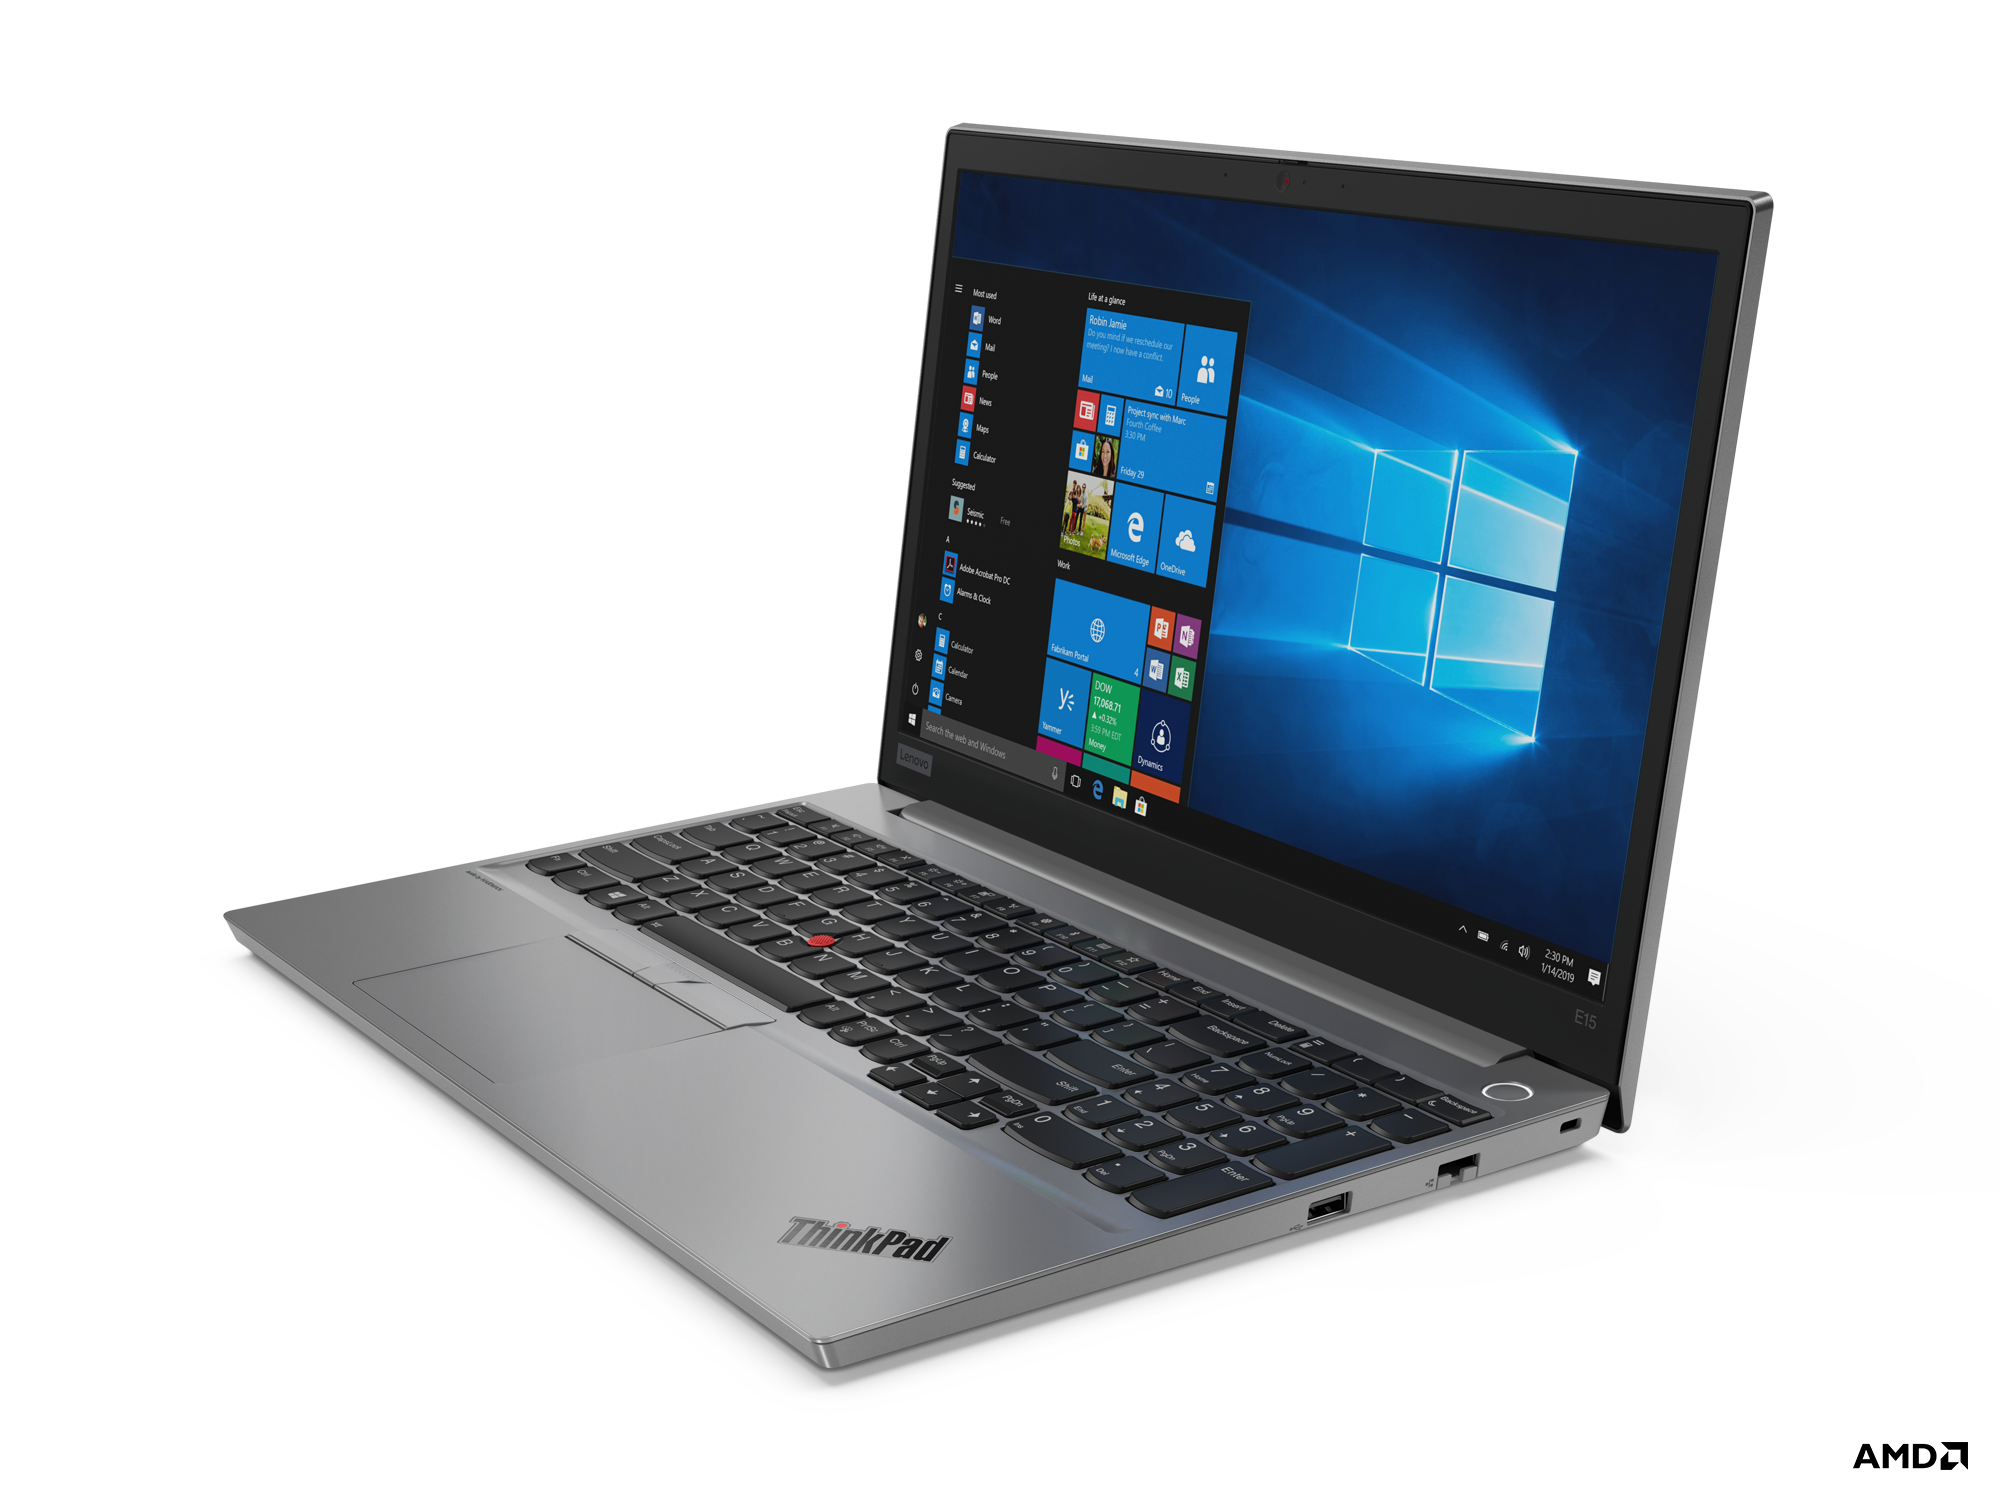
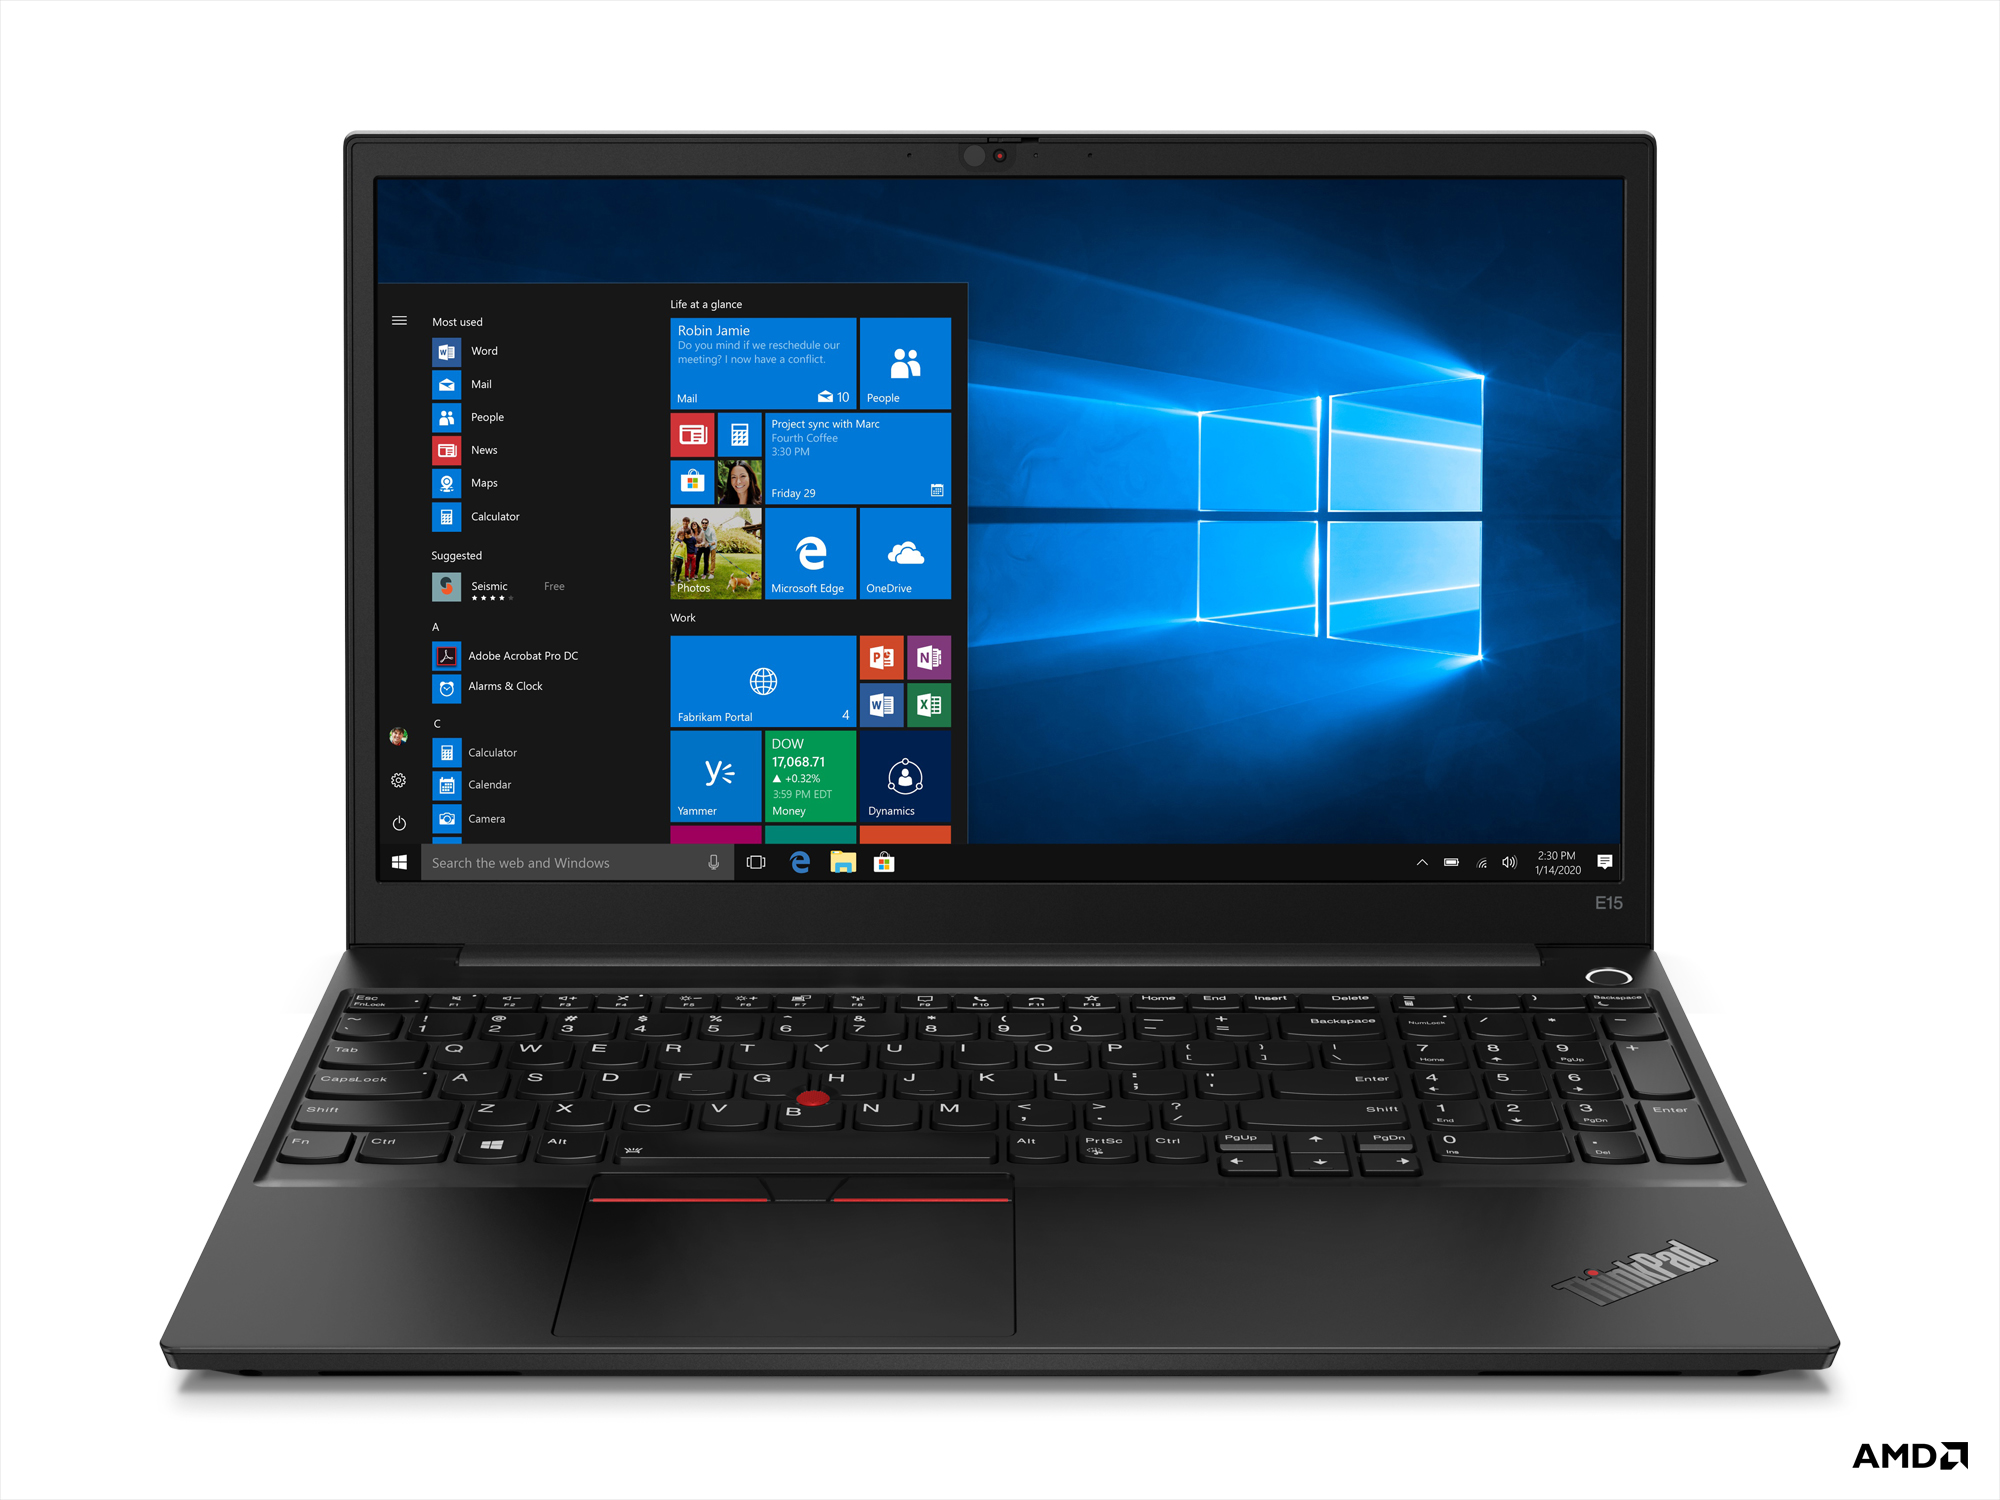
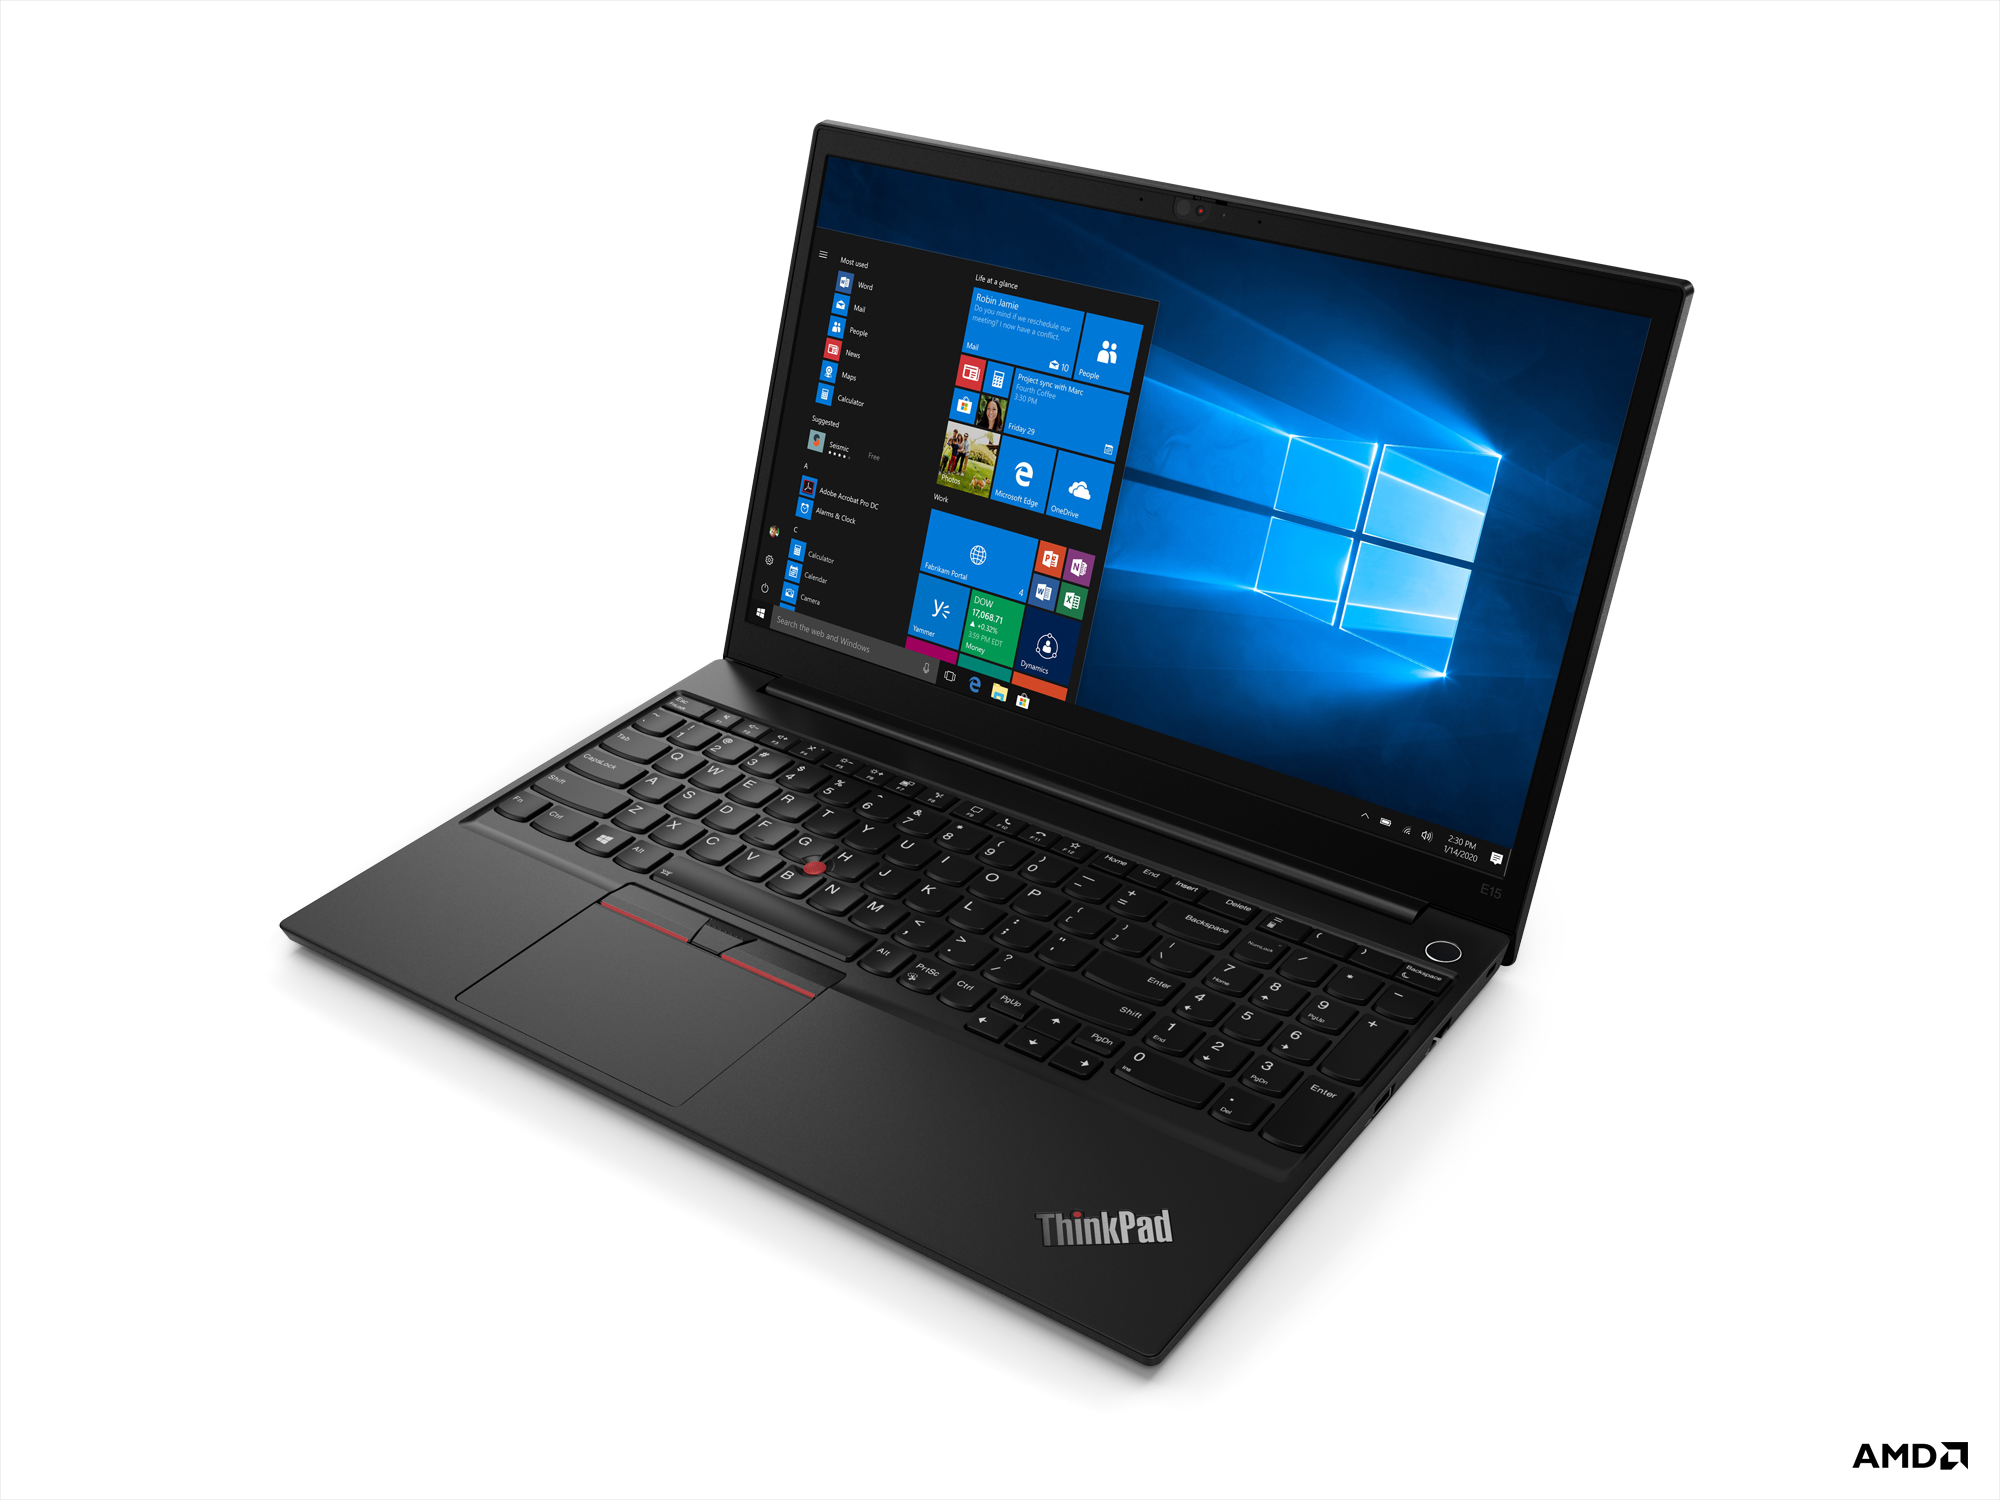
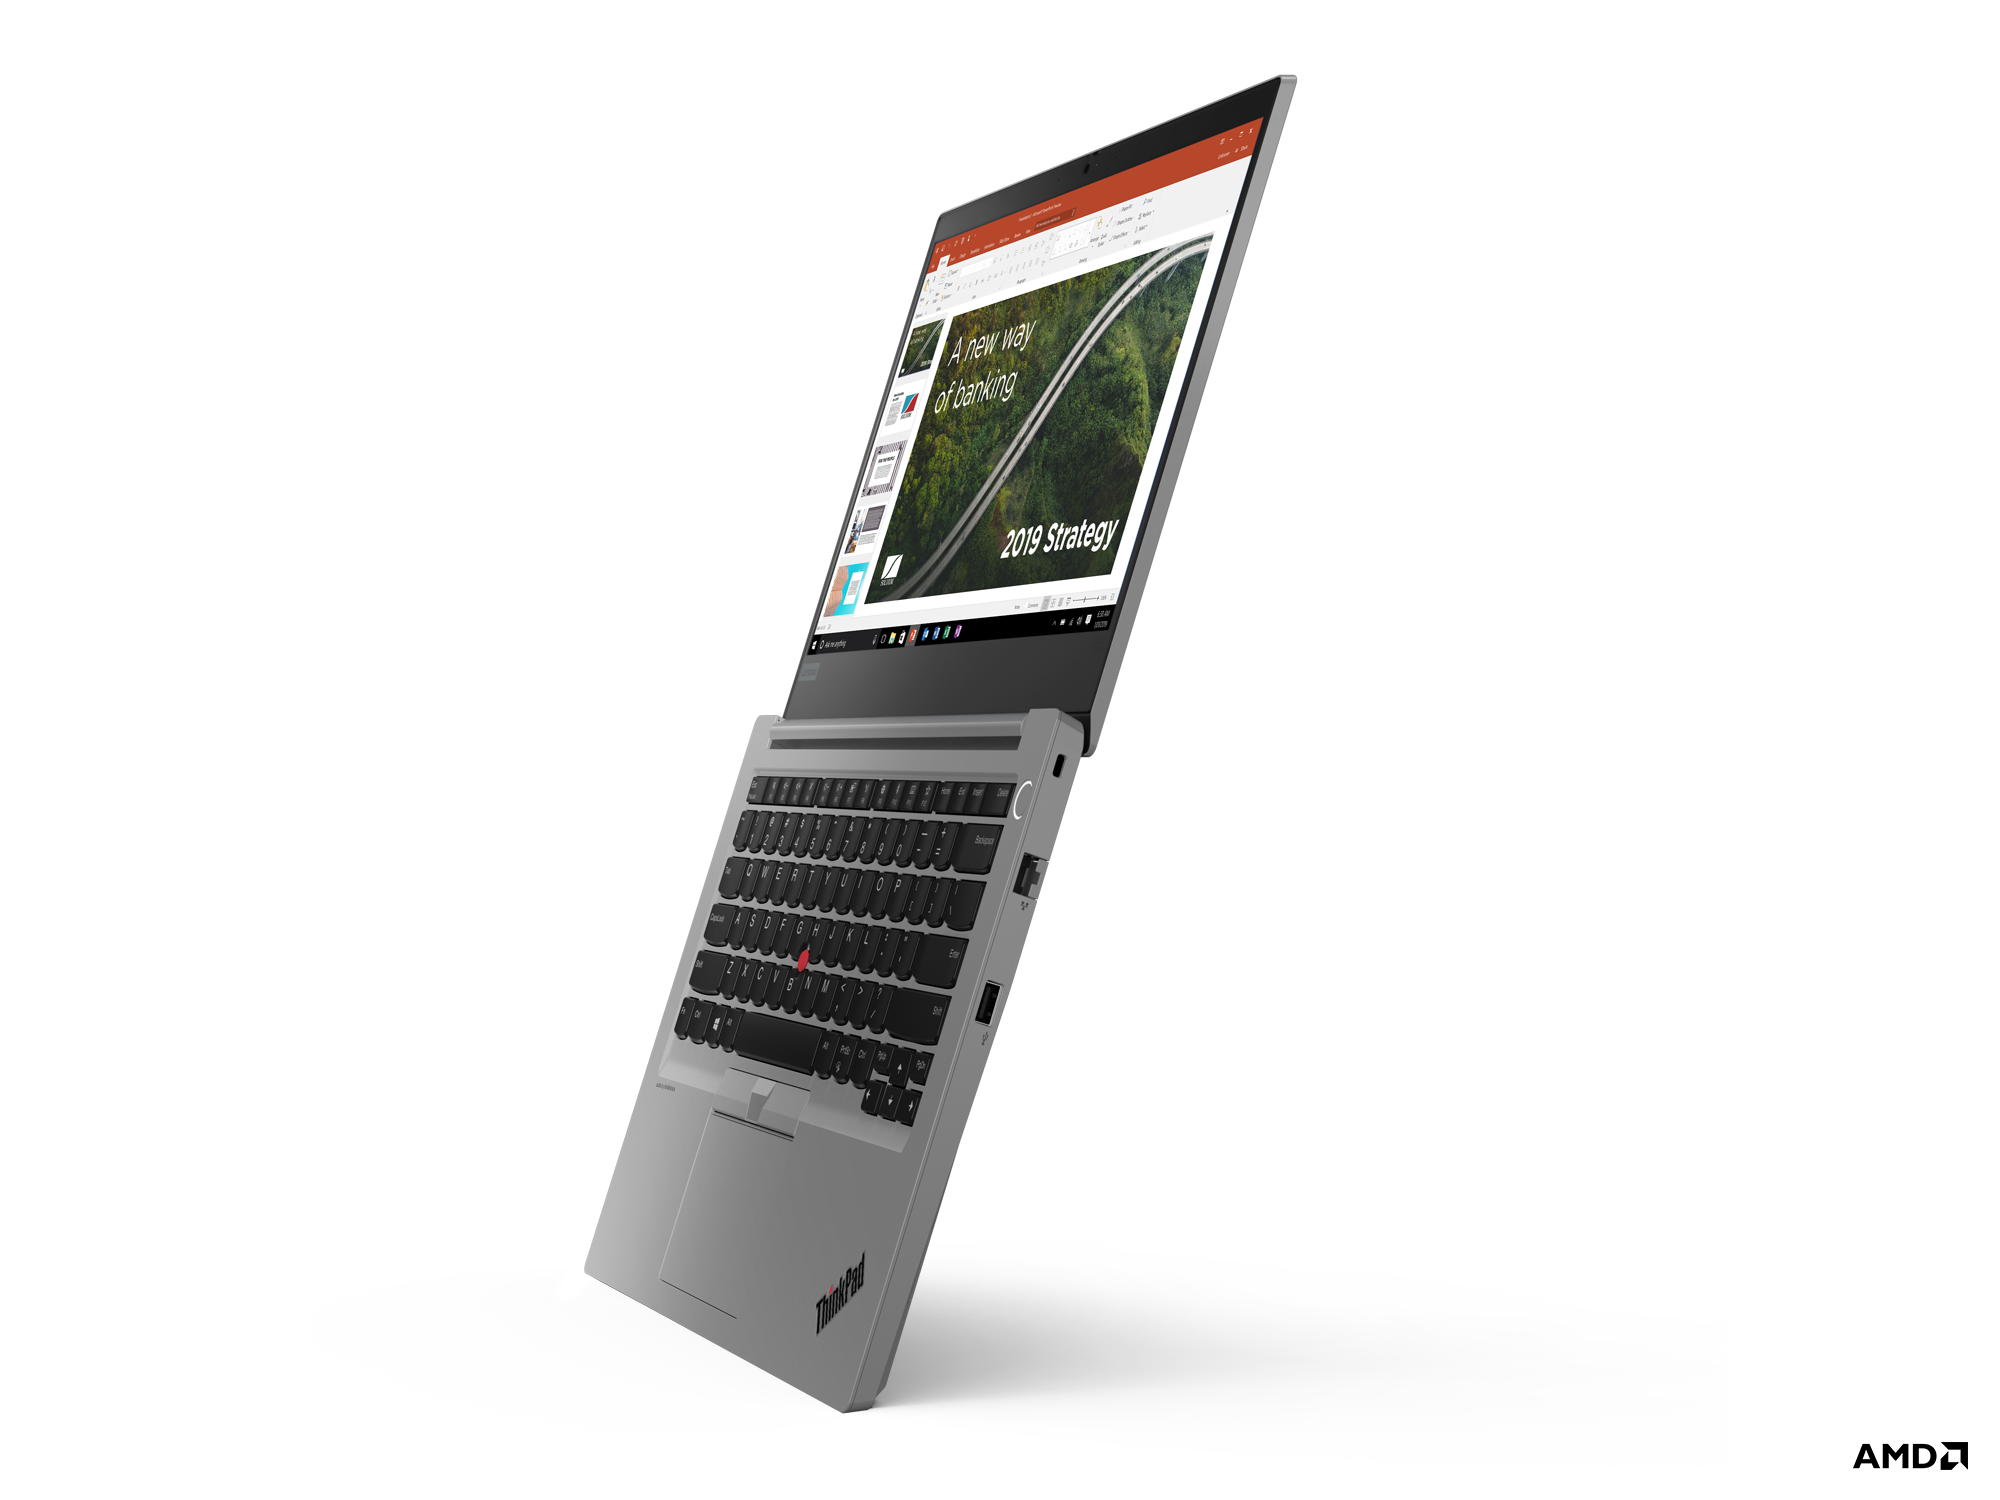
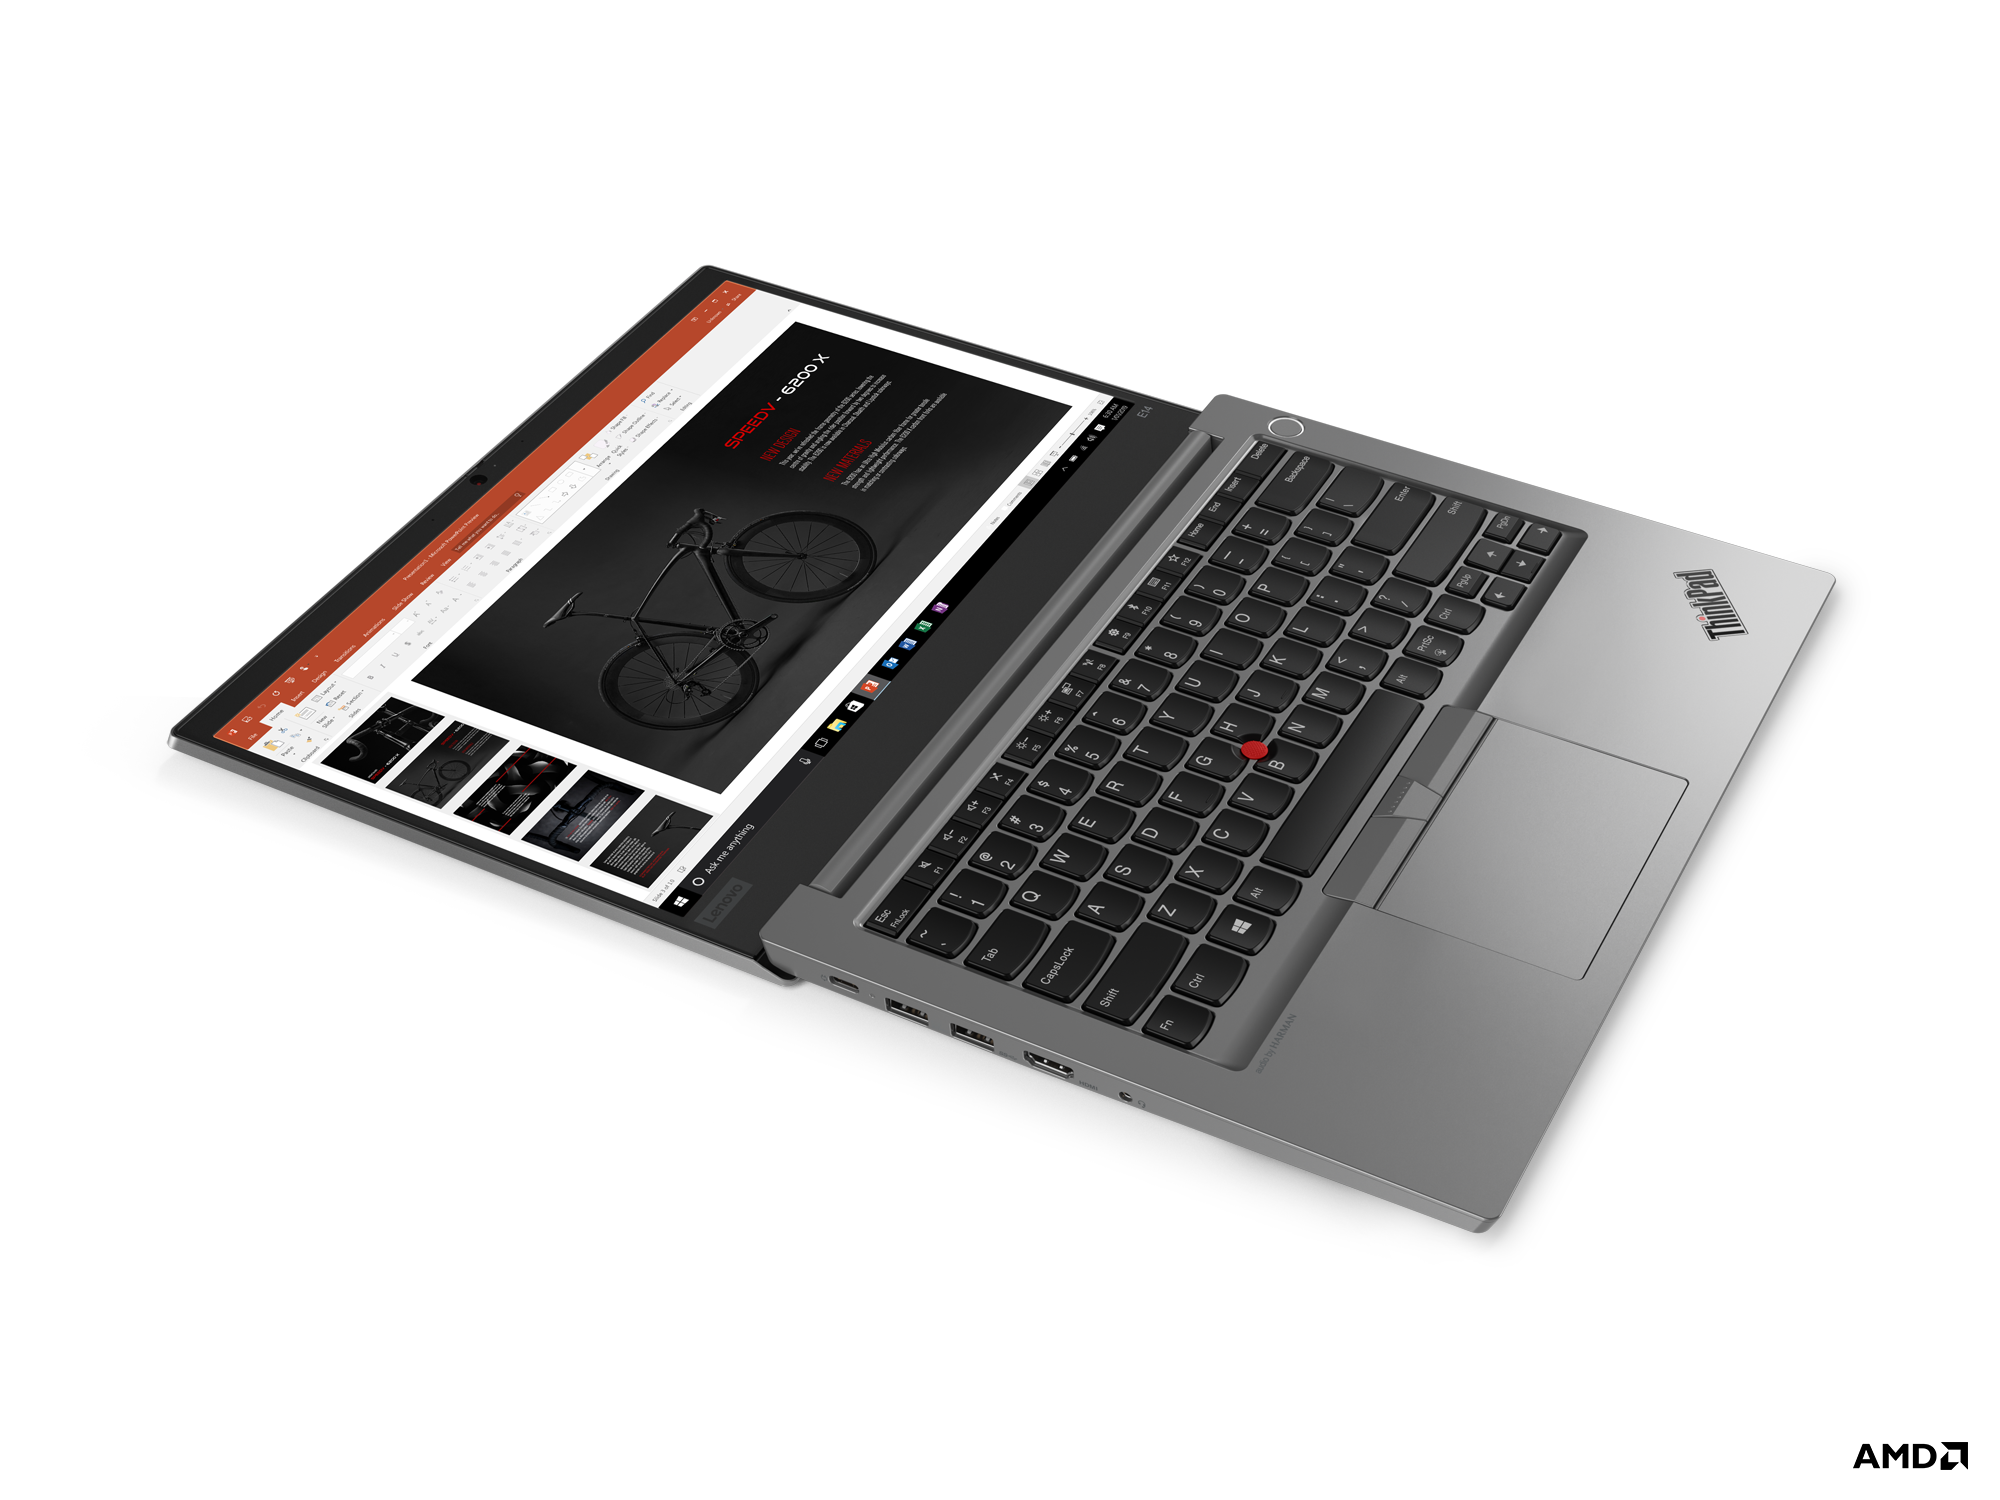
Lenovo’s laptops have long powered the productivity of small and medium businesses. In fact, their ThinkPad brand has been in the business for more than two decades now! The series has become synonymous with sturdy, well built, purpose built laptops which Lenovo has taken to the next level with models such as the ThinkPad X1 Carbon. However, the company didn’t announce another top of the link ThinkPad this time. Instead, they’ve shifted their focus to their affordable, durable, and purpose built line up: the ThinkPad E series.

They’ve partnered with AMD this round to bring even more efficient but powerful performance with AMD’s Ryzen 4000 series. The Ryzen 4000 series has been touted to bring better power efficiency and double digit performance gains over the previous generation of Ryzen processors. In fact, it’s boasting more than 30% increases in performance.

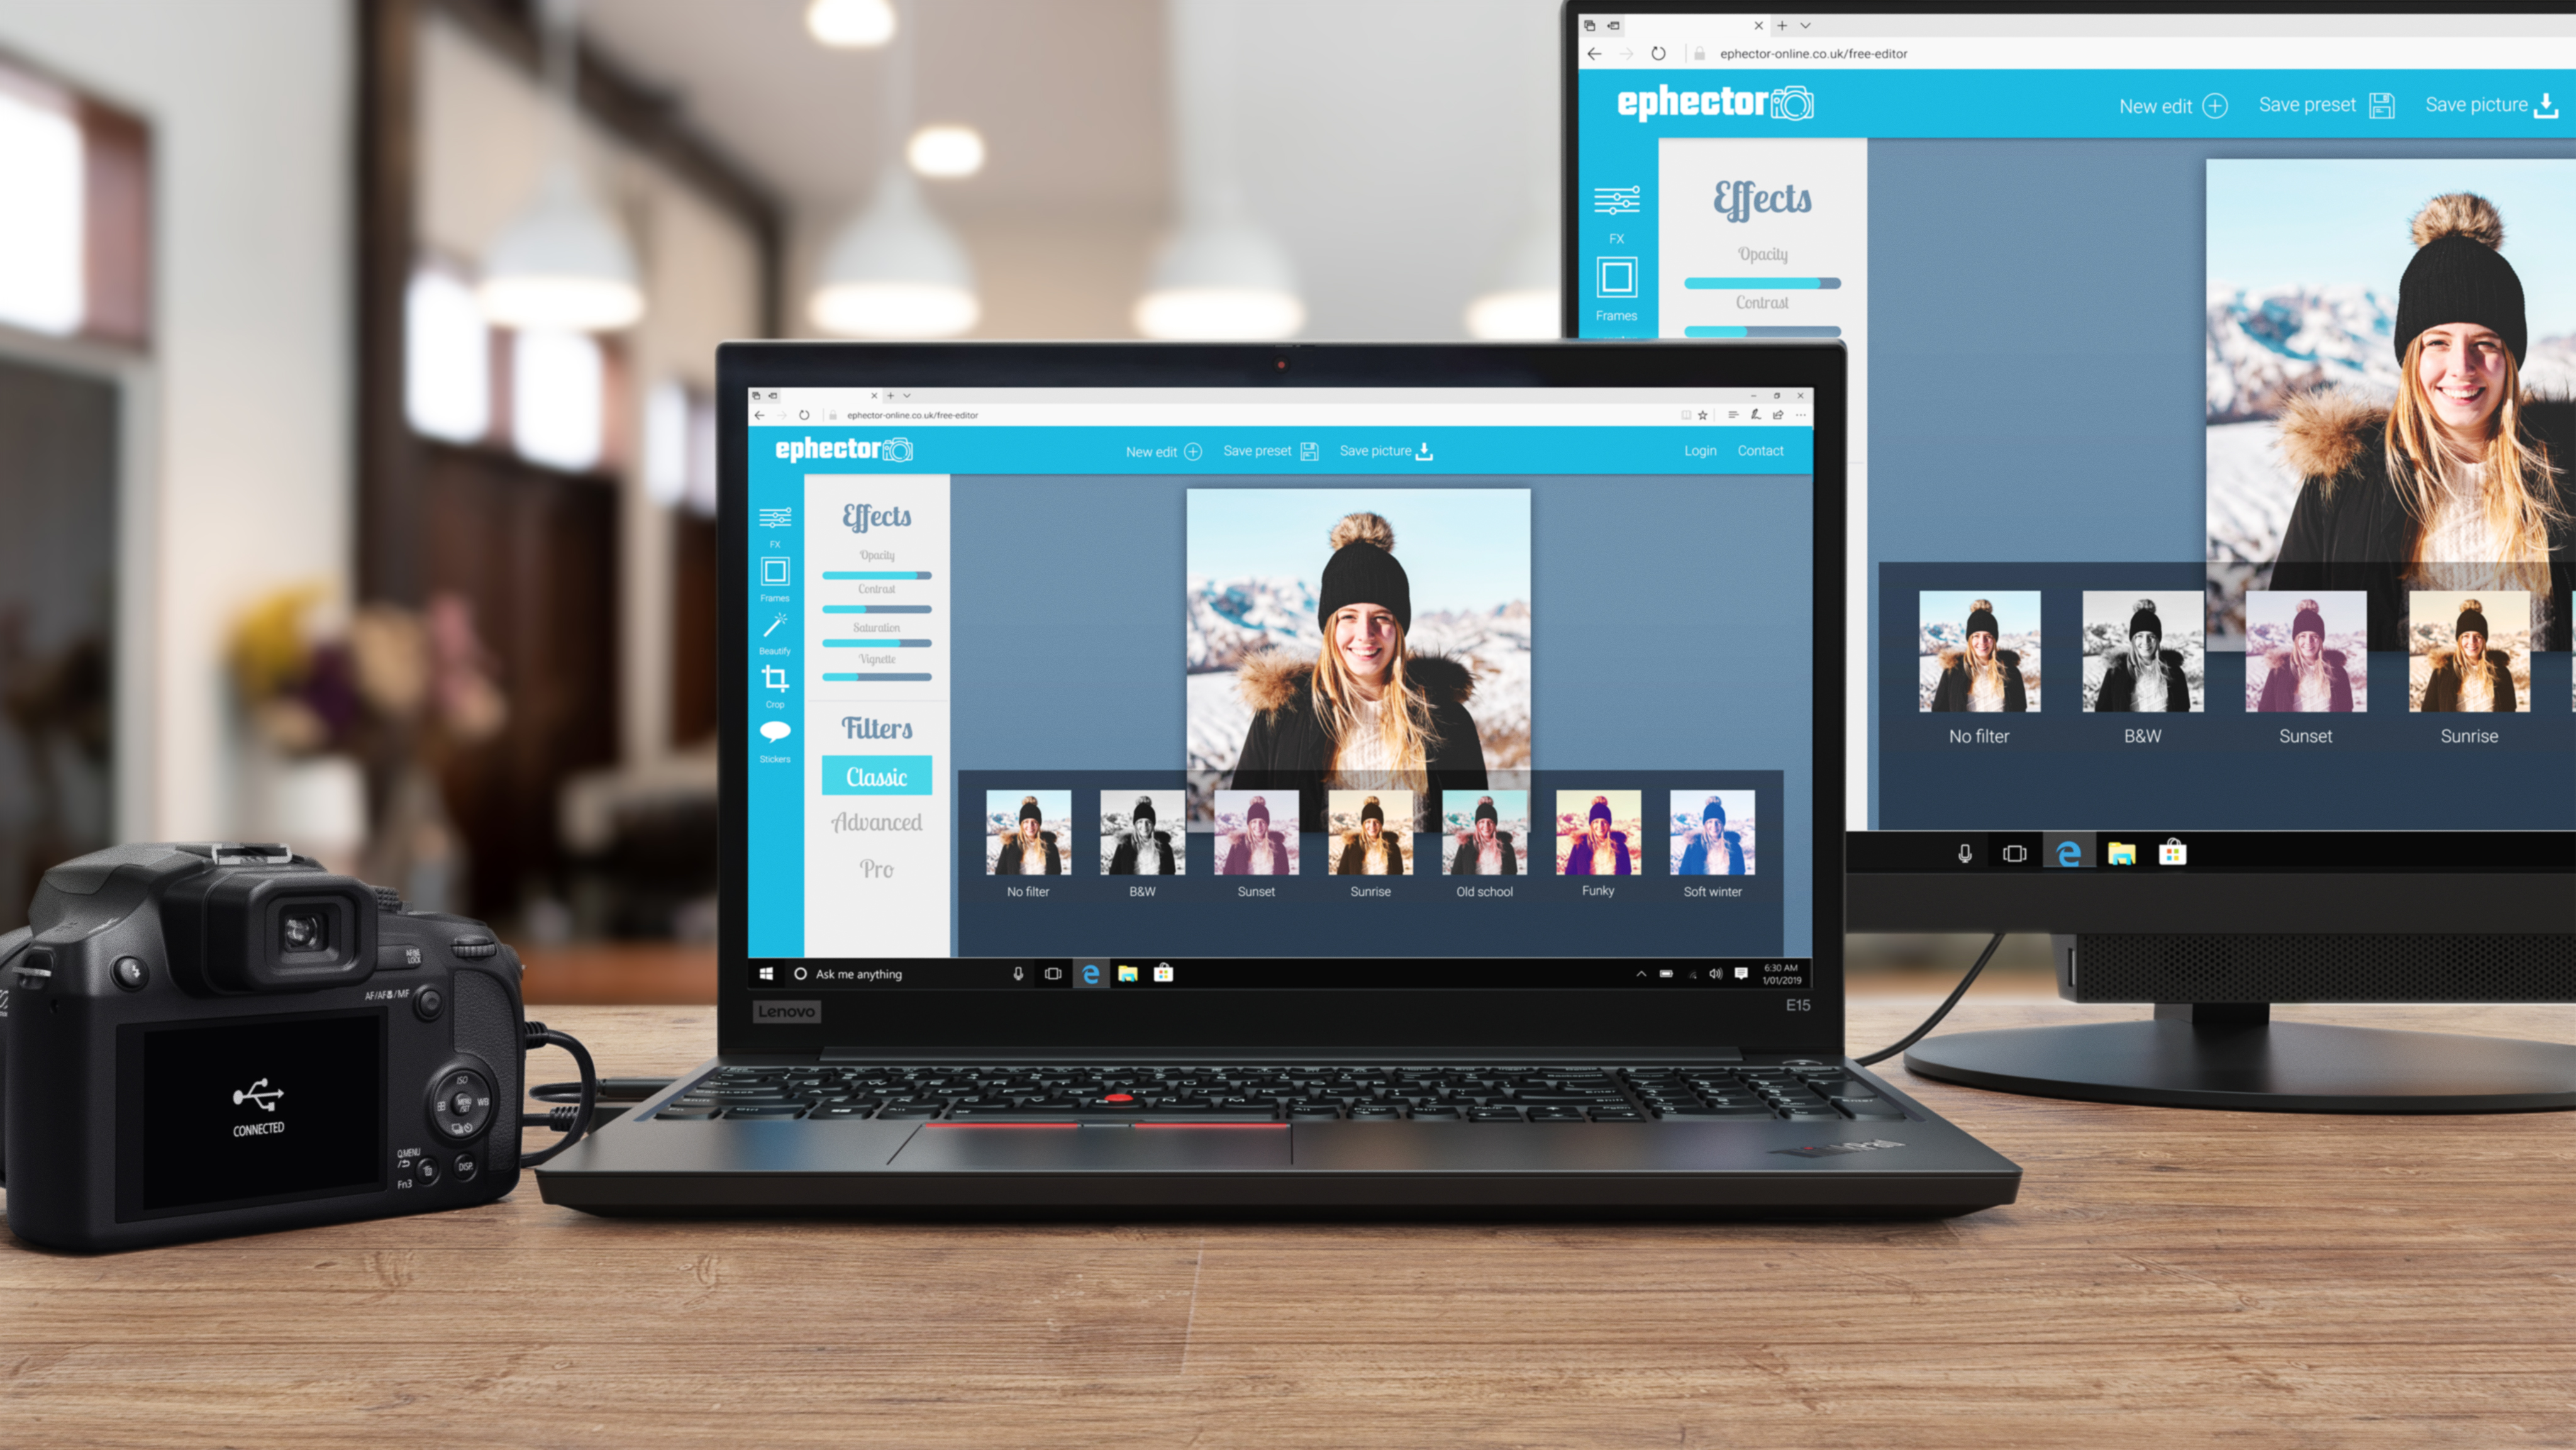
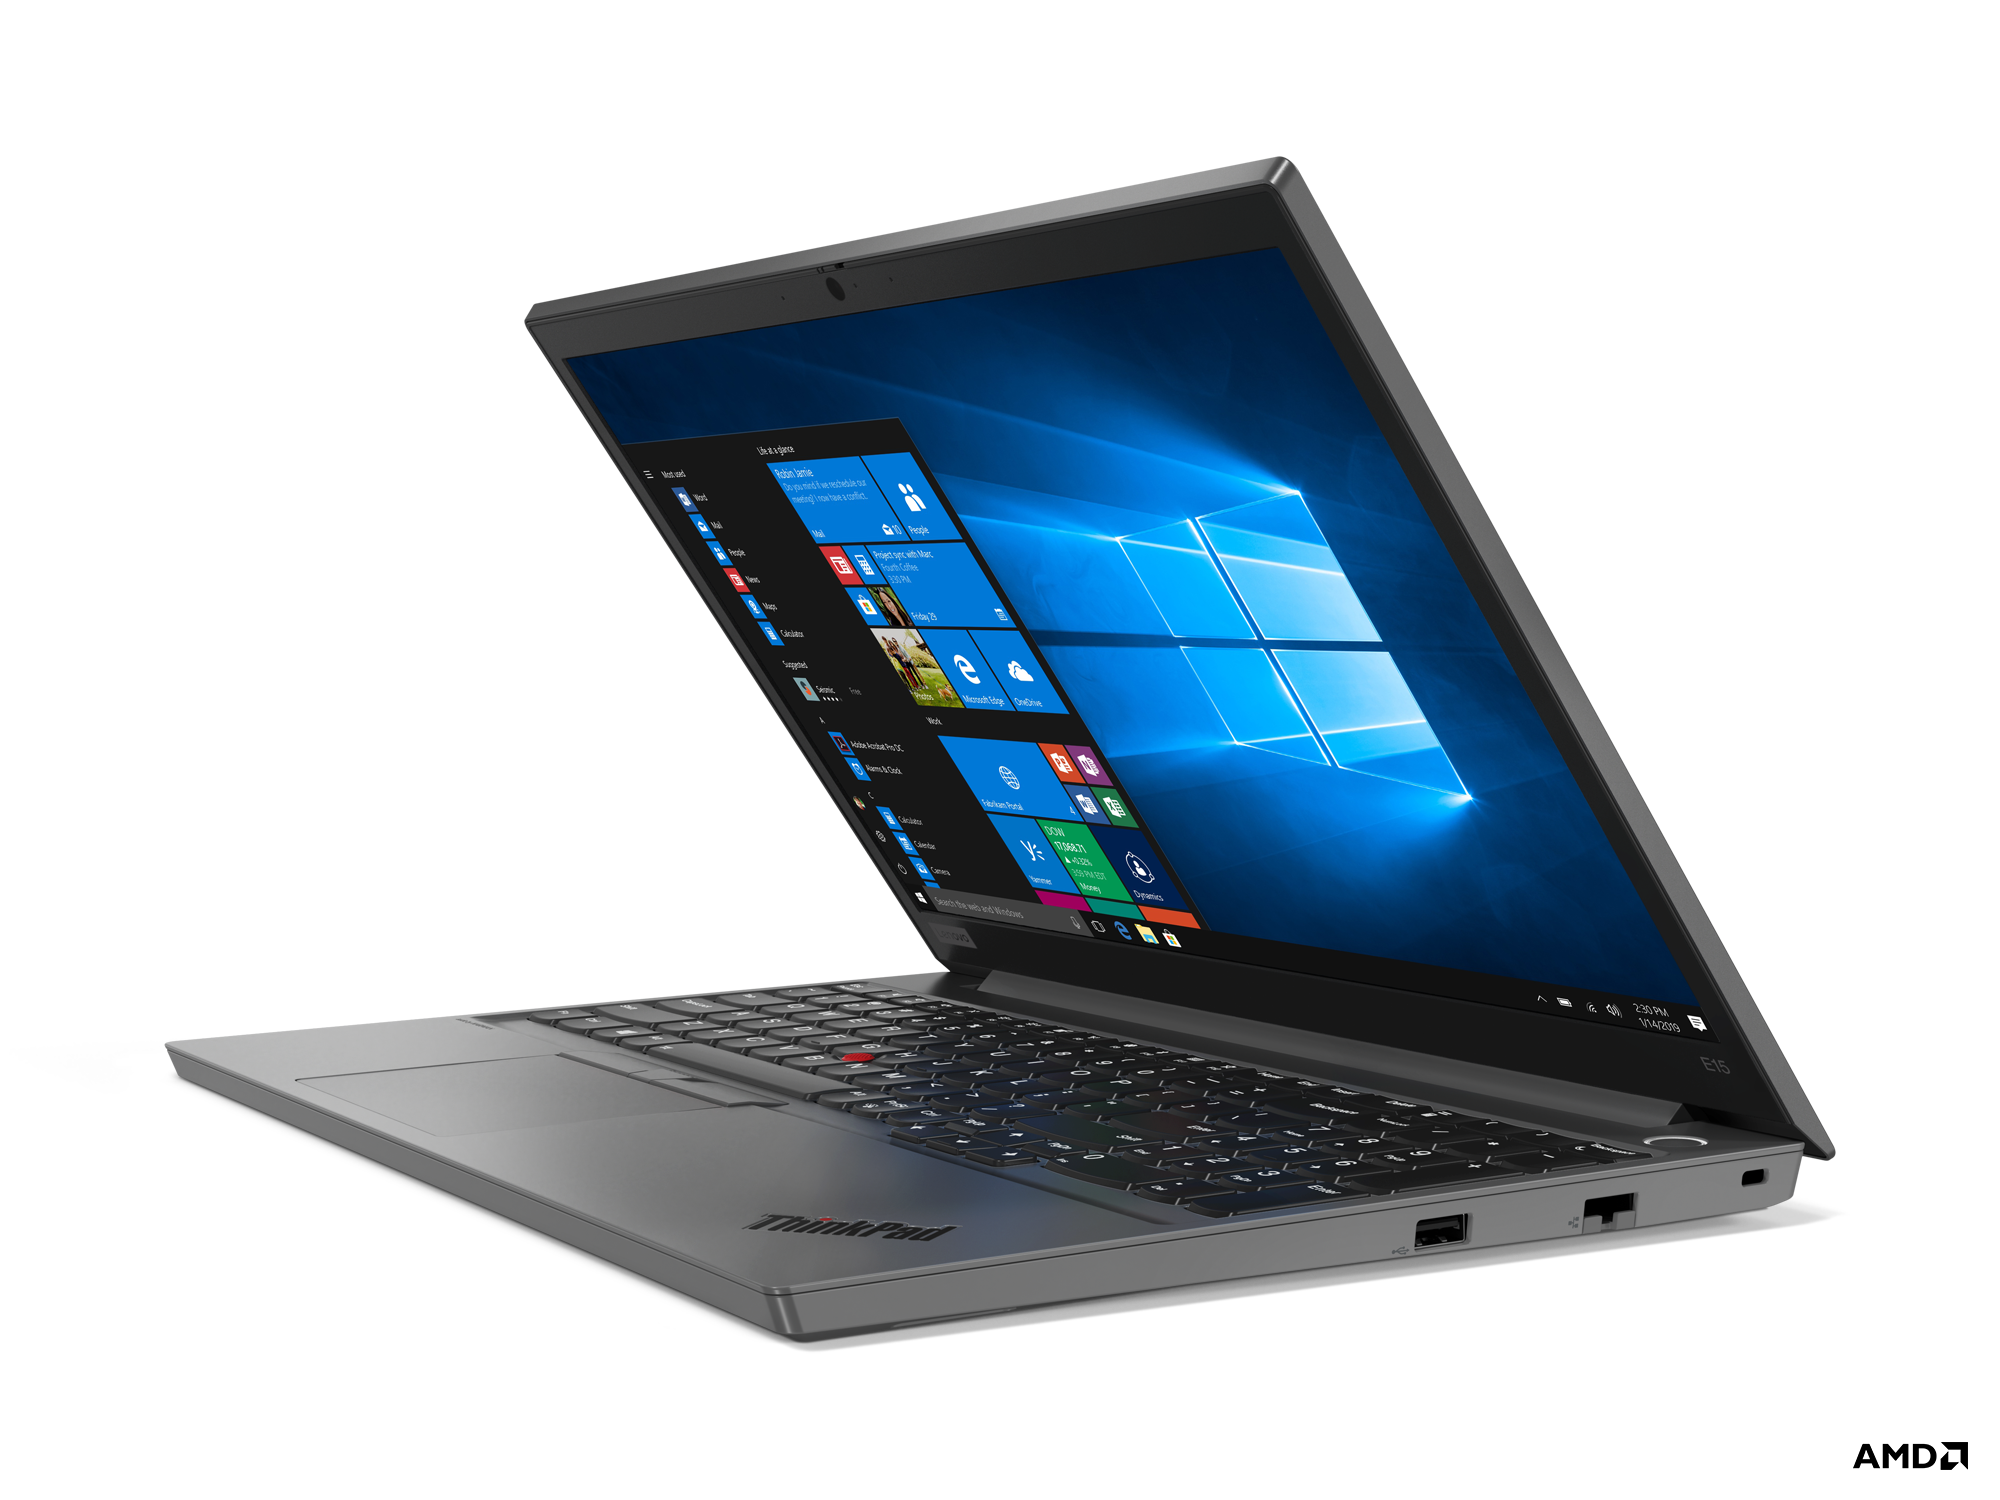
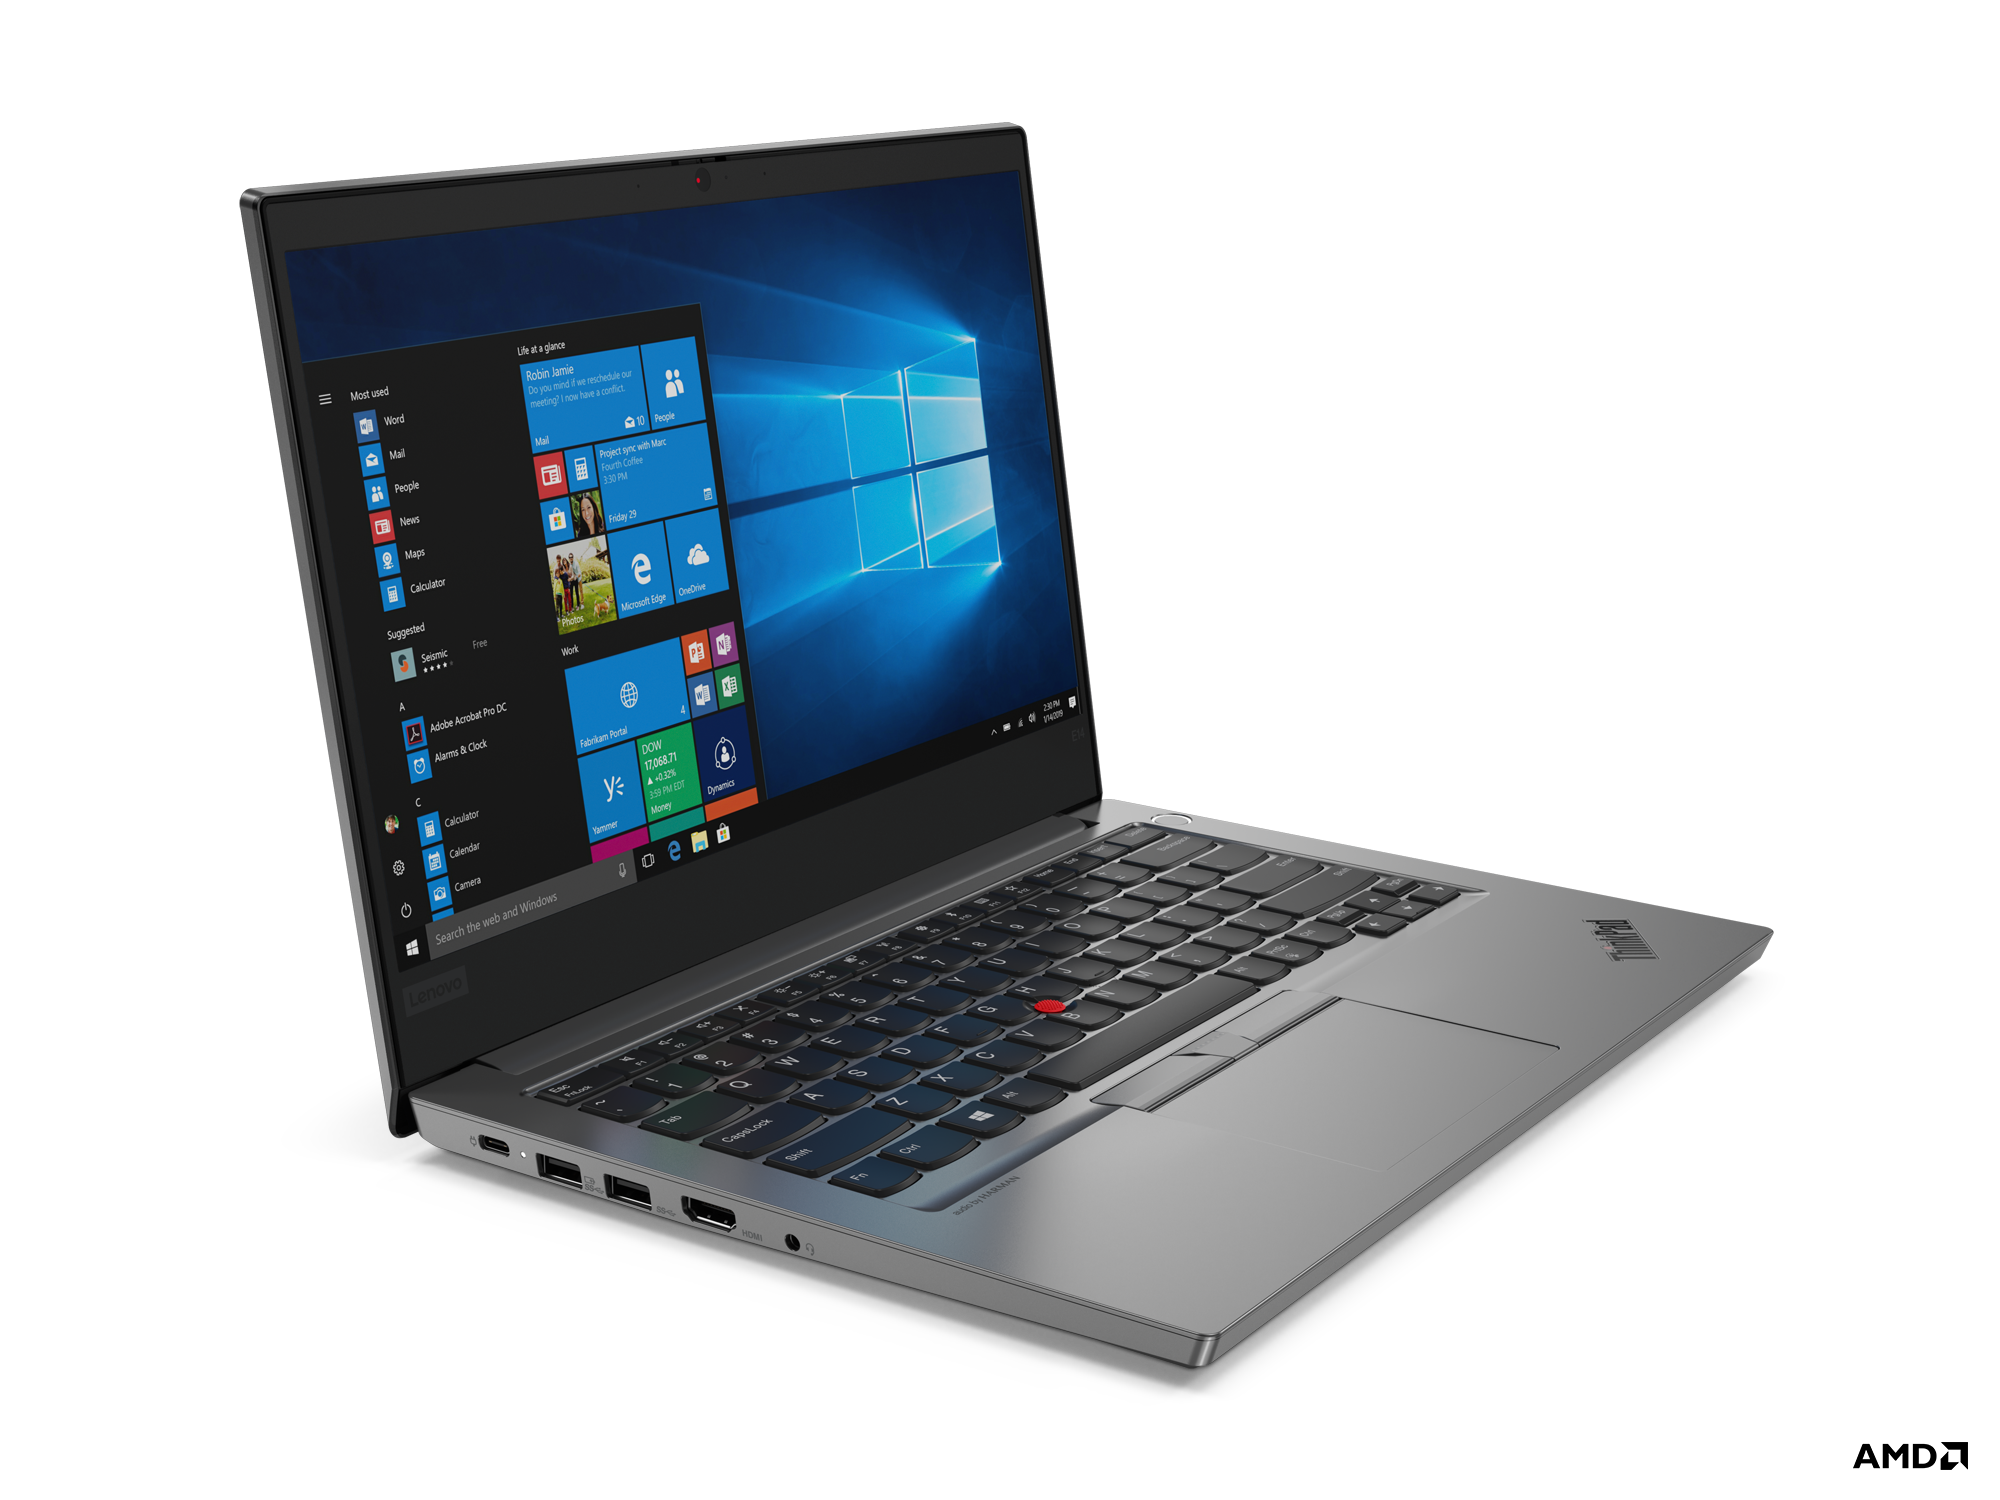
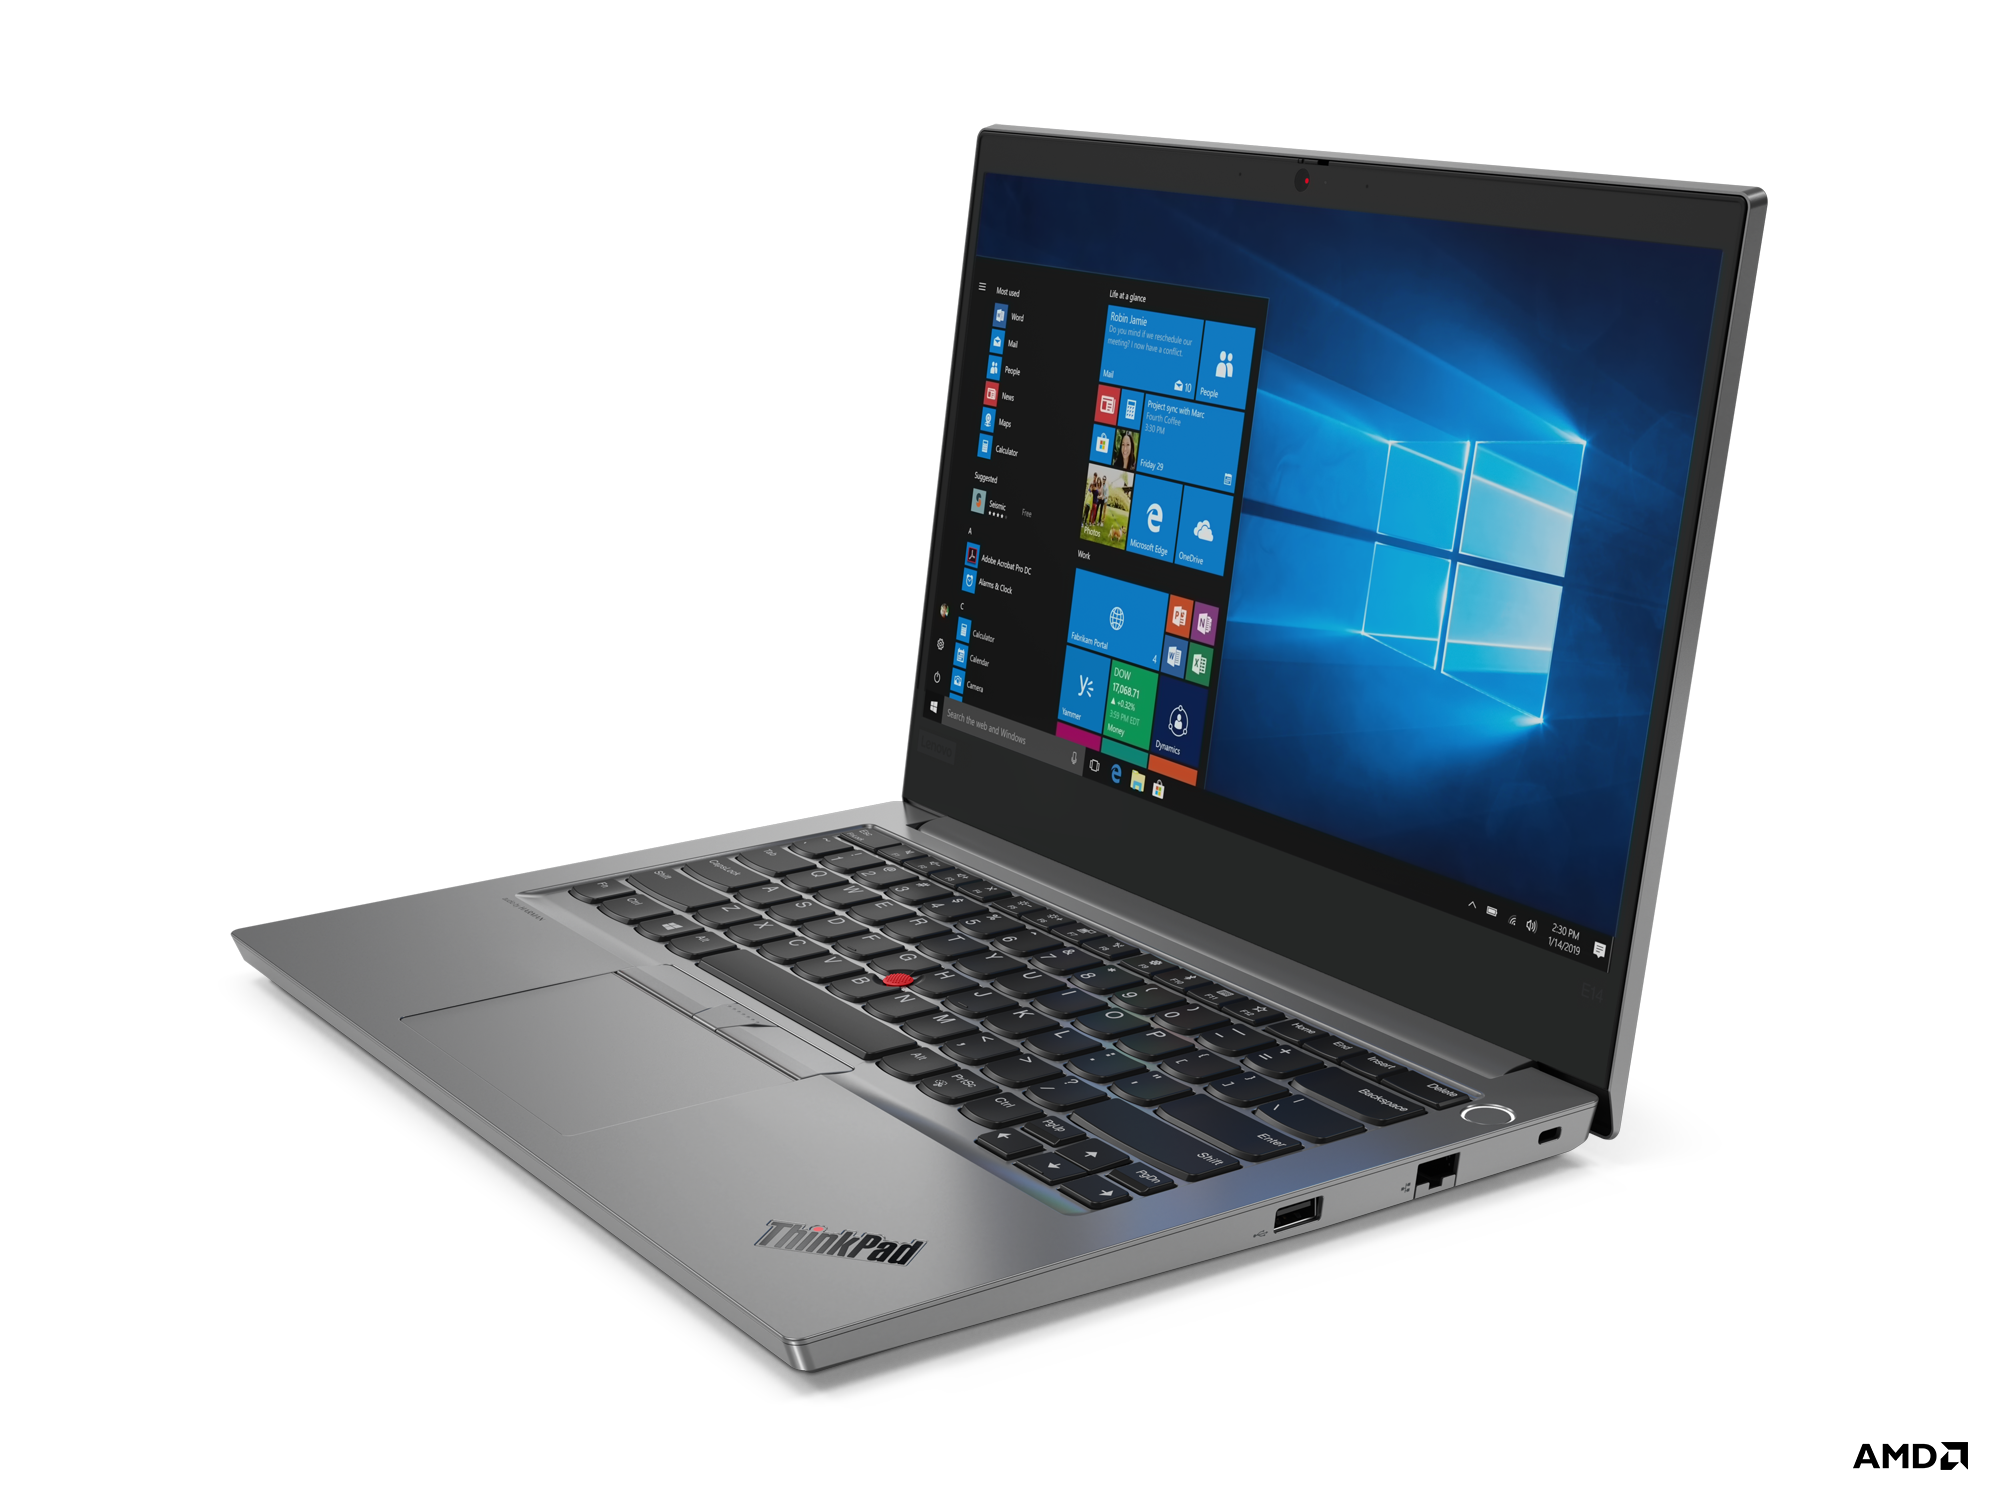
The two new entries: the ThinkPad E14 and ThinkPad E15 come equipped with the AMD Ryzen processors ranging from the Ryzen 3 to the Ryzen 7. These processors come with an integrated AMD Radeon graphics processor which provides enough power for regular day to day graphics and data processing. The processors are complemented with support for up to 24GB of RAM. 8GB of the RAM is soldered with an extra slot for users to add up to 16GB of RAM. On the memory side of things, the ThinkPad E14 and E15 both are able to support a dual SSD setup with up to 1.5TB of combined space. By default, the laptops come with up to 512GB of memory. The second SSD is an optional add on with support for up to 1TB of memory.

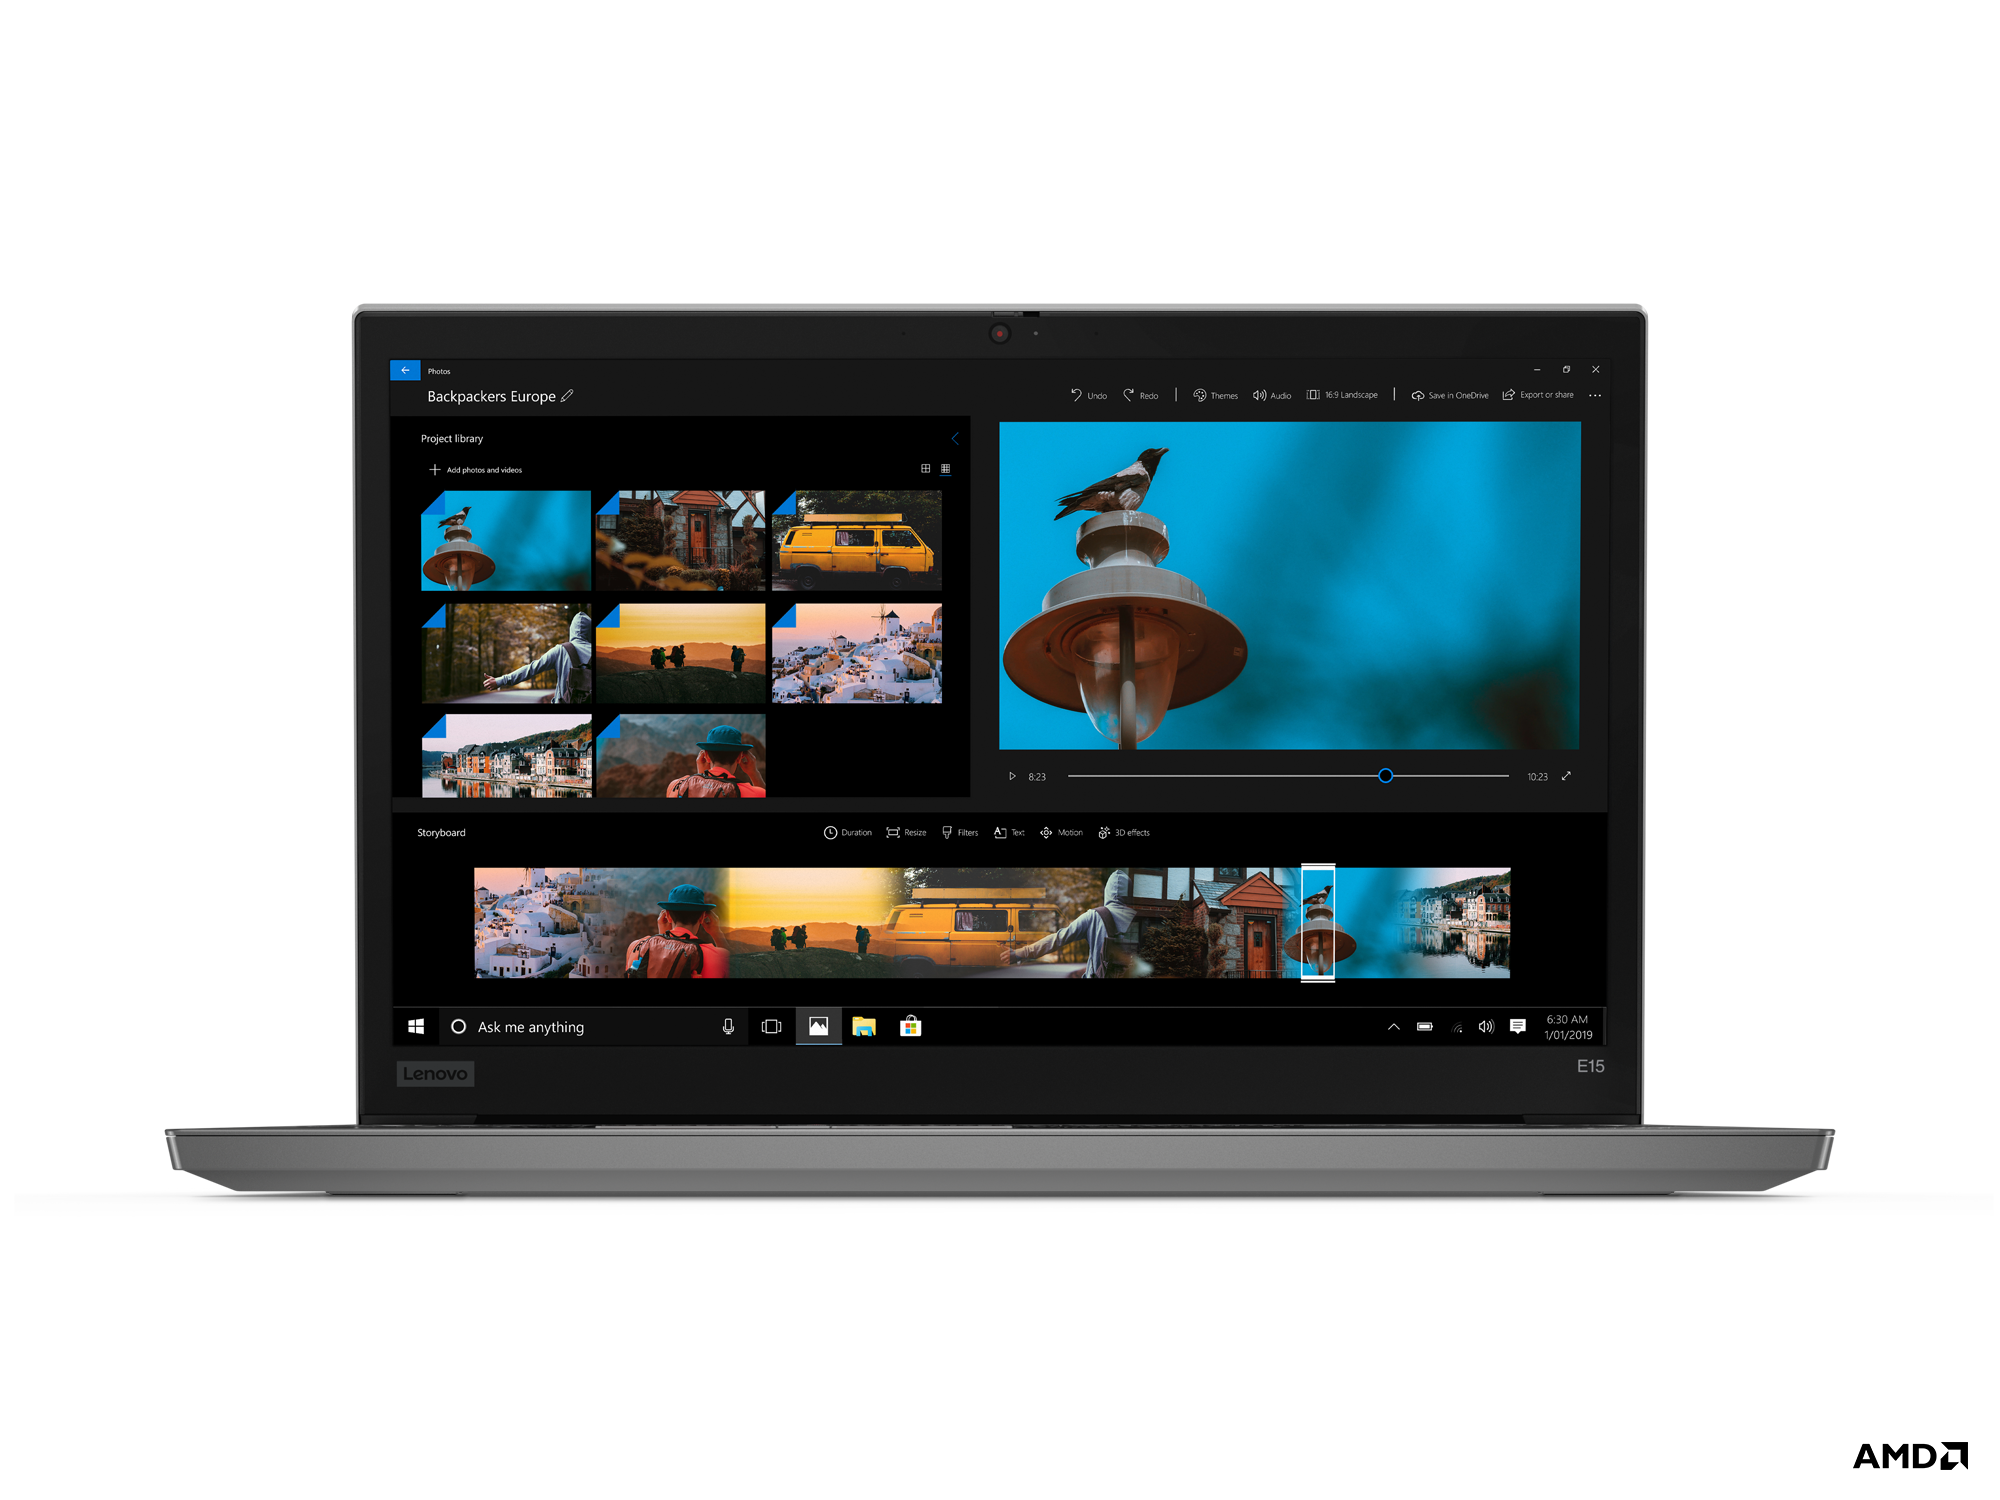
When it comes to display, the ThinkPad E14 comes with a 14-inch, Full HD screen; users have the option of a higher contrast IPS display or a TN display. Similarly, the ThinkPad E15 comes with a 15.6-inch display with the same options. Both laptops come with dual 2W Harman speakers with Dolby Atmos certification and a dual array microphone for conference calls. In fact, the laptops are optimised for conference calls with quick shortcut functions for answering and hanging up on con-calls directly on the keyboard. To complement this, the laptops come equipped with a 720p webcam with an optional Infrared function.

If privacy is a concern with the 720p webcam, Lenovo has got you covered with Lenovo’s built-in ThinkShutter allows you to cover the webcam when it’s not in use. However, the webcam is also used to keep your data secure by locking your laptop when you walk away and unlocking when you return. This, of course, works with Windows Hello and will require the IR sensor to work.

Other than that, the laptop comes with a few Lenovo staples including the spill-resistant keyboard and also the slim form factor that has now become ubiquitous with the ThinkPad brand. Both also support WiFi 6 connectivity.

Pricing and Availability

The ThinkPad E14 and ThinkPad E15 are already available in Malaysia with prices starting at MYR3,499 and MYR3,449 respectively.

The laptops are available via their official partner, SNS Network (M) Sdn Bhd. Customers can make their order in one of three ways:

  • Head to their head office in Petaling Jaya at C-11-2, Block C, 3 Two Square, Jalan 19/1, 46300 Petaling Jaya.
  • Email sales@sns.com.my
  • or call 018-2028616

Investment in ‘new infrastructure’ projects rises in Binhai

BEIJING, June 24, 2020 — A news report from China Daily:

Construction began on 14 key projects in Tianjin’s Binhai New Area on June 5.

The projects cover a variety of areas, including 5G networks, artificial intelligence, smart cities, intelligent transportation, industrial inter-connectivity and innovation.

With a total investment of 1.39 billion yuan ($196.45 million), the projects, which can be described as “new infrastructure”, are expected to support Binhai’s industrial upgrading and high-quality growth.

For the first time, the phrase “new infrastructure” was mentioned in the annual Government Work Report delivered in this year’s national legislative session.

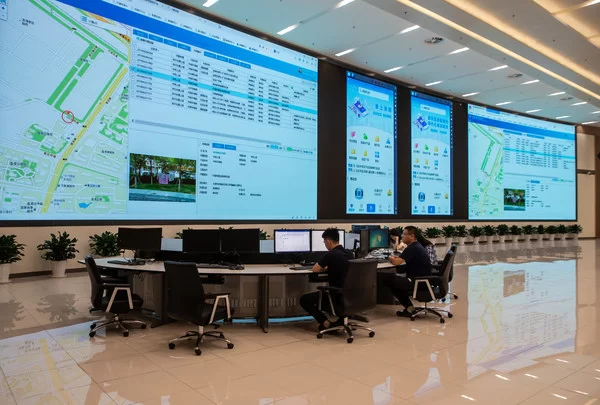
Intelligent Binhai Operation and Management Center [Photo from Binhai New Area]


One of the highlights of these projects is a 280-mu (18.67 hectares) data center invested by China’s tech giant Tencent. According to Feng Hu, general manager of Tencent’s Tianjin branch, 10 billion yuan will be invested in the project, and the center will be equipped with 300,000 servers and Tencent’slatest T-block technology.

Upon its completion, the project will be one of Tencent’s eight data centers in China and play a key role in a national cloud computing center and cloud service platform.It will support the internet giant’s business in North China and serving internet users all over the country while providing comprehensive cloud platform services to third-party enterprises.

According to Feng, the first phase is expected to be put into use next June withall the servers of the center installed in the following five to eight years.

Tianjin MeitengTechnology Co, a national high-tech enterprise, said it will expand its presence in Sino-Singapore Tianjin Eco-City.

“We will invest to build asci-tech research and development center and intelligent manufacturing plant in the eco city, and Meitengwill make greater contributions to the intellectualization of industry and mining in the future,” said Li Taiyou, chairman of the company.

In recent years, the company has witnessed leapfrog development and has established strategic cooperation with the Chinese Academy of Sciences, Ali-Cloud, the cloud computing arm of Alibaba Group, and leading high-tech firms Siemens and Advantech, reporting rapid growth in its operating revenue.

Among the new projects, there are many AI-backed projects that have much to do with people’s livelihoods, such as a smart community called Jijingfengge in the eco-city.

The project was built by Singapore-based property company Keppel Land, which will roll out guidelines for smart communities and improve management services and utilization of social resources to better satisfy residents’ demands.

Meanwhile, a total of 30 AI-powered application scenarios, which cover more than 50 functions, will be applied to enhance self-governance, health services, safety and ecology as well as property management in the community.

Other projects in progress include Huawei’s intelligent transportation project, China Mobile’s 5G coverage projects for the marine museum and a library of the eco-city, an operation center of a smart city project by China Electronics Technology Group Corporation, and IFLYTEK’s AI scheduling platform that serves as the “brain” of an eco-city.


Cellular is now the most cost-effective way to connect IoT devices to cloud, Cavli Wireless launches Hubble99

Companies will no longer be in a dilemma to adopt cellular technologies for their IoT deployments. Cellular IoT is entering the subscription economy age, and Cavli Wireless is spearheading this disruption with Hubble99.

SAN JOSE, California, June 24, 2020 — Cavli Wireless, a cellular module manufacturer headquartered in California with operations in Europe, Middle East and Asia, is set to change the face of global IoT deployments by launching a disruptive IoT adoption plan – Cavli Hubble99.

jwplayer.key=”3Fznr2BGJZtpwZmA+81lm048ks6+0NjLXyDdsO2YkfE=”


jwplayer(‘myplayer1’).setup({file: ‘https://www.youtube.com/watch?v=rFAP9anH0z8’, image: ‘http://www.prnasia.com/video_capture/3041879_AE41879_1.jpg’, autostart:’false’, aspectratio: ’16:9′, stretching : ‘fill’, width: ‘512’, height: ‘288’});

IoT connectivity enablement is a multi-stakeholder ecosystem that includes module manufacturers, telecom operators, and platform providers to manage the hardware, connectivity, and subscriptions. Currently for SMBs and Enterprises, the total cost of ownership of adopting cellular technologies is high compared to other options like LoraWAN, Sigfox or Weightless. This is driven by the expenses for Cellular Module, SIM card, data, and device management respectively.

Hubble99 is Cavli’s attempt to simplify the current fragmented IoT ecosystem by re-engineering the present value chain and thereby pave the way for the next billion devices to get connected with ease. The Hubble99 subscription plan bundles eSIM integrated cellular IoT modules preloaded with global LTE or LPWAN connectivity, device & subscription management with messaging infrastructure. With no separate cost for connectivity hardware, customers save up to 50% in the first year. Customers get to choose from cellular technologies like LTE-CAT4/CAT1/GSM, NB-IoT, LTE-M coverage in 160, 23 and 8 countries respectively and increasing. Cavli aims to revolutionize cellular IoT by providing the most cost-effective and scalable plan for mass IoT deployments.

Quoting John Mathew, CEO of Cavli Wireless, “We believe that connecting every object in the physical world to the internet will, seamlessly and efficiently solve a wide variety of problems and massively improve quality of life and human productivity. This is the true power of the ‘Internet of Things’ and with Hubble99, we want to deliver this power to businesses around the world.”

Cavli Wireless, Inc.
Cavli Wireless is an Internet of Things enabler, that aims to democratize the IoT sector with Software to Hardware product suite, including Cellular Modules, global connectivity, and Cloud Platform. Cavli portfolio of solutions enable IoT product makers & enterprises to build, connect and scale their IoT solutions across geographies in the most secure, and seamless manner possible.

Contact Details:
Ajit Thomas, CMO, ajit@cavliwireless.com, +1-650-535-1150

Hubble99: The world's first truly global IoT adoption plan
Hubble99: The world’s first truly global IoT adoption plan

Video – https://www.youtube.com/watch?v=rFAP9anH0z8  
Photo – https://techent.tv/wp-content/uploads/2020/06/cellular-is-now-the-most-cost-effective-way-to-connect-iot-devices-to-cloud-cavli-wireless-launches-hubble99-1.jpg  
Logo – https://techent.tv/wp-content/uploads/2020/06/cellular-is-now-the-most-cost-effective-way-to-connect-iot-devices-to-cloud-cavli-wireless-launches-hubble99.jpg

Cellular IoT will never be the same

Yiren Digital Reports First Quarter 2020 Financial Results

BEIJING, June 24, 2020 — Yiren Digital Ltd. (NYSE: YRD) (“Yiren Digital” or the “Company”), a leading fintech company in China, today announced its unaudited financial results for the first quarter ended March 31, 2020.

First Quarter 2020 Operational Highlights

Wealth Management—Yiren Wealth

  • Cumulative number of investors served reached 2,218,181 as of March 31, 2020, representing an increase of 0.3% from 2,210,530 as of December 31, 2019 and compared to 2,159,771 as of March 31, 2019.
  • Number of current investors was 220,568 as of March 31, 2020, representing a decrease of 10.5% from 246, 561 as of December 31, 2019.
  • Number of current non-P2P investors was 26,346 as of March 31, 2020, representing an increase of 23.3% from 21,360 as of December 31, 2019 and compared to 19,236 as of March 31, 2019.
  • Total assets under administration (“AUA”) for P2P products on Yiren Wealth was RMB 30,536.4 million (US$ 4,312.6 million) as of March 31, 2020, representing a decrease of 10.9% from RMB 34,264.8 million as of December 31, 2019, and compared to RMB 46,236.7 million as of March 31, 2019. 
  • Total AUA for non-P2P products on Yiren Wealth was RMB 1,713.1 million (US$241.9 million) as of March 31, 2020, representing an increase of 66.8% from RMB 1,026.9 million as of December 31, 2019 and compared to RMB 424.9 million as of March 31, 2019.
  • Sales volume of non-P2P products amounted to RMB 2,163.3 million (US$ 305.5 million) in the first quarter of 2020, representing a decrease of 15.1% from RMB 2,548.4 million in the fourth quarter of 2019 and compared to RMB 328.7 million in the same period of 2019.

Consumer Credit—Yiren Credit

  • Total loan originations in the first quarter of 2020 reached RMB 1.8 billion (US$0.3 billion), representing a decrease of 77.0% from RMB 8.0 billion in the fourth quarter of 2019 and compared to RMB 10.9 billion in the first quarter of 2019.
  • Cumulative number of borrowers served reached 4,810,184 as of March 31, 2020, representing an increase of 2.4% from 4,695,487 as of December 31, 2019 and compared to 4,405,115 as of March 31, 2019.
  • Number of borrowers served in the first quarter of 2020 was 115,420, representing a decrease of 8.1% from 125,622 in the fourth quarter of 2019 and compared to 149,715 in the first quarter of 2019.
  • The percentage of loan volume generated by repeat borrowers was 4.9% in the first quarter of 2020.
  • 51.4% of loan originations were generated online in the first quarter of 2020.
  • Total outstanding principal balance of performing loans reached RMB 42,063.0 million (US$ 5,940.4 million) as of March 31,2020, representing a decrease of 17.8% from RMB 51,157.3 million as of December 31, 2019.

“During this unprecedented time, our core businesses remained stable while we made substantial progress to diversify and enrich our business lines as we continue our business transformation into China’s leading digital financial service platforms for consumers.” said Mr. Ning Tang, Chairman and Chief Executive Officer of Yiren Digital. “We are making good progress in expanding our creditech business with new products and services and through rapidly ramping up institutional funding. Meanwhile, our wealth management has seen strong growth despite the pandemic situation, especially for non-P2P wealth management products and services.

“For credit business, we have rolled out a series of new products to provide a full spectrum of credit services and meet broader needs for mainstream consumers’ daily financing, including small-ticket-shorter-tenor loans, auto loans and SME loans. For the micro and small loans, we launched our products and services partnering with online consumption platforms. To fully leverage our nationwide service network coverage, we have rolled out auto loans targeted at second-handed cars, and the business has shown encouraging early growth momentum.”

“On the wealth management front, non-P2P products are increasingly popular among investors and have seen strong growth. As of March 31, 2020, the total AUA for non-P2P products on Yiren Wealth grew to RMB 1,713.1 million, representing a 66.8% quarter-over-quarter growth and 303.2% year-over-year growth. Particularly we see strong demand of our fund products during the first quarter, with a 56.8% quarter-over-quarter growth of AUA driven by our new product offerings and also customers’ strong demand, we expect this growth trends to continue through the year.”

“Under the challenging operating environment amid the pandemic in the first quarter of 2020, we maintained strong liquidity and profitability,” said Mr. Zhong Bi, Chief Financial Officer of Yiren Digital. “Despite significant business volume drop during the quarter, our strong cost control and operation efficiency efforts have kept our business at a profit and good cash position. Our cash and cash equivalents remained stable at RMB 3.2 billion. Our usable cash maintained at a healthy level at RMB 3.6 billion and we believe we are on solid footing in the dynamic environment.”

“For credit performance and the risk management, overall, early delinquencies increased in the first quarter and reached its peak at the end of March due to the pandemic situation before it quickly declined in April and returned to near pre-pandemic level in May.” said Mr. Michael Ji, Chief Risk Officer of Yiren Digital. “Visible progress has been made in prioritizing our business toward higher-quality customers, which was reflected in risk performance and we are glad to see essential improvement trend in 2019 and we expect a more substantially improved trend in 2020.”

First Quarter 2020 Financial Results

Total amount of loans facilitated in the first quarter of 2020 was RMB 1,839.5 million (US$259.8 million), compared to RMB 10,934.9 million in the same period last year. As of March 31, 2020, the total outstanding principal amount of the performing loans was RMB 42.1 billion (US$5.9 billion), decreased by 17.8% from RMB 51.2 billion as of December 31 2019.

Total net revenue in the first quarter of 2020 was RMB 1,023.7 million (US$144.6 million), compared to RMB 1,980.4 million in the same period last year. Revenue from Yiren Credit reached RMB 607.8 million (US$ 85.8 million), representing a decrease of 58.3% from RMB 1,459.0 million in the first quarter of 2019. Revenue from Yiren Wealth reached RMB 415.9 million (US$58.7 million), representing a decrease of 20.2% from RMB 521.4 million in the first quarter of 2019.

Sales and marketing expenses in the first quarter of 2020 were RMB 616.4 million (US$87.1 million), compared to RMB 1,127.9 million in the same period last year. Sales and marketing expenses in the first quarter of 2020 accounted for 33.5% of the total amount of loans facilitated, as compared to 10.3% in the same period last year mainly due to the decline of loan volume.

Origination and servicing costs in the first quarter of 2020 were RMB 102.9 million (US$14.5 million), compared to RMB 172.1 million in the same period last year. Origination and servicing costs in the first quarter of 2020 accounted for 5.6% of the total amount of loans facilitated, compared to 1.6% in the same period last year due to the decline of loan volume.

General and administrative expenses in the first quarter of 2020 were RMB 149.0 million (US$21.0 million), compared to RMB 257.7 million in the same period last year. General and administrative expenses in the first quarter of 2020 accounted for 14.6% of the total net revenue, compared to 13.0% in the same period last year.

Allowance for contract assets and receivables in the first quarter of 2020 were RMB 143.4 million (US$20.3 million), compared to RMB 191.1 million in the same period last year.

Income tax expense in the first quarter of 2020 was RMB 3.9 million (US$0.6 million).

Net income in the first quarter of 2020 was RMB 19.2 million (US$2.7 million), compared to RMB 369.1 million in the same period last year. 

Adjusted EBITDA (non-GAAP) in the first quarter of 2020 was RMB 29.8 million (US$4.2 million), compared to an adjusted EBITDA of RMB 469.0 million in the same period last year. Adjusted EBITDA margin[1] (non-GAAP) in the first quarter of 2020 was 2.9%, compared to 23.7% in the same period last year.

Basic income per ADS in the first quarter of 2020 was RMB 0.21 (US$0.03), compared to a basic income per ADS of RMB 3.99 in the same period last year.

Diluted income per ADS in the first quarter of 2020 was RMB 0.21 (US$0.03), compared to a diluted income per ADS of RMB 3.96 in the same period last year.

Net cash generated from operating activities in the first quarter of 2020 was RMB 557.8 million (US$78.8 million), compared to net cash used in operating activities of RMB 658.4 million in the same period last year.

Net cash used in investing activities in the first quarter of 2020 was RMB 524.5 million (US$74.1 million), compared to RMB 249.9 million in the same period last year.

As of March 31, 2020, cash and cash equivalents was RMB 3,195.0 million (US$451.2 million), compared to RMB 3,198.1 million as of December 31, 2019. As of March 31, 2020, the balance of held-to-maturity investments was RMB 4.4 million (US$0.6 million), compared to RMB 6.6 million as of December 31, 2019. As of March 31, 2020, the balance of available-for-sale investments was RMB 456.1 million (US$64.4 million), compared to RMB 461.0 million as of December 31, 2019.

Delinquency rates. As of March 31, 2020, the delinquency rates for loans that are past due for 15-29 days, 30-59 days and 60-89 days were 1.6%, 4.1%, and 3.2%, respectively compared to 1.2%, 2.0%, and 1.7%,as of December 31, 2019. 

Cumulative M3+ net chargeoff rates. As of March 31, 2020, the cumulative M3+ net charge-off rate for loans originated in 2017 was 16.5%, compared to 16.0% as of December 31, 2019. As of March 31, 2020, the cumulative M3+ net charge-off rate for loans originated in 2018 was 15.8%, compared to 13.8% as of December 31, 2019. As of March 31, 2020, the cumulative M3+ net charge-off rate for loans originated in 2019 was 5.2%, compared to 3.1% as of December 31, 2019.

[1] Adjusted EBITDA margin is a non-GAAP financial measure calculated as adjusted EBITDA divided by total net revenue.

Accounting Policy Change

Effective January 1, 2020, the Company adopted ASU No. 2016-13, Financial Instruments—Credit Losses (Topic 326): Measurement of Credit Losses on Financial Instruments. This guidance replaces the existing “incurred loss” methodology, and introduces a forward-looking expected loss approach referred to as a current expected credit losses (“CECL”) methodology. Under the incurred loss methodology, credit losses are recognized only when the losses are probable of having been incurred. The CECL methodology requires that the full amount of expected credit losses for the lifetime be recorded at the time the financial asset is originated or acquired, and adjusted for changes in expected lifetime credit losses subsequently, which requires earlier recognition of credit losses.

The CECL methodology is applicable to estimation of credit losses of financial assets measured at amortized cost, primarily including accounts receivable, contract assets, financing receivables and other receivables. As a result, the Company recognized the cumulative effect as a decrease of approximately RMB 26.1 million to the opening balances of accumulated deficit on January 1, 2020.

Non-GAAP Financial Measures

In evaluating the business, the Company considers and uses several non-GAAP financial measures, such as adjusted EBITDA and adjusted EBITDA margin as supplemental measures to review and assess operating performance. We believe these non-GAAP measures provide useful information about our core operating results, enhance the overall understanding of our past performance and prospects and allow for greater visibility with respect to key metrics used by our management in our financial and operational decision-making. The presentation of these non-GAAP financial measures is not intended to be considered in isolation or as a substitute for the financial information prepared and presented in accordance with accounting principles generally accepted in the United States of America (“U.S. GAAP”). The non-GAAP financial measures have limitations as analytical tools. Other companies, including peer companies in the industry, may calculate these non-GAAP measures differently, which may reduce their usefulness as a comparative measure. The Company compensates for these limitations by reconciling the non-GAAP financial measures to the nearest U.S. GAAP performance measure, all of which should be considered when evaluating our performance. See “Operating Highlights and Reconciliation of GAAP to Non-GAAP measures” at the end of this press release.

Currency Conversion

This announcement contains currency conversions of certain RMB amounts into US$ at specified rates solely for the convenience of the reader. Unless otherwise noted, all translations from RMB to US$ are made at a rate of RMB 7.0808 to US$1.00, the effective noon buying rate on March 31, 2020, as set forth in the H.10 statistical release of the Federal Reserve Board.

Conference Call

Yiren Digital’s management will host an earnings conference call at 8:00 p.m. U.S. Eastern Time on June 23, 2020 (or 8:00 a.m. Beijing/Hong Kong Time on June 24, 2020).

Participants who wish to join the call should register online in advance of the conference at:

http://apac.directeventreg.com/registration/event/2773237

Please note the Conference ID number of 2773237

Once registration is completed, participants will receive the dial-in information for the conference call, an event passcode, and a unique registrant ID number. 

Participants joining the conference call should dial-in at least 10 minutes before the scheduled start time.

A replay of the conference call may be accessed by phone at the following numbers until July 1, 2020:

International

+61 2-8199-0299

U.S.

+1 646-254-3697

Replay Access Code:

2773237

Additionally, a live and archived webcast of the conference call will be available at ir.yirendai.com.

Safe Harbor Statement

This press release contains forward-looking statements. These statements constitute “forward-looking” statements within the meaning of Section 21E of the Securities Exchange Act of 1934, as amended, and as defined in the U.S. Private Securities Litigation Reform Act of 1995. These forward-looking statements can be identified by terminology such as “will,” “expects,” “anticipates,” “future,” “intends,” “plans,” “believes,” “estimates,” “target,” “confident” and similar statements. Such statements are based upon management’s current expectations and current market and operating conditions and relate to events that involve known or unknown risks, uncertainties and other factors, all of which are difficult to predict and many of which are beyond Yiren Digital’s control. Forward-looking statements involve risks, uncertainties, and other factors that could cause actual results to differ materially from those contained in any such statements. Potential risks and uncertainties include, but are not limited to, uncertainties as to Yiren Digital’s ability to attract and retain borrowers and investors on its marketplace, its ability to introduce new loan products and platform enhancements, its ability to compete effectively, PRC regulations and policies relating to the peer-to-peer lending service industry in China, general economic conditions in China, and Yiren Digital’s ability to meet the standards necessary to maintain listing of its ADSs on the NYSE or other stock exchange, including its ability to cure any non-compliance with the NYSE’s continued listing criteria. Further information regarding these and other risks, uncertainties or factors is included in Yiren Digital’s filings with the U.S. Securities and Exchange Commission. All information provided in this press release is as of the date of this press release, and Yiren Digital does not undertake any obligation to update any forward-looking statement as a result of new information, future events or otherwise, except as required under applicable law.

About Yiren Digital

Yiren Digital Ltd. (NYSE: YRD) is a leading fintech company in China, providing both credit and wealth management services. For its credit business, the Company provides an effective solution to address largely underserved investor and individual borrower demand in China through online and offline channels to efficiently match borrowers with investors and execute loan transactions. Yiren Digital deploys a proprietary risk management system, which enables the Company to effectively assess the creditworthiness of borrowers, appropriately price the risks associated with borrowers, and offer quality loan investment opportunities to investors. Yiren Digital’s marketplace provides borrowers with quick and convenient access to consumer credit at competitive prices and investors with easy and quick access to an alternative asset class with attractive returns. For its wealth management business, the Company targets China’s mass affluent population and strives to provide customized wealth management services, with a combination of long-term and short-term targets as well as different types of investments, ranging from cash and fixed-income assets, to funds and insurance. For more information, please visit ir.Yirendai.com.

Unaudited Condensed Consolidated Statements of Operations

 (in thousands, except for share, per share and per ADS data, and percentages)


For the Three Months Ended 


March 31, 2019


March 31, 2020


March 31, 2020


RMB


RMB


USD

Net revenue:


Loan facilitation services

1,055,046


358,541


50,636

Post-origination services

296,279


146,520


20,693

Account management services

488,340


413,166


58,350

Others

140,743


105,433


14,890

Total net revenue

1,980,408


1,023,660


144,569

Operating costs and expenses:


Sales and marketing

1,127,945


616,441


87,058

Origination and servicing

172,123


102,918


14,535

General and administrative

257,707


149,041


21,049

Allowance for contract assets and receivables

191,104


143,385


20,250

Total operating costs and expenses

1,748,879


1,011,785


142,892

Other income/(expenses):


Interest income, net

23,875


25,116


3,547

Fair value adjustments related to Consolidated ABFE

34,998


(26,020)


(3,675)

Others, net

160,223


12,184


1,721

Total other income/(expenses)

219,096


11,280


1,593

Income before provision for income taxes

450,625


23,155


3,270

Share of results of equity investees

(4,957)


Income tax expense

76,534


3,936


556

Net income

369,134


19,219


2,714


Weighted average number of ordinary shares outstanding, basic

185,126,457


185,600,961


185,600,961

Basic income per share

1.9940


0.1036


0.0146

Basic income per ADS

3.9880


0.2072


0.0292


Weighted average number of ordinary shares outstanding, diluted

186,578,885


186,166,429


186,166,429

Diluted income per share

1.9784


0.1032


0.0146

Diluted income per ADS

3.9568


0.2064


0.0292


Unaudited Condensed Consolidated Cash Flow Data


Net cash (used in)/ generated from operating activities

(658,435)


557,762


78,771

Net cash used in investing activities

(249,931)


(524,479)


(74,070)

Net cash provided by/ (used in) financing activities

493,389


(65,637)


(9,270)

Effect of foreign exchange rate changes

(2,196)


1,206


170

Net decrease in cash, cash equivalents and restricted cash

(417,173)


(31,148)


(4,399)

Cash, cash equivalents and restricted cash, beginning of period

3,034,484


3,269,142


461,691

Cash, cash equivalents and restricted cash, end of period

2,617,311


3,237,994


457,292

Unaudited Condensed Consolidated Balance Sheets

 (in thousands)


As of


December 31, 2019


March 31, 2020


March 31, 2020


RMB


RMB


USD


        Cash and cash equivalents


3,198,086


3,194,993


451,219

        Restricted cash


71,056


43,001


6,073

        Accounts receivable


3,398


33,902


4,788

        Contract assets, net


2,398,685


1,873,548


264,596

        Contract cost


160,003


149,917


21,172

        Prepaid expenses and other assets


1,333,221


868,462


122,651

        Loans at fair value


418,492


313,267


44,242

        Financing receivables


29,612


33,381


4,714

        Amounts due from related parties


988,853


1,583,859


223,684

        Held-to-maturity investments


6,627


4,399


621

        Available-for-sale investments


460,991


456,061


64,408

        Property, equipment and software, net


195,855


188,880


26,675

        Deferred tax assets


45,407


42,084


5,943

        Right-of-use assets


334,134


291,028


41,101

Total assets


9,644,420


9,076,782


1,281,887

        Accounts payable


43,583


39,068


5,517

        Amounts due to related parties


106,645


112,034


15,822

        Liabilities from quality assurance program and guarantee


4,397


3,487


492

        Deferred revenue


358,203


254,933


36,003

        Accrued expenses and other liabilities


2,338,745


1,946,205


274,858

        Refund liability


1,801,535


1,760,942


248,692

        Deferred tax liabilities


218,888


216,304


30,549

        Lease liabilities


282,334


259,197


36,606

Total liabilities


5,154,330


4,592,170


648,539

        Ordinary shares


121


121


17

        Additional paid-in capital


5,038,691


5,045,268


712,528

        Treasury stock


(37,097)


(37,097)


(5,239)

        Accumulated other comprehensive income


21,855


18,671


2,637

        Accumulated deficit


(533,480)


(542,351)


(76,595)

Total (deficit)/ equity


4,490,090


4,484,612


633,348

Total liabilities and equity


9,644,420


9,076,782


1,281,887

Operating Highlights and Reconciliation of GAAP to Non-GAAP Measures

(in thousands, except for number of  borrowers, number of investors and percentages)


For the Three Months Ended 


March 31, 2019


March 31, 2020


March 31, 2020


RMB


RMB


USD

Operating Highlights


Amount of p2p investment


11,435,588


5,203,747


734,909

Number of p2p investors


200,780


78,256


78,256

Amount of non-p2p investment


328,708


2,163,313


305,518

Number of non-p2p investors


14,022


18,809


18,809

Amount of loans facilitated


10,934,923


1,839,454


259,781

Number of borrowers


149,715


115,420


115,420

Remaining principal of performing loans


63,213,843


42,063,039


5,940,436


Segment Information


Wealth management:


Revenue


521,434


415,876


58,733

Sales and marketing expenses


143,904


67,326


9,508


Consumer credit:


Revenue


1,458,974


607,784


85,836

Sales and marketing expenses


984,041


549,115


77,550


Reconciliation of Adjusted EBITDA


Net income


369,134


19,219


2,714

Interest income, net


(23,875)


(25,116)


(3,547)

Income tax expense


76,534


3,936


556

Depreciation and amortization


32,502


27,171


3,837

Share-based compensation


14,699


4,541


641

Adjusted EBITDA


468,994


29,751


4,201

Adjusted EBITDA margin


23.7%


2.9%


2.9%

Delinquency Rates


Delinquent for


15-29 days


30-59 days


60-89 days

All Loans


December 31, 2015

0.7%


1.2%


0.9%

December 31, 2016

0.6%


0.9%


0.8%

December 31, 2017

0.8%


1.0%


0.8%

December 31, 2018

1.0%


1.8%


1.7%

December 31, 2019

1.2%


2.0%


1.7%

March 31, 2020


1.6%


4.1%


3.2%


Online Channels


December 31, 2015

0.5%


0.8%


0.6%

December 31, 2016

0.5%


0.9%


0.8%

December 31, 2017

1.1%


1.1%


0.9%

December 31, 2018

1.2%


2.3%


2.2%

December 31, 2019

1.6%


2.9%


2.5%

March 31, 2020


1.9%


5.2%


3.8%


Offline Channels


December 31, 2015

0.7%


1.2%


1.0%

December 31, 2016

0.6%


0.9%


0.8%

December 31, 2017

0.6%


0.9%


0.7%

December 31, 2018

0.9%


1.6%


1.5%

December 31, 2019

1.0%


1.7%


1.5%

March 31, 2020


1.6%


3.7%


3.1%

M3+ Net Charge-Off Rate

Loan Issued Period


Amount of Loans Facilitated
During the Period


Accumulated M3+ Net Charge-Off
as of March 31, 2020


Total Net Charge-Off Rate
as of March 31, 2020


(in RMB thousands)


(in RMB thousands)


2015


53,143,029


4,455,505


8.4%

2016


53,805,112


5,071,489


9.4%

2017


69,883,293


11,506,013


16.5%

2018


63,176,149


9,989,880


15.8%

2019


39,103,048


2,018,636


5.2%

M3+ Net Charge-Off Rate

Loan
Issued
Period


Month on Book


4

7

10

13

16

19

22

25

28

31

34

2015Q1


0.8%

2.0%

3.4%

4.7%

5.7%

6.5%

7.1%

7.5%

7.7%

7.8%

7.8%

2015Q2


0.8%

2.3%

3.8%

5.2%

6.4%

7.3%

7.9%

8.3%

8.5%

8.7%

8.8%

2015Q3


0.4%

1.6%

3.1%

4.4%

5.6%

6.5%

7.1%

7.6%

7.9%

8.1%

8.4%

2015Q4


0.4%

1.6%

3.1%

4.4%

5.5%

6.3%

6.9%

7.4%

7.9%

8.3%

8.5%

2016Q1


0.3%

1.2%

2.5%

3.6%

4.5%

5.2%

5.8%

6.4%

7.0%

7.4%

7.6%

2016Q2


0.4%

1.6%

3.1%

4.3%

5.2%

6.0%

6.8%

7.6%

8.1%

8.4%

8.7%

2016Q3


0.3%

1.6%

3.1%

4.3%

5.4%

6.6%

7.8%

8.6%

9.2%

9.5%

9.8%

2016Q4


0.2%

1.5%

2.9%

4.4%

5.9%

7.4%

8.4%

9.3%

10.0%

10.4%

10.7%

2017Q1


0.3%

1.5%

3.2%

5.1%

7.1%

8.6%

9.8%

10.8%

11.5%

12.0%

12.2%

2017Q2


1.1%

2.9%

5.6%

8.4%

10.4%

12.1%

13.5%

14.5%

15.3%

15.8%


2017Q3


0.3%

2.9%

6.4%

9.1%

11.6%

13.6%

15.0%

16.2%

16.9%


2017Q4


0.5%

3.9%

7.3%

10.5%

13.2%

15.3%

16.9%

18.0%


2018Q1


0.4%

3.0%

6.6%

10.1%

12.9%

15.2%

16.9%


2018Q2


0.5%

3.6%

7.4%

10.8%

13.6%

15.8%


2018Q3


0.4%

3.0%

6.2%

9.1%

11.7%


2018Q4


0.3%

2.5%

5.6%

8.6%


2019Q1


0.2%

2.5%

5.6%


2019Q2


0.3%

2.9%


2019Q3


0.3%


Related Links :

http://ir.yirendai.com/

[Next@Acer 2020] Artists Rejoice! The Acer ConceptD 3 Ezel Comes with an actual Easel

Acer’s ConceptD series created waves when it was first announced a little over a year ago. It was the first offering from the computer manufacturer to take aim at the creative industry and cater to their needs. Specifically, providing a powerful, portable machine capable of rendering and processing large workloads on the go. This year, the company is looking to bring even more flexibility with the new ConceptD 3 Ezel.

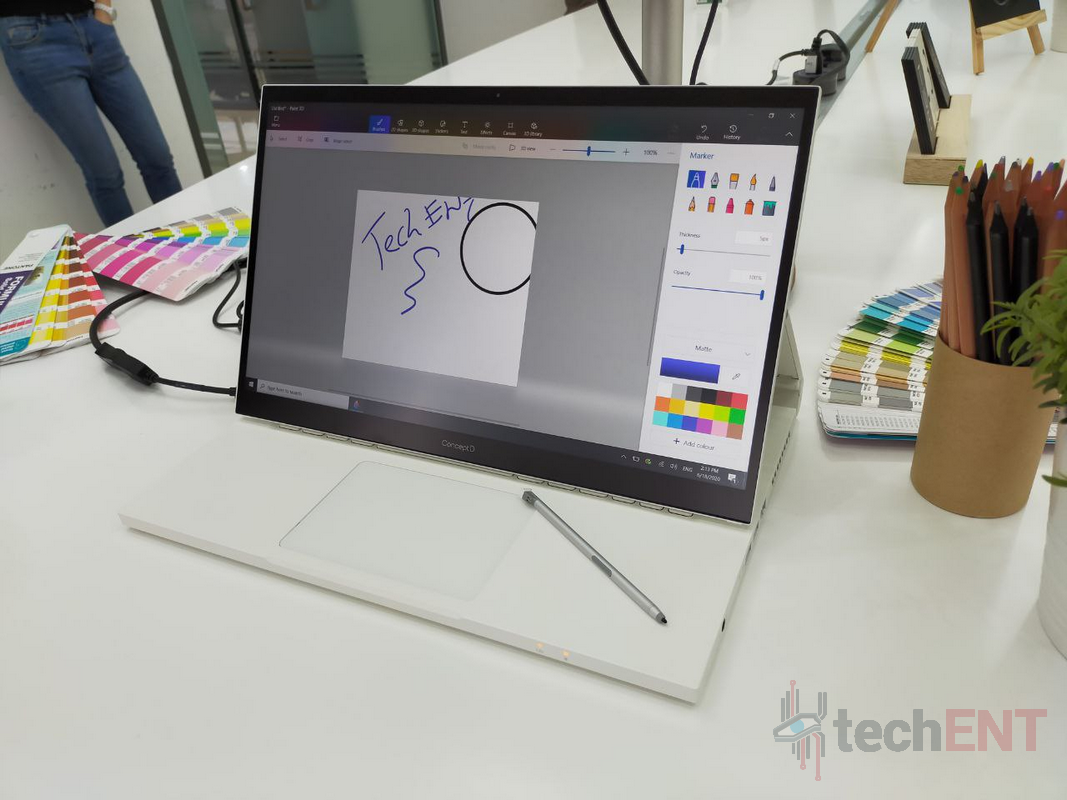
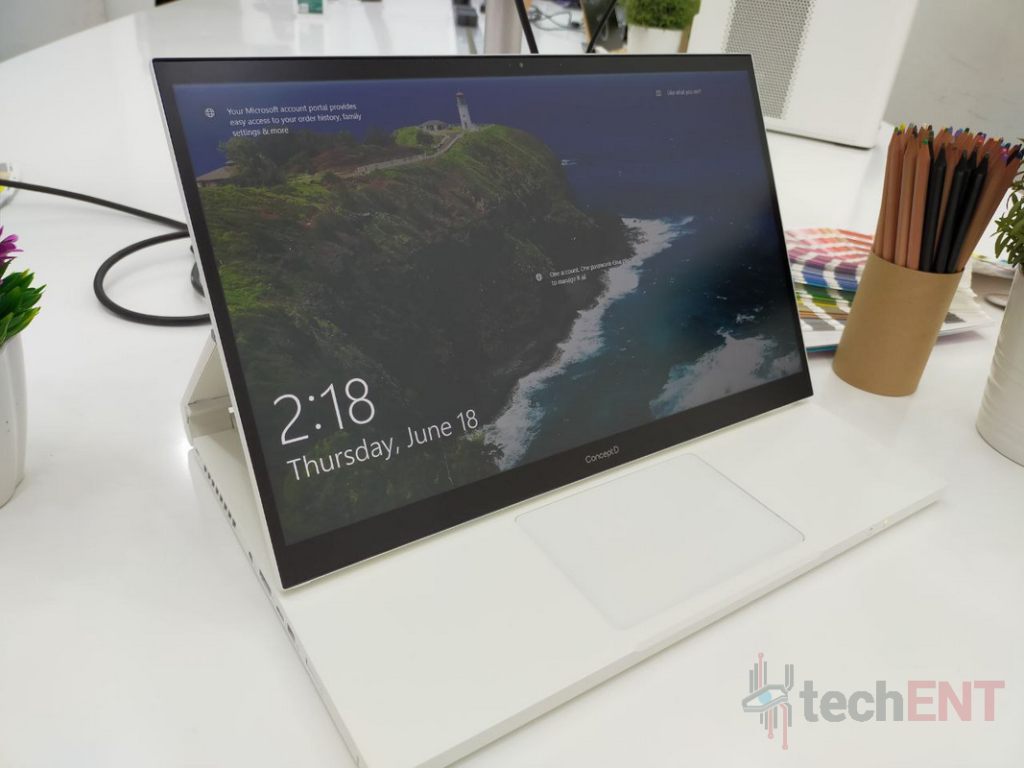
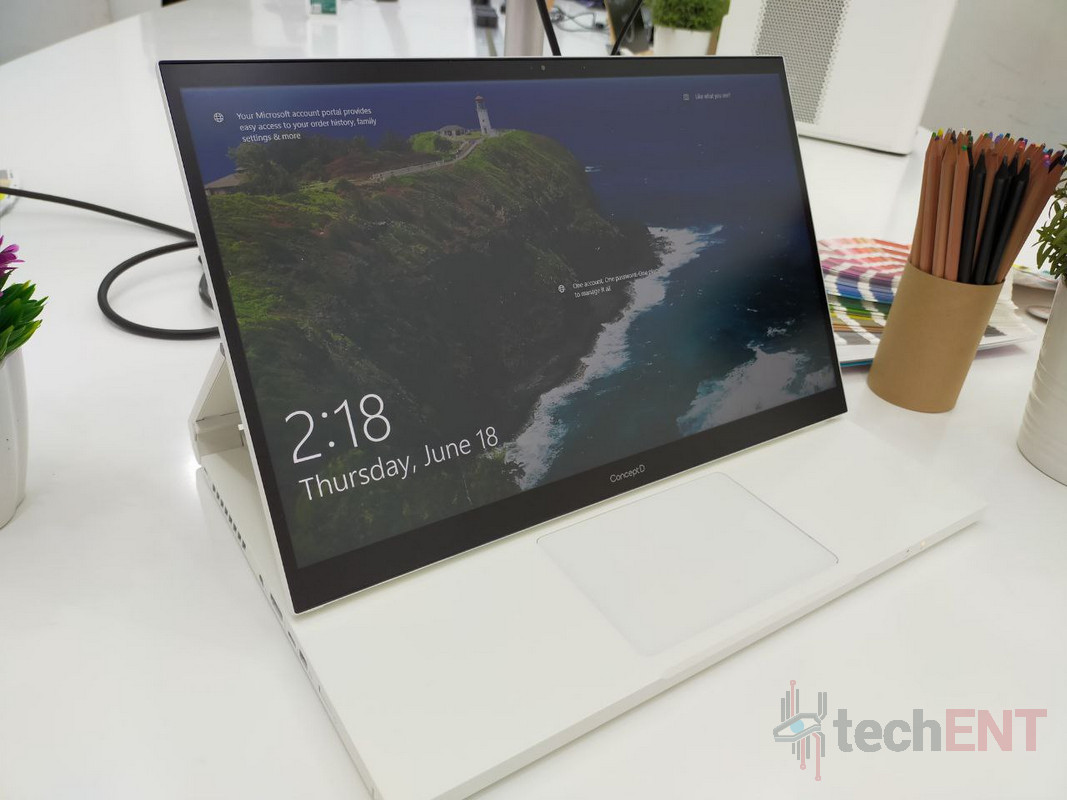
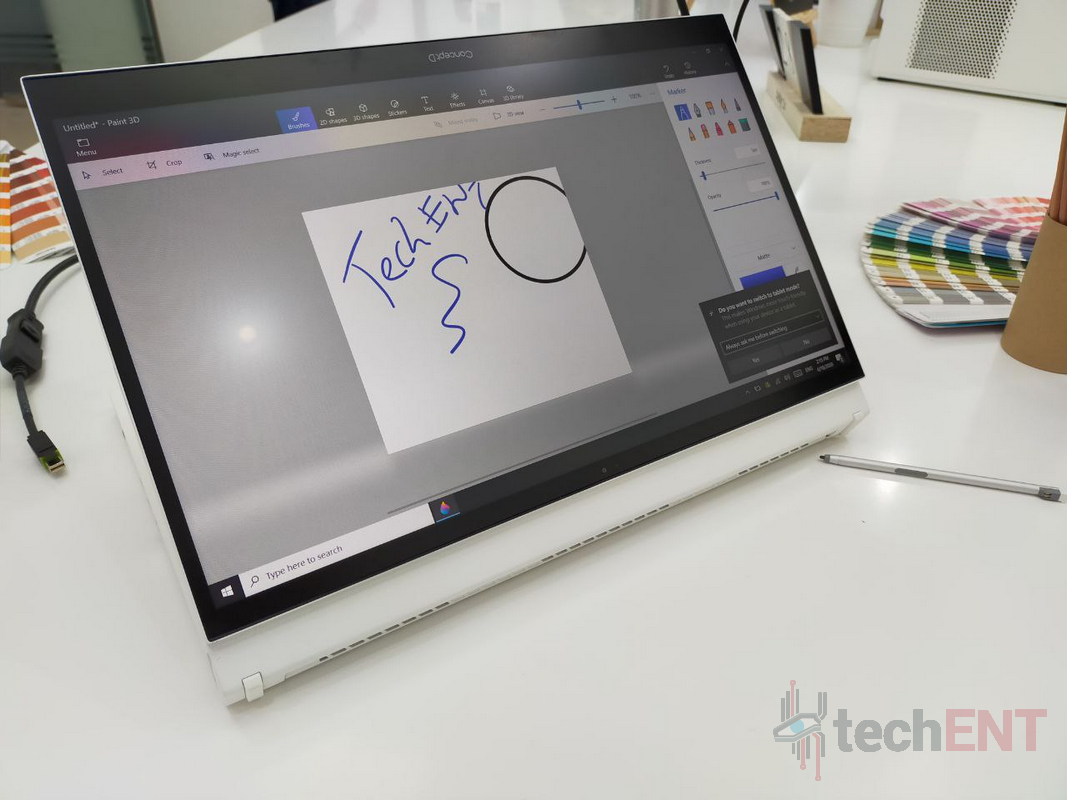
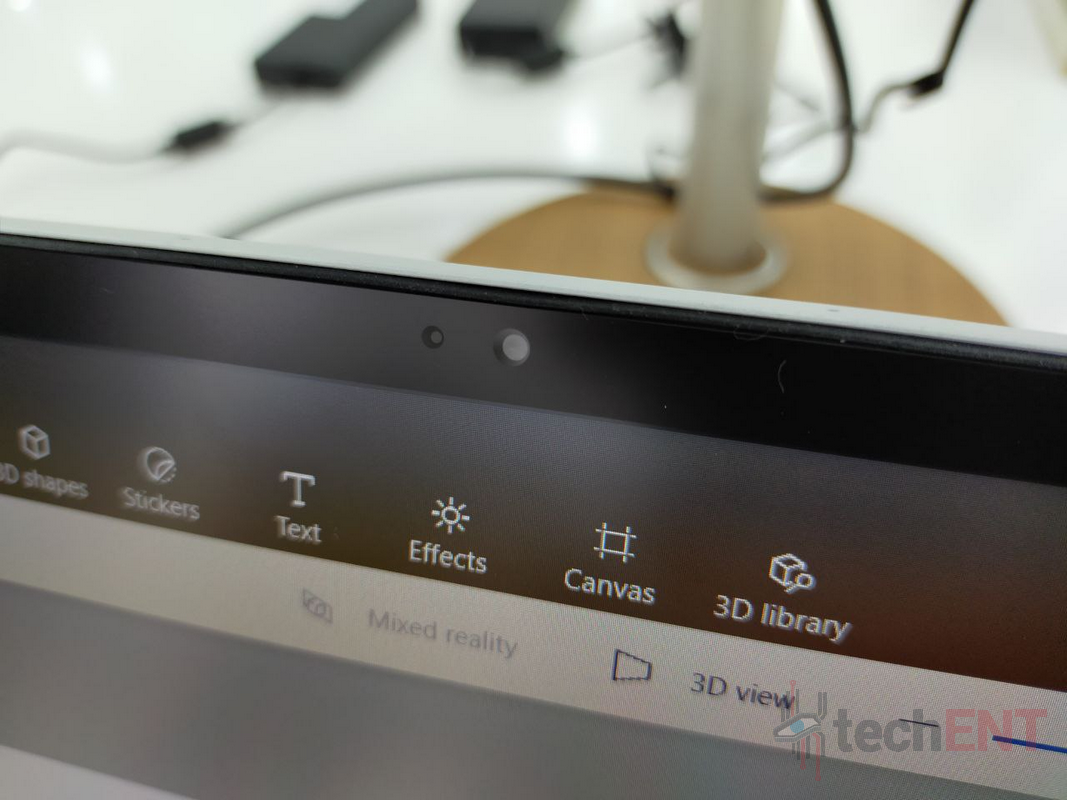
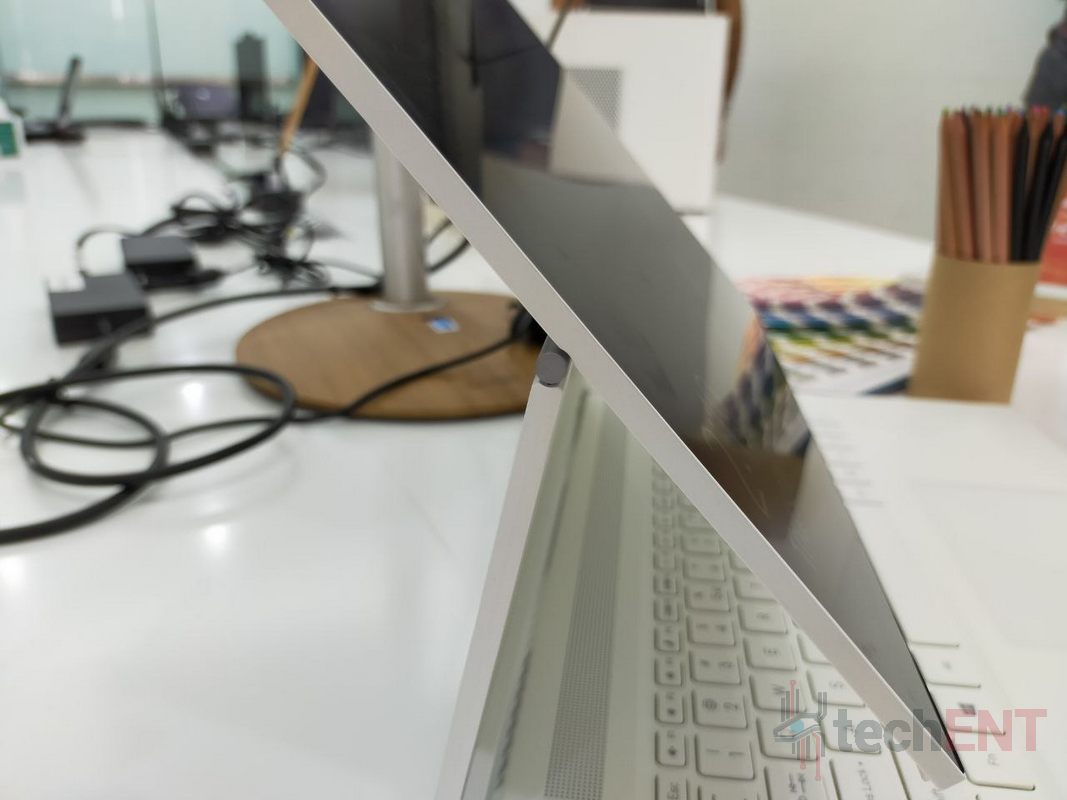
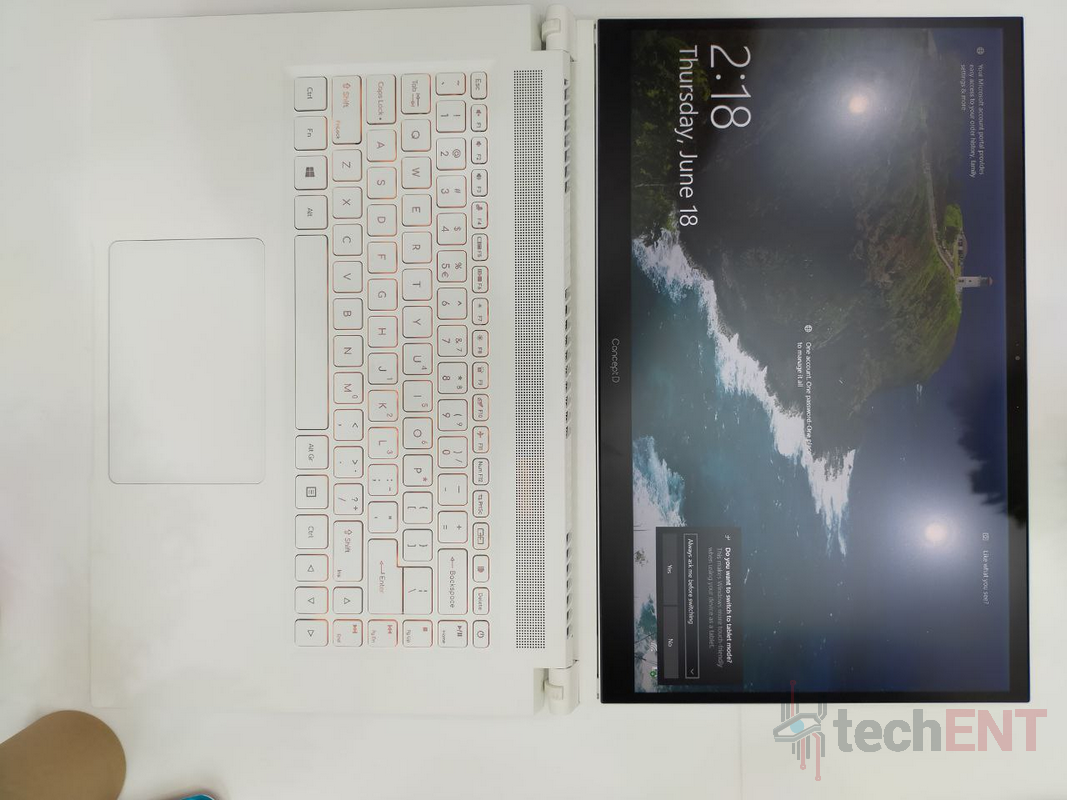
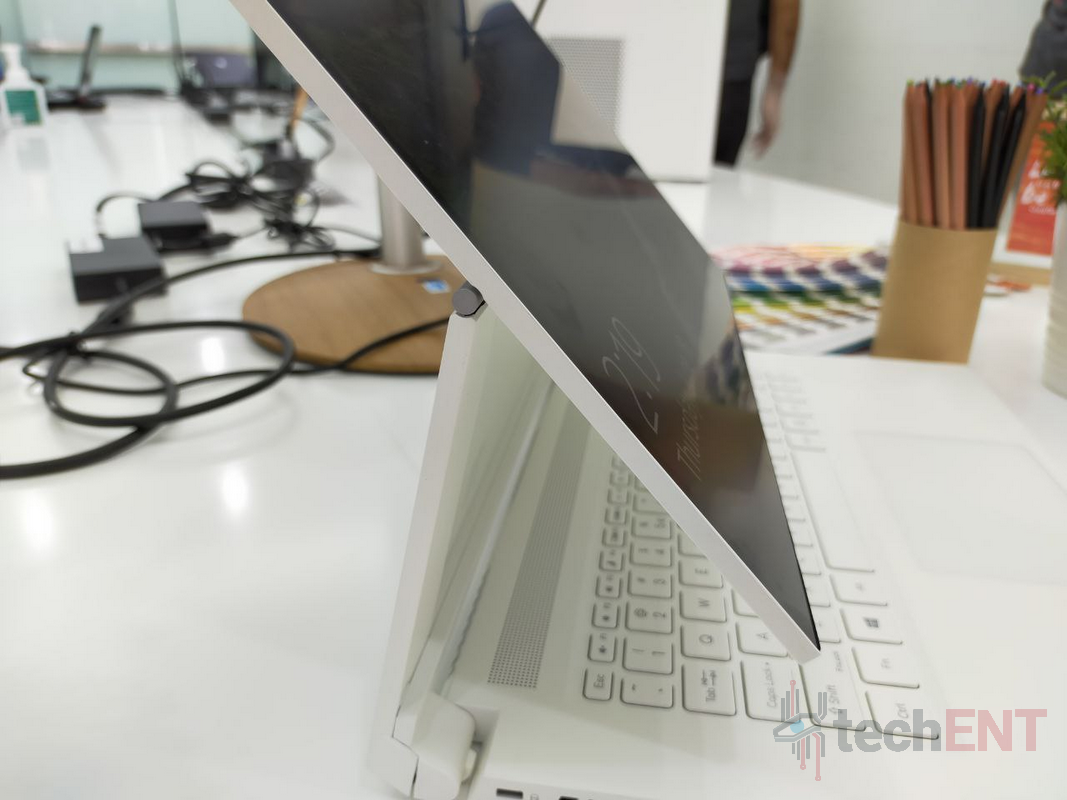
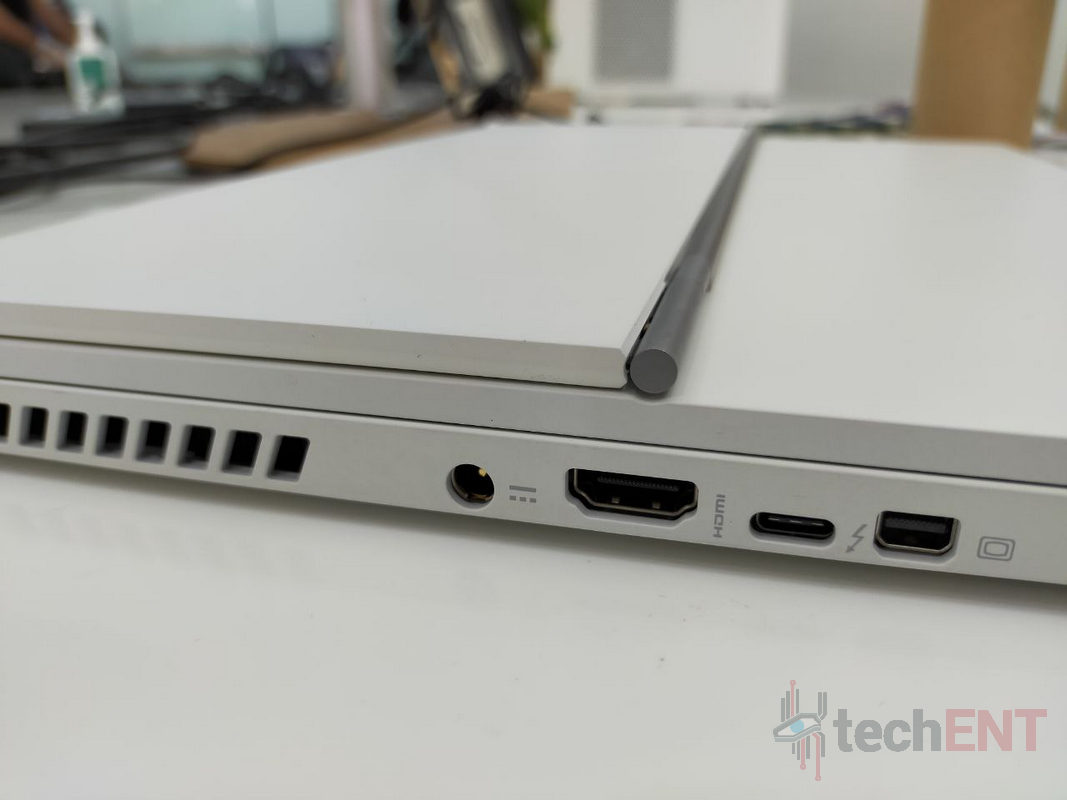
The ConceptD 3 Ezel brings along a new hinge design that brings even more flexibility to the already powerful line up of ConceptD laptops. The unique, innovative hinge by Acer allows the laptop to function in multiple modes. It also allows artists to illustrate and draw without the hassle of working around the keyboard.

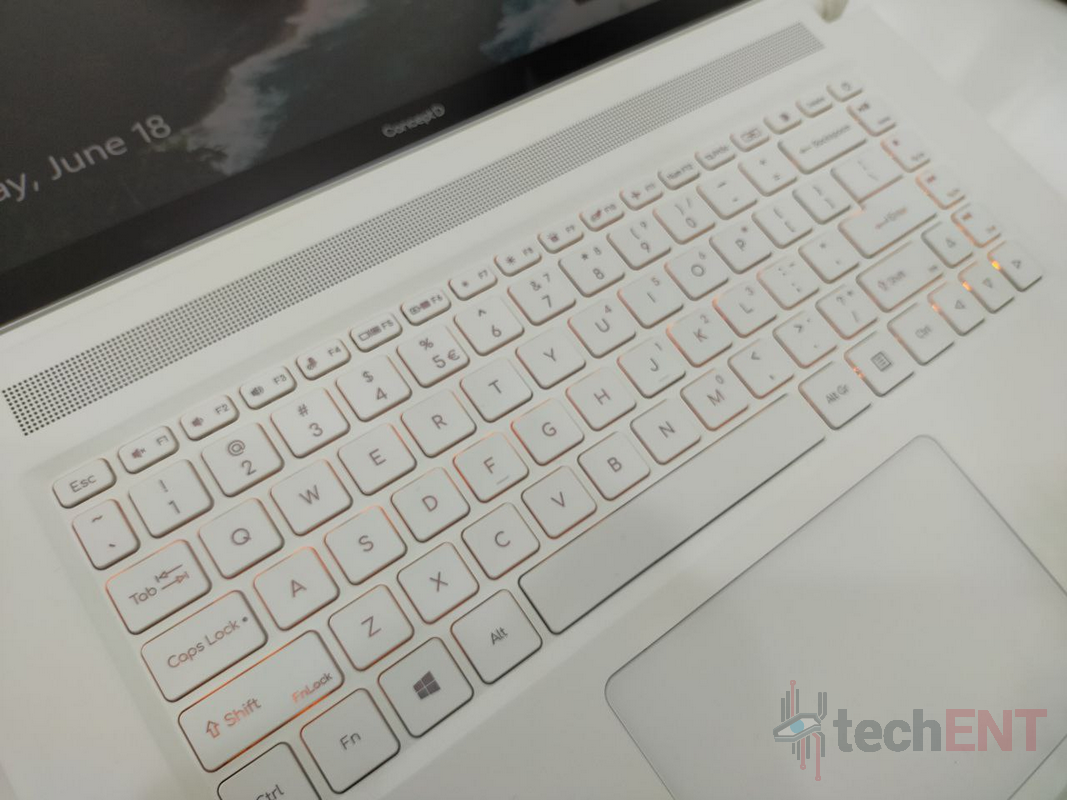
The unique hinge is not the only design cue that stands out. The ConceptD 3 Ezel is pristine white with the hinge running through the top of the laptop providing a symmetrical accent that highlights the hidden functionality. The keys are also back lit a glowing amber which glows and resonates against the white of the laptop.

Elegance isn’t the only thing the ConceptD 3 Ezel is. It’s also power packed and ready to take on anyone’s creative process. The laptop comes with either a 14-inch or 15.6-inch Full HD PANTONE Validated touchscreen display which covers 100% of the sRGB gamut with an accuracy rated at delta ΔE<2. It is also supports Acer’s Active Stylus for easy writing and drawing with 4,096 levels of pressure sensitivity.

The ConceptD 3 Ezel comes packing a punch with high performance, 10th Generation Intel Core i7 and Core i5 processors and NVIDIA’s Quadro T1000 graphics processor (ConceptD 3 Ezel Pro) or the NVIDIA GeForce GTX 1650 Ti. It comes with 1TB of PCIe SSD storage as well.

Together with the ConceptD3 Ezel, Acer also announced the available of a regular ConceptD 3 which comes with similar specifications and sports 20 hours of battery life.

Pricing & Availability

The ConceptD 3 Ezel will be available in September in North America and China with pricing starting at USD$1,499.99 (MYR6,412.64) and RMB9,999 (MYR6,056.21) respectively. While the EMEA (Europe, Middle East & Asia) region will be getting the Ezel starting September with prices starting at EUR1,699 (MYR8,224.28).

The regular ConceptD 3 will be retailing in North America and EMEA starting in October for USD$999.99 (MYR4,275.08) and EUR1,299 (MYR6,289.14) respectively. While, in China, it will be available starting in September with prices starting at RMB8,999 (MYR5,450.53).

Official Specifications

Dell G5 Gaming Launched with new Dell Gaming Monitors

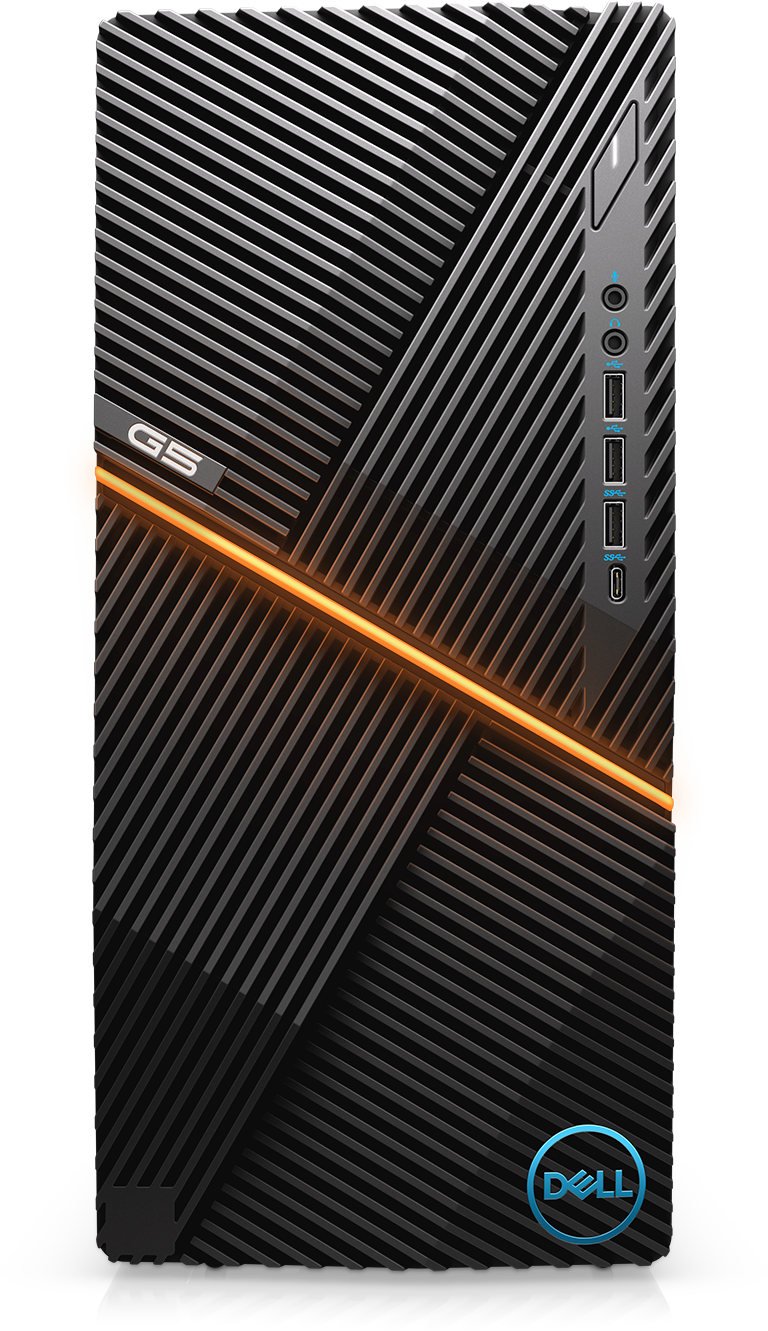
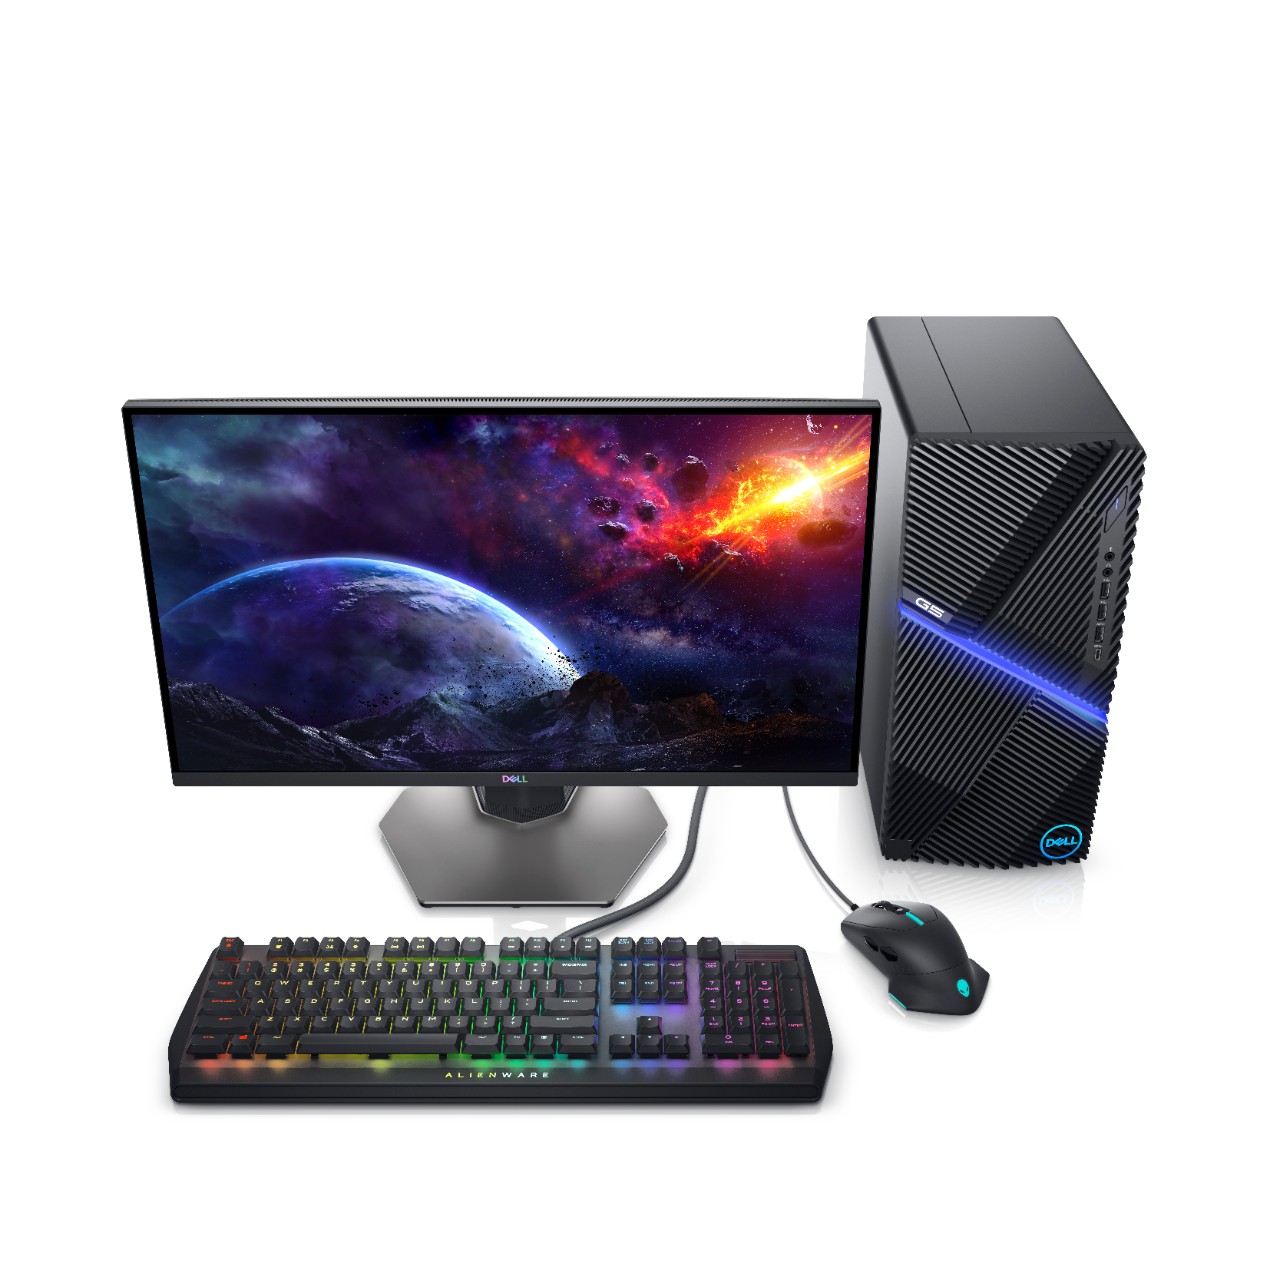
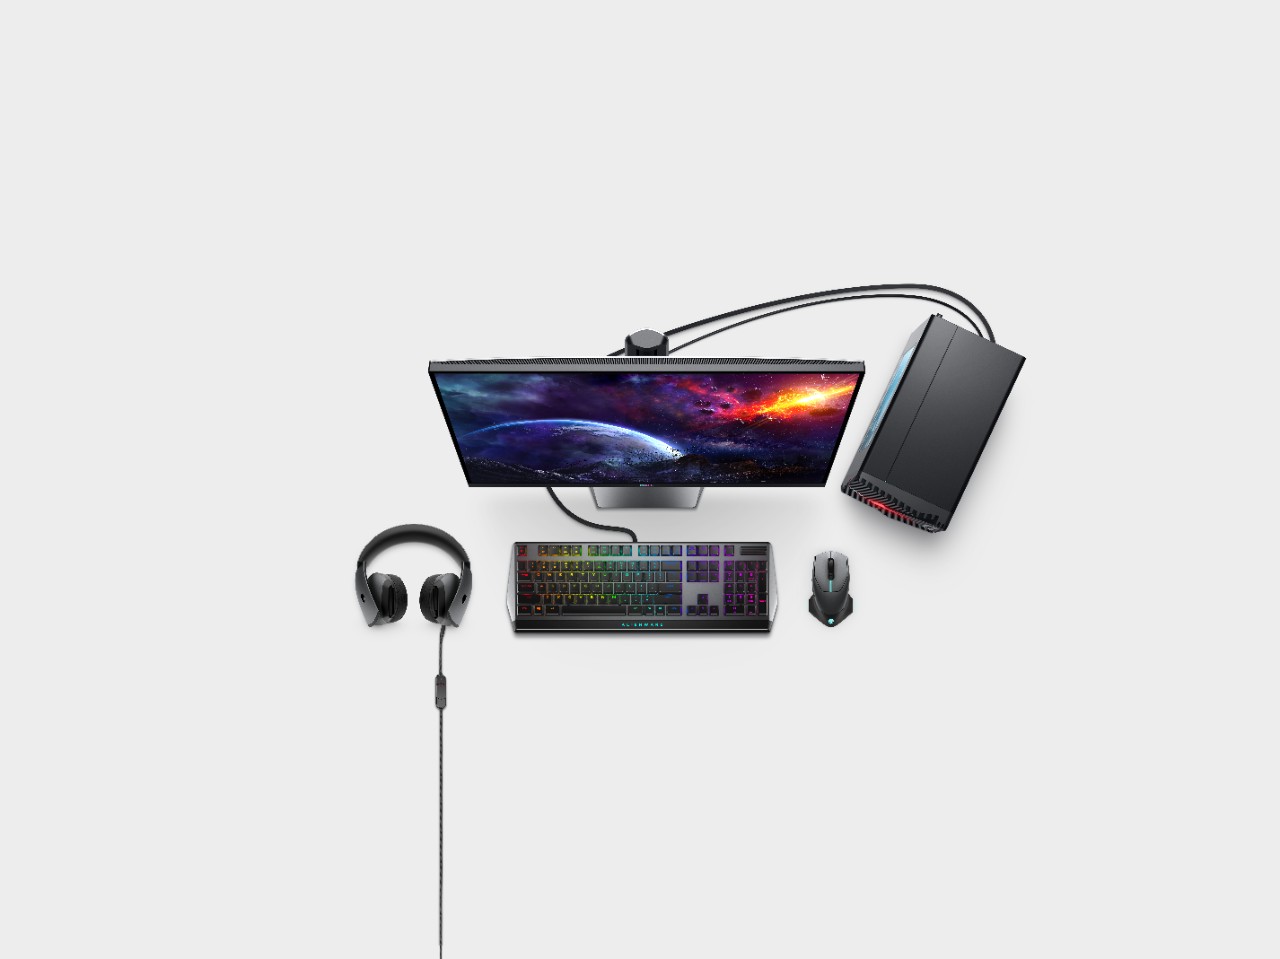
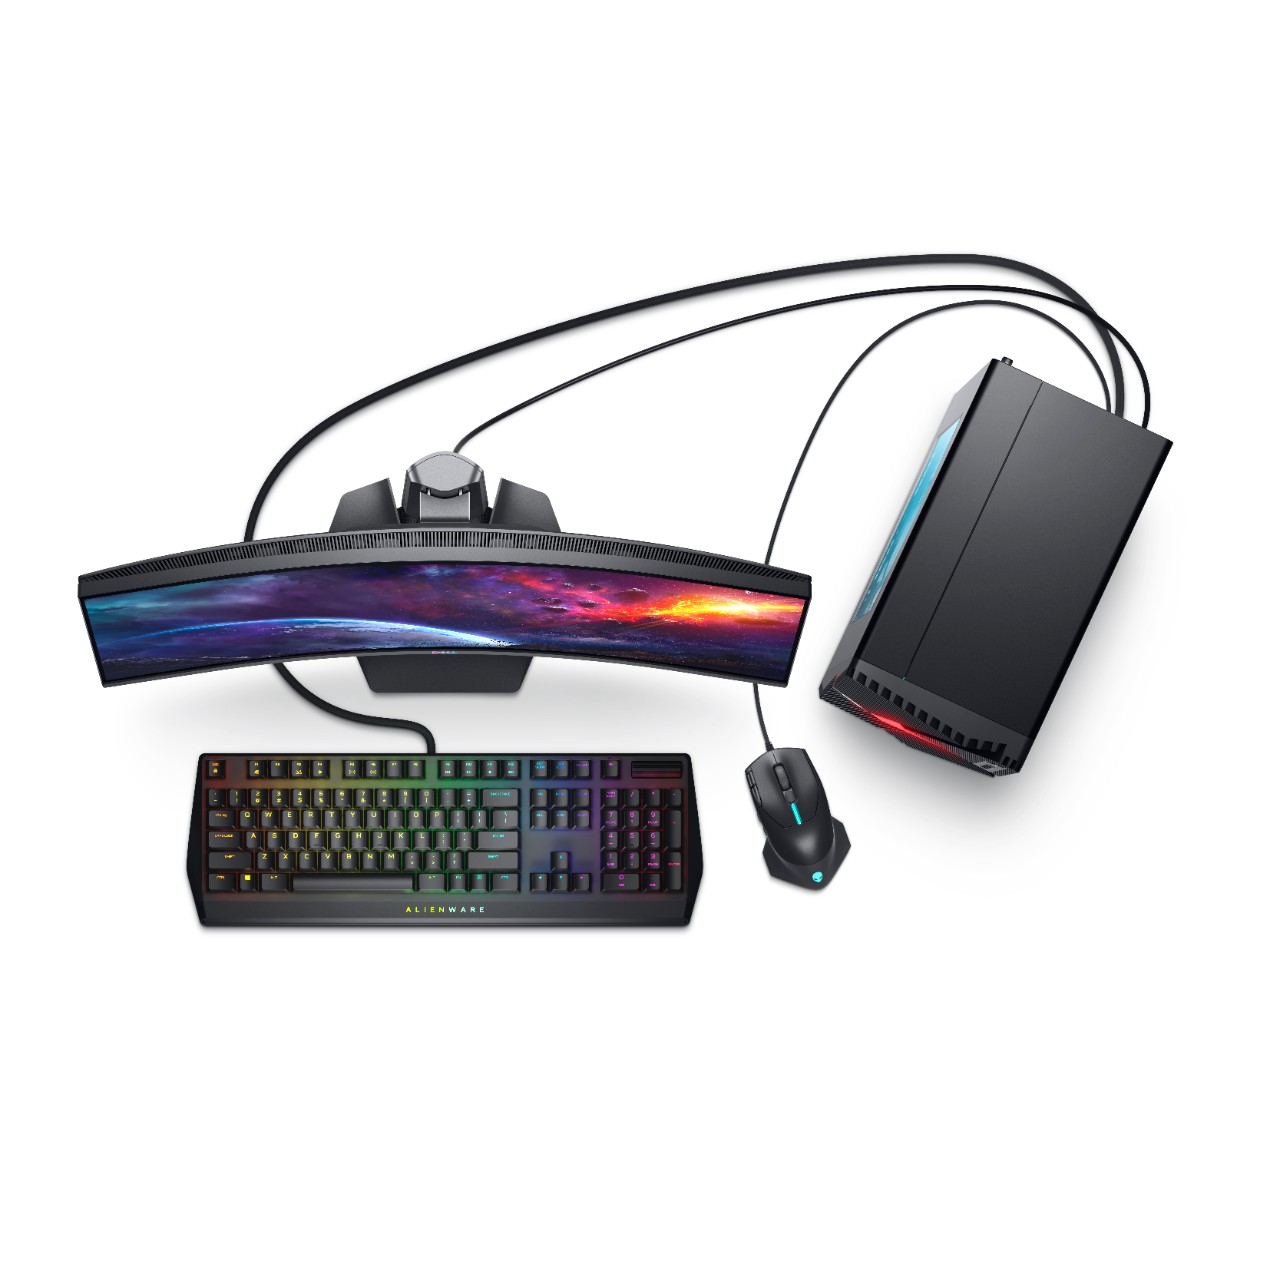
Dell’s gaming line up has long been one which has been growing in its scope and popularity. With the introduction of a whole new ethos and design last year, the company’s gaming segment is quickly growing and packing more of a punch. Last year, there was one big piece missing when it came to their offerings; this year, they are making sure they have all their bases covered with the Dell G5 Gaming Desktop.

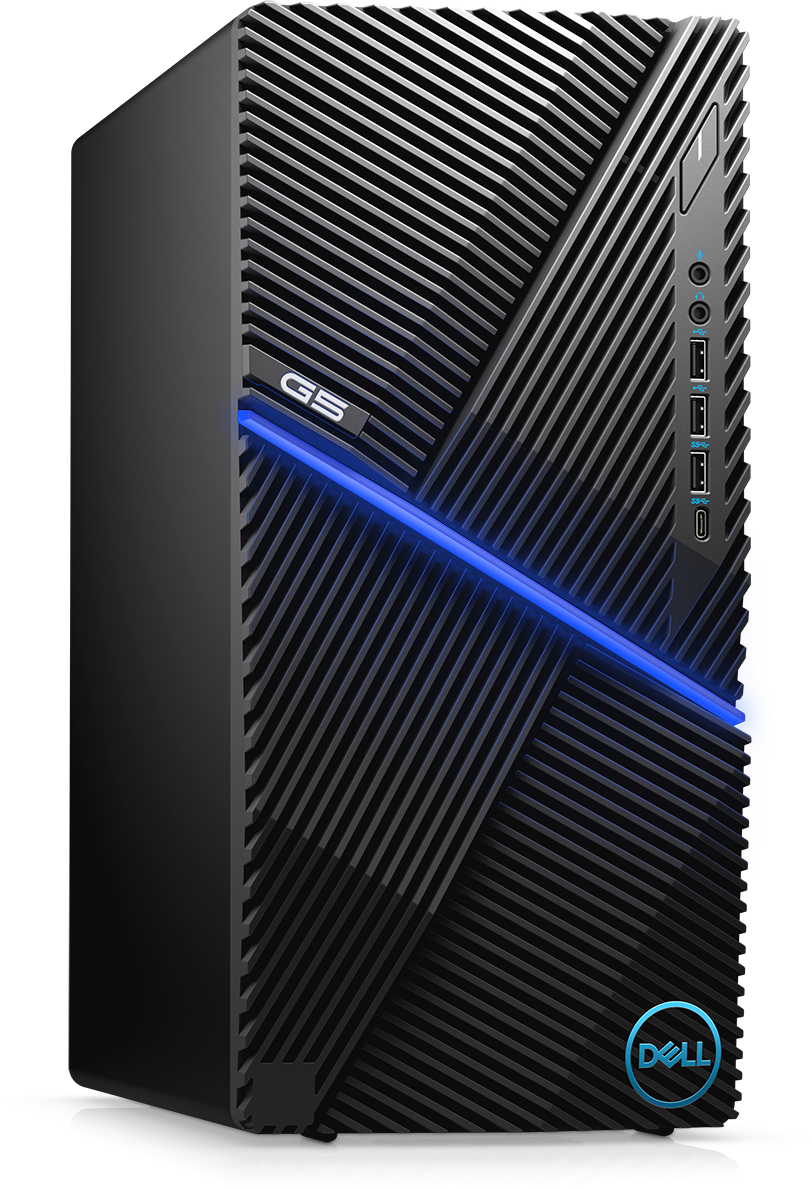
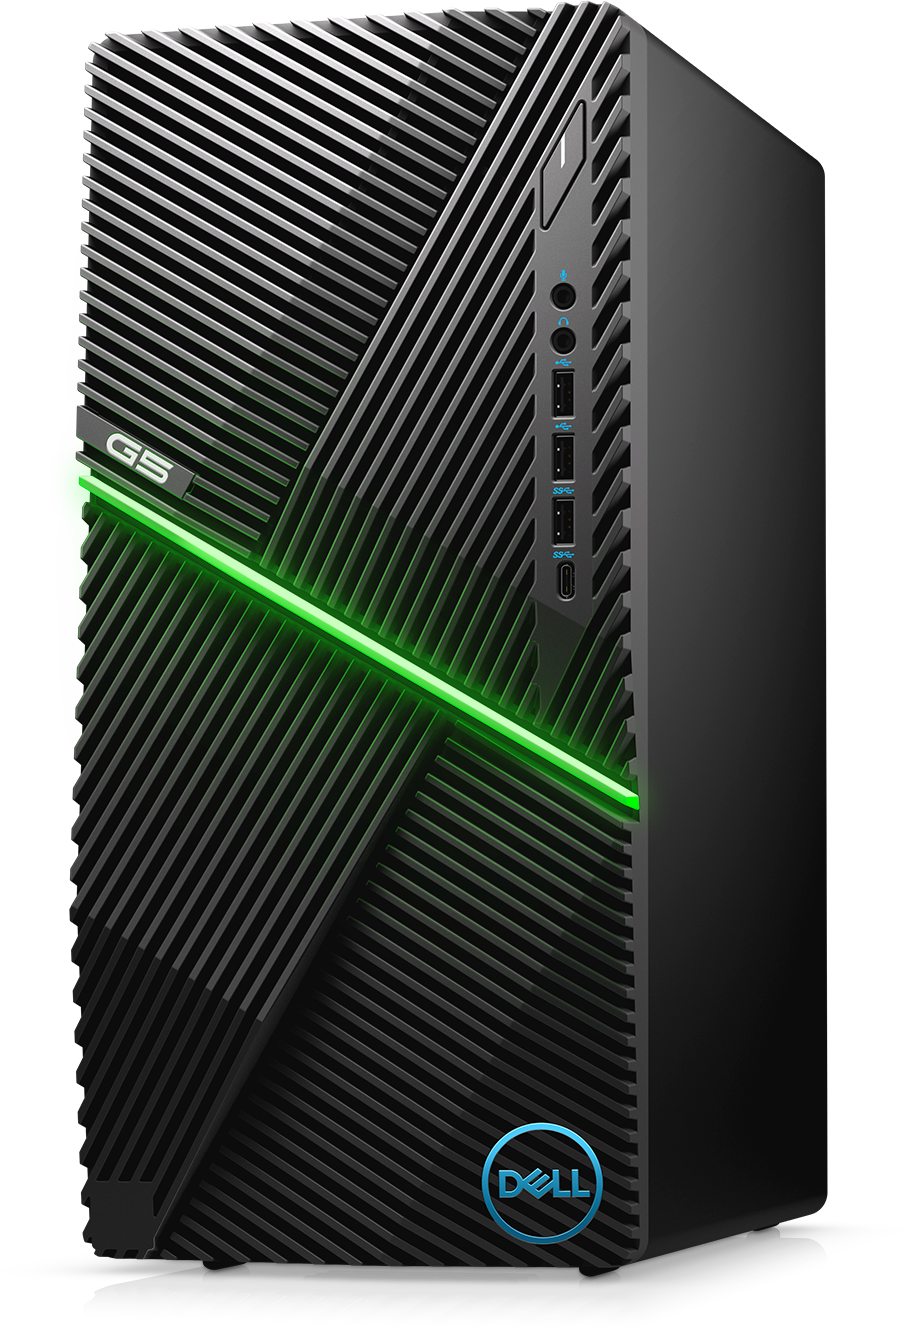
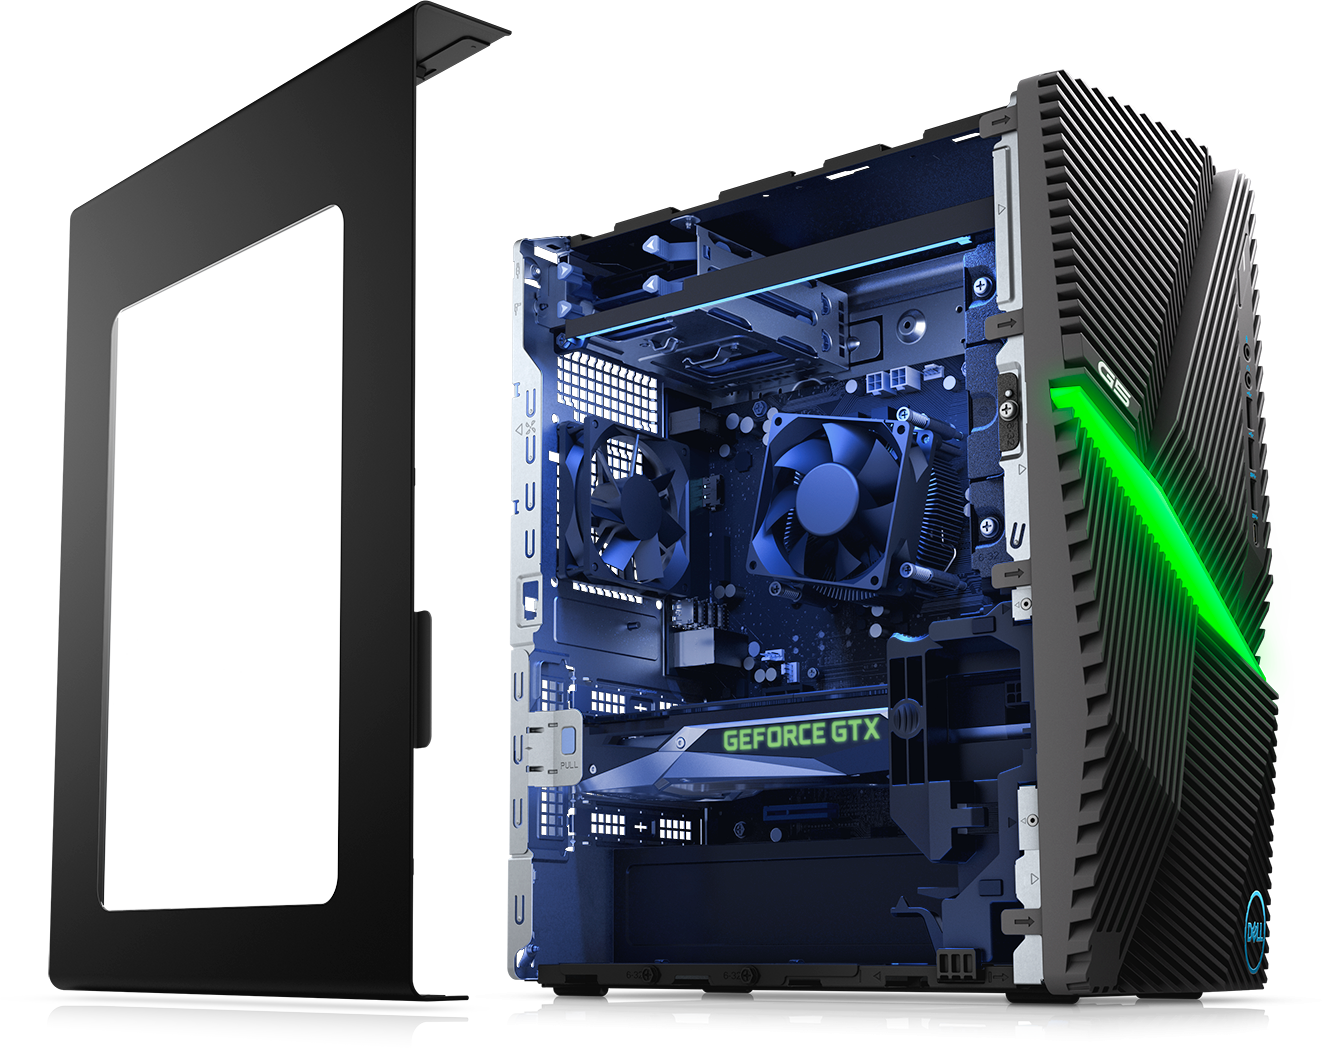
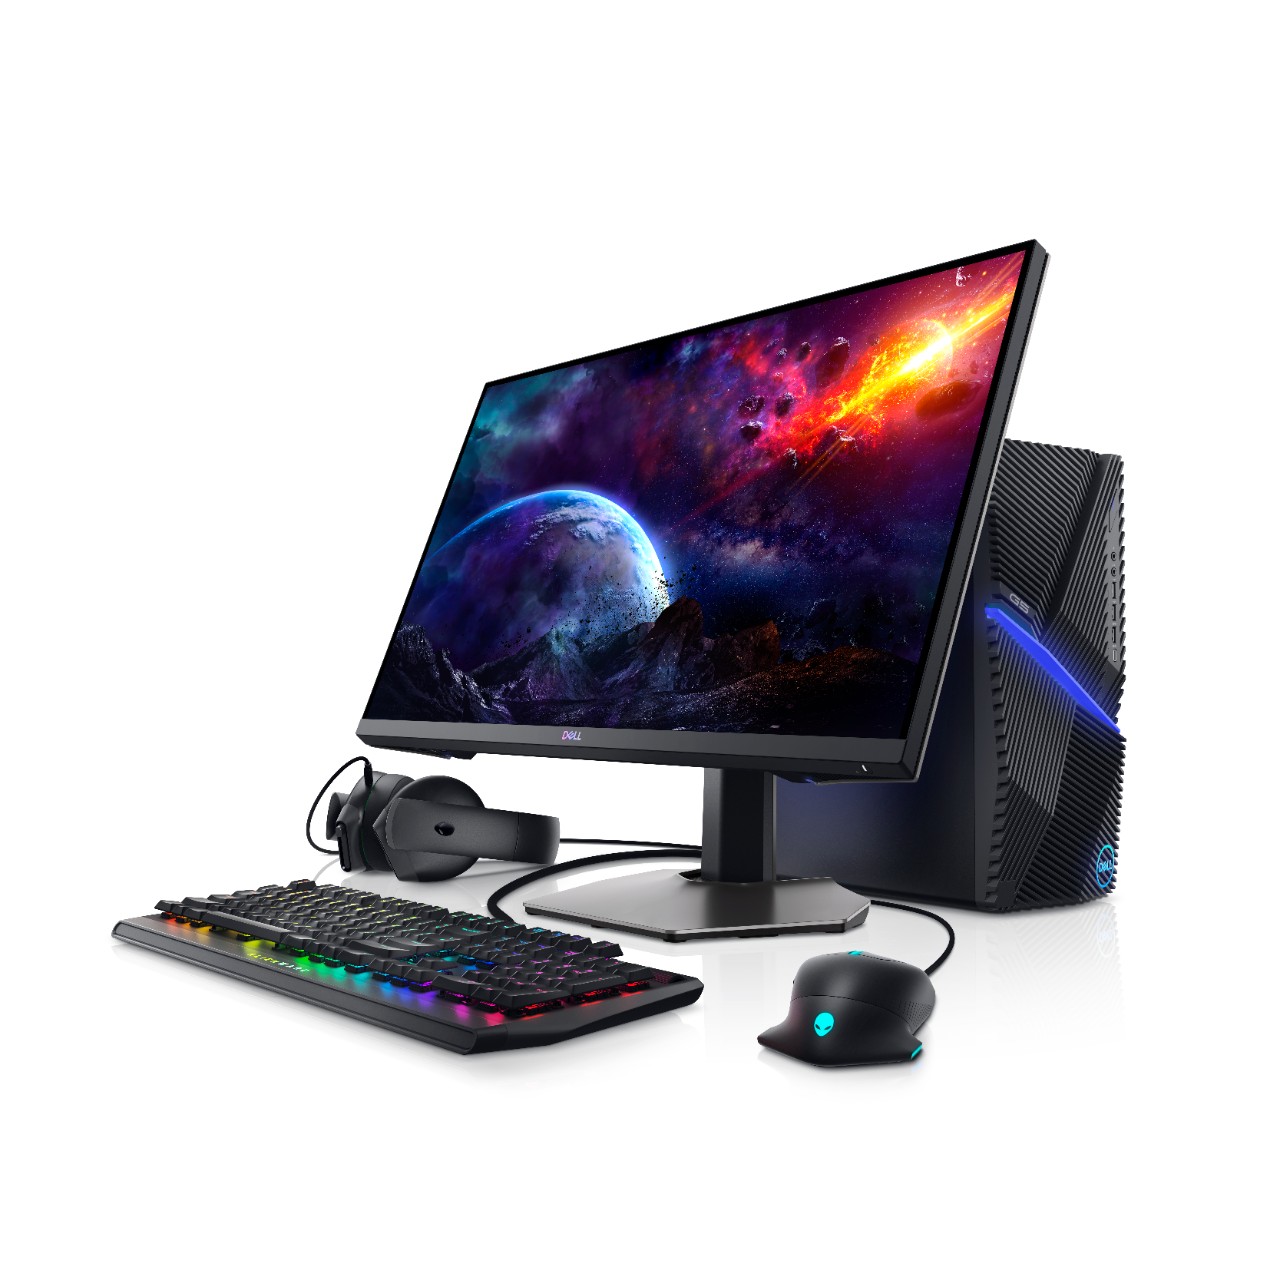
The Dell G5 gaming desktop adopts the rugged design language of Dell’s gaming series and equips itself with some of the most sought after features. It’s deep metallic colour and hard lines are a pretty obvious cues that this machine is made for performance and gaming. You’ll be able to see the muscle behind the performance with the window on the side of the desktop.

The G5 is built for performance with options for processors ranging from the 10th Generation Intel Core i3 all the way up to the Intel Core i9 processors. This is paired with up to 64GB of RAM and up to 3TB of space. Hard disks are available in multiple configurations to fit the needs of the user. Users are able to choose graphics cards ranging from the NVIDIA’s GTX1650 to the RTX2070 Super or the AMD Radeon RX5600.

When it comes to connectivity, the G5 is equipped with more than enough ports for any user. These ports include USB type C, USB 2.0, Ethernet, and 3.5mm jacks for headphones and microphones. On the wireless side of things, it has support for WiFi 6 with Killer Wireless and Bluetooth 5.0.

Dell Gaming Monitors

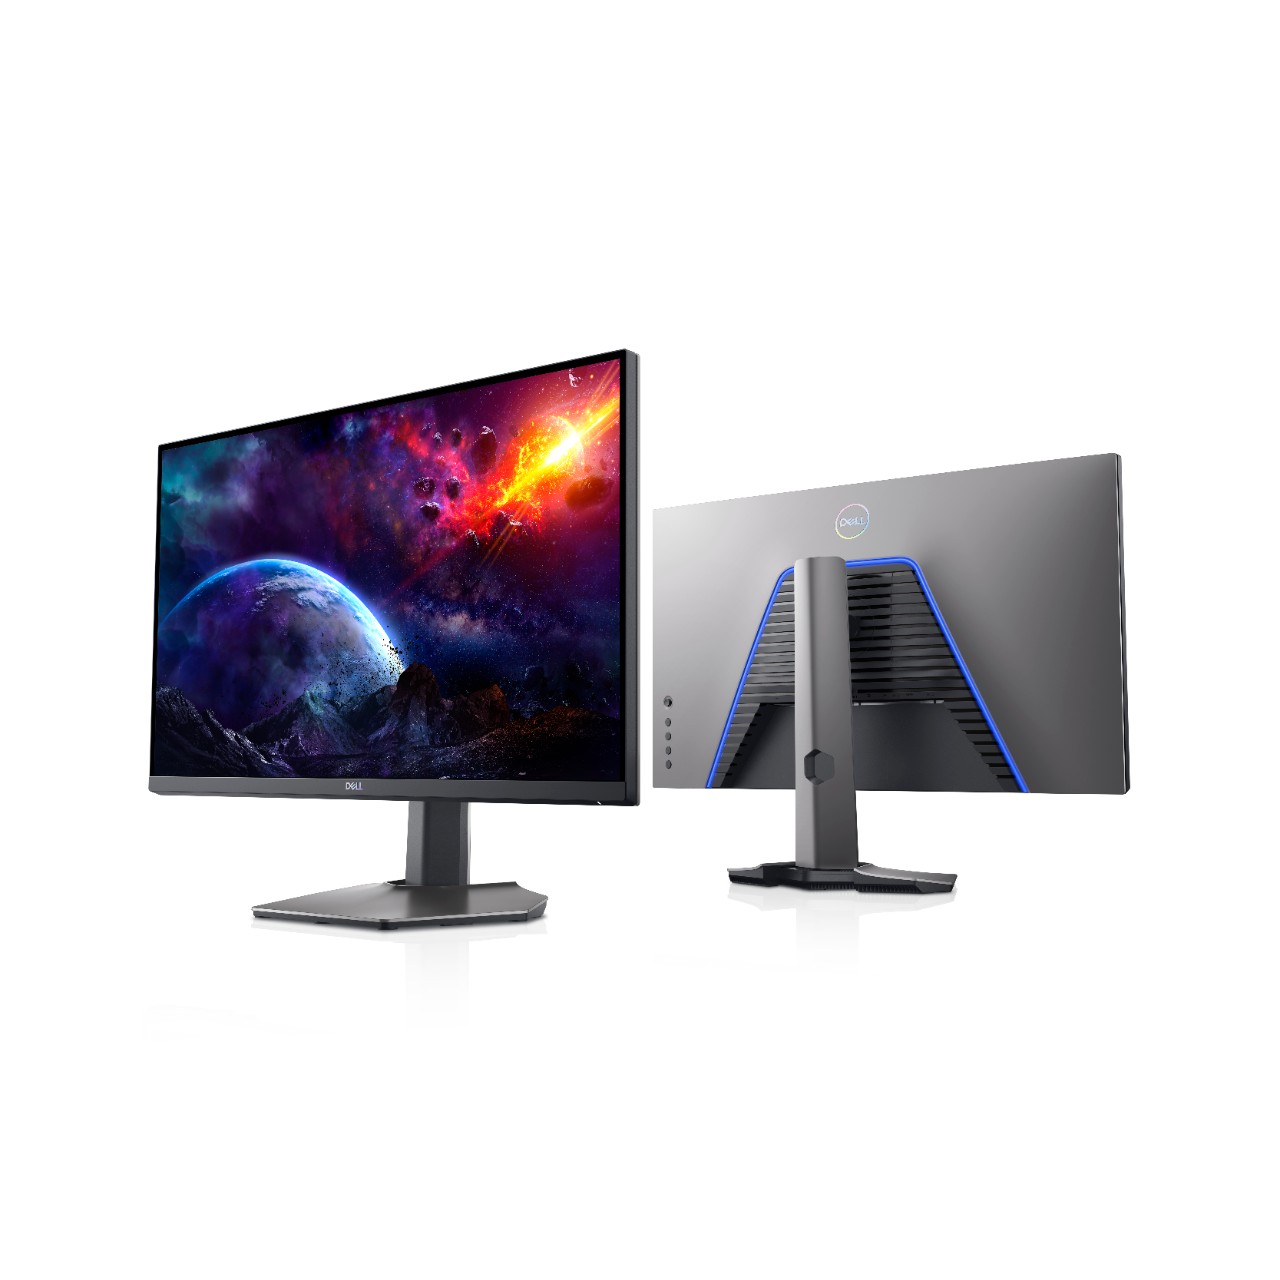
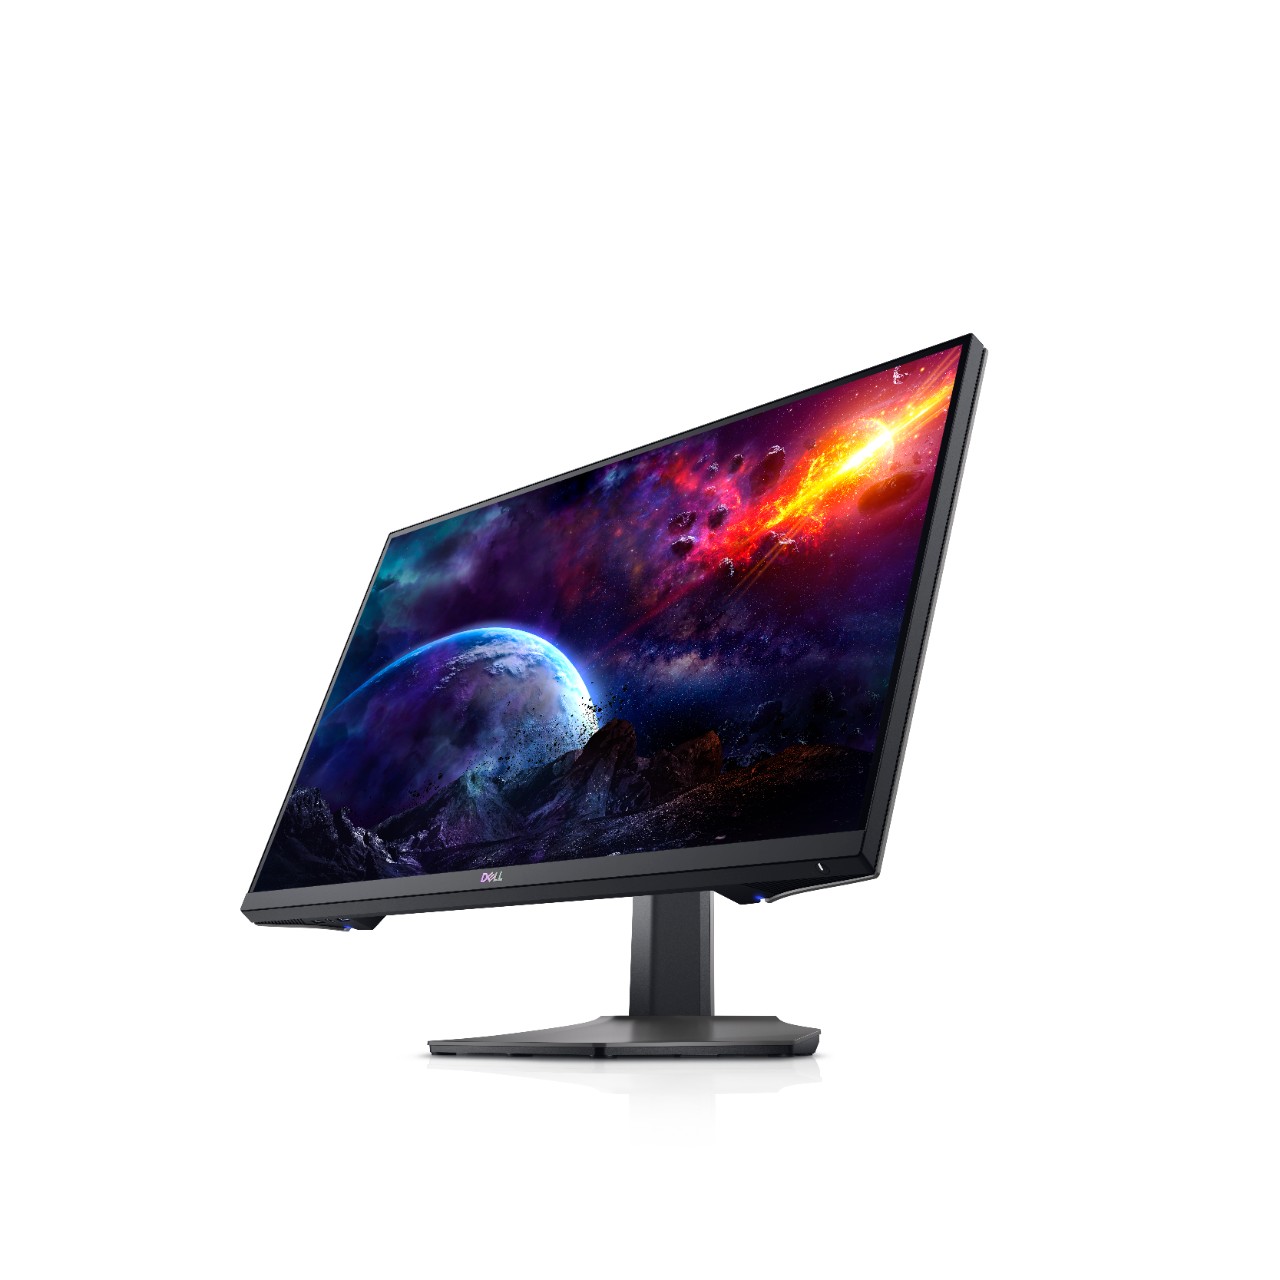
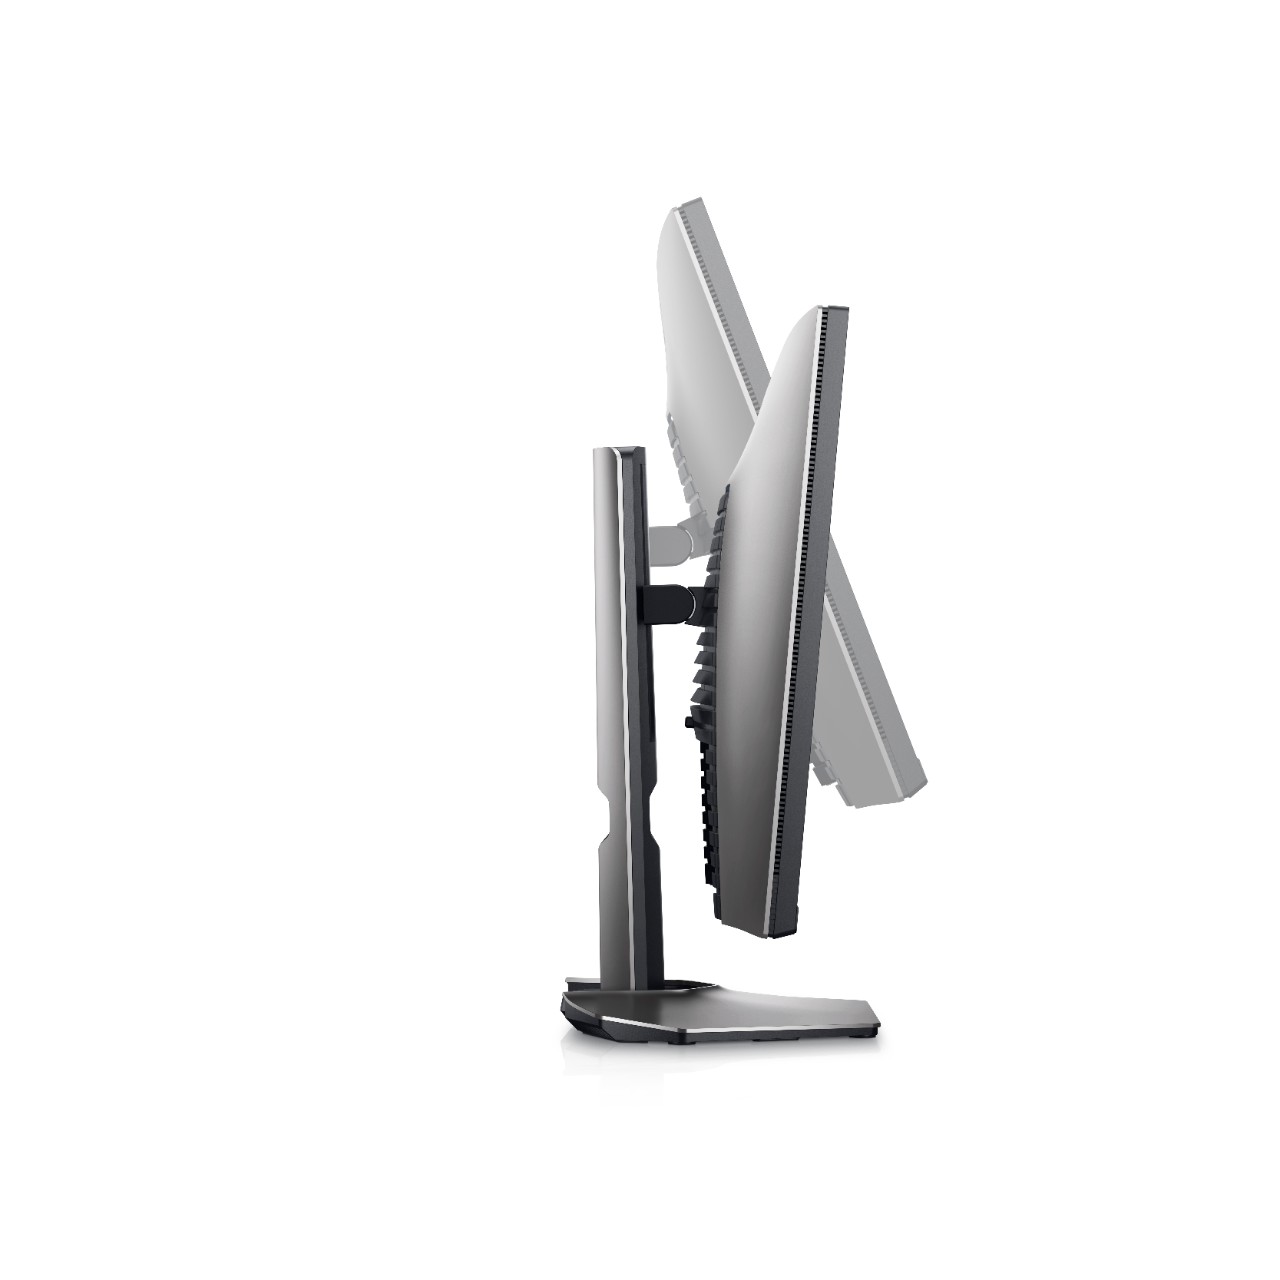
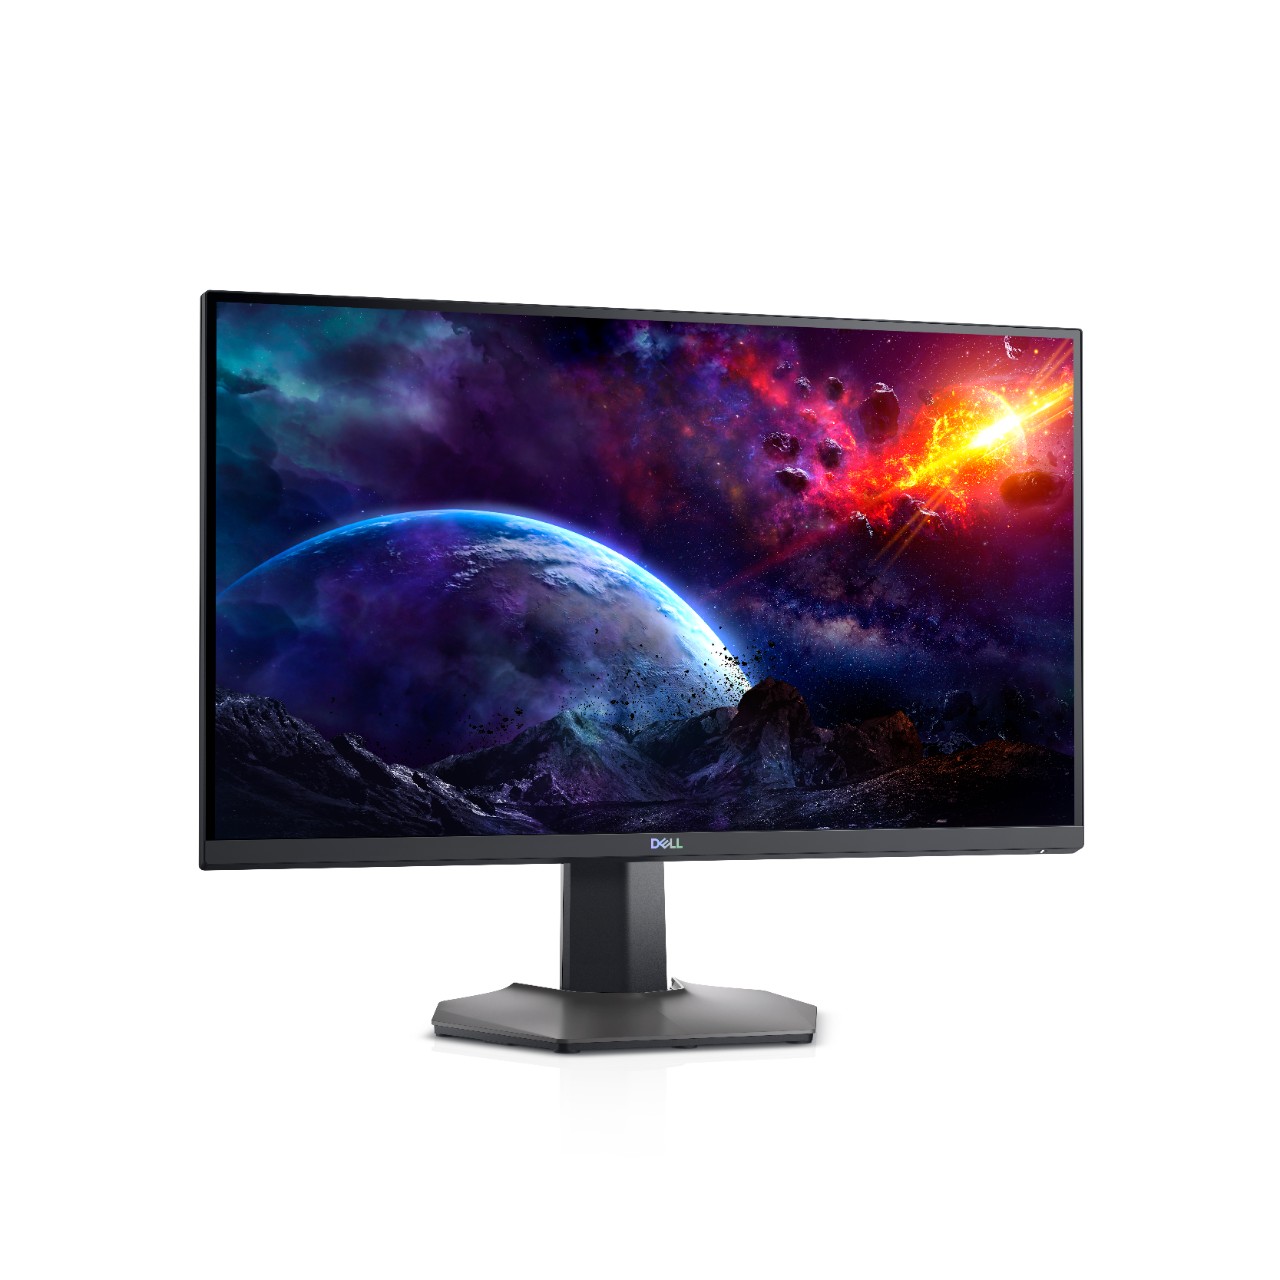
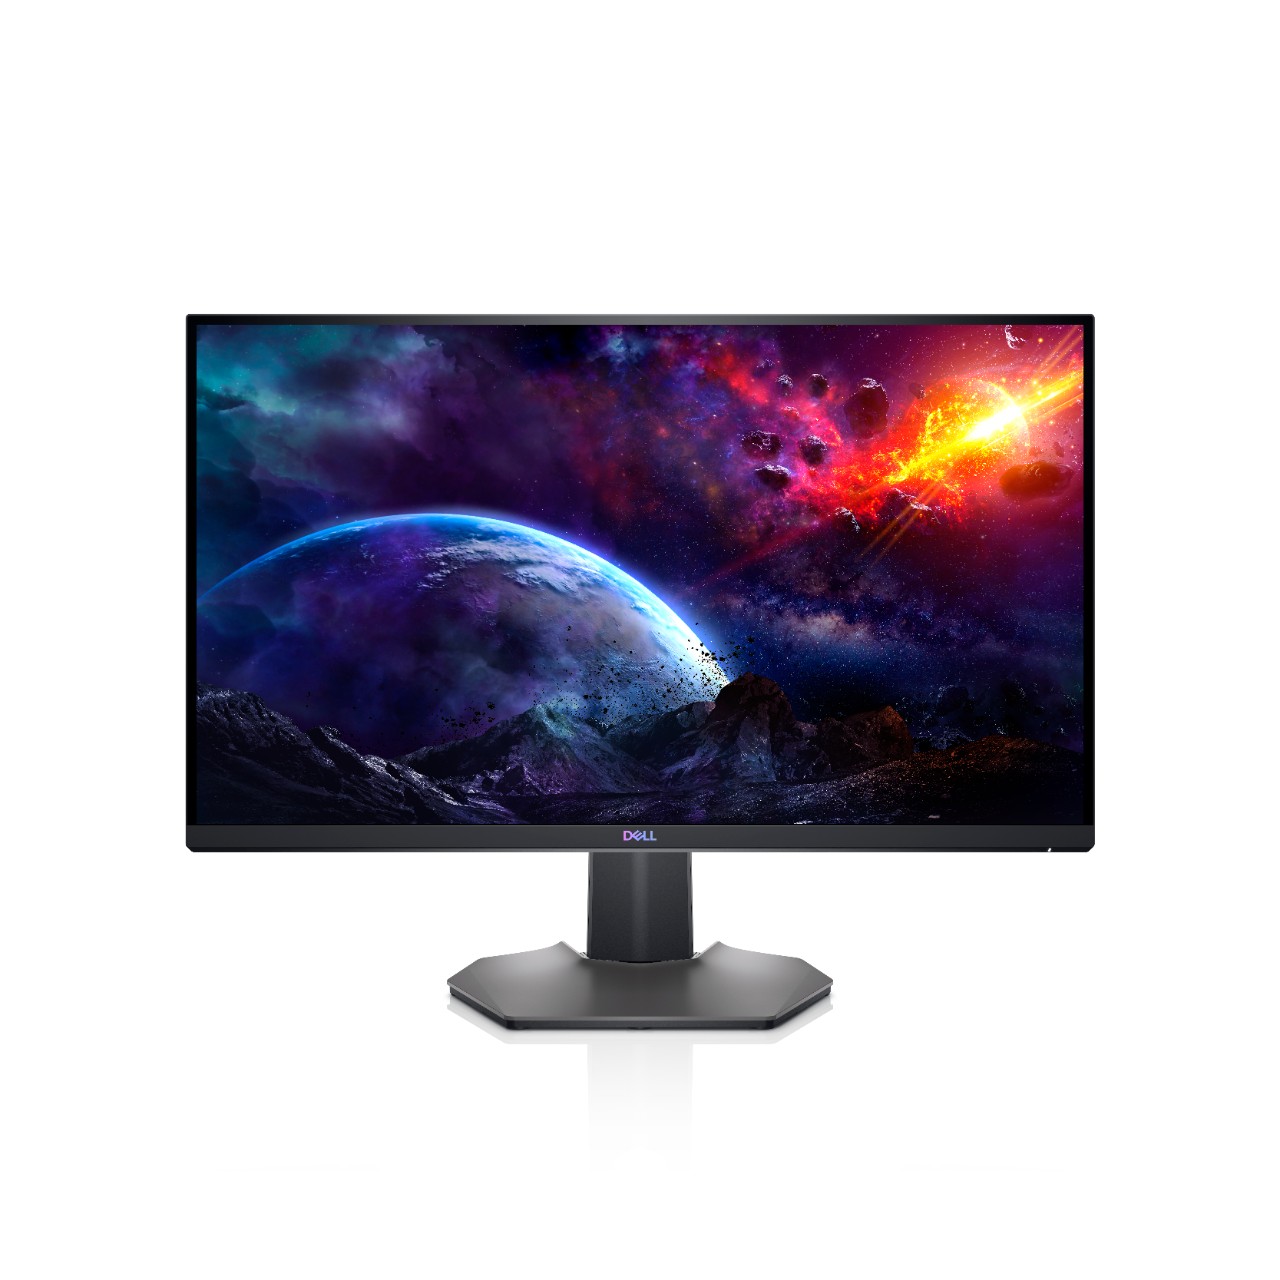
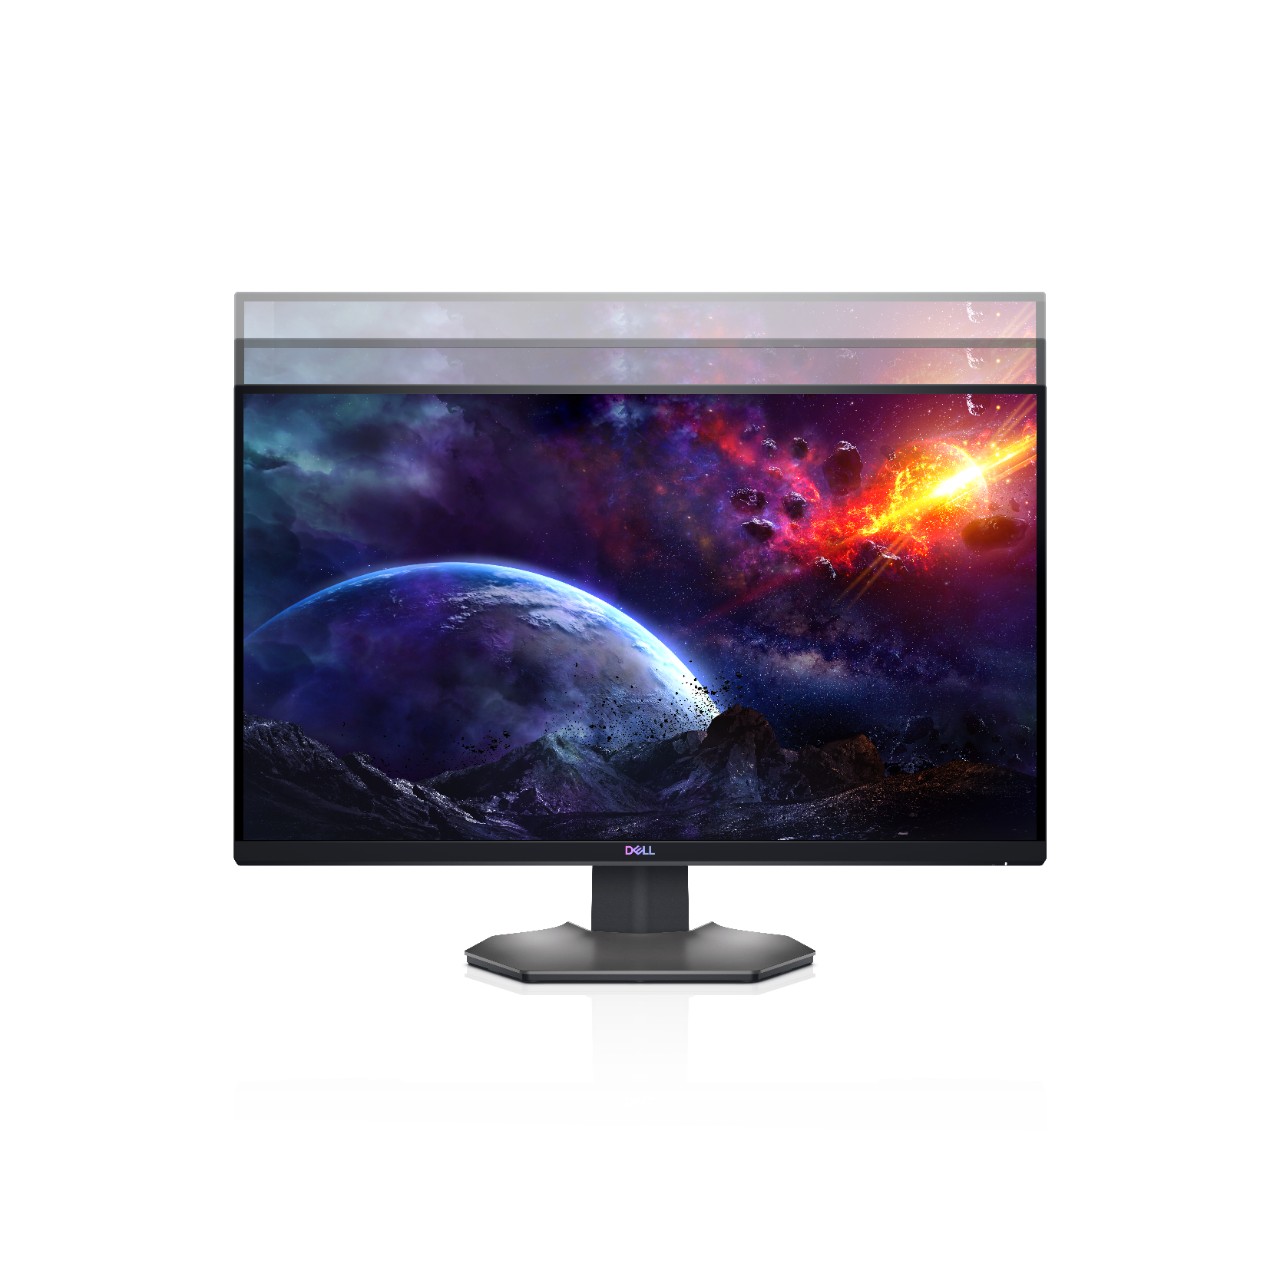
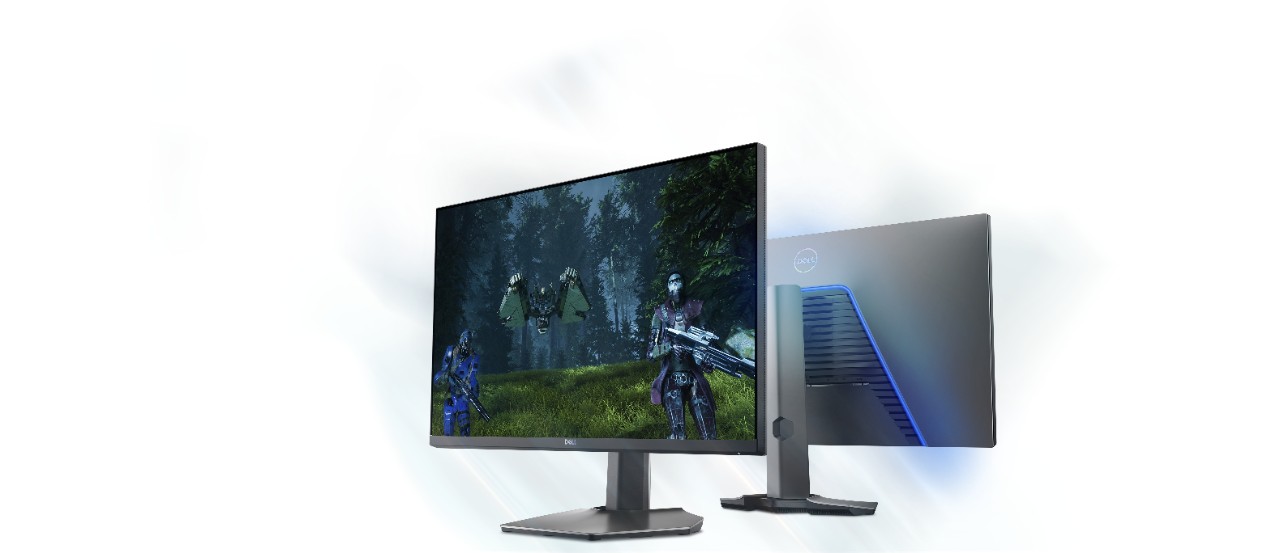
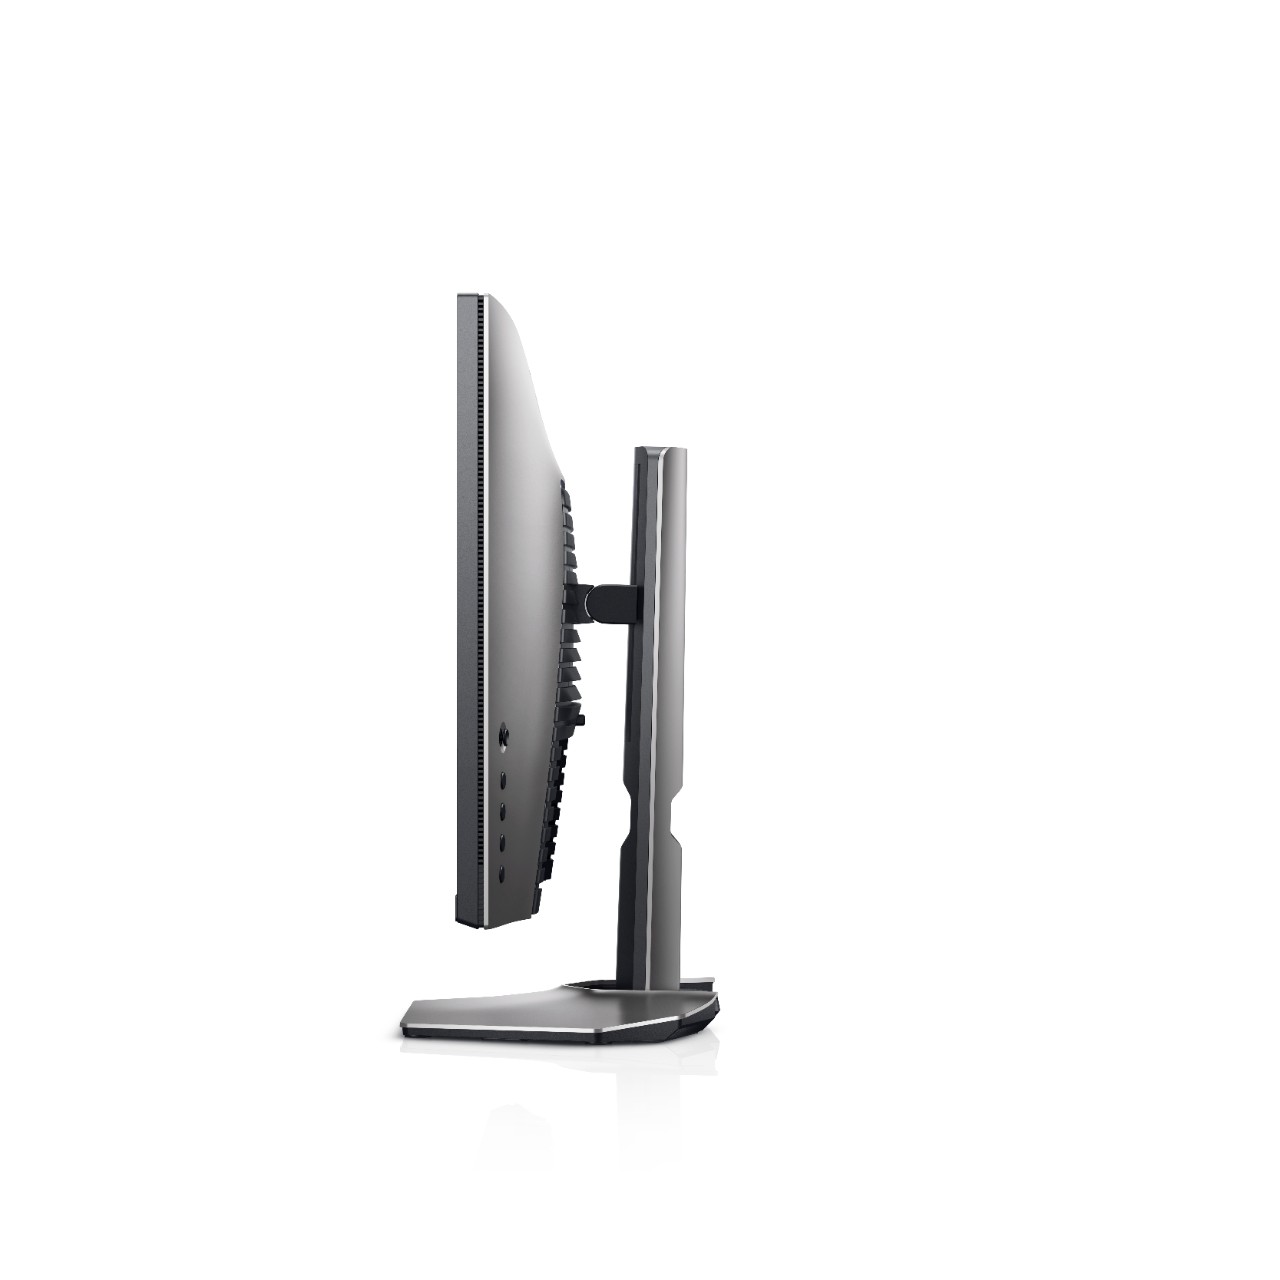
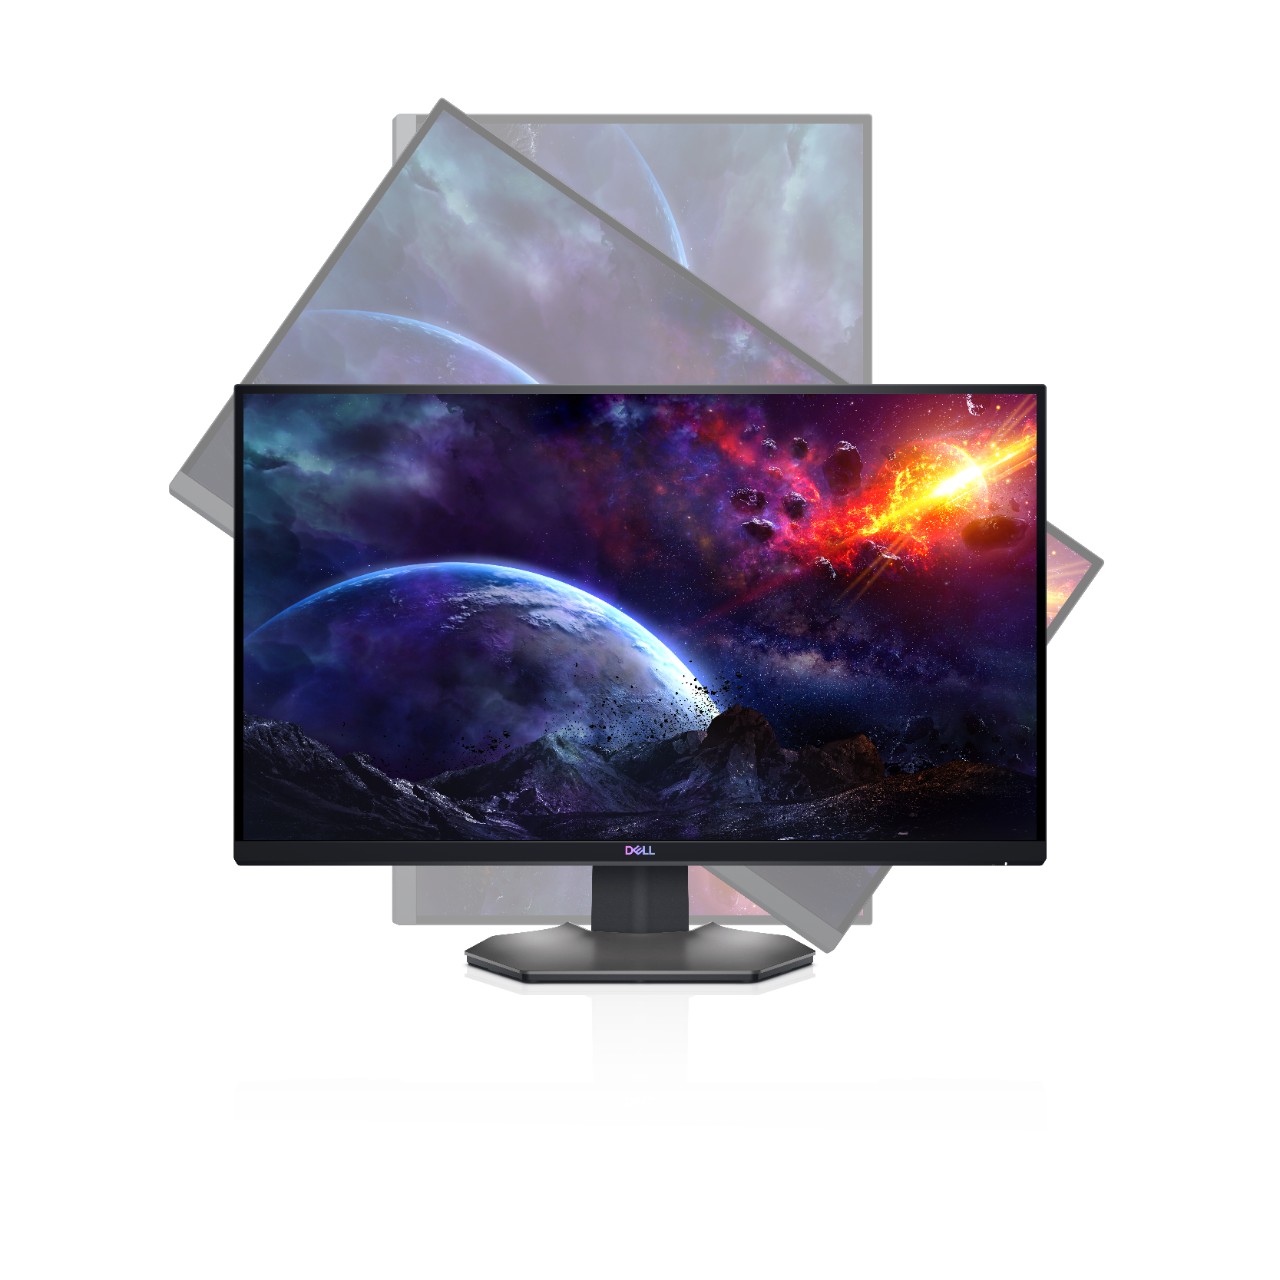
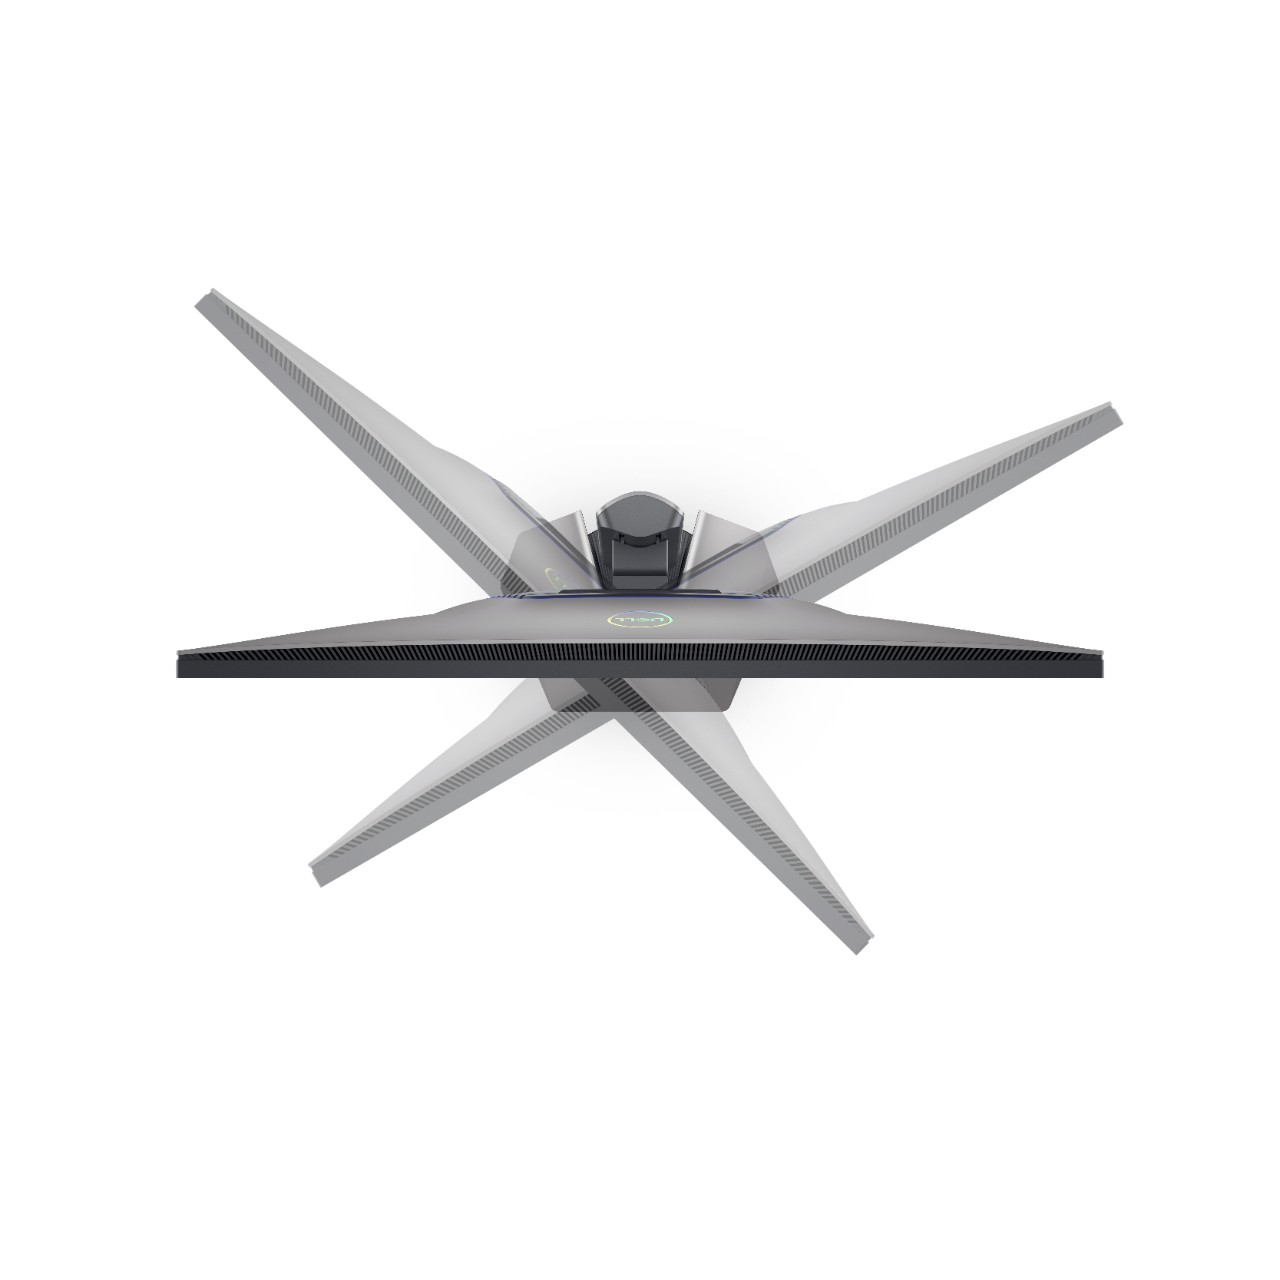
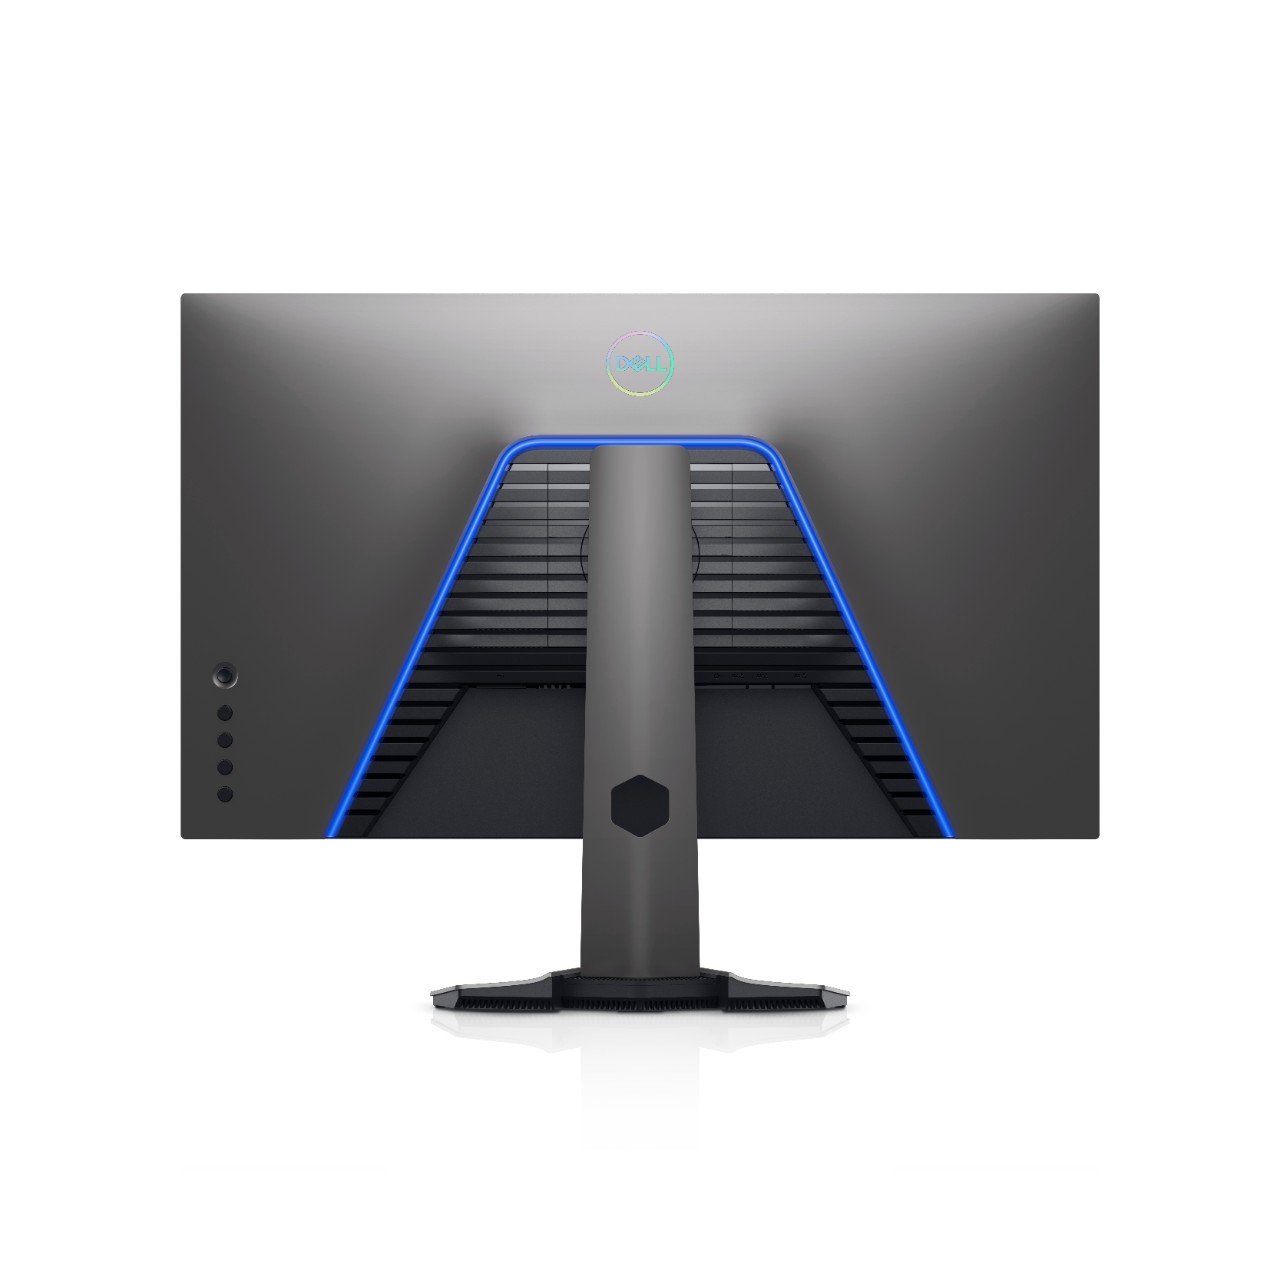
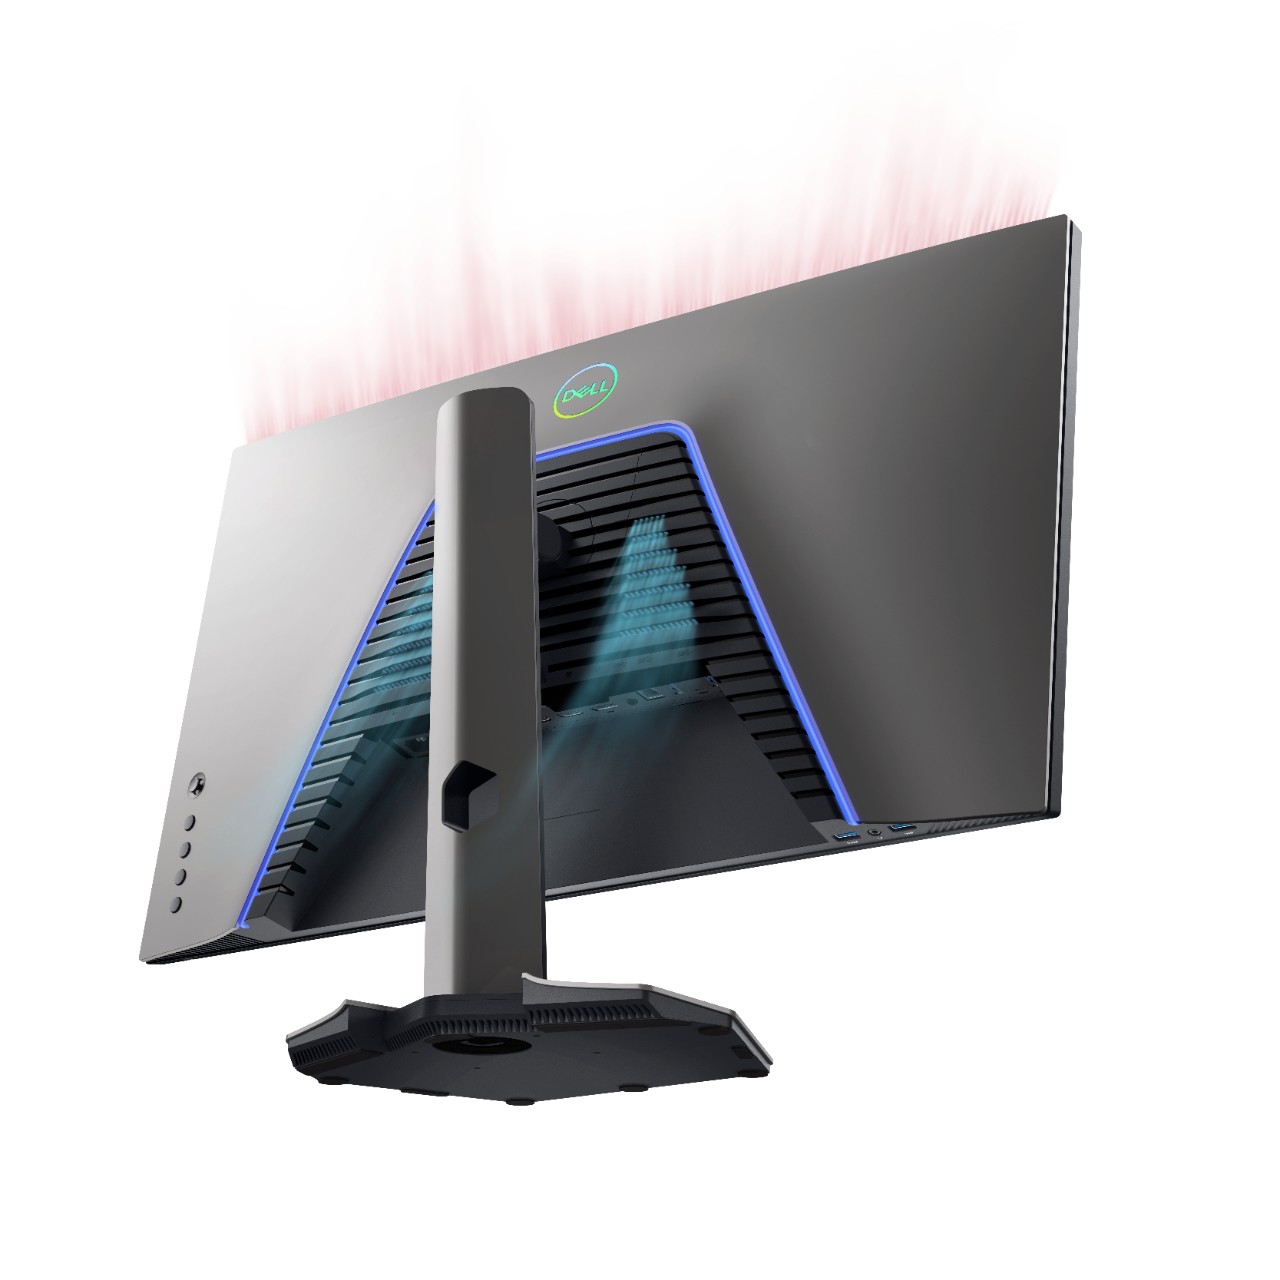
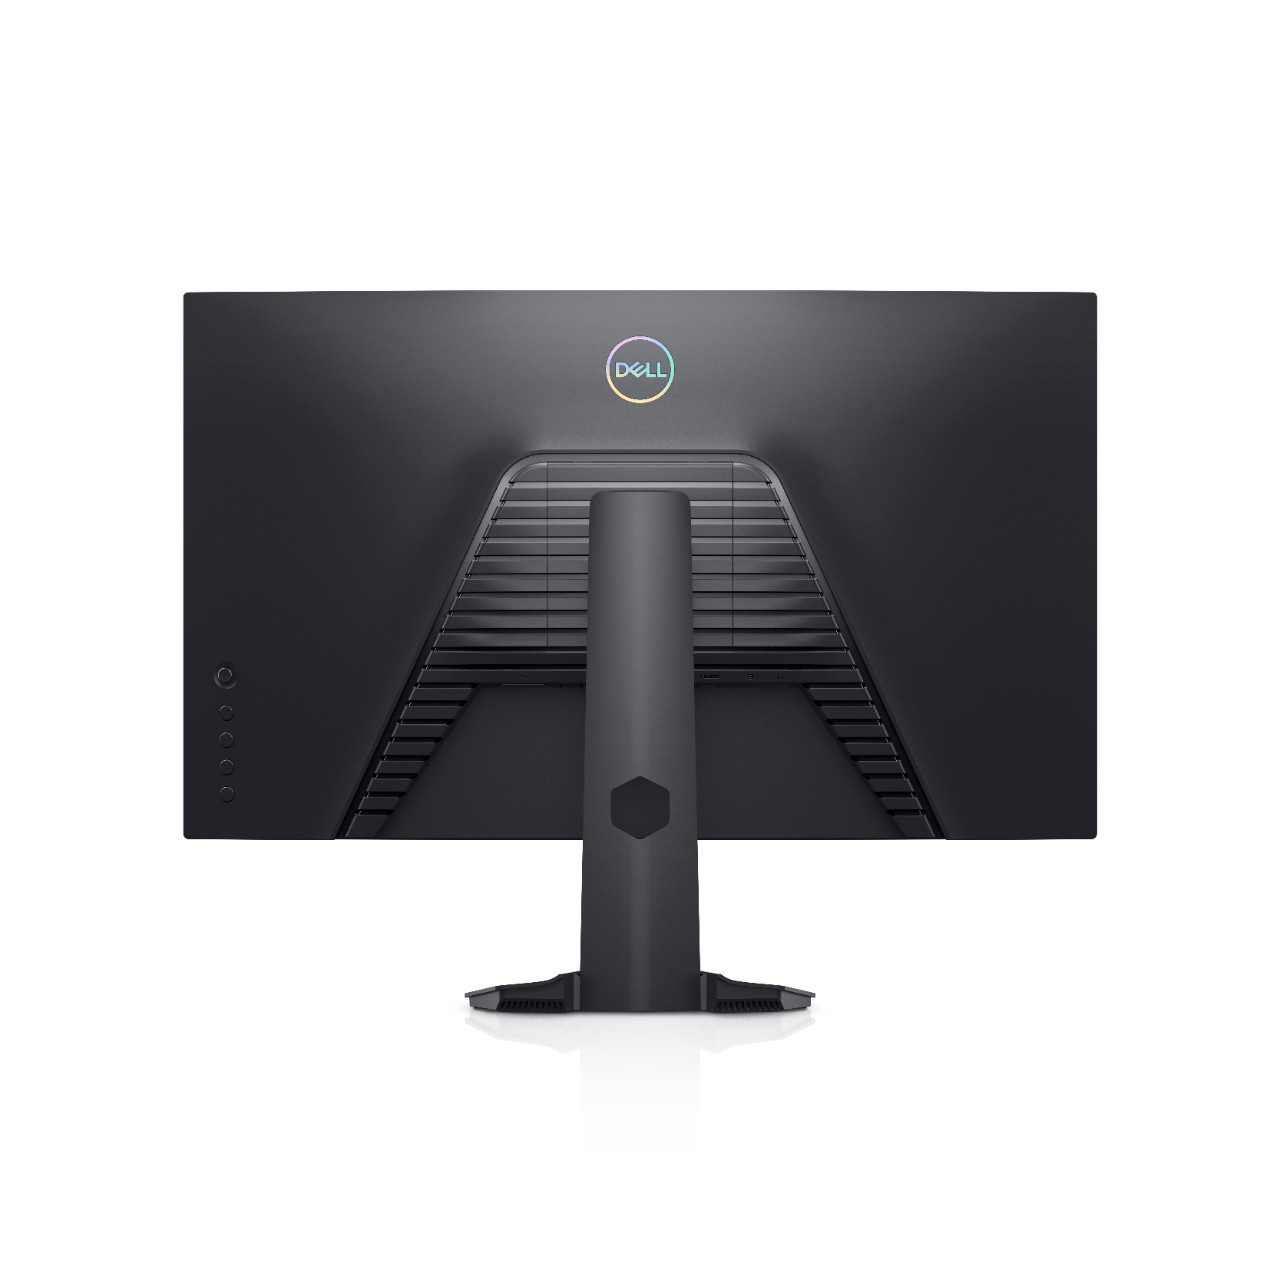
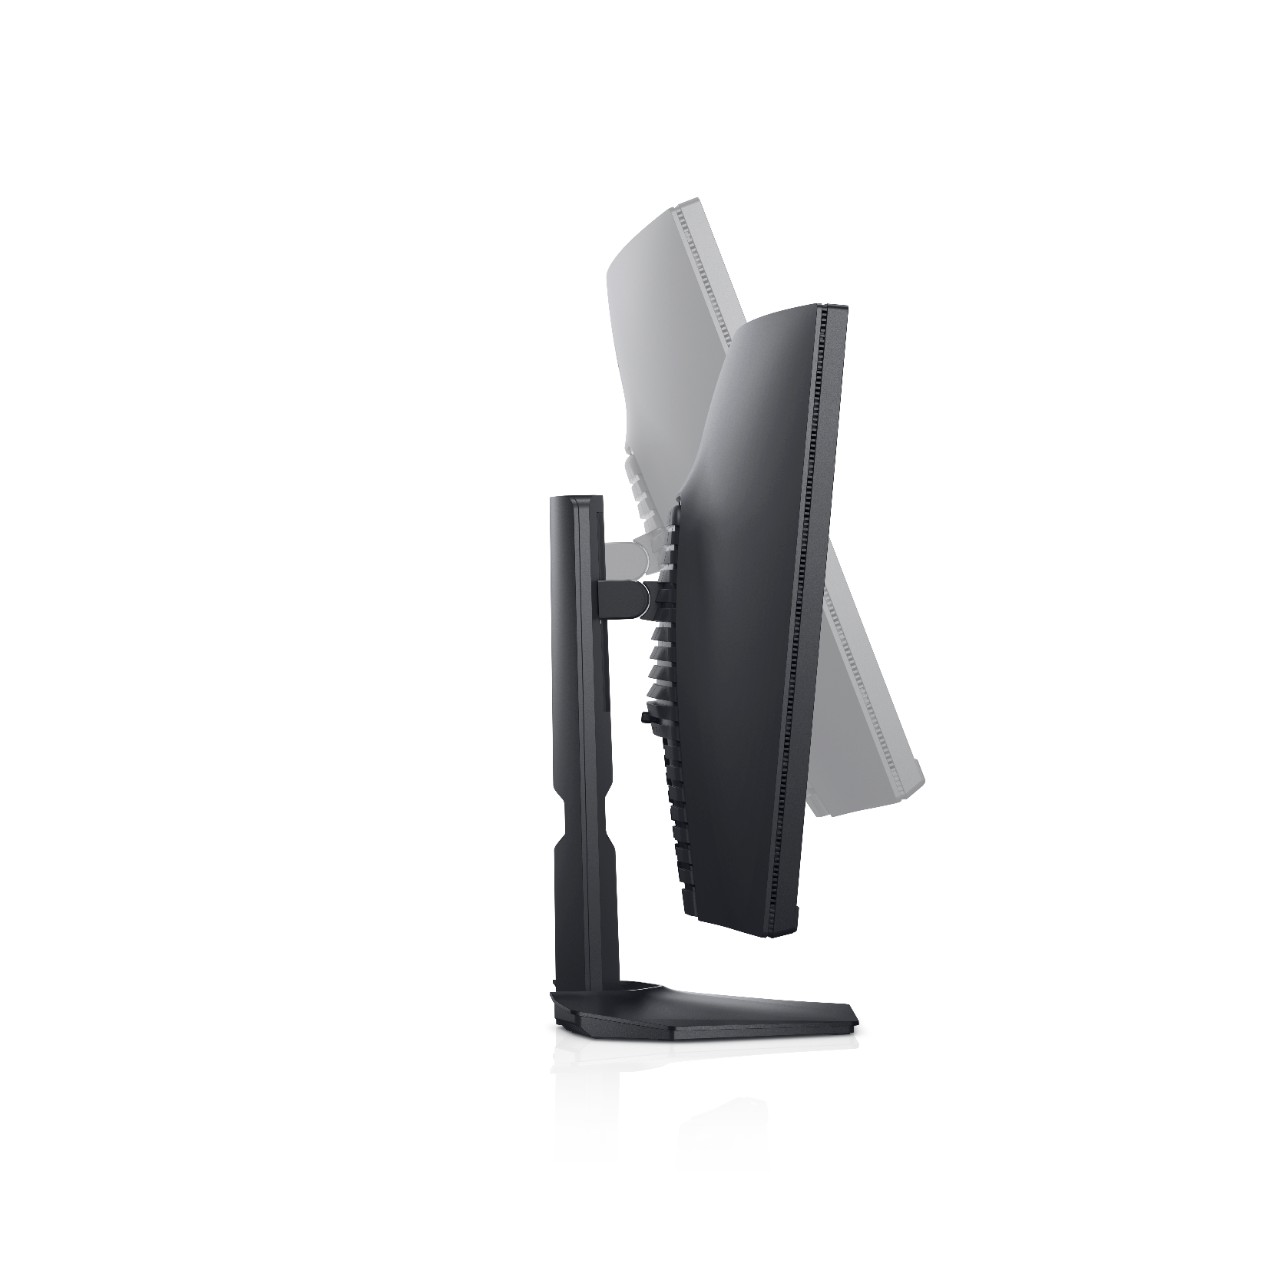
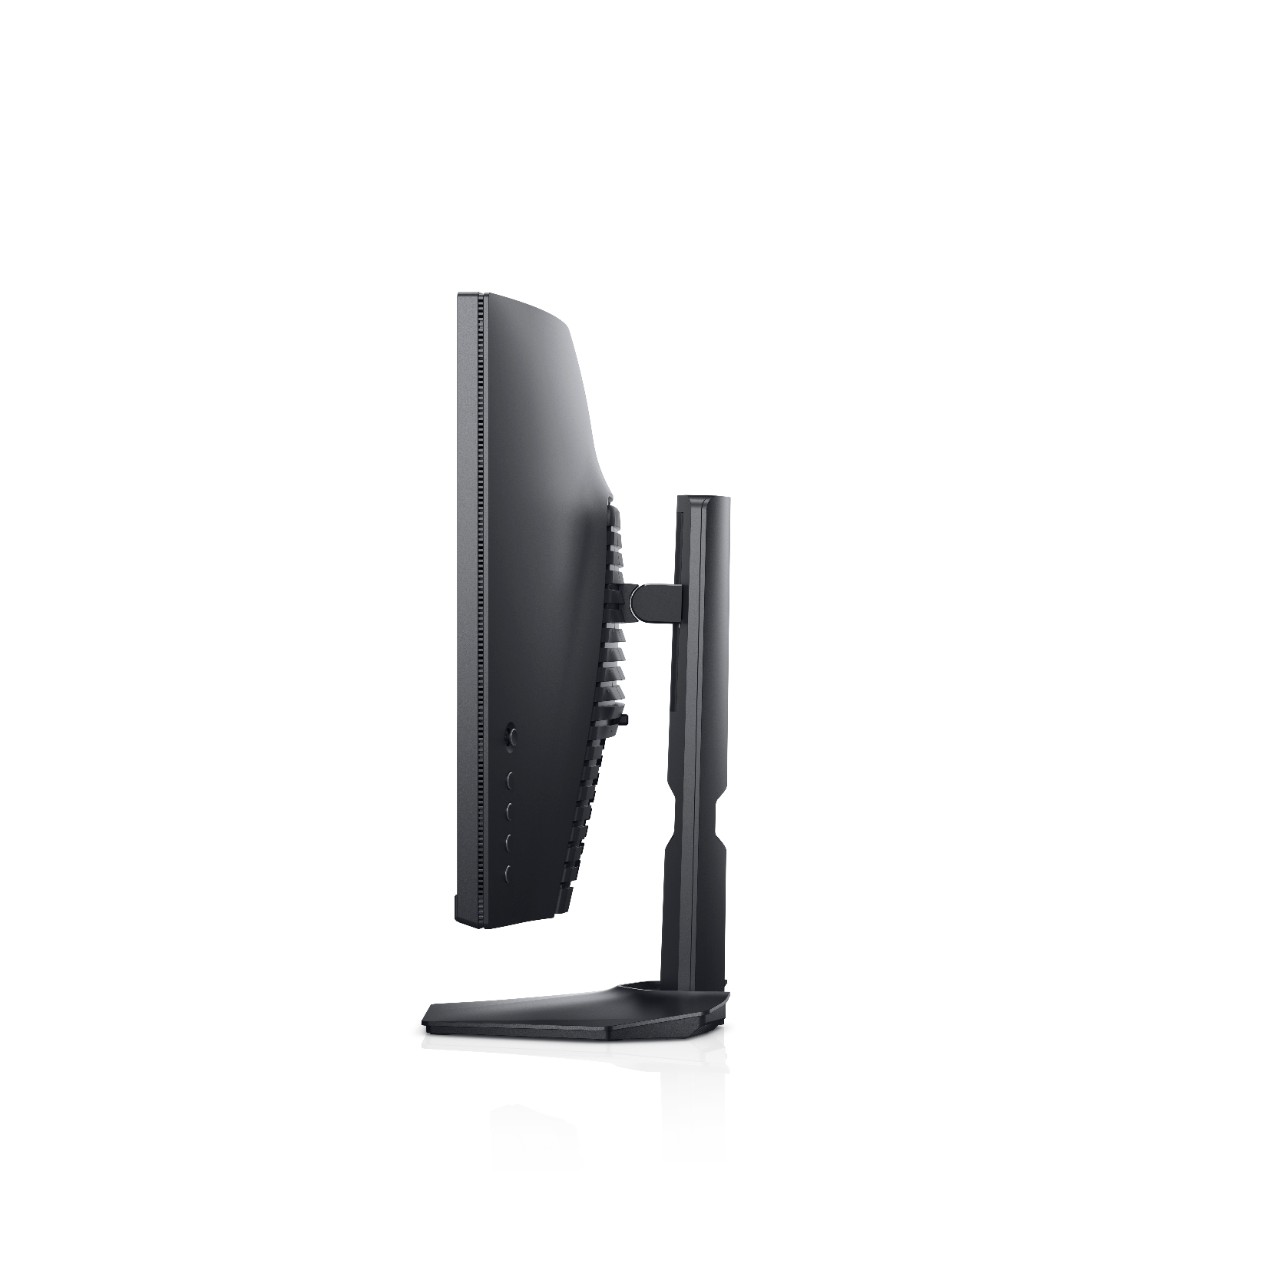
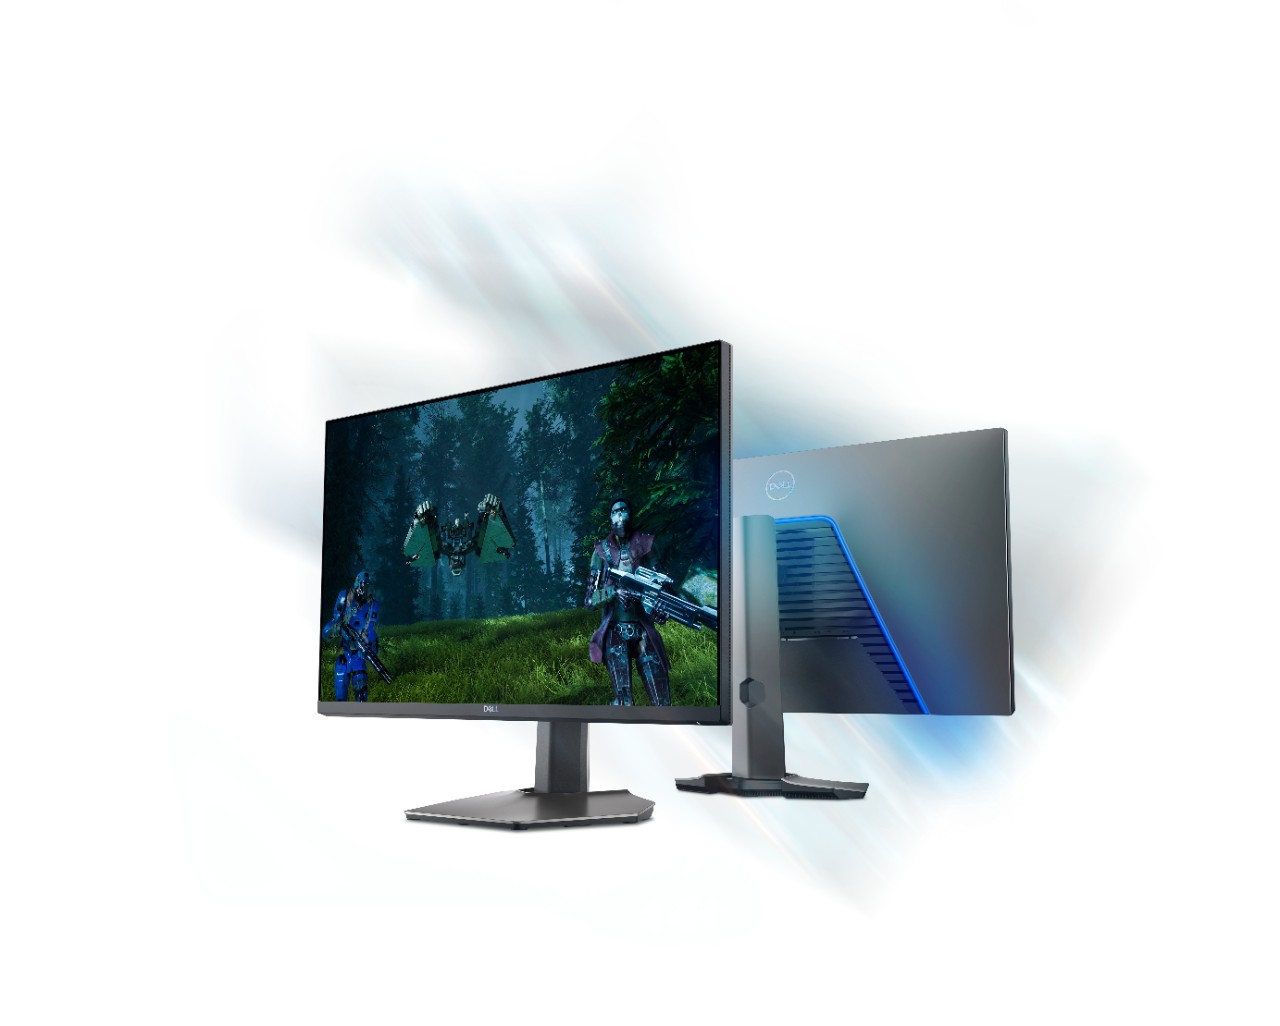
Together with the Dell G5, Dell also announced two gaming monitors: the Dell 27 gaming monitor and the Dell 27 Curved Gaming Monitor. The two monitors join the ranks of the renown Dell monitor series which is well known for display quality and colour reproduction.

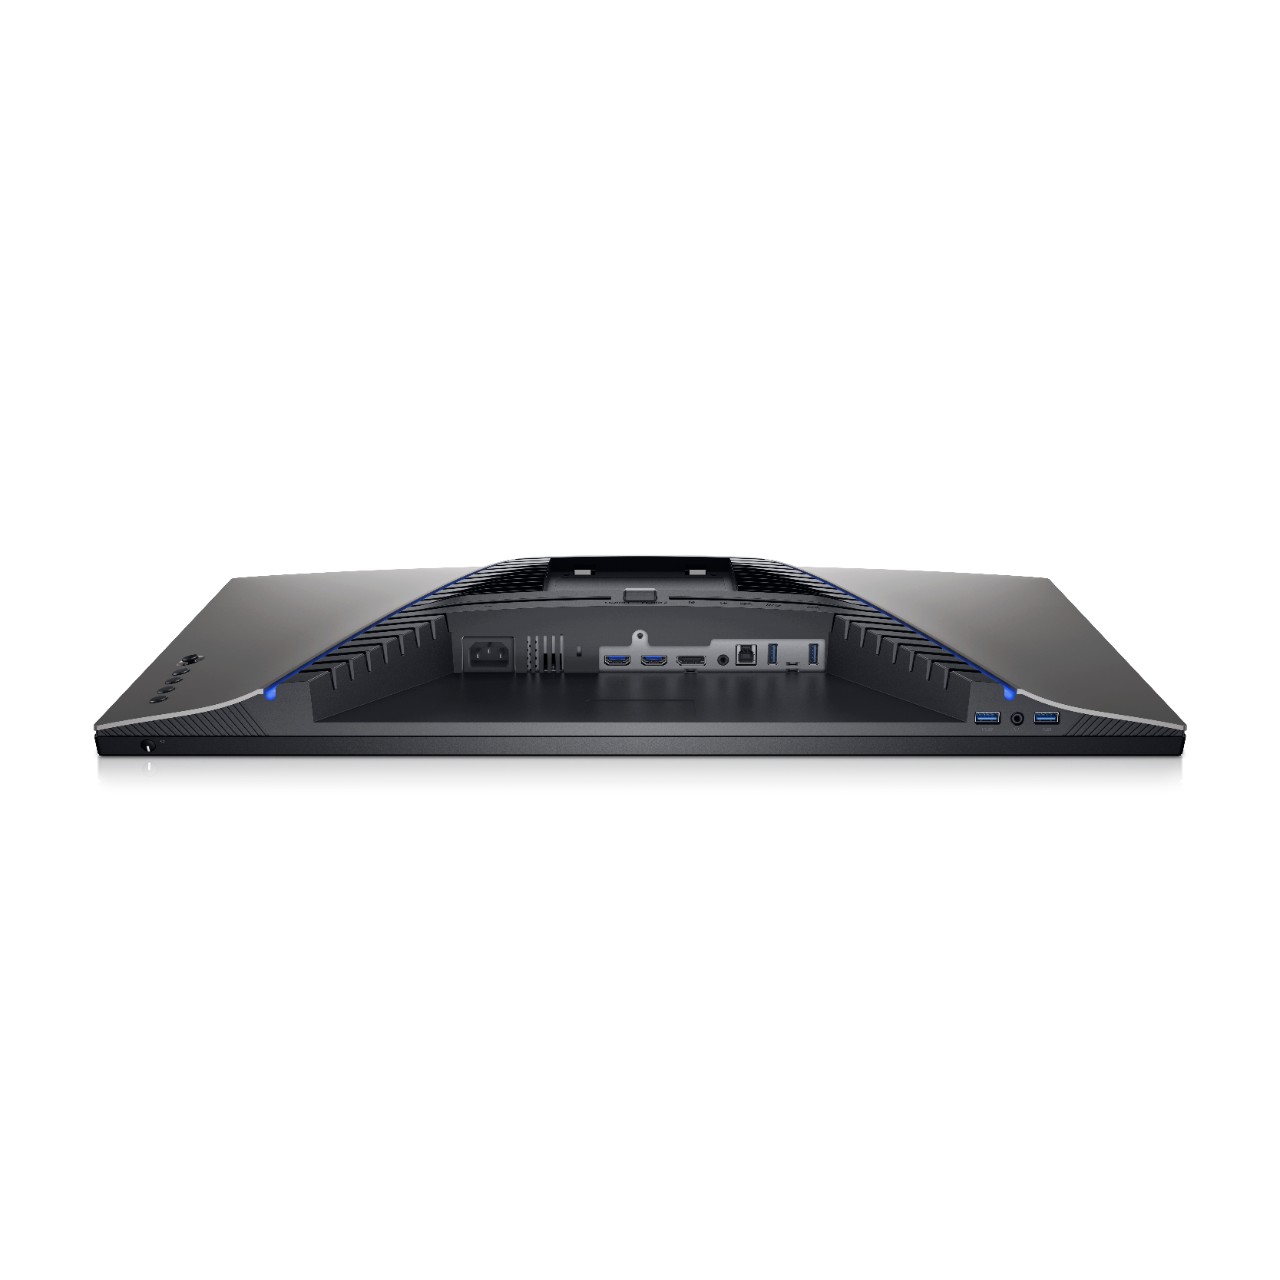
The new Dell 27 gaming monitor is a flat screen monitor. It has a QHD 4K resolution of 2560×1440 pixels. It has options for 144Hz and 165Hz refresh rate. The In-fast IPS Nano Color display has a 16:9 aspect ratio and is HDR compatible. Colour reproduction wise, the monitor covers 98% of the DCI-P3 gamut and has a 1.07 billion colours colour depth. It also has a 1ms grey to grey response time. The Dell 27 Gaming monitor is equipped with LED edge lighting so you can immerse yourself in the game. It has certifications for AMD FreeSync and NVIDIA’s G-Sync. On the back, it comes with 2 HDMI 2.0 ports, 1 Display Port, 4 USB 3.0 downstream ports, 1 USB 3.0 upstream port, a headphone jack and audio line out.

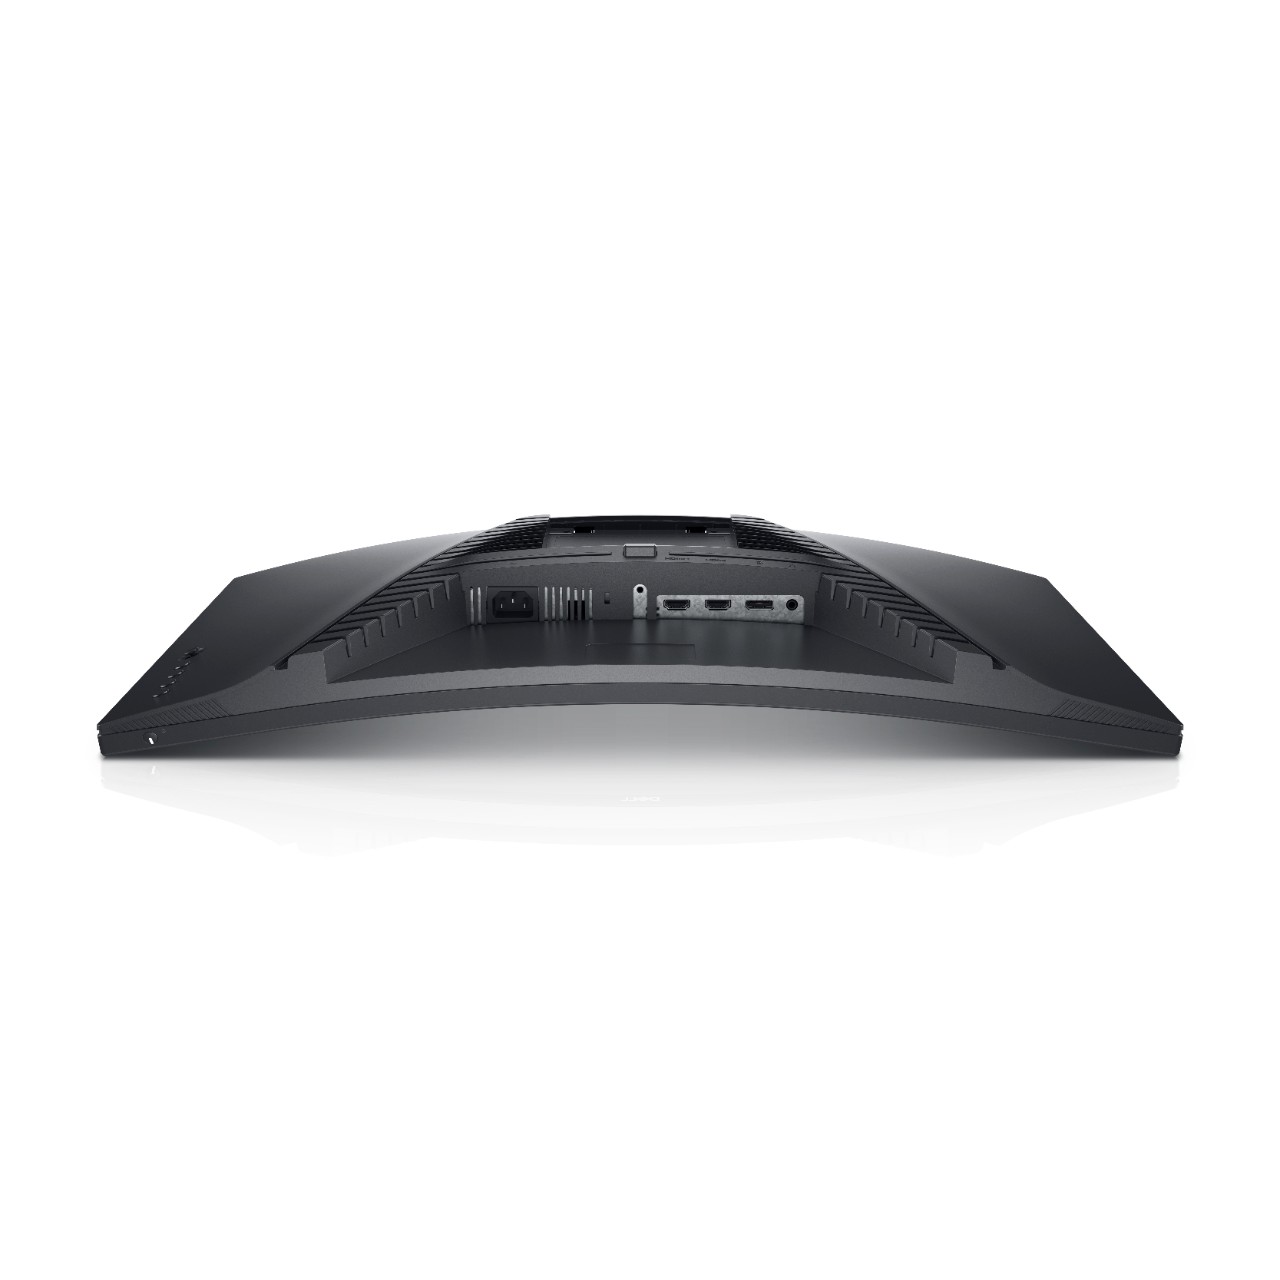
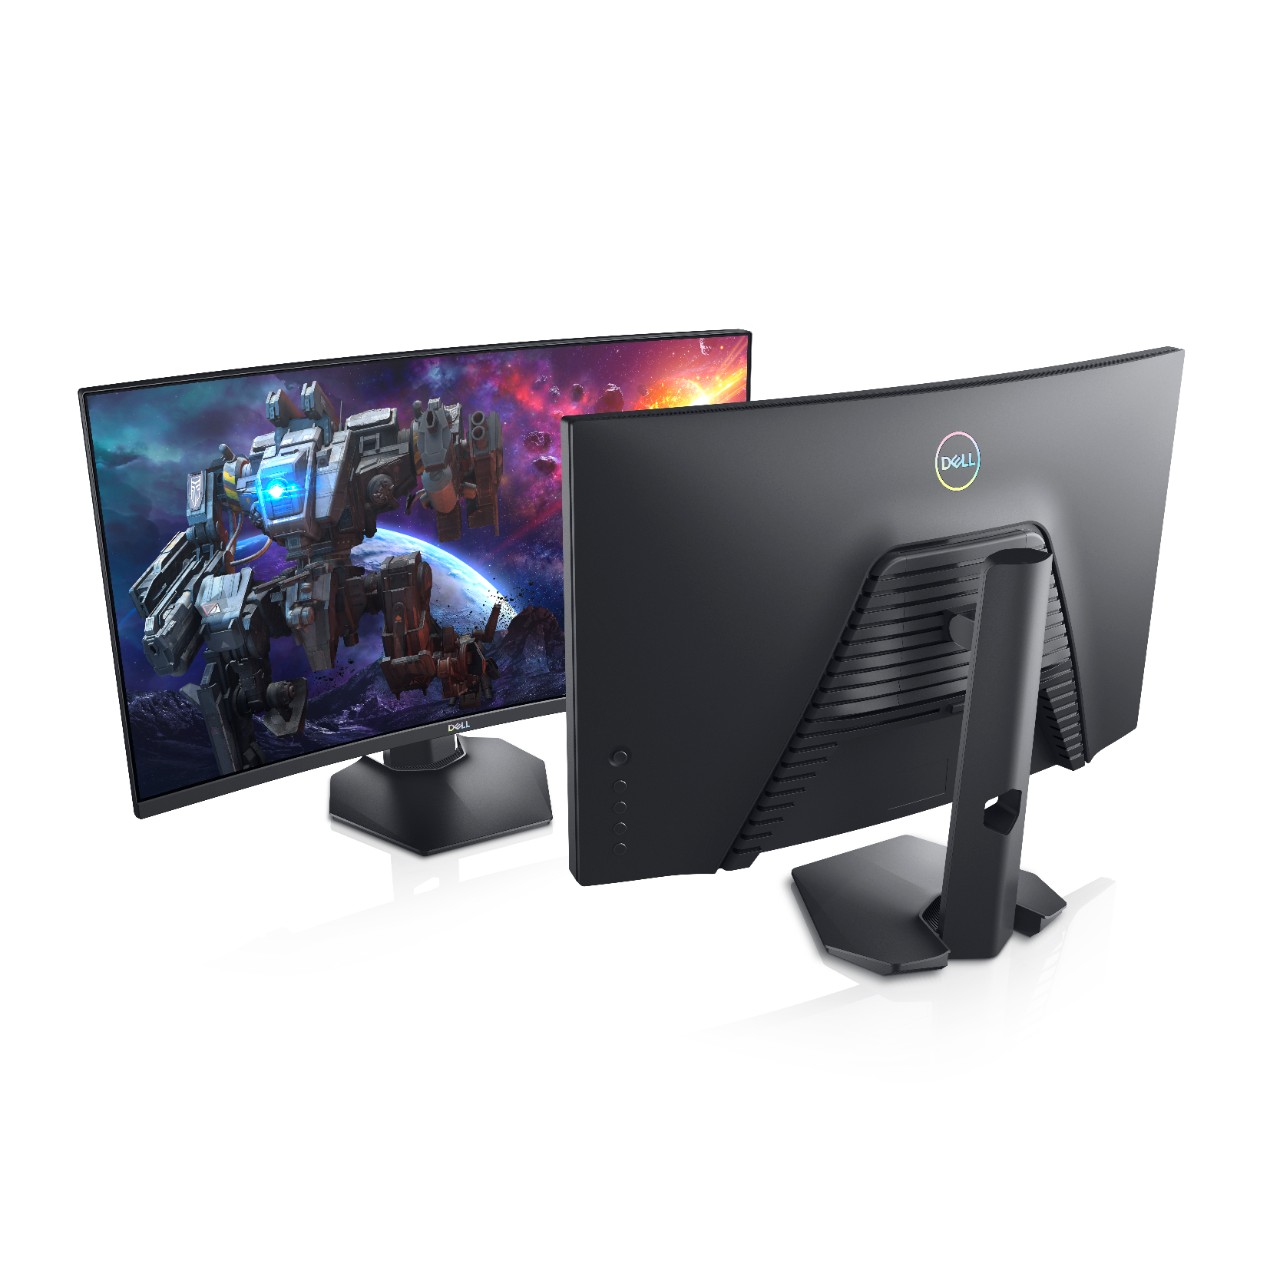
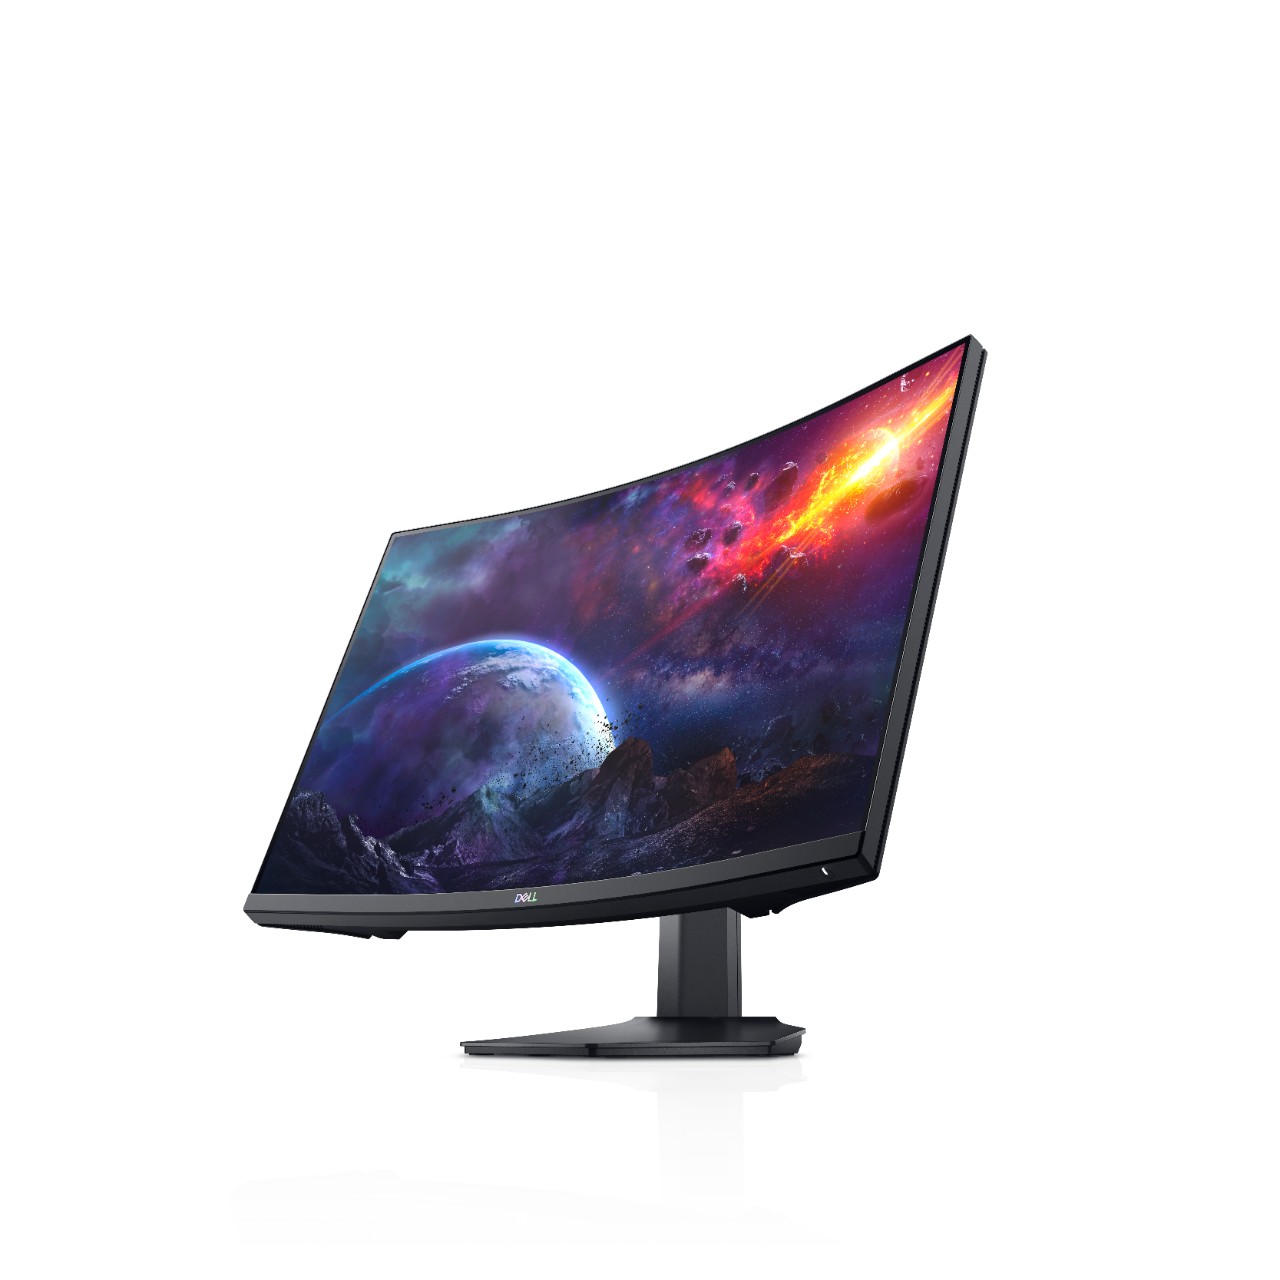
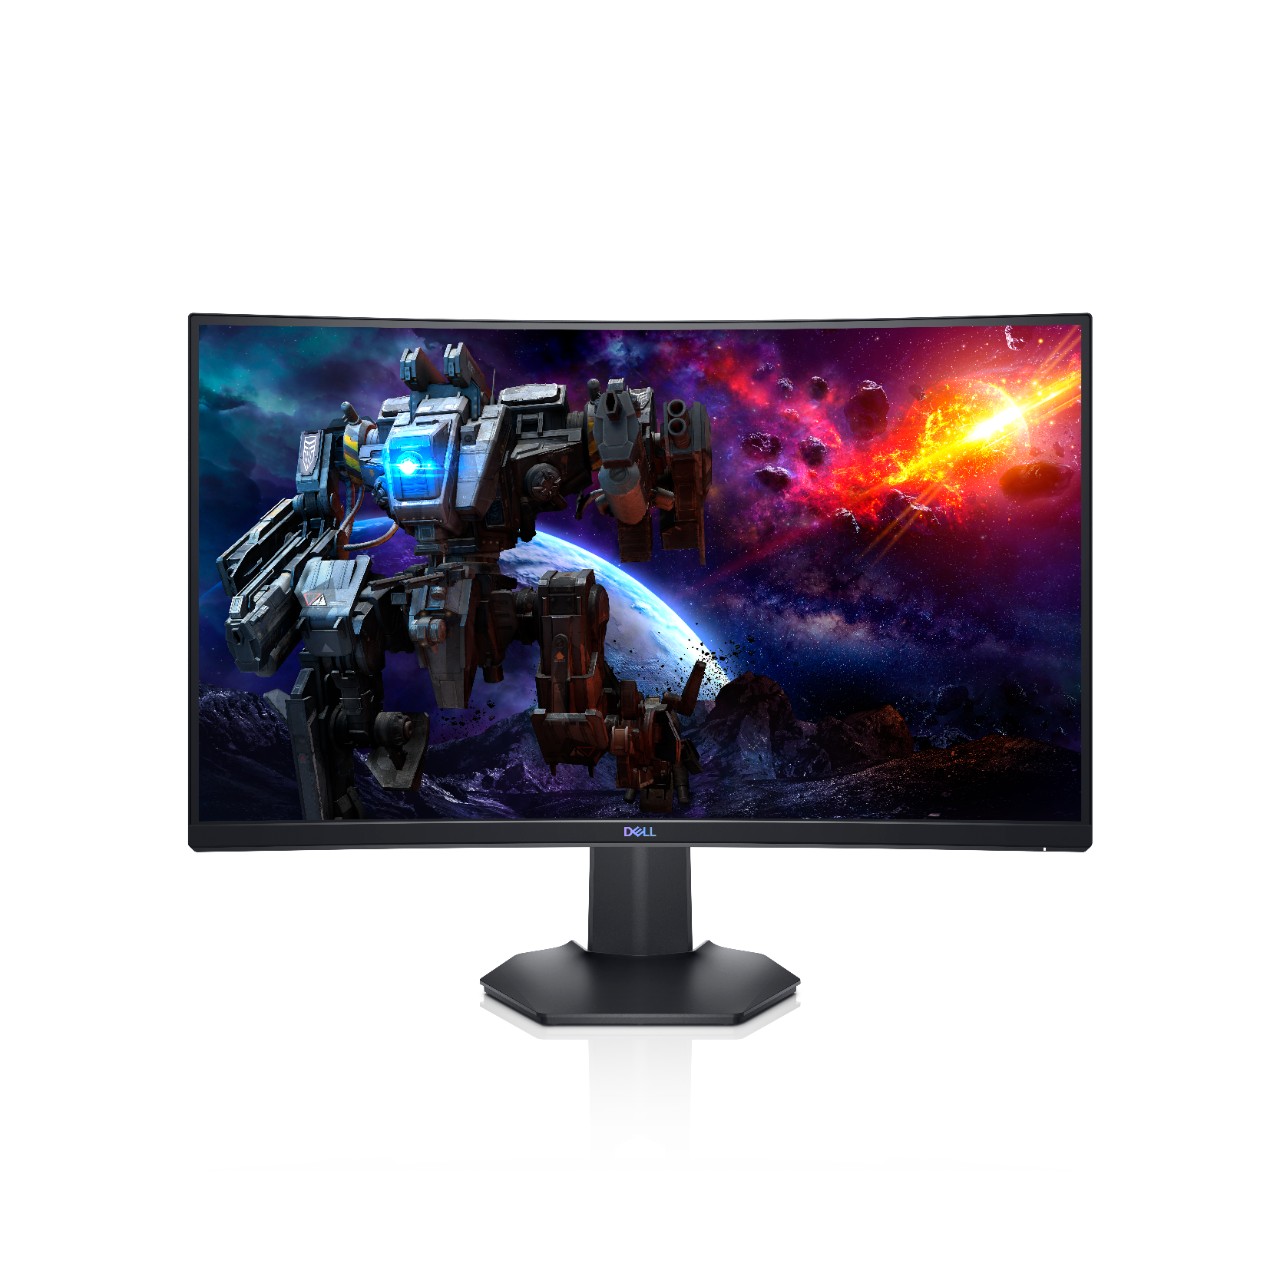
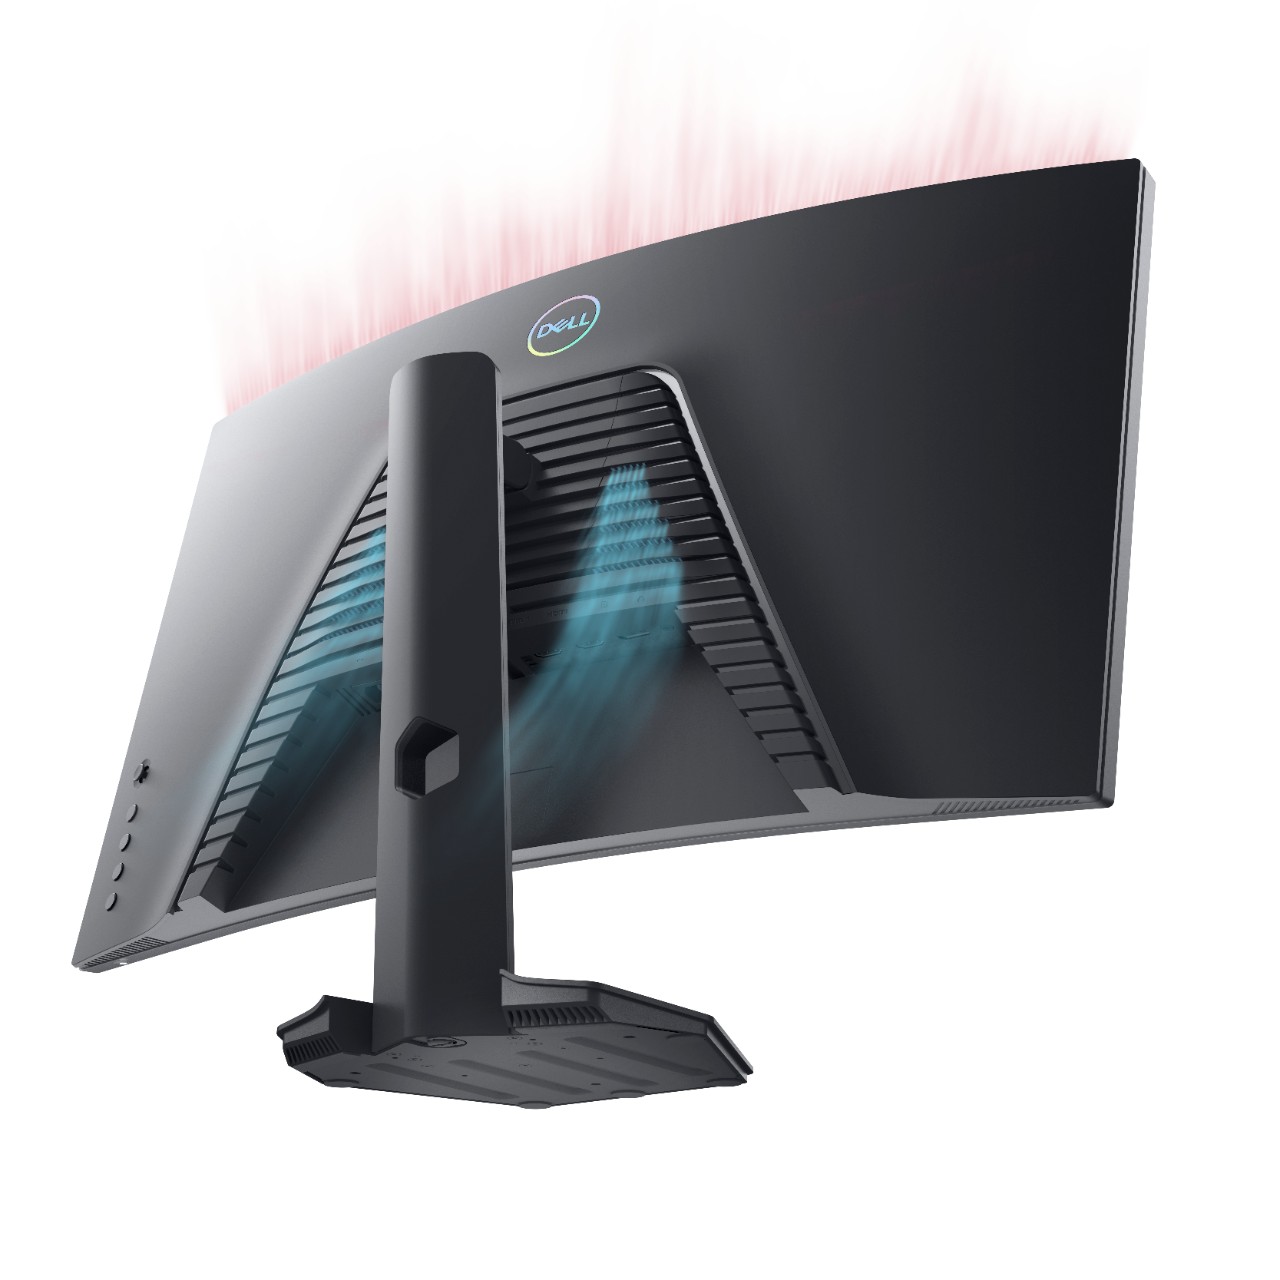
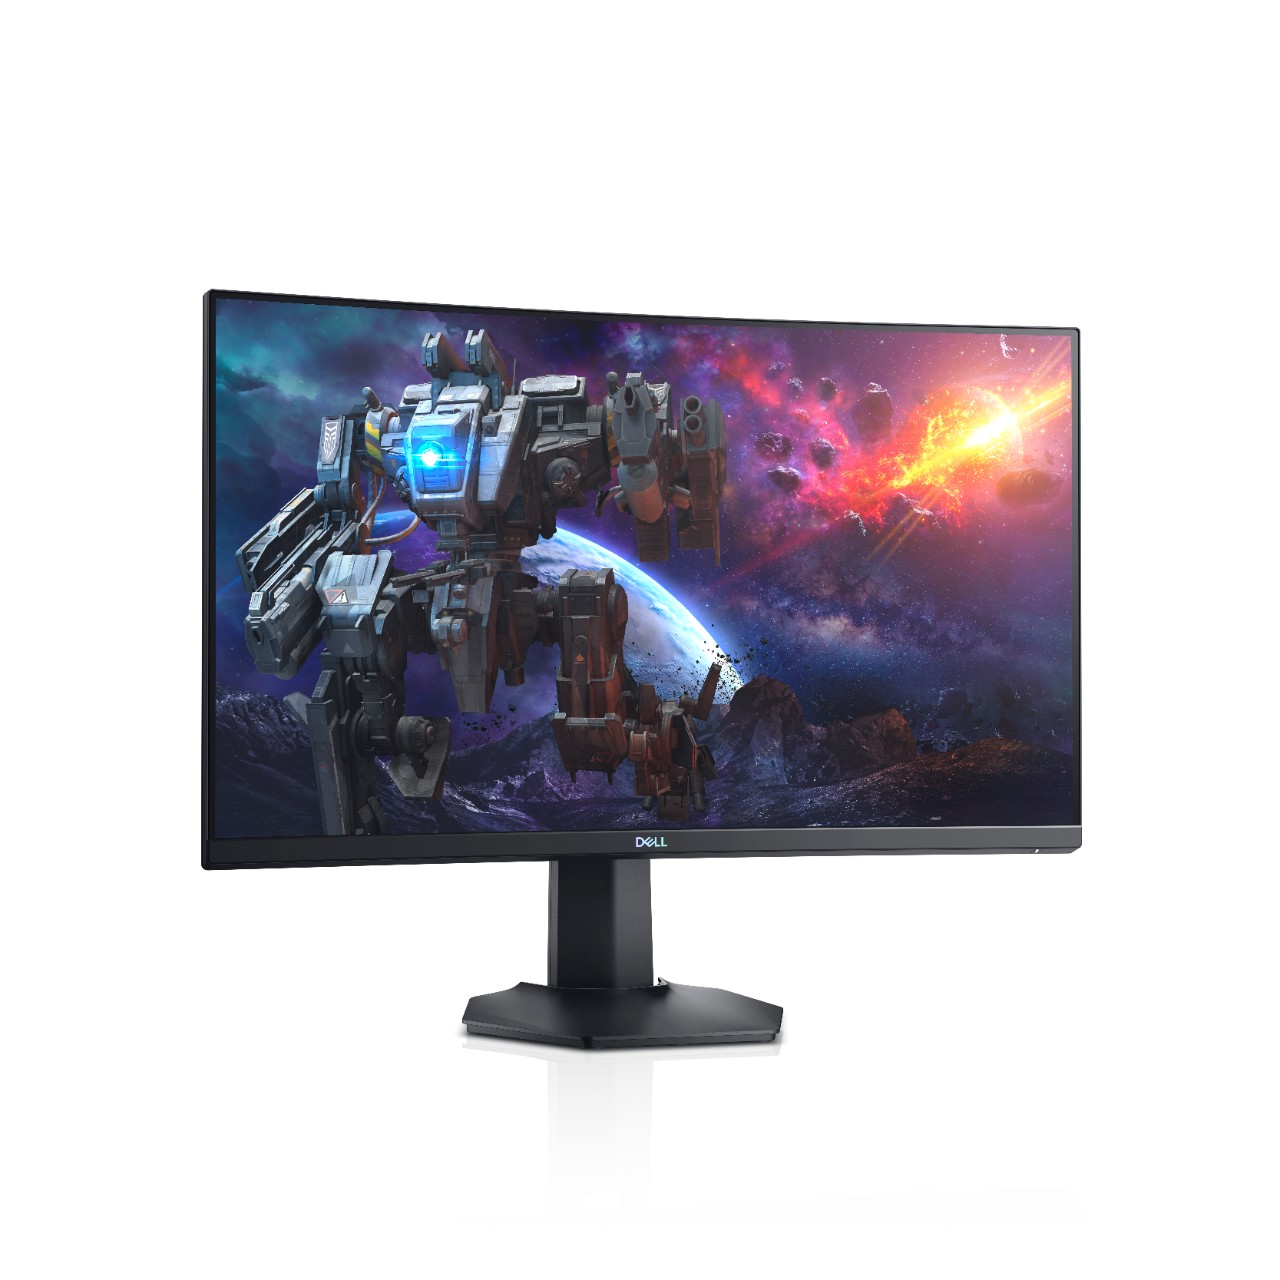
If you’re looking for something more curved, the Dell 27 Curved Gaming monitor has your name on it. The monitor comes with a Full HD display with 144Hz refresh rate. It comes with a 16:9 aspect ratio and is a VA panel. It covers 72% of the NTSC CIE 1931 gamut and 83% of the NTSC CIE 1967 gamut with a colour depth of 16.7 million colours. It has a 4ms grey to grey response time. It also comes with LED edgelighting which enables users to be more immersed into their experience. The monitor is AMD FreeSync and NVIDIA GSync compatible. It has 2 HDMI 1.4 ports, 1 Display port 1.2 and 1 headphone jack at the back.

Pricing & Availability

Dell’s G5 Gaming Desktop hit the market on July 9, 2020 with prices starting from USD$699.99 (MYR2,993.01). The G5 doesn’t look to be making its way to Malaysia. We will update you if this changes.

The Dell 27 Gaming monitor will be available starting June 28, 2020 with prices starting at USD$569.99 (MYR2,436.87).

The Dell 27 Curved Gaming monitor is available started 21 August, 2020 with prices starting at USD$279.99(MYR1,197.04).

Official Specifications

Dell G5 Desktop

Dell 27 Gaming Monitor

Dell 27 Curved Gaming Monitor