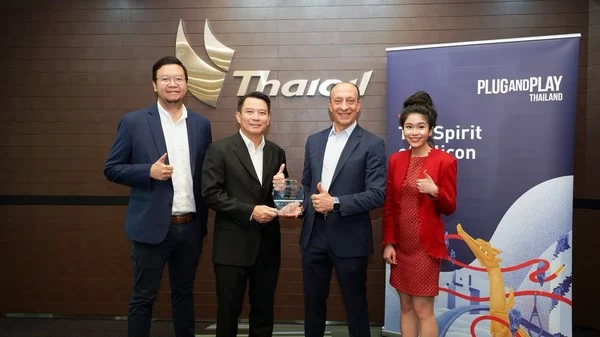
Tag Archives: UTI

Recon Technology, Ltd Reports Financial Results for Fiscal Year 2020

BEIJING, Oct. 10, 2020 — Recon Technology, Ltd. (Nasdaq: RCON) ("Recon" or the "Company"), a China-based independent solutions integrator in the oilfield service and environmental protection, electric power and coal chemical industries, today announced its financial results for fiscal year 2020.

Fiscal 2020 Financial Highlights:

  • Total cost of revenues for fiscal year 2020 decreased by 36.4% to $6.5 million (RMB46.2 million).
  • Gross profit for fiscal year 2020 was $2.8 million (RMB19.6 million). Gross profit margin for fiscal year 2020 was 29.8%, an increase of 0.6 percentage points compared to fiscal year 2019.
  • Net loss attributable to Recon for fiscal year 2020 was $2.7 million (RMB19.2 million), or $0. 59 (RMB4.16) per basic and diluted share, compared to $3.5 million (RMB24.0 million), or $0.92 (RMB6.49) per basic and diluted share for the fiscal year 2019.

Management Commentary

Mr. Shenping Yin, co-founder and CEO of Recon, stated, "The COVID-19 pandemic had a significant impact on our operation of the second-half of fiscal 2020, resulted in a delay in project performance timeline and thus delayed recognition of revenue. Nevertheless, we are pleased with our ability to handle such challenge and we believe our delayed projects will be completed methodically as social and overall conditions in China resume. We’re also very proud that our clients remained stable and we believe our strategy to establish long term cooperation with clients valuing our essential automation solution and value-added services will help us reposition our business by bringing more resources through companies that want to adopt effective online and industrial automotive solutions and Internet-of-Things in China."

"We believe Recon has been prepared for larger projects in automation and environmental protection segments. We never stop improving our business structure and focusing on opportunities that can leverage our knowledge and experience in energy industry. We believe all our current efforts will drive our long-term net profit growth targets," concluded Mr. Yin.

Fiscal 2020 Financial Results:

Revenue

Total revenues were approximately RMB65.8 million ($9.3 million), representing a decrease of 35.8% compared to fiscal year 2019.

Automation products and software. Revenues from automation products and software decreased to approximately RMB51.4 million ($7.3 million), representing a decrease of 19.1% from fiscal year 2019. The decrease was primarily due to the postponed acceptance of several projects and less expenditures budgeted by Shenhua Group and decreased orders from Xinjiang East Hope New Energy Co., Ltd.

Equipment and accessories. Revenue from equipment and accessories decreased to approximately RMB14.2 million ($2.0 million), representing a decrease of 40.6% from fiscal year 2019, mainly due to less demand of the Company’s products by oilfield companies as a result of low oil price.

Oilfield environmental protection. Revenue from oilfield environmental protection decreased by 99.2% to almost nil for this period, mainly affected by late acceptance inspection of the Company’s Gansu production project, thus orders were not fulfilled and revenue was not recognized during the fiscal year 2020.

Cost and Margin

Total cost of revenues decreased by 36.4% to approximately RMB46.2 million ($6.5 million), mainly due to the decreased cost in line with revenue.

Gross profit decreased to approximately RMB19.6 million ($2.8 million), representing a decrease of 34.4% from fiscal year 2019. Gross margin was maintained at a same level of 29.8%, compared to a 29.2% of last year. Specifically, gross margin for automation and equipment segments were all improved during fiscal year 2020. The Company expects that the gross margin for oilfield environmental protection segment will be back to a 40% level when the treatment process is completed and revenue is recognized.

Operating Expenses

Total operating expenses decreased to approximately RMB39.8 million ($5.6 million), representing a decrease of 26.5%.

Selling and distribution expenses. Selling and distribution expenses were approximately RMB4.4 million ($0.6 million), representing a 51.3% decrease from fiscal year 2019. This decrease was mainly caused by less traveling expenses and entertainment expenses as the Company tried to control its operating expenditure, as well as the restriction on travelling and outdoor activities imposed by PRC government due to the COVID-19 during the fiscal year 2020.

General and Administrative Expenses. General and administrative expenses was approximately RMB26.1 million ($3.7 million), representing a 36.7% decrease from fiscal year 2019. The decrease was mainly due to the decrease in stock-based compensation expense.

Research and development expenses. Research and development expenses were approximately RMB7.0 million ($1.0 million), representing an increase of 7.6% from fiscal year 2019. This increase was primarily due to more expenses spent on design of new automation platform systems.

Net Loss

Loss from operations was RMB20.2 million ($2.9 million), representing a decrease of 22.0% from fiscal year 2019, which was a loss of RMB25.8 million.

Basic and diluted EPS. Basic and diluted net loss per share were RMB4.16 ($0.59), compared to RMB6.49 ($0.92) in fiscal year 2019.

Financial Condition

As of June 30,2020, the Company had cash of RMB30.3 million ($4.3 million), compared to RMB4.5 million as of June 30, 2019. As of June 30, 2020, the Company had working capital of RMB64.1 million ($9.1 million), while as of June 30, 2019, the Company had working capital of RMB55.7 million. The increase was mainly contributed to securities offerings during May and June of 2020.

Net cash used in operating activities was RMB5.2 million ($0.7 million) for fiscal year 2020, compared to net cash used in operating activities of approximately RMB32.2 million for fiscal year 2019. Net cash used in investing activities was RMB2.1 million ($0.3 million) for fiscal year 2020, compared to RMB13.5 million for fiscal year 2019. Net cash provided by financing activities was RMB33.2 million ($4.7 million) for fiscal year 2020, compared to net cash provided by financing activities of RMB3.5 million for fiscal year 2019.

Exchange Rate

The translation of RMB amounts into U.S. dollars are included solely for the convenience of readers and have been made at the rate of RMB7.06973 to $1.00, the approximate exchange rate prevailing on December 31, 2019.

About Recon Technology, Ltd.

Recon Technology, Ltd. (RCON) is China’s first non-state-owned oil and gas field service company listed on NASDAQ. Recon supplies China’s largest oil exploration companies with advanced automated technologies, efficient gathering and transportation equipment and reservoir stimulation measures for increasing petroleum extraction levels, reducing impurities and lowering production costs. Since 2017, the Company has expanded its business operations into other segments of the broader energy industry including electric power, coal chemicals, renewable energy and environmental protection in the energy and chemical industries. Through the years, Recon has taken leading positions on several market segments of the oil and gas field service industry. Recon also has developed stable long-term cooperation relationships with its major clients, and its products and service are well accepted by clients. For additional information please visit: www.recon.cn.

Safe Harbor Statement

This news release contains forward-looking statements as defined by the Private Securities Litigation Reform Act of 1995. Forward-looking statements include statements concerning plans, objectives, goals, strategies, future events or performance, and underlying assumptions and other statements that are other than statements of historical facts. These statements are subject to uncertainties and risks including, but not limited to, product and service demand and acceptance, changes in technology, economic conditions, the impact of competition and pricing, government regulation, the effect of novel coronavirus and other health matters on target markets, and other risks contained in reports filed by the company with the Securities and Exchange Commission. All such forward-looking statements, whether written or oral, and whether made by or on behalf of the company, are expressly qualified by the cautionary statements and any other cautionary statements which may accompany the forward-looking statements. In addition, the company disclaims any obligation to update any forward-looking statements to reflect events or circumstances after the date hereof.

IR contact:

In China:

Ms. Liu Jia
Recon Technology, Ltd.
Phone: +86 (10) 8494-5799
Email: info@recon.cn


RECON TECHNOLOGY, LTD

CONSOLIDATED BALANCE SHEETS

As of June 30

As of June 30

As of June 30

2019

2020

2020

ASSETS

RMB

RMB

U.S. Dollars

Current assets

Cash

¥

4,521,325

¥

30,336,504

$

4,291,042

Notes receivable

3,073,680

4,180,885

591,378

Trade accounts receivable, net

68,535,282

48,244,015

6,824,026

Trade accounts receivable- related party, net

3,409,912

3,068,920

434,093

Inventories, net

1,270,523

1,985,723

280,877

Other receivables, net

5,665,593

6,350,802

898,309

Loans to third parties

4,960,000

3,200,377

452,687

Purchase advances, net

1,343,576

178,767

25,286

Contract assets, net

4,633,940

31,537,586

4,460,933

Prepaid expenses

192,837

198,294

28,048

Prepaid expenses – related parties

217,600

Total current assets

97,824,268

129,281,873

18,286,679

Property and equipment, net

3,661,321

29,756,879

4,209,055

Construction in progress

21,524,994

Land use right, net

1,307,887

1,280,648

181,145

Investment in unconsolidated entity

31,078,971

31,541,850

4,461,536

Long-term other receivables, net

440,015

3,640

515

Prepayments for construction in progress

1,144,098

Operating lease right-of-use assets (including ¥Nil and ¥803,503
($113,654) from a related party as of June 30, 2019 and 2020, respectively)

2,549,914

360,681

Total Assets

¥

156,981,554

¥

194,414,804

$

27,499,611

LIABILITIES AND STOCKHOLDERS’ EQUITY

Current liabilities

Short-term bank loans

¥

2,500,000

¥

9,520,000

$

1,346,586

Trade accounts payable

14,089,293

23,034,347

3,258,163

Other payables

2,246,410

2,609,486

369,107

Other payable- related parties

2,290,873

4,498,318

636,279

Contract Liabilities

120,000

3,486,033

493,093

Accrued payroll and employees’ welfare

1,384,529

1,917,635

271,246

Investment payable

6,400,000

6,400,000

905,268

Taxes payable

2,180,847

1,108,288

156,765

Short-term borrowings

1,081,096

200,000

28,290

Short-term borrowings – related parties

9,010,525

10,230,746

1,447,120

Long-term borrowings – related party – current portion

780,797

847,346

119,856

Operating lease liabilities – current (including ¥Nil and ¥450,728
($63,755) from a related party as of June 30, 2019 and 2020, respectively)

1,328,976

187,981

Total Current Liabilities

42,084,370

65,181,175

9,219,754

Operating lease liabilities – non-current (including ¥Nil and ¥352,775
($49,899) from a related party as of June 30, 2019 and 2020, respectively)

1,210,088

171,165

Long-term borrowings – related party

8,196,204

7,379,253

1,043,782

Total Liabilities

50,280,574

73,770,516

10,434,701

Commitments and Contingencies

Equity

Common stock, ($ 0.0925 U.S. dollar par value, 20,000,000 shares
authorized; 4,361,634 shares and 7,202,832 shares issued and outstanding
as of June 30, 2019 and June 30, 2020, respectively) *

2,712,773

4,577,233

647,441

Additional paid-in capital

250,624,798

282,505,455

39,959,870

Statutory reserve

4,148,929

4,148,929

586,858

Accumulated deficit

(164,780,885)

(184,027,586)

(26,030,358)

Accumulated other comprehensive gain

2,909,936

2,825,731

399,694

Total stockholders’ equity

95,615,551

110,029,762

15,563,505

Non-controlling interests

11,085,429

10,614,526

1,501,405

Total equity

106,700,980

120,644,288

17,064,910

Total Liabilities and Equity

¥

156,981,554

¥

194,414,804

$

27,499,611


RECON TECHNOLOGY, LTD

CONSOLIDATED STATEMENTS OF OPERATIONS AND COMPREHENSIVE LOSS

For the years ended June 30,

2018

2019

2020

2020

RMB

RMB

RMB

USD

Revenues

Revenues – third party

¥

84,135,037

¥

98,657,433

¥

65,760,651

$

9,301,722

Revenues – related party

577,009

3,726,894

Revenues

84,712,046

102,384,327

65,760,651

9,301,722

Cost of revenues

Cost of revenues – third party

80,097,834

70,316,198

46,154,255

6,528,433

Cost of revenues – related party

464,027

2,202,765

Cost of revenues

80,561,861

72,518,963

46,154,255

6,528,433

Gross profit

4,150,185

29,865,364

19,606,396

2,773,289

Selling and distribution expenses

8,013,353

9,076,266

4,417,413

624,835

General and administrative expenses

34,687,317

41,288,351

26,120,099

3,694,644

Provision for (net recovery of) doubtful accounts

(841,242)

610,776

2,203,531

311,685

Research and development expenses

3,215,653

3,133,545

7,042,385

996,132

Operating expenses

45,075,081

54,108,938

39,783,428

5,627,296

Loss from operations

(40,924,896)

(24,243,574)

(20,177,032)

(2,854,007)

Other income (expenses)

Subsidy income

371,650

1,149,016

1,210,318

171,197

Interest income

68,028

40,391

54,746

7,744

Interest expense

(897,521)

(1,589,045)

(1,451,890)

(205,367)

Income (loss) from investment in unconsolidated entity

(959,905)

462,879

65,473

Impairment loss of investment in unconsolidated entity

(4,037,736)

Foreign exchange transaction gain (loss)

(4,068)

56,603

(17,720)

(2,506)

Other income

65,539

162,585

78,417

11,092

Other income (expense), net

(4,434,108)

(1,140,355)

336,750

47,633

Loss before income tax

(45,359,004)

(25,383,929)

(19,840,282)

(2,806,374)

Income tax expenses

16,230

398,477

282,322

39,934

Net loss

(45,375,234)

(25,782,406)

(20,122,604)

(2,846,308)

Less: Net loss attributable to non-controlling interests

(1,302,913)

(426,501)

(875,903)

(123,895)

Net loss attributable to Recon Technology, Ltd

¥

(44,072,321)

¥

(25,355,905)

¥

(19,246,701)

$

(2,722,413)

Comprehensive loss

Net loss

(45,375,234)

(25,782,406)

(20,122,604)

(2,846,308)

Foreign currency translation adjustment

1,765,249

1,393,843

(84,205)

(11,911)

Comprehensive loss

(43,609,985)

(24,388,563)

(20,206,809)

(2,858,219)

Less: Comprehensive loss attributable to non-controlling
interests

(1,302,913)

(426,501)

(875,903)

(123,895)

Comprehensive loss attributable to Recon Technology,
Ltd

¥

(42,307,072)

¥

(23,962,062)

¥

(19,330,906)

$

(2,734,324)

Loss per common share – basic and diluted

¥

(19.19)

¥

(6.49)

¥

(4.16)

$

(0.59)

Weighted – average shares -basic and diluted

2,296,693

3,908,833

4,624,615

4,624,615


RECON TECHNOLOGY, LTD

CONSOLIDATED STATEMENTS OF CASH FLOWS    

For the years ended

2018

2019

2020

2020

RMB

RMB

RMB

U.S. Dollars

Cash flows from operating activities:

Net loss

¥

(45,375,234)

¥

(25,782,406)

¥

(20,122,604)

$

(2,846,308)

Adjustments to reconcile net loss to net cash used in
operating activities:

Depreciation and amortization

1,119,049

1,124,011

1,609,700

227,689

Gain from disposal of equipment

(78,285)

(89,156)

(12,611)

Provision for (net recovery of) doubtful accounts

(841,242)

610,776

2,203,531

311,685

Provision for slow moving inventories

65,245

65,380

56,817

8,037

Amortization of right of use assets

1,408,551

199,237

Reversal of interests expense

(81,096)

(11,471)

Restricted shares issued for management and employees

15,462,124

21,288,204

7,944,835

1,123,782

Loss (income) from investment in unconsolidated entity

959,905

(462,879)

(65,473)

Impairment loss of investment in unconsolidated entity

4,037,736

Restricted shares issued for services

3,050,896

845,781

33,927

4,799

Changes in operating assets and liabilities:

Notes receivable

2,116,998

922,282

(1,107,205)

(156,612)

Trade accounts receivable

11,972,175

(40,461,376)

18,428,088

2,606,619

Trade accounts receivable-related party

(3,409,912)

Inventories

(5,012,984)

(1,197,529)

(1,124,935)

(159,120)

Other receivable

(1,717,096)

(928,882)

(206,146)

(29,159)

Purchase advance

(296,903)

5,784,669

1,210,309

171,196

Contract assets

(127,325)

7,554,745

(26,938,013)

(3,810,332)

Prepaid expense

318,759

316,845

(5,457)

(772)

Prepaid expense – related parties

(217,600)

217,600

30,779

Operating lease liabilities

(1,419,402)

(200,772)

Trade accounts payable

(2,706,304)

(400,034)

8,205,660

1,160,675

Other payables

(179,507)

(861,620)

(23,600)

(3,338)

Other payables-related parties

(102,563)

(920,584)

2,207,445

312,239

Deferred revenue

(1,174,585)

Advance from customers

27,756

(37,856)

3,366,033

476,119

Accrued payroll and employees’ welfare

140,828

784,095

533,109

75,407

Accrued expenses

9,425

1,333

Taxes payable

(269,358)

1,748,934

(1,085,213)

(153,501)

Net cash used in operating activities

(19,569,820)

(32,212,172)

(5,230,676)

(739,873)

Cash flows from investing activities:

Investment in unconsolidated entity

(4,037,736)

(4,205,080)

Purchases of property and equipment

(1,503,410)

(1,735,956)

(85,974)

(12,161)

Proceeds from disposal of equipment

32,000

900

127

Payments for land use right

(1,361,969)

Repayments from loans to third parties

435,250

1,000,000

11,239,623

1,589,824

Payments made for loans to third parties

(1,960,000)

(4,000,000)

(9,480,000)

(1,340,928)

Payments and prepayments for construction in progress

(9,157,103)

(4,606,823)

(3,782,912)

(535,086)

Net cash used in investing activities

(17,552,968)

(13,547,859)

(2,108,363)

(298,224)

Cash flows from financing activities:

Proceeds from short-term bank loans

45,000

2,500,000

9,520,000

1,346,586

Repayments of short-term bank loans

(45,000)

(2,500,000)

(353,620)

Proceeds from short-term borrowings

4,600,000

1,081,096

200,000

28,290

Repayments of short-term borrowings

(4,900,000)

(1,000,000)

(141,448)

Proceeds from short-term borrowings-related parties

20,188,318

5,000,000

17,415,000

2,463,319

Repayments of short-term borrowings-related parties

(21,332,036)

(5,000,000)

(16,195,000)

(2,290,753)

Proceeds from long-term borrowings-related party

10,000,000

Repayments of long-term borrowings-related party

(371,975)

(684,191)

(747,630)

(105,751)

Proceeds from sale of common stock, net of issuance costs

65,004,531

26,141,051

3,697,603

Refund of capital contribution by a non-controlling
shareholder

(200,000)

Capital contribution by non-controlling shareholders

3,700,000

850,000

405,000

57,286

Net cash provided by financing activities

76,888,838

3,546,905

33,238,421

4,701,512

Effect of exchange rate fluctuation on cash

1,765,249

1,393,873

(84,203)

(11,906)

Net (decrease) increase in cash

41,531,299

(40,819,253)

25,815,179

3,651,509

Cash at beginning of year

3,809,279

45,340,578

4,521,325

639,533

Cash at end of year

¥

45,340,578

¥

4,521,325

¥

30,336,504

$

4,291,042

Supplemental cash flow information

Cash paid during the year for interest

¥

868,042

¥

1,542,381

¥

1,400,462

$

198,093

Cash paid (received) during the year for taxes

¥

(22,671)

¥

2,002

¥

282,322

$

39,934

Non-cash investing and financing activities

Shares issued to settle salary payable

¥

1,554,908

¥

¥

$

Issuance of common stock in exchange of shares of FGS,
net of issuance costs

¥

¥

21,433,796

¥

$

Investment payable in exchange of interest of FGS

¥

¥

6,400,000

¥

$

Right-of-use assets obtained in exchange for operating
lease obligations

¥

¥

¥

1,228,963

$

173,834

Inventories used for fixed assets

¥

¥

¥

409,735

$

57,956

Payable for construction in progress

¥

3,096,781

¥

5,694,980

¥

732,513

$

103,613

Receivable for disposal of property and equipment

¥

81,900

¥

¥

110,000

$

15,559

Payable for issuance cost of common stock

¥

¥

¥

374,696

$

53,000

The accompanying notes are an integral part of these consolidated financial statements.

* Retrospectively restated for effect of stock split on December 27, 2019.


Related Links :

http://www.recon.cn/

Invitation to Electrolux Q3 presentation

STOCKHOLM, Oct. 9, 2020Electrolux results for the third quarter of 2020 will be published on October 23, 2020, at approximately 08.00 CET.

A telephone conference will be held following the release of the results, starting at 09.00 CET. Jonas Samuelson, President and CEO and Therese Friberg, CFO will comment on the report.

Slides used in the presentation will be available at Electrolux website, www.electroluxgroup.com/ir. The third quarter report will also be available at the same address.

You can listen to the presentation here.

The details for participation by telephone are as follows:

Participants in Sweden should call +46-8-566-426-51

Participants in UK/Europe should call +44-3333-000-804

Participants in US should call +1-631-9131-422

Pin code: 36830556#

For further information, please contact:

Sophie Arnius, Head of Investor Relations, +46-70-590-80-72

Electrolux Press Hotline, +46-8-657-65-07

This information was brought to you by Cision http://news.cision.com

https://news.cision.com/electrolux/r/invitation-to-electrolux-q3-presentation,c3213178

The following files are available for download:


Arctech Solar Unveils New Website to Boost Branding Efforts

SHANGHAI, Oct. 9, 2020 — Arctech Solar, a leading solar tracking, racking and BIPV system provider, is proud to announce the launch of its newly redesigned website, aiming to offer an elevated and user-friendly browsing experience for our trusted and valued customers and business partners.

This is a new milestone in the innovation-driven, customer-centered company’s branding efforts. Arctech Solar’s new website features improved navigation and functionality, it treats orange as the main background color which is simple and graceful. More importantly, Arctech Solar endeavors to provide its current and prospective customers and partners with the most accurate, up-to-date information on the full product portfolio and comprehensive services of smart solar trackers that it can offer. A generous application of videos, photos and graphics, along with sufficiently detailed and engaging content regarding the company’s products, solutions, and cases to guide visitors. Amongst the new features, the site contains integrated social media buttons for LinkedIn, Facebook, Twitter, YouTube and WeChat to foster improved communication with partners and clients.

Arctech Solar is showing strong momentum in growth and innovation this year despite Covid-19 disruption. It successfully went public on Shanghai Sci-tech Innovation Board in August, and has officially unveiled state-of-the-art SkySmart II solution, which is compatible with high-power & large modules, and satisfy the stability and LCOE requirement. The newly-launched website is also a new starting point for the company. Looking forward, Arctech Solar is excited to see opportunity abounding, and will stay committed to serving valued customers and partners with top-quality products and excellent services.

For more information on Arctech Solar and to view the new site, please visit www.arctechsolar.com starting September 2020.

About Arctech Solar

Arctech Solar (SSE-STAR: 688408) is one of the world’s leading manufacturers and solution providers of solar tracking, racking and BIPV systems. In the past decade, Arctech Solar has successfully set up overseas subsidiaries/business service centers in China, Japan, India, U.S., Spain, Australia, UAE, Mexico, Chile, Brazil and Vietnam. As of the end of 2019, the company has cumulatively installed around 24 GW capacity and completed around 900 projects in 24 countries. Today, Arctech Solar is a reliable partner in the global PV tracking, racking and BIPV industry. For more information, please visit www.arctechsolar.com.

Press Contact:
Lisa Zhou
Telephone: +86-18918888669
Email Address: lisa.zhou@arctechsolar.com

Related Links :

http://www.arctechsolar.com

http://www.arctechsolar.cn

Sungrow Bags 800 MWp PV Inverter Solution Contract in Qatar

DOHA, Qatar, Oct. 7, 2020 — Sungrow, the global leading inverter solution supplier for renewables, announced that it will power the 800 MWp Al Kharsaa project in Qatar with featured 1500V string inverter SG250HX. The project is noteworthy as the third-largest solar plant in the world and the first utility-scale solar project in Qatar. It’s planned to be fully operational before the 2022 World Cup, supporting Qatar National Vision 2030 by facilitating local economic decarbonization and sustainable development.

The 800 MW Contract Signing Ceremony

The 800 MWp plant is located 80 km west of Doha, Qatar, covering 1000 hectares in a tropical desert and featuring ample sunlight whereas high temperatures and strong wind. The project was awarded to a consortium of Marubeni and Total as the result of the country’s first solar tender, benefiting from a 25-year power purchase agreement (PPA) to supply electricity to the offtaker Kahramaa. It will represent around 10% of electricity peak demand of the country and reduce the carbon dioxide emissions of Qatar by 26 million tonnes during its lifetime.

Sungrow will supply the world’s most powerful 1500V string inverter SG250HX, which is resilient in harsh conditions given the IP66 and C5 protection capability and smart forced air-cooling technology. Compatible with bifacial modules and tracking systems, the solution allows considerable yields by leveraging the sunlight resources onsite. It enables flexible block design allowing up to 6.75 MW, significantly saving the initial investment and streamlining O&M. As one of the best-selling PV inverter solutions, SG250HX is expected to be deployed over 3 GW by the end of 2020.

As the independent power producers (IPP) of the landmark project, Marubeni from Japan and Total from France show great confidence towards the rosy prospect of the project due to prominent product solutions and 100% bankability of Sungrow.

"The Al Kharsaa project is a breakthrough in our track record and will lay the solid foundation for our robust partnership with Sungrow. High-performing products, reliable service, timely deliveries and speed of commissioning have made them a preferred partner for our growing list of assets," commented Mr. Yu Hao, Vice General Manager from Power China, the EPC of the project.

"We are proud to pioneer the first utility-scale solar project in Qatar with the best of our expertise and prop up the national commitment towards a more sustainable society. We’d like to explore more competitive projects to unlock values for stakeholders in the Middle East," said James Wu, Vice President of Sungrow. Wu also mentioned that the Company supplied a 500 MW project in Oman and a 900 MW project in Dubai.

About Sungrow

Sungrow Power Supply Co., Ltd ("Sungrow") is the world’s most bankable inverter brand with over 120 GW installed worldwide as of June 2020. Founded in 1997 by University Professor Cao Renxian, Sungrow is a leader in the research and development of solar inverters, with the largest dedicated R&D team in the industry and a broad product portfolio offering PV inverter solutions and energy storage systems for utility-scale, commercial, and residential applications, as well as internationally recognized floating PV plant solutions. With a strong 23-year track record in the PV space, Sungrow products power installations in over 120 countries, maintaining a worldwide market share of over 15%. Learn more about Sungrow by visiting www.sungrowpower.com.

Photo – https://photos.prnasia.com/prnh/20201007/2942872-1?lang=0

Related Links :

http://www.sungrowpower.com

Monolithic Power Systems Files Patent Infringement and Trade Secret Theft Lawsuits Against Meraki Integrated and Against its Founders Wei Dong and Lin Sheng for Breach of Contract and Fraud

KIRKLAND, Washington, Sept. 30, 2020 — Monolithic Power Systems, Inc. (MPS) (Nasdaq: MPWR), a leading company in high performance analog solutions, announced today that it has filed lawsuits in the U.S. District Courts for the Western District of Texas and Northern District of California against Meraki Integrated Circuit (Shenzhen) Technology, Ltd. (Meraki); Meraki’s customer, Promate Electronic Co., Ltd.; and Meraki’s founders, Wei Dong and Lin Sheng.  The lawsuits assert claims of breach of contract, fraud, trade secret theft, and that Meraki’s synchronous rectifier products, including MK1808, MK91808, MK1718, MK91718, MK1708, MK1807, MK91807, MK1715, MK1716, MK17350, MK17360, MK91735, MK91736, MK91738, MK1705A, MK1706, MK1709, and MK1719 are knock offs of MPS proprietary products and have infringed at least five of MPS Chinese patents and U.S. Patent Nos. 8,067,973, 8,400,790, and 10,432,104.  The lawsuits also assert that Meraki has induced its customers to offer for sale and import Meraki’s infringing products into the U.S.

MPS alleges that Wei Dong, with aliases of Wayne and Wesley, and Lin Sheng, with alias of Elaine, were former U.S. engineers of MPS immediately prior to relocating to China with stolen MPS trade secrets.  MPS further alleges that in order to conceal their unlawful activities, Dong and Sheng used their mothers’ identities instead of their own to incorporate Meraki and to hold titles.

In the complaints, MPS seeks unspecified damages and court-ordered injunctions against future infringement and unlawful conduct by these companies, Dong, and Sheng, as well as the return to MPS of intellectual property including patent applications that were improperly assigned to Meraki.  MPS intends to vigorously protect and enforce its intellectual property.

About Monolithic Power Systems, Inc.

Monolithic Power Systems, Inc. (MPS) provides small, highly energy efficient, easy-to-use power solutions for systems found in industrial applications, telecom infrastructures, cloud computing, automotive, and consumer applications. MPS’ mission is to reduce total energy consumption in its customers’ systems with green, practical, compact solutions. The company was founded by Michael Hsing in 1997 and is based in the United States. MPS can be contacted through its website at www.monolithicpower.com or its support offices around the world.

Monolithic Power Systems, MPS, and the MPS logo are registered trademarks of Monolithic Power Systems, Inc. in the U.S. and trademarked in certain other countries.

Related Links :

http://www.monolithicpower.com

Maxeon Solar Technologies Files Patent Action Against Canadian Solar in Japan


SINGAPORE, Sept. 29, 2020 — Maxeon Solar Technologies, Ltd. (NASDAQ:MAXN), a global leader in solar innovation, today announced that it filed a patent infringement lawsuit against Canadian Solar Japan K.K., in Tokyo District Court, Japan.

The lawsuit filing alleges Canadian Solar Japan infringes Maxeon’s Japan Patent No. JP6642841B2 ("Shingled Solar Cell Module") for the proprietary and fundamental shingled solar cell panel technology used to deploy solar panels that Maxeon designs, manufactures and sells under the ‘SunPower Performance’ brand name. Canadian Solar Japan is a wholly owned subsidiary of Canadian Solar Inc., which is headquartered in Canada with operations and production facilities in China and in South-East Asia.

Shingled solar cell panels are typically made from separating solar cells into smaller solar cell strips and then connecting the resulting solar cell strips in an over-lapping layout. The result is a higher power, higher efficiency panel, with enhanced reliability and improved durability compared to conventional panels.

The Performance panel architecture and manufacturing processes were pioneered by Silicon Valley-based start-up company Cogenra Solar which was acquired by SunPower Corporation in 2015. In the subsequent spinoff of Maxeon Solar Technologies, Maxeon retained the use of the SunPower brand in the more than 100 markets it serves. Maxeon produces its SunPower Performance solar panels in China at Huansheng Photovoltaic (Jiangsu) Co., Ltd., its joint venture with Tianjin Zhonghuan Semiconductor Co., Ltd. With more than 3 gigawatts deployed across over 60 countries to date, Performance panels are the industry’s most deployed shingled solar cell panel technology.

"We’ve built our business on a 35-year foundation of pioneering solar innovation. The intellectual property behind our shingled solar cell technology was developed by our talented design and engineering teams and is the result of substantial investment," said Jeff Waters, CEO of Maxeon Solar Technologies. "The resultant Performance technology outperforms conventional panels in efficiency, power, reliability and aesthetics."

The innovation behind Performance panels is protected by an international portfolio of more than 150 patents and patent applications covering shingled solar cell and panel design, as well as key manufacturing tools and processes.

"We feel very strongly about the importance of upholding our intellectual property rights, and view our intellectual property as a key business asset," added Lindsey Wiedmann, Maxeon’s Chief Legal Officer. "Maxeon’s patent portfolio, which now includes more than 900 patents, helps protect the many technical advancements we’ve made through the years that have led us to a prominent position in the solar industry," continued Wiedmann. "We must vigorously safeguard these valuable assets, and this action against Canadian Solar is a necessary step to prevent unauthorized use of our intellectual property.  Respect of intellectual property rights is critical to incentivize innovation and for the orderly ongoing development of the solar industry."

About Maxeon Solar Technologies
Maxeon Solar Technologies (NASDAQ: MAXN) is Powering Positive Change™. Headquartered in Singapore, Maxeon designs and sells SunPower® brand solar panels across more than 100 countries and is the leader in solar innovation with access to over 900 patents and two best-in-class solar panel product lines. With operations in Africa, Asia, Oceania, Europe and Mexico, Maxeon products span the global rooftop and solar power plant markets through a network of more than 1,100 trusted partners and distributors. A pioneer in sustainable solar manufacturing, Maxeon leverages a 35-year history in the solar industry and numerous awards for its technology.

Forward-Looking Statements
This press release contains forward-looking statements within the meaning of the Private Securities Litigation Reform Act of 1995, including, but not limited to, statements regarding our future plans and areas of focus, our positioning and business plans for future success, and our positioning to enforce patent rights. These forward-looking statements are based on our current assumptions, expectations and beliefs and involve substantial risks and uncertainties that may cause results, performance or achievement to materially differ from those expressed or implied by these forward-looking statements. A detailed discussion of these factors and other risks that affect our business is included in filings we make with the Securities and Exchange Commission (SEC) from time to time, including our most recent report on Form 20-F, as amended, particularly under the heading "Risk Factors." Copies of these filings are available online from the SEC or on the SEC Filings section of our Investor Relations website at www.maxeon.com/investor-relations. All forward-looking statements in this press release are based on information currently available to us, and we assume no obligation to update these forward-looking statements in light of new information or future events.

© 2020 Maxeon Solar Technologies, Ltd. All Rights Reserved. MAXEON is a registered trademark of Maxeon Solar Technologies, Ltd. View maxeon.com/trademarks for more information.

Logo – https://techent.tv/wp-content/uploads/2020/09/maxeon-solar-technologies-files-patent-action-against-canadian-solar-in-japan.jpg

Related Links :

http://www.maxeon.com

ReneSola Power and Vodasun to Form Joint Venture to Develop Solar Projects in Germany


STAMFORD, Conn., Sept. 28, 2020 — ReneSola Ltd ("ReneSola Power" or the "Company") (www.renesolapower.com) (NYSE: SOL), a leading fully integrated solar project developer, and Vodasun, a Munich, Germany-based project developer specialized in the development and construction of solar parks, today announced that they entered into a strategic partnership agreement to co-develop and market ready-to-build (RTB) ground-mounted solar projects in Germany. 

As part of the agreement, ReneSola Power and Vodasun will create a 50/50 joint venture company with a starting project portfolio of 50 to 100 MW. The JV intends to develop these projects, as well as develop an additional 50 to 100 MW of new projects per year.

Mr. Josef Kastner, CEO of ReneSola European Region, commented, "From a strategic perspective, the combined strengths and reputations of both companies will provide new opportunities to enable further expansion into Germany. The JV will benefit both companies by building a more robust project portfolio while leveraging our know-how and experience in project development. Additionally, we believe the JV will produce cost synergies to enhance profitability as we navigate the challenging macro environment."

Mr. Yumin Liu, Chief Executive Officer of ReneSola Power, added, "We are excited about this strategic partnership with Vodasun, and look forward to working with their team to expand our reach into Germany. We believe this is a meaningful step for us to achieve our global pipeline growth target in the next several quarters and beyond."

About ReneSola Power

ReneSola Power (NYSE: SOL) is a leading global solar project developer and operator. The Company focuses on solar power project development, construction management and project financing services. With local professional teams in more than 10 countries around the world, the business is spread across a number of regions where the solar power project markets are growing rapidly, and can sustain that growth due to improved clarity around government policies. The Company’s strategy is to pursue high-margin project development opportunities in these profitable and growing markets; specifically, in the U.S. and Europe, where the Company has a market-leading position in several geographies, including Poland, Hungary, Minnesota and New York.

About Vodasun

Since 2009, Vodasun plans, builds and operates turnkey photovoltaic systems throughout Germany. The range of services extends from single-family homes to complex large-scale projects with installed capacities in the megawatt range. The Vodasun Group is divided into three companies: Vodasun Akquise und Vertriebs GmbH develops and sells PV projects to private and institutional investors, Vodasun Construction is as EPC company responsible for the turnkey construction and Vodastrom subsequently takes over the commercial and technical management of the plants. The best engineering and the use of high quality components ensure the yield and longevity of the projects.

Related Links :

http://www.renesolapower.com

Canadian Solar Comments on ITC Complaint Filed by Solaria Corporation

GUELPH, ON, Sept. 25, 2020Canadian Solar Inc. (the "Company", or "Canadian Solar") (NASDAQ: CSIQ), today issued the following comment:

Over the past five months, Canadian Solar has been vigorously litigating a patent lawsuit filed by Solaria in April 2020 in the U.S. District Court in Oakland, California, entitled The Solaria Corporation v. Canadian Solar Inc., Case No. 4:20-cv-02169-JST (N.D. Cal.). Canadian Solar countersued with claims requesting that the Court declare, as Canadian Solar believes, that:

(1) none of the products at issue in the case infringe the Solaria patents;

(2) Solaria withheld key evidence from the U.S. Patent Office when seeking its patents; and

(3) this, among other reasons, renders the asserted claims both invalid and unenforceable. 

In the face of Canadian Solar’s countersuit, Solaria opted to file a new lawsuit with the U.S. International Trade Commission (ITC), entitled Certain Shingled Solar Modules, Components Thereof, and Methods for Manufacturing the Same, Section 337 Investigation Docket No. 3491. The ITC investigation is expected to be instituted next month. 

Asserting the same family of patents against the same limited number of products (HiDM and HiDM5) in a different forum does not make Solaria’s claims any less flawed. Canadian Solar will continue to vigorously defend these lawsuits, while the Company continues to focus its energy on developing superior product and bringing innovation to the market.

About Canadian Solar Inc.

Canadian Solar was founded in 2001 in Canada and is one of the world’s largest solar power companies. It is a leading manufacturer of solar photovoltaic modules and provider of solar energy solutions and has a geographically diversified pipeline of utility-scale solar power projects in various stages of development. Over the past 19 years, Canadian Solar has successfully delivered over 46 GW of premium-quality, solar photovoltaic modules to customers in over 150 countries. Canadian Solar is one of the most bankable companies in the solar industry, having been publicly listed on NASDAQ since 2006. For additional information about the Company, follow Canadian Solar on LinkedIn or visit www.canadiansolar.com.

Safe Harbor/Forward-Looking Statements

Certain statements in this press release are forward-looking statements that involve a number of risks and uncertainties that could cause actual results to differ materially. These statements are made under the "Safe Harbor" provisions of the U.S. Private Securities Litigation Reform Act of 1995. In some cases, you can identify forward-looking statements by such terms as "believes," "expects," "anticipates," "intends," "estimates," the negative of these terms, or other comparable terminology. Factors that could cause actual results to differ include general business and economic conditions and the state of the solar industry; governmental support for the deployment of solar power; future available supplies of high-purity silicon; demand for end-use products by consumers and inventory levels of such products in the supply chain; changes in demand from significant customers; changes in demand from major markets such as Japan, the U.S., India and China; changes in customer order patterns; changes in product mix; capacity utilization; level of competition; pricing pressure and declines in average selling prices; delays in new product introduction; delays in utility-scale project approval process; delays in utility-scale project construction; delays in the completion of project sales; delays in the process of qualifying to list the MSS subsidiary in the PRC; continued success in technological innovations and delivery of products with the features customers demand; shortage in supply of materials or capacity requirements; availability of financing; exchange rate fluctuations; litigation and other risks as described in the Company’s SEC filings, including its annual report on Form 20-F filed on April 28, 2020. Although the Company believes that the expectations reflected in the forward-looking statements are reasonable, it cannot guarantee future results, level of activity, performance, or achievements. Investors should not place undue reliance on these forward-looking statements. All information provided in this press release is as of today’s date, unless otherwise stated, and Canadian Solar undertakes no duty to update such information, except as required under applicable law.

Related Links :

http://www.canadiansolar.com

JinkoSolar Announces Second Quarter 2020 Financial Results

SHANGRAO, China, Sept. 23, 2020 — JinkoSolar Holding Co., Ltd. ("JinkoSolar" or the "Company") (NYSE: JKS), one of the largest and most innovative solar module manufacturers in the world, today announced its unaudited financial results for the second quarter ended June 30, 2020.

Strategic Business Updates

  • Module shipments in the second quarter increased significantly compared with the first quarter, despite the negative impact caused by the global pandemic.
  • Large-area N-Type monocrystalline silicon solar cell reached a record high efficiency of 24.79%.
  • Demand and deployment of large-size modules exceeded expectations. The company recently launched its Tiger Pro N-type large-size module products with maximum power output of up to 610 W.
  • Industry consolidation is accelerating due to increased competition in a challenging economic environment. Module shipments of the top five module manufacturers are expected to account for 65% to 70% of the total shipments in the industry this year.
  • Announced the plan to list the Company’s principal operating subsidiary Jiangxi Jinko on the Shanghai Stock Exchange’s Sci-Tech innovation board, or the STAR Market.

Second Quarter 2020 Operational and Financial Highlights

  • Total solar module shipments were 4,469 megawatts ("MW"), within JinkoSolar’s guidance range of 4.2 GW to 4.5 GW, an increase of 31.0% from 3,411 MW in the first quarter of 2020 and an increase of 32.0% from 3,386 MW in the second quarter of 2019.
  • Total revenues were RMB8.45 billion (US$1.20 billion), exceeding JinkoSolar’s guidance range of US$1.10 billion to US$1.18 billion; a decrease of 0.4% from the first quarter of 2020 and an increase of 22.2% from the second quarter of 2019.
  • Gross margin was 17.9%, within JinkoSolar’s guidance range of 16.0% to 18.0%, compared with 19.5% in the first quarter of 2020 and 16.5% in the second quarter of 2019.
  • Income from operations was RMB434.7 million (US$61.5 million), compared with RMB732.7 million in the first quarter of 2020 and RMB260.3 million in the second quarter of 2019.
  • Net income attributable to the Company’s ordinary shareholders was RMB318.0 million (US$45.0 million) in the second quarter of 2020, compared with RMB282.4 million in the first quarter of 2020 and RMB125.4 million in the second quarter of 2019.
  • Diluted earnings per American depositary share ("ADS") were RMB6.55 (US$0.93) in the second quarter of 2020.
  • Non-GAAP net income attributable to the Company’s ordinary shareholders in the second quarter of 2020 was RMB376.1 million (US$53.2 million), compared with RMB227.5 million in the first quarter of 2020 and RMB202.9 million in the second quarter of 2019.
  • Non-GAAP basic and diluted earnings per ADS were RMB8.46 (US$1.20) in the second quarter of 2020, compared with RMB5.09 and RMB4.59, respectively, in the first quarter of 2020 and RMB4.87 for both in the second quarter of 2019.

Mr. Kangping Chen, JinkoSolar’s Chief Executive Officer commented, "JinkoSolar delivered a strong quarter with total revenue exceeding guidance. Despite the tough economic environment around the world, total solar module shipments and gross margin for the quarter were all within our guidance range. Module shipments hit a new high of 4,469 MW, an increase of 31.0% sequentially and 32.0% year-over-year. Total revenues during the quarter were US$1.20 billion, an increase of 16.0% (excluding the impact from disposal of the solar power plants in the first quarter of 2020) sequentially and 22.2% year-over-year, while gross profit was US$214.1 million. We expect orders for the third and fourth quarters to increase, with total solar module shipments expected to be in the range between 5 GW to 5.3 GW for the third quarter, and our guidance for total shipments for the full year 2020 remains unchanged at 18GW to 20 GW."

"Solar demand decreased during the quarter due to the economic slowdown, triggering a drop in module prices. Many upstream manufacturing companies were forced to reduce inventory and companies lacking product differentiation and cost flexibility struggled to remain competitive. The market continues to consolidate due to the challenging economic environment and strong competition within the industry, while the production capacity and infrastructure of integrated manufacturers remain resilient to risks and price fluctuations. All of the above has enabled a few key players, including JinkoSolar, to increase global market share. Overall, the combined shipment volumes of the top five solar module manufacturers are expected to account for 65% to 70% of the industry for the year."

"More than ever, technology is the major differentiating factor giving companies with integrated applications a clear advantage. Recently, our large-area N-type monocrystalline silicon solar cells reached a conversion efficiency of 24.79%, setting a new world record. This year, the popularity of large-sized bifacial modules exceeded our expectations and demonstrated that further reductions in the levelized cost of energy for solar remains the core distinction among clean energies. Additionally, we expect new technologies in energy storage to prompt the sector into a new era of rapid development."

"As economies have started to rebound in many markets, we believe global demand will eventually accelerate and we are well positioned to benefit from the momentum. Earlier this year, the shortage of supply in the Chinese market drove up prices along the supply chain, but prices have stabilized since then and we expect strong market demand to continue until the end of the year. With our strong R&D platform, expanding capacity and cost leadership, we believe we are well positioned to capitalize on the strong potential of solar energy as governments increasingly focus on clean energy in the wake of the pandemic and growing climate change challenges."

"This week, we announced our plan to list our principal operating subsidiary Jiangxi Jinko on the Shanghai Stock Exchange’s Sci-Tech innovation board, or the STAR Market. We are committed to maintaining the New York Stock Exchange listing for JinkoSolar. We believe the additional listing of Jiangxi Jinko on the STAR Market will raise our profile with investors both in China and globally and provide us with additional growth opportunities in the future."

Second Quarter 2020 Financial Results

Total Revenues

Total revenues in the second quarter of 2020 were RMB8.45 billion (US$1.20 billion), a decrease of 0.4% from RMB8.48 billion in the first quarter of 2020 and an increase of 22.2% from RMB6.91 billion in the second quarter of 2019. Excluding the impact from the disposal of two solar power plants in Mexico in the first quarter of 2020, revenue increased by 16.0% from RMB7.29 billion in the first quarter of 2020. The sequential increase (excluding the impact from disposal of the solar power plants in the first quarter of 2020) was mainly attributable to an increase in the shipment of solar modules partially offset by a decline in the average selling price of solar modules.  The year-over-year increase was mainly attributable to the increase in shipment of solar modules.

Gross Profit and Gross Margin

Gross profit in the second quarter of 2020 was RMB1.51 billion (US$214.1 million), compared with RMB1.66 billion in the first quarter of 2020 (or RMB1.44 billion if excluding the impact from the disposal of two solar power plants in Mexico) and RMB1.14 billion in the second quarter of 2019. The sequential increase was mainly attributable to an increase in the shipment of solar modules partially offset by a decline in the average selling price of solar modules.  The year-over-year increase was mainly attributable to (i) an increase in the shipment of solar modules, (ii) an increase in self-produced production volume that is increasingly shifting toward integrated mono-based high-efficiency products capacity, and (iii) the continued reduction of integrated production costs resulting from the Company’s industry-leading integrated cost structure.

Gross margin was 17.9% in the second quarter of 2020, compared with 19.5% in the first quarter of 2020 (or 19.7% if excluding the impact from the disposal of two solar power plants in Mexico) and 16.5% in the second quarter of 2019.The sequential decrease was mainly attributable to a decline in the average selling price of solar modules due to the decrease of global demand of solar modules. The year-over-year increase was mainly attributable to (i) an increase in self-produced production volume by increasing shift toward integrated mono-based high-efficiency products capacity, and (ii) the continued reduction of integrated production costs resulting from the Company’s industry-leading integrated cost structure.

Income from Operations and Operating Margin

Income from operations in the second quarter of 2020 was RMB434.7 million (US$61.5 million), compared with RMB732.7 million in the first quarter of 2020 (including RMB213.2 million from the disposal of two solar power plants in Mexico) and RMB260.3 million in the second quarter of 2019.

Operating margin was 5.1% in the second quarter of 2020, compared with 8.6% in the first quarter of 2020 (or 7.1% if excluding the impact from the disposal of two solar power plants in Mexico) and 3.8% in the second quarter of 2019.

Total operating expenses in the second quarter of 2020 were RMB1.08 billion (US$152.6 million), an increase of 16.7% from RMB924.2 million in the first quarter of 2020 and an increase of 22.0% from RMB883.6 million in the second quarter of 2019. The sequential increase was mainly due to (i) an increase in warranty cost in relation to the increase in the shipment of solar modules. and (ii) an increase in disposal loss on property, plant and equipment due to the automation upgrade of the Company. The year-over-year increase was mainly due to (i) an increase in shipping costs and warranty cost in relation to the increase in the shipment of solar modules and (ii) an increase in disposal loss on property, plant and equipment.

Total operating expenses accounted for 12.8% of total revenues in the second quarter of 2020, compared to 10.9% in the first quarter of 2020 (or 12.6% if excluding the impact from the disposal of two solar power plants in Mexico) and 12.8% in the second quarter of 2019.

Interest Expense, Net

Net interest expense in the second quarter of 2020 was RMB106.2 million (US$15.0 million), a decrease of 2.2% from RMB108.6 million in the first quarter of 2020 and a decrease of 9.0% from RMB116.8 million in the second quarter of 2019. The sequential and year-over-year decreases were mainly due to an increase in interest income partially offset by an increase in interest expense with the increase of interest-bearing debts.

Exchange Gain and Change in Fair Value of Foreign Exchange Derivatives

The Company recorded a net exchange gain (including change in fair value of foreign exchange derivatives) of RMB69.7 million (US$9.9 million) in the second quarter of 2020, compared to a net exchange loss of RMB106.8 million in the first quarter of 2020 and a net exchange gain of RMB45.9 million in the second quarter of 2019.

Change in Fair Value of Interest Rate Swap

The Company entered into Interest Rate Swap agreements with several banks for the purpose of reducing interest rate risk exposure associated with the Company’s overseas solar power projects. After the disposal of two solar power projects in Mexico in the first quarter of 2020, there was no change in fair value of interest rate swap recognized in the second quarter of 2020.

Change in Fair Value of Convertible Senior Notes and Call Option

The Company issued US$85.0 million of 4.5% convertible senior notes due 2024 (the "Notes") in May 2019 and has elected to measure the Notes at fair value. The Company recognized a loss from a change in fair value of the Notes of RMB89.2 million (US$12.6 million) in the second quarter of 2020, compared to a gain of RMB166.2 million in the first quarter of 2020.  The change was primarily due to an increase in the Company’s stock price in the second quarter of 2020.

Concurrent with the issuance of the Notes in May 2019, the Company entered into a call option transaction with an affiliate of Credit Suisse Securities (USA) LLC. The Company accounted for the call option transaction as freestanding derivative assets in its consolidated balance sheets, which is marked to market during each reporting period. The Company recorded a gain from a change in fair value of the call option of RMB38.0 million (US$5.4 million) in the second quarter of 2020, compared to a loss of RMB100.2 million in the first quarter of 2020. The change was primarily due to an increase in the Company’s stock price in the second quarter of 2020.

Equity in (Loss)/Gain of Affiliated Companies

The Company indirectly holds a 20% equity interest in Sweihan PV Power Company P.J.S.C, a developer and operator of solar power projects in Dubai, and accounts for its investment using the equity method. The Company also holds a 30% equity interest in Jiangsu Jinko-Tiansheng Co., Ltd, which processes and assembles PV modules as an OEM manufacturer, and accounts for its investments using the equity method. The Company recorded equity in gain of affiliated companies of RMB4.2 million (US$0.6 million) in the second quarter of 2020, compared with a loss of RMB101.5 million in the first quarter of 2020 and a loss of RMB28.6 million in the second quarter of 2019. The gain primarily arose from revenue generated from operations in the second quarter of 2020. The sequential change was mainly due to the decreased losses arose from change in fair value of interest rate swap agreements purchased by Sweihan PV Power Company P.J.S.C. as the long-term interest rates remains stable in the second quarter of 2020. Hedge accounting was not applied for the derivative.

Income Tax (Expenses)/Benefit

The Company recorded an income tax expense of RMB22.8 million (US$3.2 million) in the second quarter of 2020, compared with an income tax expense of RMB109.5 million in the first quarter of 2020 and an income tax benefit of RMB55.9 million in the second quarter of 2019. The sequential decrease was mainly due to additional 2019 income tax deduction for R&D costs approved by the local tax bureau in the second quarter of 2020. The year-over-year change was mainly due to higher profit generated compared to the second quarter of 2019.

Net Income and Earnings per Share

Net income attributable to the Company’s ordinary shareholders was RMB318.0 million (US$45.0 million) in the second quarter of 2020, compared with RMB282.4 million in the first quarter of 2020 and RMB125.4 million in the second quarter of 2019.

Basic and diluted earnings per ordinary share were RMB1.79 (US$0.25) and RMB1.64 (US$0.23), respectively, during the second quarter of 2020. This translates into basic and diluted earnings per ADS of RMB7.16 (US$1.01) and RMB6.55 (US$0.93), respectively.

Non-GAAP net income attributable to the Company’s ordinary shareholders in the second quarter of 2020 was RMB376.1 million (US$53.2 million), compared with RMB227.5 million in the first quarter of 2020 and RMB202.9 million in the second quarter of 2019.

Non-GAAP basic and diluted earnings per ordinary share were RMB2.12 (US$0.30), during the second quarter of 2020. This translates into non-GAAP basic and diluted earnings per ADS of RMB8.46 (US$1.20).

Financial Position

As of June 30, 2020, the Company had RMB6.85 billion (US$969.6 million) in cash and cash equivalents and restricted cash, compared with RMB4.74 billion as of March 31, 2020.

As of June 30, 2020, the Company’s accounts receivables due from third parties were RMB5.90 billion (US$834.6 million), compared with RMB5.31 billion as of March 31, 2020.

As of June 30, 2020, the Company’s inventories were RMB6.89 billion (US$975.1 million), compared with RMB7.15 billion as of March 31, 2020.

As of June 30, 2020, the Company’s total interest-bearing debts were RMB16.5 billion (US$2.34 billion), of which RMB908.6 million (US$128.6 million) was related to the Company’s overseas downstream solar projects, compared with RMB12.79 billion, of which RMB1.15 billion was related to the Company’s overseas downstream solar projects as of March 31, 2020.

Second Quarter 2020 Operational Highlights

Solar Module Shipments

Total solar module shipments in the second quarter of 2020 were 4,469 MW.

Solar Products Production Capacity

As of June 30, 2020, the Company’s in-house annual mono wafer, solar cell and solar module production capacity was 20 GW, [1] 11GW (10.2 GW for PERC cells and 800 MW for N type cells) and 25 GW, respectively.

Note 1:

In addition to the mono wafer, our multi wafer production capacity was 3.5 GW as of June 30, 2020[1]

Operations and Business Outlook

Strong market demand is expected to continue until the end of the year. COVID-19 has negatively impacted demand and caused substantial challenges across the supply chain, which is expected to further accelerate market consolidation within the industry. The penetration of large-size modules exceed expectations.

Third Quarter and Full Year 2020 Guidance

The Company’s business outlook is based on management’s current views and estimates with respect to market conditions, production capacity, the Company’s order book and the global economic environment. This outlook is subject to uncertainty on final customer demand and sale schedules. Management’s views and estimates are subject to change without notice.

For the third quarter of 2020, the Company expects total solar module shipments to be in the range of 5.0 GW to 5.3 GW. Total revenue for the third quarter is expected to be in the range of US$1.22 billion to US$1.30 billion. Gross margin for the third quarter is expected to be between 17% and 19%.

For full year 2020, the Company estimates total solar module shipments to be in the range of 18 GW to 20 GW.

Solar Products Production Capacity

JinkoSolar expects its annual mono wafer, solar cell and solar module production capacity to reach 20 GW, 11 GW (including 800 MW N-type cells) and 30 GW, respectively, by the end of 2020.

Recent Business Developments

  • In June 2020, JinkoSolar’s innovative Tiger Pro Series of high-efficiency modules received the world’s first IEC 61701 Ed. 3 (FDIS) certification for salt mist corrosion test issued by TÜV Nord AG, an independent provider of technical services for testing, inspection, certification, consultation and training.
  • In June 2020, United States International Trade Commission ("ITC") issued a favorable final determination concluding that JinkoSolar’s products do not infringe a patent asserted by Hanwha Q CELLS.
  • In June 2020, JinkoSolar appointed Mr. Ji Shao Guo as Chief Human Resources Officer.
  • In June 2020, JinkoSolar responded to the Regional Court of Düsseldorf’s recent determination concluding that third-party cell technology contained in certain JinkoSolar modules, no longer in production, infringes a patent held by Hanwha Q CELLS.
  • In June 2020, JinkoSolar announced that it will supply 60.9 MW of bifacial modules for the first industrial hybrid plant in Chile.
  • In July 2020, JinkoSolar won the 6th All Quality Matters Award for PV Module Energy Yield Simulation (Mono Group) at the Solar Congress 2020 organized by TÜV Rheinland.
  • In July 2020, JinkoSolar announced supply of 126 MW of solar modules for the expansion of an existing 160 MW solar PV park in Chile.
  • In July 2020, the maximum solar conversion efficiency of JinkoSolar’s large-area N-type monocrystalline silicon solar cells reached 24.79%, and have set a world record for large-size contact-passivated solar cells.
  • In August 2020, JinkoSolar unveiled its RE100 roadmap by providing details on its approach to achieve 100% capacity powered by renewables by 2025.
  • In August 2020, JinkoSolar launched its new generation of 610W Tiger Pro high-efficiency monocrystalline TR solar module and its BIPV solutions, Building Integrated Photovoltaics product series, which will be unveiled at SNEC 2020 in Shanghai.

Conference Call Information

JinkoSolar’s management will host an earnings conference call on Wednesday, September 23, 2020 at 8:00 a.m. U.S. Eastern Time (8:00 p.m. Beijing / Hong Kong the same day).

Dial-in details for the earnings conference call are as follows:

Hong Kong / International:

+852 3027 6500

U.S. Toll Free:

+1 855-824-5644

Passcode:

55345060

Please dial in 10 minutes before the call is scheduled to begin and provide the passcode to join the call.

A telephone replay of the call will be available 2 hours after the conclusion of the conference call through 23:59 U.S. Eastern Time, September 30, 2020. The dial-in details for the replay are as follows:

International:

+61 2 8325 2405

U.S.:

+1 646 982 0473

Passcode:

319337163#

Additionally, a live and archived webcast of the conference call will be available on the Investor Relations section of JinkoSolar’s website at www.jinkosolar.com.

About JinkoSolar Holding Co., Ltd.

JinkoSolar (NYSE: JKS) is one of the largest and most innovative solar module manufacturers in the world. JinkoSolar distributes its solar products and sells its solutions and services to a diversified international utility, commercial and residential customer base in China, the United States, Japan, Germany, the United Kingdom, Chile, South Africa, India, Mexico, Brazil, the United Arab Emirates, Italy, Spain, France, Belgium, and other countries and regions. JinkoSolar has built a vertically integrated solar product value chain, with an integrated annual capacity of 20 GW for mono wafers, 11 GW for solar cells, and 25 GW for solar modules, as of June 30, 2020.

JinkoSolar has 7 productions facilities globally, 14 overseas subsidiaries in Japan, South Korea, Vietnam, India, Turkey, Germany, Italy, Switzerland, United States,  Mexico, Brazil, Chile and Australia, and global sales teams in China, United Kingdom, France,  Spain, Bulgaria, Greece, Ukraine, Jordan, Saudi Arabia, Tunisia,  Morocco, Kenya, South Africa, Costa Rica, Colombia, Panama, Kazakhstan, Malaysia, Myanmar, Sri Lanka, Thailand, Vietnam, Poland and Argentina.

To find out more, please see: www.jinkosolar.com

Use of Non-GAAP Financial Measures

To supplement its consolidated financial results presented in accordance with United States Generally Accepted Accounting Principles ("GAAP"), JinkoSolar uses certain non-GAAP financial measures including, non-GAAP net income, non-GAAP earnings per Share, and non-GAAP earnings per ADS, which are adjusted from the comparable GAAP results to exclude certain expenses or incremental ordinary shares relating to share-based compensation convertible senior notes and call option:

  • Non-GAAP net income is adjusted to exclude the expenses relating to issuance cost of convertible senior notes, change in fair value of convertible senior notes and call option, interest expenses of convertible senior notes and call option, exchange (gain)/loss on the convertible senior notes and call option, and stock-based compensation (benefit)/expense; given these Non-GAAP net income adjustments above are either related to the Company or its subsidiaries incorporated in Cayman Islands, which are not subject to tax exposures, or related to those subsidiaries with tax loss positions which result in no tax impacts, therefore no tax adjustment is needed in conjunction with these Non-GAAP net income adjustments; and
  • Non-GAAP earnings per share and non-GAAP earnings per ADS are adjusted to exclude the expenses relating to issuance cost of convertible senior notes, change in fair value of convertible senior notes and call option, interest expenses of convertible senior notes and call option, exchange gain on the convertible senior notes and call option, and stock-based compensation. As the Non-GAAP net income is adjusted to exclude the change in fair value of call option, the dilutive impact of call option, if any, is also excluded from the denominator for the calculation of Non-GAAP earnings per share and non-GAAP earnings per ADS.

The Company believes that the use of non-GAAP information is useful for analysts and investors to evaluate JinkoSolar’s current and future performances based on a more meaningful comparison of net income and diluted net income per ADS when compared with its peers and historical results from prior periods. These measures are not intended to represent or substitute numbers as measured under GAAP. The submission of non-GAAP numbers is voluntary and should be reviewed together with GAAP results.

Impact of the Recently Adopted Major Accounting Pronouncement

The Company adopted the update of ASU No. 2016-13, Financial Instruments – Credit Losses (Topic 326): "Measurement of Credit Losses on Financial Instruments" on January 1, 2020.

Upon adoption of ASC 326 on January 1, 2020, the Company used the modified retrospective transition method through a RMB6.6 million cumulative-effect increase to retained earnings, among which RMB30.9 million was related to the decrease of allowance for accounts receivables-third parties, RMB15.0 million was related to the increase of allowance for accounts receivables- related parties and RMB9.3 million was related to the increase of allowance for other receivables and other current/non-current assets. The adoption of the new guidance did not have a material impact to the Company’s consolidated financial statements.

Currency Convenience Translation

The conversion of Renminbi into U.S. dollars in this release, made solely for the convenience of the readers, is based on the noon buying rate in the city of New York for cable transfers of Renminbi as certified for customs purposes by the Federal Reserve Bank of New York as of June 30, 2020, which was RMB7.0651 to US$1.00. No representation is intended to imply that the Renminbi amounts could have been, or could be, converted, realized, or settled into U.S. dollars at that rate or any other rate. The percentages stated in this press release are calculated based on Renminbi.

Safe-Harbor Statement

This press release contains forward-looking statements. These statements constitute "forward-looking" statements within the meaning of Section 27A of the Securities Act of 1933, as amended, and Section 21E of the Securities Exchange Act of 1934, as amended, and as defined in the U.S. Private Securities Litigation Reform Act of 1995. These forward-looking statements can be identified by terminology such as "will," "expects," "anticipates," "future," "intends, "plans," "believes," "estimates" and similar statements. Among other things, the quotations from management in this press release and the Company’s operations and business outlook, contain forward-looking statements. Such statements involve certain risks and uncertainties that could cause actual results to differ materially from those in the forward-looking statements. Further information regarding these and other risks is included in JinkoSolar’s filings with the U.S. Securities and Exchange Commission, including its annual report on Form 20-F. Except as required by law, the Company does not undertake any obligation to update any forward-looking statements, whether as a result of new information, future events or otherwise.

For investor and media inquiries, please contact:

In China:
Ripple Zhang
JinkoSolar Holding Co., Ltd.
Tel: +86 21-5183-3105
Email: ir@jinkosolar.com

Rene Vanguestaine
Christensen
Tel: + 86 178 1749 0483
Email: rvanguestaine@ChristensenIR.com

In the U.S.:
Ms. Linda Bergkamp
Christensen
Tel: +1-480-614-3004
Email: lbergkamp@ChristensenIR.com


JINKOSOLAR HOLDING CO., LTD. 

UNAUDITED CONDENSED CONSOLIDATED STATEMENTS OF OPERATIONS

(in thousands, except ADS and Share data)

For the quarter ended

For the six months ended

June 30, 2019

March 31, 2020

June 30, 2020

June 30, 2019

June 30, 2020

RMB

RMB

RMB

USD

RMB

RMB

USD

 Revenues from third parties 

6,912,301

8,431,213

8,448,719

1,195,839

12,589,528

16,879,932

2,389,199

 Revenues from related parties 

725

52,710

1,943

275

145,546

54,653

7,736

 Total revenues 

6,913,026

8,483,923

8,450,662

1,196,114

12,735,074

16,934,585

2,396,935

 Cost of revenues 

(5,769,143)

(6,827,045)

(6,937,720)

(981,971)

(10,626,854)

(13,764,765)

(1,948,276)

 Gross profit 

1,143,883

1,656,878

1,512,942

214,143

2,108,220

3,169,820

448,659

 Operating expenses: 

   Selling and marketing 

(561,959)

(613,821)

(709,189)

(100,379)

(1,021,273)

(1,323,010)

(187,260)

   General and administrative 

(248,376)

(238,594)

(294,452)

(41,677)

(440,278)

(533,046)

(75,448)

   Research and development 

(73,258)

(71,784)

(74,643)

(10,565)

(150,636)

(146,427)

(20,725)

 Total operating expenses 

(883,593)

(924,199)

(1,078,284)

(152,621)

(1,612,187)

(2,002,483)

(283,433)

 Income from operations 

260,290

732,679

434,658

61,522

496,033

1,167,337

165,226

 Interest expenses, net 

(116,754)

(108,613)

(106,239)

(15,037)

(212,864)

(214,852)

(30,410)

 Subsidy income 

10,517

5,061

14,379

2,035

15,258

19,440

2,752

 Exchange gain 

87,487

10,951

51,616

7,306

6,507

62,567

8,856

 Change in fair value of interest rate swap 

(46,118)

(78,878)

(76,317)

(78,878)

(11,164)

 Change in fair value of foreign exchange derivatives 

(41,619)

(117,787)

18,133

2,567

(23,505)

(99,654)

(14,105)

 Convertible senior notes issuance costs 

(18,646)

(18,646)

 Change in fair value of convertible senior notes and call option 

(45,070)

65,990

(51,165)

(7,242)

(45,070)

14,825

2,098

 Other income/(expense), net 

7,302

(2,187)

2,127

301

14,700

(60)

(8)

 Income before income taxes

97,389

507,216

363,509

51,452

156,096

870,725

123,245

 Income tax benefit/(expense) 

55,917

(109,520)

(22,754)

(3,221)

60,167

(132,274)

(18,722)

 Equity in (loss)/gain of affiliated companies 

(28,621)

(101,527)

4,211

596

(52,330)

(97,316)

(13,774)

 Net income 

124,685

296,169

344,966

48,827

163,933

641,135

90,749

 Less: Net (loss)/income attributable to non-controlling
          interests 

(725)

13,728

26,923

3,811

(1,664)

40,651

5,754

Net income attributable to JinkoSolar
Holding Co., Ltd.’s ordinary shareholders 

125,410

282,441

318,043

45,016

165,597

600,484

84,995

Net income attributable to JinkoSolar Holding Co., Ltd.’s
 ordinary shareholders per share: 

   Basic 

0.75

1.58

1.79

0.25

1.02

3.37

0.48

   Diluted 

0.32

0.67

1.64

0.23

0.57

2.77

0.39

Net income attributable to JinkoSolar Holding Co., Ltd.’s
   ordinary shareholders per ADS: 

   Basic 

3.01

6.32

7.16

1.01

4.10

13.48

1.91

   Diluted 

1.26

2.67

6.55

0.93

2.28

11.08

1.57

Weighted average ordinary shares outstanding: 

   Basic 

166,605,808

178,743,903

177,718,162

177,718,162

161,670,693

178,231,033

178,231,033

   Diluted 

165,385,410

198,081,276

170,989,776

170,989,776

161,633,544

197,139,692

197,139,692

 Weighted average ADS outstanding: 

   Basic 

41,651,452

44,685,976

44,429,541

44,429,541

40,417,673

44,557,758

44,557,758

   Diluted 

41,346,352

49,520,319

42,747,444

42,747,444

40,408,386

49,284,923

49,284,923

UNAUDITED CONDENSED CONSOLIDATED STATEMENT OF COMPREHENSIVE INCOME

Net income 

124,685

296,169

344,966

48,827

163,933

641,135

90,749

Other comprehensive income/(loss): 

   -Foreign currency translation adjustments 

48,233

45,040

30,442

4,309

30,774

75,482

10,684

   -Change in the instrument-specific credit risk 

5,546

39,202

(52,681)

(7,457)

5,546

(13,479)

(1,908)

 Comprehensive income 

178,464

380,411

322,727

45,679

200,253

703,138

99,525

 Less: Comprehensive (loss)/income attributable to non-controlling
interests 

(725)

13,728

26,923

3,811

(1,664)

40,651

5,754

 Comprehensive income attributable to JinkoSolar Holding Co., Ltd.’s
ordinary shareholders 

179,189

366,683

295,804

41,868

201,917

662,487

93,771

 Reconciliation of GAAP and non-GAAP Results 

 1. Non-GAAP earnings per share and non-GAAP earnings per ADS 

 GAAP net income attributable to ordinary shareholders 

125,410

282,441

318,043

45,016

165,597

600,484

84,995

 Convertible senior notes issuance costs 

18,646

18,646

 Change in fair value of convertible senior notes and call option 

45,070

(65,990)

51,165

7,242

45,070

(14,825)

(2,098)

 Net interest expenses of convertible senior notes and call option 

2,914

6,128

6,734

953

2,914

12,862

1,820

 Exchange (gain)/loss on convertible senior notes and call option 

(721)

4,664

(291)

(41)

(721)

4,373

619

 Stock-based compensation expense 

11,587

249

423

60

4,663

672

95

 Non-GAAP net income attributable to ordinary shareholders 

202,906

227,492

376,074

53,230

236,169

603,566

85,431

 Non-GAAP earnings per share attributable to ordinary shareholders – 

   Basic 

1.22

1.27

2.12

0.30

1.461

3.39

0.48

   Diluted 

1.22

1.15

2.12

0.30

1.461

3.06

0.43

 Non-GAAP earnings per ADS attributable to ordinary shareholders – 

   Basic 

4.87

5.09

8.46

1.20

5.84

13.54

1.92

   Diluted 

4.87

4.59

8.46

1.20

5.84

12.25

1.73

 Non-GAAP weighted average ordinary shares outstanding  

   Basic 

166,605,808

178,743,903

177,718,162

177,718,162

161,670,693

178,231,033

178,231,033

   Diluted 

166,605,808

198,081,276

177,718,162

177,718,162

161,670,693

197,139,692

197,139,692

 Non-GAAP weighted average ADS outstanding  

   Basic 

41,651,452

44,685,976

44,429,541

44,429,541

40,417,673

44,557,758

44,557,758

   Diluted 

41,651,452

49,520,319

44,429,541

44,429,541

40,417,673

49,284,923

49,284,923


JINKOSOLAR HOLDING CO., LTD. 

UNAUDITED CONDENSED CONSOLIDATED BALANCE SHEETS

(in thousands)

December 31,
2019

June 30, 2020

RMB

RMB

USD

ASSETS

Current assets:

  Cash and cash equivalents

5,653,854

6,256,894

885,606

  Restricted cash 

576,546

593,580

84,016

  Restricted short-term investments

6,930,502

6,351,495

898,996

  Accounts receivable, net – related parties

520,504

457,227

64,716

  Accounts receivable, net – third parties

5,266,351

5,896,205

834,554

  Notes receivable, net – related parties

18,629

38,629

5,468

  Notes receivable, net – third parties

1,529,801

2,069,340

292,896

  Advances to suppliers, net – third parties

2,522,373

2,131,005

301,624

  Inventories, net

5,818,789

6,889,268

975,113

  Forward contract receivables

52,281

997

141

  Prepayments and other current assets, net – related parties

54,318

35,630

5,043

  Prepayments and other current assets, net

1,573,482

1,570,550

222,297

  Held-for-sale assets

1,170,818

Total current assets

31,688,248

32,290,820

4,570,470

Non-current assets:

  Restricted cash

531,158

922,353

130,551

  Accounts receivable, net – third parties

28,020

3,966

  Project Assets

798,243

806,474

114,149

  Long-term investments

278,021

163,442

23,134

  Property, plant and equipment, net

10,208,205

11,336,560

1,604,586

  Land use rights, net

597,922

721,113

102,067

  Intangible assets, net

36,395

38,234

5,412

  Financing lease right-of-use assets, net

1,259,713

975,047

138,009

  Operating lease right-of-use assets, net

317,904

276,781

39,176

  Deferred tax assets 

271,286

271,286

38,398

  Call Option-concurrent with issuance of convertible
  senior notes

294,178

235,084

33,274

  Other assets, net – related parties

96,753

99,296

14,054

  Other assets, net – third parties

1,466,692

1,437,186

203,421

Total non-current assets

16,156,470

17,310,876

2,450,197

Total assets

47,844,718

49,601,696

7,020,667

LIABILITIES

Current liabilities:

  Accounts payable – related parties

36,310

20,473

2,898

  Accounts payable – third parties

4,952,630

4,619,921

653,907

  Notes payable – third parties

7,518,570

6,857,544

970,622

  Accrued payroll and welfare expenses

879,465

793,927

112,373

  Advances from related parties

749

  Advances from  third parties

4,350,380

2,380,763

336,975

  Income tax payable

117,422

78,598

11,125

  Other payables and accruals

3,055,928

3,296,258

466,560

  Other payables due to related parties

13,127

14,633

2,070

  Forward contract payables

3,857

37,716

5,338

  Convertible senior notes – current

634,256

89,773

  Financing lease liabilities – current

227,613

219,428

31,058

  Operating lease liabilities – current

40,043

40,532

5,737

  Short-term borrowings from third parties,
     including current portion of long-term bank
     borrowings

9,047,250

12,066,725

1,707,934

  Guarantee liabilities to related parties

25,688

23,363

3,307

  Held-for-sale liabilities

1,008,196

Total current liabilities

31,277,228

31,084,137

4,399,677

Non-current liabilities:

  Long-term borrowings

1,586,187

2,831,051

400,709

  Convertible senior notes

728,216

  Accrued warranty costs – non current

651,968

703,747

99,609

  Financing lease liabilities

583,491

471,138

66,685

  Operating lease liabilities

279,534

236,566

33,484

  Deferred tax liability

250,734

250,734

35,489

  Guarantee liabilities to related parties 
   – non current

46,332

41,109

5,819

Total non-current liabilities

4,126,462

4,534,345

641,795

Total liabilities

35,403,690

35,618,482

5,041,472

SHAREHOLDERS’ EQUITY

Ordinary shares (US$0.00002 par value, 500,000,000
shares authorized, 180,653,497 and 180,829,497 shares
issued as of December 31, 2019 and June 30, 2020,
respectively)

25

25

4

Additional paid-in capital

4,582,850

4,587,584

649,330

Statutory reserves

689,707

689,707

97,622

Accumulated other comprehensive income

62,952

124,955

17,686

Treasury stock, at cost; 1,723,200 and 2,945,840 ordinary
shares as of  December 31, 2019 and June 30, 2020,
respectively

(13,876)

(43,170)

(6,110)

Accumulated retained earnings

3,981,661

4,588,753

649,495

Total JinkoSolar Holding Co., Ltd. shareholders’ equity

9,303,319

9,947,854

1,408,027

Non-controlling interests

3,137,709

4,035,360

571,168

Total liabilities and shareholders’ equity

47,844,718

49,601,696

7,020,667


Related Links :

http://www.jinkosolar.com

Nomination Committee appointed for Electrolux Annual General Meeting 2021

– The members of the Nomination Committee for Electrolux Annual General Meeting in 2021 have now been appointed

STOCKHOLM, Sept. 22, 2020 — In accordance with decision by the Annual General Meeting, Electrolux Nomination Committee shall consist of six members. The Nomination Committee shall include members selected by each of the four largest shareholders in terms of voting rights that wish to participate in the committee, together with the Chairman of the Electrolux Board and one additional Board member.

The members of the Nomination Committee have now been appointed based on the ownership structure as of August 31, 2020. Johan Forssell, Investor AB, is the Chairman of the committee. The other members are Carina Silberg, Alecta, Tomas Risbecker, AMF – Försäkring och Fonder, and Marianne Nilsson, Swedbank Robur Funds. The committee will also include Staffan Bohman and Fredrik Persson, Chairman and Director, respectively, of Electrolux.

The Nomination Committee will prepare proposals for the Annual General Meeting in 2021 regarding Chairman of the Annual General Meeting, Board members, Chairman of the Board, remuneration for Board members, Auditor, Auditor’s fees and, to the extent deemed necessary, proposal regarding amendments of the current instruction for the Nomination Committee.

The Annual General Meeting will be held on March 25, 2021, in Stockholm, Sweden.

Shareholders who wish to submit proposals to the Nomination Committee should send an email to nominationcommittee@electrolux.com.

For further information, please contact:

Electrolux Press Hotline, +46-8-657-65-07

This information was brought to you by Cision http://news.cision.com

https://news.cision.com/electrolux/r/nomination-committee-appointed-for-electrolux-annual-general-meeting-2021,c3200232

The following files are available for download: