Tag Archives: TRN

BEST Inc. Announces Unaudited First Quarter 2022 Financial Results

HANGZHOU, China, June 9, 2022 /PRNewswire/ — BEST Inc. (NYSE: BEST) (“BEST” or the “Company”), a leading integrated smart supply chain solutions and logistics services provider in China and Southeast Asia (“SEA”), today announced its unaudited financial results for the first quarter ended March 31, 2022.

Johnny Chou, Founder, Chairman and CEO of BEST, commented, “Despite the disruptions caused by the COVID-19 pandemic, we continued to serve our customers with operational resilience. BEST Global continued its strong growth momentum and finished the quarter with 25% year-over-year (“YOY”) volume increase in SEA. As we continued with our Strategic Refocusing Program, we are winding down our BEST UCargo and Capital business lines, which gives us a much leaner organization and lower cost structure. At end of the first quarter, we have a net cash position of RMB1.5 billion

“During the quarter, BEST Freight maintained its industry-leading position and achieved notable service quality improvements. Freight’s on-time delivery rate has improved by 14% YOY. Supply Chain Management remains our key differentiator as it empowers our customers with digitalized end-to-end logistics solutions. It is also the heart of our cross-segment synergies; significantly benefiting Freight and Global by supporting its customer’s transportation and global logistics needs. Among SCM’s top customers, more than 20% use our Freight service.

“We believe the activities of supply chain and logistics business will pick up quickly in China and SEA as the pandemic eases. Information technology-driven and integrated supply chain and logistics solutions will be in high demand to support such growth. BEST’s strengths in technology, domestic and international end-to-end supply chain and logistics capabilities, as well as our broad customer base in China coupled with strong cash position will allow us to capture this growth opportunity and on the path to profitability.” concluded Mr. Chou.

Gloria Fan, BEST’s Chief Financial Officer, added, “Our first quarter revenue, excluding UCargo and Capital, declined by 4.6% YOY. Given the pandemic-related disruptions and other macro environment uncertainties, our performance is a testament to our strong business resilience. Our balance of cash and cash equivalents, restricted cash, and short-term investments were RMB5.3 billion at the end of the first quarter. Supported by our robust balance sheet, our emphasis on service quality and operational efficiency will strengthen our core competencies in Freight, integrated Supply Chain Management and Global logistics solutions, building a solid foundation for future growth and profitability.”

FINANCIAL HIGHLIGHTS(1) 

For the First Quarter Ended March 31, 2022:(2)

  • Revenue was RMB1,802.6 million (US$284.4 million) compared to RMB2,783.6 million in the first quarter of 2021. The revenue decrease was primarily due to the winding-down of the UCargo business line. Revenue generated from UCargo business was approximately RMB19.4 million (US$3.1 million) compared with RMB868.7 million in the same quarter of 2021, a decrease of 97.8%.
  • Gross Loss was RMB76.8 million (US$12.1 million), compared to gross profit of RMB51.7 million in the first quarter of 2021. The decrease was primarily due to winding down of the Capital business line and increased unit cost of Freight business, mainly resulting from higher fuel cost. Gross Loss Margin was 4.3%, compared to a Gross Profit Margin of 1.9% in the first quarter of 2021. 
  • Net Loss from continuing operations was RMB379.9 million (US$59.9 million), compared to RMB191.2 million in the first quarter of 2021. Non-GAAP Net Loss from continuing operations(3)(4) was RMB359.2 million (US$56.7 million), compared to RMB169.7 million in the first quarter of 2021.
  • Diluted loss per ADS(5) from continuing operations was negative RMB4.60 (US$0.73), compared to negative RMB2.40 in the first quarter of 2021. Non-GAAP diluted loss per ADS(3)(4) from continuing operations was negative RMB4.33 (US$0.68), compared to negative RMB2.12 in the first quarter of 2021.
  • EBITDA(6) from continuing operations was negative RMB315.3 million (US$49.7 million), compared to negative RMB120.0 million in the first quarter of 2021. Adjusted EBITDA(3)(5) from continuing operations was negative RMB294.6 million (US$46.5 million), compared to negative RMB98.5 million in the first quarter of 2021.

BUSINESS HIGHLIGHTS(7) 

BEST Freight – In the first quarter of 2022, the Company remained focused on developing its e-commerce related business, which contributed 22.2% of total volume during the quarter, up 5.6 ppts YOY. The logistics industry has been significantly affected by the resurgences of the pandemic. Freight’s volume decreased by 13.5% YOY, as parts of its operations, particularly some of its transportation fleet, hubs and sortation centers, have been restricted due to the pandemic.

Freight continued to implement measures to strengthen its network coverage and service quality including automation in certain major sortation centers and expansion of franchise network. These efforts have delivered immediate results. In the first quarter, Freight’s on-time delivery rate improved by 14.0% YOY. 

BEST UCargo’s operations and financial results are now consolidated with BEST Freight.

BEST Supply Chain Management – During the first quarter of 2022, the Company continued to grow its B2B2C fulfillment network and distribution capabilities (“Cloud OFCs”) while prioritizing higher-margin accounts. Due to discontinuation of certain low-margin legacy customers, the total number of orders fulfilled by Cloud OFCs decreased 13.3% YOY to 87.3 million in the first quarter, of which the total number of orders fulfilled by franchised Cloud OFCs increased by 2.4% to 54.1 million. Supply Chain Management’s gross margin for the first quarter of 2022 was 4.3%, decreased by 1.1 ppts YOY, primarily due to restrictions on certain warehouses caused by the pandemic.

BEST Global – Despite the ongoing pandemic and disruption in its supply chains, Global continued to expand its market share in SEA. Its parcel volume reached 38.4 million in the first quarter of 2022, up 24.5% YOY. Parcel volumes in Vietnam, Malaysia and Singapore, increased by 67.7%, 67.6% and 72.0%, respectively. In addition to the positive development in SEA, U.S. operations reached breakeven last year and continued to be profitable in the first quarter of 2022.

Others

As part of its strategic refocusing plan, the Company continued to wind down its Capital business line in the first quarter of 2022.

Key Operational Metrics

Three Months Ended

% Change YOY

March 31,
2020

March 31,
2021

March 31,
2022

2021 vs
2020

2022 vs

2021

Freight Volume (Tonne in ‘000)

1,074

1,945

1,683

81.0%

(13.5%)

Supply Chain Management
Orders Fulfilled (in ‘000)

83,596

100,784

87,347

20.6%

(13.3%)

Global Parcel Volume in SEA
 (in ‘000)

8,840

30,841

38,390

248.9%

24.5%

FINANCIAL RESULTS(8) 

For the First Quarter Ended March 31, 2022:

Revenue

The following table sets forth a breakdown of revenue by business segment for the periods indicated.

Table 1 – Breakdown of Revenue by Business Segment

Three Months Ended

March 31, 2021

March 31, 2022

(In ‘000, except for %)

RMB

% of
Revenue

RMB

US$

% of
Revenue

% Change
YOY

Total Freight

2,043,186

73.4%

1,092,814

172,387

60.6%

(46.5%)

  -Freight

1,174,493

42.2%

1,073,460

169,334

59.6%

(8.6%)

  -Legacy UCargo

868,693

31.2%

19,354

3,053

1.0%

(97.8%)

Supply Chain
Management

447,661

16.1%

408,962

64,512

22.7%

(8.6%)

Global

250,422

9.0%

268,709

42,388

14.9%

7.3%

Others(9)

42,290

1.5%

32,100

5,064

1.8%

(24.1%)

Total Revenue

2,783,559

100.0%

1,802,585

284,351

100.0%

(35.2%)

  • Freight Service Revenue was RMB1,092.8 million (US$172.4million) for the first quarter of 2022, compared with RMB2,043.2 million in the same period of last year; of which, RMB19.4 million and RMB868.7 million were from the legacy UCargo business line.  Freight service revenue excluding legacy UCargo business decreased by 8.6% YOY resulting from a 13.5% decrease in freight volume, partially offset by a 4.5% increase in ASP per tonne.
  • Supply Chain Management Service Revenue decreased by 8.6% YOY to RMB409.0 million (US$64.5 million) for the first quarter of 2022 from RMB447.7million in the same period of last year, primarily due to discontinuation of certain low-margin legacy accounts.
  • Global Service Revenue increased by 7.3% YOY to RMB268.7 million (US$42.4 million) for the first quarter of 2022 from RMB250.4 million in the same period of last year, primarily due to parcel volume growth in SEA.

Cost of Revenue

The following table sets forth a breakdown of cost of revenue by business segment for the periods indicated.

Table 2 – Breakdown of Cost of Revenue by Business Segment

Three Months Ended

% of
Revenue
Change

YOY

March 31, 2021

March 31, 2022

(In ‘000, except for %)

RMB

% of
Revenue

RMB

US$

% of
Revenue

Total Freight

(2,029,952)

99.4%

(1,170,314)

(184,612)

107.1%

7.7ppt

-Freight

(1,173,930)

100.0%

(1,144,613)

(180,558)

106.6%

6.6ppt

-Legacy UCargo

(856,022)

98.5%

(25,701)

(4,054)

132.8%

34.3ppt

Supply Chain
Management

(423,506)

94.6%

(391,207)

(61,711)

95.7%

1.1ppt

Global

(265,102)

105.9%

(285,678)

(45,065)

106.3%

0.4ppt

Others

(13,307)

31.5%

(32,225)

(5,083)

100.4%

68.9ppt

Total Cost of Revenue

(2,731,867)

98.1%

(1,879,424)

(296,471)

104.3%

6.2ppt

  • Cost of Revenue for Freight excluding legacy UCargo business was RMB1,144.6 million or 106.6% of revenue in the first quarter of 2022. The 6.6 ppts increase YOY in cost of revenue as a percentage of revenue was mainly due to higher fuel cost and additional costs caused by the pandemic.
  • Cost of Revenue for Supply Chain Management was RMB391.2 million or 95.7% of revenue in the first quarter of 2022. The 1.1 ppts increase YOY in cost of revenue as a percentage of revenue was primarily due to restrictions on certain warehouses caused by the pandemic.
  • Cost of Revenue for Global was RMB285.7 million or 106.3% of revenue in the first quarter of 2022. The 0.4 ppts increase YOY in cost of revenue as a percentage of revenue was primarily due to additional costs caused by the pandemic and higher fuel cost; partially offset by increased parcel volume.
  • Cost of Revenue for Others was RMB 32.2 million or 100.4% of revenue in the first quarter of 2022. The 68.9 ppts increase YOY in cost revenue as percentage of revenue was primarily due to winding down of BEST Capital business line.

Gross Loss was RMB76.8 million (US$12.1 million) in the first quarter of 2022, compared to gross profit of RMB51.7 million in the first quarter of 2021; Gross Margin was negative 4.3%, compared to positive 1.9% in the first quarter of 2021.

Operating Expenses

Selling, General and Administrative Expenses were RMB255.0 million (US$40.2 million) or 14.1% of revenue in the first quarter of 2022, compared to RMB249.8 million or 9.0% of revenue in the first quarter of 2021, primarily due to the expenses associated with winding down the Capital business.

Research and Development Expenses were RMB33.2million (US$5.2 million) or 1.8% of revenue in the first quarter of 2022, compared to RMB40.1 million, or 1.4% of revenue in the first quarter of 2021, primarily due to reduced headcount. 

Share-based Compensation (“SBC”) Expenses included in the cost and expense items above were RMB20.7 million (US$3.3 million) in the first quarter of 2022, compared to RMB27.1 million in the first quarter of 2021. In the first quarter of 2022, RMB0.05 million (US$0.01 million) was allocated to cost of revenue, RMB1.2 million (US$0.2 million) was allocated to selling expenses, RMB18.2 million (US$2.9 million) was allocated to general and administrative expenses, and RMB1.3 million (US$0.2 million) was allocated to research and development expenses.

Net Loss and Non-GAAP Net Loss from continuing operations

Net Loss from continuing operations in the first quarter of 2022 was RMB379.9 million (US$59.9 million), compared to RMB191.2 million in the first quarter of 2021. Excluding SBC expenses, amortization of intangible assets resulting from business acquisitions and gain from appreciation of investment, Non-GAAP Net Loss from continuing operations in the first quarter of 2022 was RMB359.2 million (US$56.7 million), compared to RMB169.7 million in the first quarter of 2021.

Diluted loss per ADS and Non-GAAP diluted loss per ADS from continuing operations

Diluted loss per ADS from continuing operations in the first quarter of 2022 was negative RMB4.60 (US$0.73), compared to negative RMB2.4 in the same period of 2021. Excluding SBC expenses, amortization of intangible assets resulting from business acquisitions and gain from appreciation of investment, Non-GAAP diluted loss per ADS from continuing operations in the first quarter of 2022 was negative RMB4.33 (US$0.68), compared to negative RMB2.12 in the first quarter of 2021. A reconciliation of non-GAAP diluted loss per ADS to diluted loss per ADS is included at the end of this results announcement.

Adjusted EBITDA and Adjusted EBITDA Margin from continuing operations

Adjusted EBITDA from continuing operations in the first quarter of 2022 was negative RMB294.6 million (US$46.5million), compared to negative RMB98.5million in the same period of 2021. Adjusted EBITDA Margin from continuing operations in the first quarter of 2022 was negative 16.3%, compared to negative 3.5% in the same period of 2021.

Cash and Cash Equivalents, Restricted Cash and Short-term Investments

As of March 31, 2022, cash and cash equivalents, restricted cash and short-term investments were RMB5,261.1 million (US$829.9 million), compared to RMB3,389.0 million as of March 31, 2021.

Net Cash Used In Continuing Operating Activities

Net cash used in continuing operating activities in the first quarter of 2022 was RMB304.1 million (US$48.0 million), compared to RMB47.9 million of net cash generated from continuing operating activities in the same period of 2021. The increase in net cash used in operating activities was mainly due to the increased net loss and catch-up payments to vendors in the first quarter of 2022. 

Capital Expenditures (“CAPEX”)

CAPEX was RMB49.1 million (US$7.7 million), or 2.7% of total revenue in the first quarter ended March 31, 2022, compared to CAPEX of RMB74.7 million, or 2.7% of total revenue, in the same period of 2021. 

SHARES OUTSTANDING

As of May 31, 2022, the Company had approximately 392.5 million ordinary shares outstanding(10). Each American Depositary Share represents five (5) Class A ordinary shares.

As previously announced, effective from May 20, 2022, the Company has changed the ratio of its American Depositary Shares to its Class A ordinary shares, par value US$0.01 per share, from the original ADS ratio of one (1) ADS to one (1) Class A ordinary share, to a new ADS ratio of one (1) ADS to five (5) Class A ordinary shares.

FINANCIAL GUIDANCE

Due to the uncertainties relating to the COVID-19 pandemic, the Company renounces, and does not affirm, its previous financial guidance given in its results announcement dated March 8, 2022.  Accordingly, the Company is not providing any financial guidance or revenue outlook at this time. We are driving each of our business units toward a speedy recovery as the COVID-19 pandemic eases.

WEBCAST AND CONFERENCE CALL INFORMATION

The Company will hold a conference call at 9:00 pm U.S. Eastern Time on June 8, 2022 (9:00 am Beijing Time on June 9, 2022), to discuss its financial results and operating performance for the first quarter of 2022.

Participants may access the call by dialing the following numbers:

United States:                                     +1-888-317-6003
Hong Kong:                                         800-963976 or +852-5808-1995
Mainland China:                                  4001-206115
International:                                       +1-412-317-6061
Participant Elite Entry Number:           6408443

A replay of the conference call will be accessible through June 15, 2022 by dialing the following numbers:

United States:                                       +1-877-344-7529
International:                                         +1-412-317-0088
Replay Access Code:                            2605618

Please visit the Company’s investor relations website to view the earnings release prior to the conference call. A live and archived webcast of the conference call and a corporate presentation will be available at the same site.

ABOUT BEST INC.

BEST Inc. (NYSE: BEST) is a leading integrated smart supply chain solutions and logistics services provider in China and SEA. Through its proprietary technology platform and extensive networks, BEST offers a comprehensive set of logistics and value-added services, including freight delivery, supply chain management, and global logistics services. BEST’s mission is to empower business and enrich life by leveraging technology and business model innovation to create a smarter, more efficient supply chain. For more information, please visit: http://www.best-inc.com/en/.  

For investor and media inquiries, please contact:

BEST Inc.
Investor relations team                         
ir@best-inc.com

The Piacente Group, Inc.
Yang Song
Tel: +86-10-6508-0677
E-mail: best@tpg-ir.com

The Piacente Group, Inc.
Brandi Piacente
Tel: +1-212-481-2050
E-mail:  best@tpg-ir.com

SAFE HARBOR STATEMENT

This announcement contains forward-looking statements. These statements are made under the “safe harbor” provisions of the U.S. Private Securities Litigation Reform Act of 1995. These forward-looking statements can be identified by terminology such as “will,” “expects,” “anticipates,” “future,” “intends,” “plans,” “believes,” “estimates” and similar statements. Among other things, the business outlook and quotations from management in this announcement, as well as BEST’s strategic and operational plans, contain forward-looking statements. BEST may also make written or oral forward-looking statements in its periodic reports to the U.S. Securities and Exchange Commission (the “SEC”), in its annual report to shareholders, in press releases and other written materials and in oral statements made by its officers, directors or employees to third parties. Statements that are not historical facts, including statements about BEST’s beliefs and expectations, are forward-looking statements. Forward-looking statements involve inherent risks and uncertainties. A number of factors could cause actual results to differ materially from those contained in any forward-looking statement, including but not limited to the following: BEST’s goals and strategies; BEST’s future business development, results of operations and financial condition; BEST’s ability to maintain and enhance its ecosystem; BEST’s ability to compete effectively; BEST’s ability to continue to innovate, meet evolving market trends, adapt to changing customer demands and maintain its culture of innovation; fluctuations in general economic and business conditions in China and other countries in which BEST operates, and assumptions underlying or related to any of the foregoing. Further information regarding these and other risks is included in BEST’s filings with the SEC. All information provided in this press release and in the attachments is as of the date of this press release, and BEST does not undertake any obligation to update any forward-looking statement, except as required under applicable law.

USE OF NON-GAAP FINANCIAL MEASURES

In evaluating its business, BEST considers and uses non-GAAP measures, such as non-GAAP net loss/income, non-GAAP net loss/profit margin, adjusted EBITDA, adjusted EBITDA margin, EBITDA, and non-GAAP Diluted earnings/loss per ADS, as supplemental measures in the evaluation of the Company’s operating results and in the Company’s financial and operational decision-making. The Company believes these non-GAAP financial measures that help identify underlying trends in the Company’s business that could otherwise be distorted by the effect of the expenses and gains that the Company includes in loss from operations and net loss. The Company believes that these non-GAAP financial measures provide useful information about its operating results, enhance the overall understanding of its past performance and future prospects and allow for greater visibility with respect to key metrics used by the Company’s management in its financial and operational decision-making. The presentation of these non-GAAP financial measures is not intended to be considered in isolation or as a substitute for the financial information prepared and presented in accordance with U.S. GAAP. For more information on these non-GAAP financial measures, please see the table captioned “Reconciliations of Non-GAAP Measures to the Nearest Comparable GAAP Measures” in the results announcement.

The non-GAAP financial measures are provided as additional information to help investors compare business trends among different reporting periods on a consistent basis and to enhance investors’ overall understanding of the Company’s current financial performance and prospects for the future. These non-GAAP financial measures should be considered in addition to results prepared in accordance with U.S. GAAP, but should not be considered a substitute for, or superior to, U.S. GAAP results. In addition, the Company’s calculation of the non-GAAP financial measures may be different from the calculation used by other companies, and therefore comparability may be limited.

Summary of Unaudited Condensed Consolidated Income Statements

(In Thousands)

Three Months Ended March 31,

2021

2022

RMB

RMB

US$

Revenue

Freight

2,043,186

1,092,814

172,387

  -Freight

1,174,493

1,073,460

169,334

  -Legacy UCargo

868,693

19,354

3,053

Supply Chain Management

447,661

408,962

64,512

Global

250,422

268,709

42,388

Others

42,290

32,100

5,064

Total Revenue

2,783,559

1,802,585

284,351

Cost of Revenue

Freight

(2,029,952)

(1,170,314)

(184,612)

Supply Chain Management

(423,506)

(391,207)

(61,711)

Global

(265,102)

(285,678)

(45,065)

Others

(13,307)

(32,225)

(5,083)

Total Cost of Revenue

(2,731,867)

(1,879,424)

(296,471)

Gross Profit/(Loss)

51,692

(76,839)

(12,120)

Selling Expenses

(55,081)

(54,926)

(8,664)

General and Administrative
   Expenses

(194,680)

(200,054) (11)

(31,558)

Research and

   Development Expenses

(40,065)

(33,175)

(5,233)

Other operating
   income/(expense), net

41,718

2,640

416

Loss from Operations

(196,416)

(362,354)

(57,159)

Interest Income

11,707

15,618

2,464

Interest Expense

(35,512)

(26,422)

(4,168)

Foreign Exchange Gain

800

4,845

764

Other Income

40,735

16,109

2,541

Other Expense

(8,242)

(27,476)

(4,334)

Loss before Income Tax
   and Share of Net Loss of
   Equity Investees

(186,928)

(379,680)

(59,892)

Income Tax Expense

(4,290)

(219)

(35)

Loss before Share of Net
   loss of Equity Investees

(191,218)

(379,899)

(59,927)

Share of Net Loss of Equity
   Investees

Net Loss from continuing
   operations

(191,218)

(379,899)

(59,927)

Net loss from discontinued
   operations

(427,087)

(284)

(45)

Net Loss

(618,305)

(380,183)

(59,972)

Net loss attributable to non-
   controlling interests

(5,410)

(20,878)

(3,293)

Net Loss attributable to
    BEST Inc.

(612,895)

(359,305)

(56,679)

Summary of Unaudited Condensed Consolidated Balance Sheets

(in thousands)

As of December 31,2021

              As of March 31, 2022

      RMB

           RMB      

  US$         

Assets

Current Assets

Cash and Cash Equivalents

3,571,745

2,053,610

323,949

Restricted Cash

675,159

599,920

94,635

Accounts and Notes Receivables

827,631

752,397

118,690

Inventories

25,622

24,295

3,832

Prepayments and Other Current
   Assets

1,172,472

1,013,868

159,933

Short‑term Investments

147,359

1,297,440

204,666

Amounts Due from Related Parties

125,198

97,585

15,394

Lease Rental Receivables

298,364

223,073

35,189

Total Current Assets

6,843,550

6,062,188

956,288

Non‑current Assets

Property and Equipment, Net

762,642

748,443

118,064

Intangible Assets, Net

55,684

59,273

9,350

Long‑term Investments

219,171

189,171

29,841

Goodwill

54,135

54,135

8,540

Non‑current Deposits

92,866

83,257

13,133

Other Non‑current Assets

111,640

83,478

13,168

Restricted Cash

1,069,244

1,310,141

206,670

Lease Rental Receivables

235,429

168,478

26,577

Operating Lease Right-of-use
Assets

1,899,522

1,785,192

281,607

Total non‑current Assets

4,500,333

4,481,568

706,950

Total Assets

11,343,883

10,543,756

1,663,238

Liabilities and Shareholders’
   Equity

Current Liabilities

Long-term borrowings-current

287,814

239,382

37,762

Convertible Senior Notes held by
   related parties

633,475

632,259

99,736

Convertible Senior Notes held by
   third parties

633,475

632,259

99,736

Short‑term Bank Loans

530,495

410,156

64,701

Accounts and Notes Payable

1,353,150

1,373,396

216,648

Income Tax Payable

587

350

55

Customer Advances and Deposits
   and Deferred Revenue

298,353

292,141

46,084

Accrued Expenses and Other
   Liabilities

1,591,639

1,387,461

218,867

Financing Lease Liabilities

1,851

1,699

268

Operating Lease Liabilities

518,248

493,438

77,838

Amounts Due to Related Parties

2,763

11,430

1,803

Total Current Liabilities

5,851,850

5,473,971

863,498

Summary of Unaudited Condensed Consolidated Balance Sheets (Cont’d)

(In Thousands)

As of December 31, 2021

As of March 31, 2022

    RMB

         RMB

          US$

Non-current Liabilities

Convertible senior notes held by

   related parties

955,097

951,467

150,090

Long-term borrowings

67,080

32,702

5,159

Operating Lease Liabilities

1,456,843

1,374,940

216,891

Financing Lease Liabilities

2,121

2,104

332

Other Non‑current Liabilities

24,261

25,034

3,949

Long-term Bank Loans

769,767

841,231

132,701

Total Non‑current Liabilities

3,275,169

3,227,478

509,122

Total Liabilities

9,127,019

8,701,449

1,372,620

Mezzanine Equity:

Convertible Non-controlling Interests

191,865

191,865

30,266

Total mezzanine equity

191,865

191,865

30,266

Shareholders’ Equity

Ordinary Shares

25,988

25,988

4,100

Treasury Shares

(113,031)

(28,824)

(4,547)

Additional Paid‑In Capital

19,522,173

19,457,107

3,069,284

Statutory reserves

167

Accumulated Deficit

(17,471,716)

(17,843,712) (12)

(2,814,776)

Accumulated Other
   Comprehensive Income

107,379

93,050

14,678

BEST Inc. Shareholders’ Equity

2,070,960

1,703,609

268,739

Non-controlling Interests

(45,961)

(53,167)

(8,387)

Total Shareholders’ Equity

2,024,999

1,650,442

260,352

Total Liabilities, Mezzanine Equity
   and Shareholders’ Equity

11,343,883

10,543,756

1,663,238

Summary of Unaudited Condensed Consolidated Statements of Cash Flows

 (In Thousands)

Three Months Ended March 31,

2021

2022

RMB

RMB

US$

Net cash generated from/(used in) 
   continuing operating activities

47,887

(304,096)

(47,970)

Net cash used in discontinued
   operating activities

(705,838)

Net cash used in operating
   activities

(657,951)

(304,096)

(47,970)

Net cash generated from/(used in)
   continuing
investing activities

150,074

(879,542)

(138,744)

Net cash used in discontinued
   Investing activities

(127,278)

Net cash generated from/(used in) 
   investing activities

22,796

(879,542)

(138,744)

Net cash generated from/(used in)
   continuing financing
activities

274,100

(145,284)

(22,918)

Net cash used in discontinued
   financing
activities

(172,653)

Net cash generated from/(used in)
   financing activities

101,447

(145,284)

(22,918)

Exchange Rate Effect on Cash and
   Cash Equivalents, and Restricted
   Cash

6,716

(23,555)

(3,716)

Net decrease in Cash and Cash
   Equivalents, and Restricted Cash

(526,992)

(1,352,477)

(213,348)

Cash and Cash Equivalents, and
   Restricted Cash at Beginning of
   Period

4,209,121

5,316,148

838,602

Cash and Cash Equivalents, and
   Restricted Cash at End of
 Period

3,682,129

3,963,671

625,254

Less: Cash and Cash Equivalents,
   and Restricted Cash held for sales
   at end of the Period

588,824

Cash and Cash Equivalents, and

   Restricted Cash from continuing
   operations at End of
 Period

3,093,305

3,963,671

625,254

RECONCILIATIONS OF NON-GAAP MEASURES TO THE NEAREST COMPARABLE GAAP MEASURES

For the Company’s continuing operations, the table below sets forth a reconciliation of the Company’s net (loss)/income to EBITDA, adjusted EBITDA and adjusted EBITDA margin for the periods indicated:

Table 4 – Reconciliation of EBITDA, Adjusted EBITDA and Adjusted EBITDA Margin

Three Months Ended March31, 2022

(In RMB’000)

Freight

Supply Chain

Global

Others

Unallocated(13)

Total

Net Loss

(173,111)

(20,768)

(70,976)

(57,376)

(57,668)

(379,899)

Add

  Depreciation &
  Amortization

20,257

10,484

5,110

13,317

4,391

53,559

  Interest Expense

26,422

26,422

  Income Tax Expense

12

18

189

219

Subtract

Interest Income

(15,618)

(15,618)

EBITDA

(152,854)

(10,272)

(65,848)

(43,870)

(42,473)

(315,317)

Add

 Share-based

2,953

1,822

2,428

143

13,337

20,683

   Compensation
   Expenses

Adjusted EBITDA

(149,901)

(8,450)

(63,420)

(43,727)

(29,136)

(294,634)

Adjusted EBITDA
   Margin

(13.7%)

(2.1%)

23.6%)

(136.2%)

(16.3%)

Three Months Ended March 31, 2021

(In RMB’000)

Freight

Supply Chain

Global

Others

Unallocated(14)

Total

Net (Loss)/Income

(57,629)

(11,965)

(58,244)

5,296

(68,676)

(191,218)

Add

   Depreciation &
   Amortization

21,597

10,227

4,174

343

6,767

43,108

   Interest Expense

35,512

35,512

   Income Tax Expense

9

4,281

4,290

Subtract

  Interest Income

(11,707)

(11,707)

EBITDA

(36,032)

(1,729)

(54,070)

9,920

(38,104)

(120,015)

Add

 Share-based

3,162

1,896

2,150

146

19,704

27,058

    Compensation
    Expenses

Subtract

   Gain from
   appreciation of
   investments

(5,562)

(5,562)

Adjusted EBITDA

(32,870)

167

(51,920)

10,066

(23,962)

(98,519)

Adjusted EBITDA
   Margin

(1.6%)

0.0%

(20.7%)

23.8%

(3.5%)

For the Company’s continuing operations, the table below sets forth a reconciliation of the Company’s net (loss)/income to non-GAAP net Income/(loss), non-GAAP net Income/(loss) margin for the periods indicated:

Table 5 – Reconciliation of Non-GAAP Net (Loss)/Income and Non-GAAP Net (Loss)/Income Margin

Three Months  Ended March 31, 2022

(In RMB’000)

Freight

Supply Chain

Global

Others

Unallocated(15)

Total

Net Loss

(173,111)

(20,768)

(70,976)

(57,376)

(57,668)

(379,899)

Add

 Share-based

 Compensation Expenses

2,953

1,822

2,428

143

13,337

20,683

Non-GAAP Net
   Loss

(170,158)

(18,946)

(68,548)

(57,233)

(44,331)

(359,216)

Non-GAAP Net
   Loss Margin

(15.6%)

(4.6%)

(25.5%)

(178.3%)

(19.9%)

Three Months  Ended March 31, 2021

(In RMB’000)

Freight

Supply Chain

Global

Others

Unallocated(16)

Total

Net (Loss)/Income

(57,629)

(11,965)

(58,244)

5,296

(68,676)

(191,218)

Add

 Share-based

 Compensation Expenses

3,162

1,896

2,150

146

19,704

27,058

Subtract

   Gain from
   appreciation of
   investments

(5,562)

(5,562)

Non-GAAP Net
   (Loss)/Income

(54,467)

(10,069)

(56,094)

5,442

(54,534)

(169,722)

Non-GAAP Net
  (Loss)/Income
 Margin

(2.7%)

(2.2%)

(22.4%)

12.9%

(6.1%)

For the Company’s continuing operations, the table below sets forth a reconciliation of the Company’s diluted loss per ADS to Non-GAAP diluted loss per ADS for the periods indicated:

Table 6 – Reconciliation of diluted loss per ADS and Non-GAAP diluted loss per ADS

Three Months Ended March 31,

2022

(In ‘000)

             RMB          

       US$

Net Loss Attributable to Ordinary Shareholders

(359,021)

(56,634)

Add

   Share-based Compensation Expenses

20,683

3,263

Non-GAAP Net Loss Attributable to Ordinary
   Shareholders

(338,338)

(53,371)

Weighted Average Diluted Ordinary Shares
  Outstanding During the Quarter

Diluted

390,274,553

390,274,553

Diluted (Non-GAAP)

390,274,553

390,274,553

Diluted loss per ordinary share

(0.92)

(0.15)

Add

   Non-GAAP adjustment to net loss per
   ordinary share

0.05

0.01

Non-GAAP diluted loss per ordinary share

(0.87)

(0.14)

Diluted loss per ADS

(4.60)

(0.73)

Add

   Non-GAAP adjustment to net loss per ADS

0.27

0.05

Non-GAAP diluted loss per ADS

(4.33)

(0.68)

(1) All numbers presented have been rounded to the nearest integer, tenth, or hundredth, and year-over-year comparisons are based on figures before rounding.                     

(2) In December 2021, BEST sold its China express business, the principal terms of which were previously announced. As a result, China express business has been deconsolidated from the Company and its historical financial results are reflected in the Company’s consolidated financial statements as discontinued operations accordingly. The financial information and non-GAAP financial information disclosed in this press release is presented on a continuing operations basis, unless otherwise specifically stated.

(3) Non-GAAP net income/loss represents net income/loss excluding share-based compensation expenses, amortization of intangible assets resulting from business acquisitions, and fair value change of equity investments (if any).

(4) See the sections entitled “Use of Non-GAAP Financial Measures” and “Reconciliations of Non-GAAP Measures to the Nearest Comparable GAAP Measures” for more information about the non-GAAP measures referred to within this results announcement.

(5) Diluted earnings/loss per ADS, is calculated by dividing net income/loss attributable to ordinary shareholders as adjusted for the effect of dilutive ordinary equivalent shares, if any, by the weighted average number of ordinary and dilutive ordinary equivalent shares expressed in ADS outstanding during the period.

(6) EBITDA represents net loss excluding depreciation, amortization, interest expense and income tax expense and minus interest income. Adjusted EBITDA represents EBITDA excluding share-based compensation expenses and fair value change of equity investments (if any).

(7) All numbers presented have been rounded to the nearest integer, tenth, or hundredth, and year-over-year comparisons are based on figures before rounding.                     

(8) All numbers represented the financial results from continuing operations, unless otherwise stated.               

(9) Others” Segment primarily represents Capital business units. Results from UCargo’s legacy contracts with external customers are now reported under “Freight” segment and prior period segment information were retrospectively revised to conform to current period presentation.           

(10) The total number of shares outstanding excludes shares reserved for future issuances upon exercise or vesting of awards granted under the Company’s share incentive plans.

(11) Including additional expenses associated with winding down the Capital business line of RMB28,005.

(12) Including accumulated accretion to redemption value and deemed dividend in relation to redeemable convertible preferred shares of RMB9,493,807, and accumulated loss from operations of RMB8,349,905.

(13) Unallocated expenses are primarily related to corporate administrative expenses and other miscellaneous items that are not allocated to individual segments.

(14) Unallocated expenses are primarily related to corporate administrative expenses and other miscellaneous items that are not allocated to individual segments.

(15) Unallocated expenses are primarily related to corporate administrative expenses and other miscellaneous items that are not allocated to individual segments.

(16) Unallocated expenses are primarily related to corporate administrative expenses and other miscellaneous items that are not allocated to individual segments.

Cision View original content to download multimedia:https://www.prnewswire.com/news-releases/best-inc-announces-unaudited-first-quarter-2022-financial-results-301564167.html

Source: BEST Inc.

New app from Health in Transportation & NuraLogix allows drivers to perform CDL health checks that target hypertension and type-2 diabetes.

DETROIT, June 8, 2022 /PRNewswire/ — Professional drivers, working both in mass transit and in trucking, are now able to access a 30-second CDL health check that focuses on the dangers of hypertension and type-2 diabetes by utilizing a new smartphone app from Health in Transportation and NuraLogix.

New app from Health in Transportation & NuraLogix allows drivers to perform CDL health checks that target hypertension and type-2 diabetes.

This app, called the CDL Health Scanner, allows drivers to quickly scan key vitals using either an iPhone or Android device. It is a unique, driver-centric system that relies on the revolutionary Anura technology to measure Blood Pressure (BP) using transdermal optical imaging delivered via a smartphone camera. When combined with the user’s Body Mass Index (BMI) data, the risk-factors for hypertension, type-2 diabetes, and even obstructive sleep apnea (OSA), the bane of over-the-road truckers, come into clear focus.

The Background

In a situation in which the industry is experiencing a shortage of close to 100,000 drivers – and when putting a new driver behind the wheel involves five-figure expense for the carrier – reducing the number of medical disqualifications that result from a Department of Transportation physical is the top priority. Close to 80% of those disqualifications are caused by high BP, dangerous blood-sugar levels and OSA, and this app not only warns drivers that they are in dangerous territory, it also links them to specialty health coaches who can guide lifestyle changes that will transform their health situation.

The principals of Health in Transportation have a proven track record, over several decades, of finding realistic ways for drivers to improve their health, despite the massive difficulties that life on the road creates. The CDL Health Scanner is the culmination of that work and their greatest achievement. It promises to protect the lives and livelihoods of hundreds of thousands of professional drivers whose life-expectancies are years less than their contemporaries. Fleets benefit too by reducing driver-replacement costs, while providing savings in their self-financed health insurance programs.

The Partnership

It would be impossible for Health in Transportation to offer this valuable tool to the transportation sector without the incredible breakthrough that the Anura technology represents. Just as important, by opting to partner with Health in Transportation, NuraLogix has ensured that this product can be supplied to drivers for only a few cents a day. The mark of true innovation is its ability to impact the lives of millions and this app is the first step towards doing just that.

Of course, the CDL Health Scanner app utilizes only a portion of the monitoring capability that NuraLogix is equipped to provide. However, getting Anura into the hands of hundreds of thousands of professional drivers will generate a wealth of data that can only enhance the Anura platform when, as will inevitably be the case, this type of non-intrusive health monitoring becomes the norm for in-car information systems. Truck drivers, many of whom drive vehicles that include interior cameras that monitor their situational awareness and other performance metrics, are the perfect population to help propel this concept into the mainstream.

About Health in Transportation

This truly unique app – patent pending was first envisioned by Bob Perry, President of Health in Transportation, a company that provides innovative and practical Health & Wellness solutions for professional drivers in trucking and mass transit. For forty years, their programs have helped thousands of drivers avoid medical disqualification with unique coaching mechanisms that drivers utilize on the road to upgrade their health status. Consequently, health insurance carriers such as Cigna have often availed themselves of the company’s services in their ongoing efforts to boost preventative care.

Known as ‘The Trucker Trainer’ by professional drivers nationwide, Bob Perry brings a very distinctive perspective to the transportation industry and its over-the-road drivers. Bob comes from a family of professional drivers and has played a critical role in the paradigm shift of regulatory agencies – both private and public sector entities – and consumers towards understanding the driver-health challenge.

Health in Transportation has experienced successful working relationships in the past with industry giants such as Covenant Transport, Greyhound, Sherwin Williams, and R+L Carriers, as well as with top OEM Daimler.

About AutoTech Detroit

The CDL Health Scanner app was launched today at AutoTech Detroit, which brings together the full automotive tech industry to immerse attendees in the future of automotive, by showcasing the newest tech and the latest vehicles.

About NuraLogix

The Anura technology powering the application comes from NuraLogix, the Toronto-based pioneers of the world’s first contactless blood pressure and vital sign measurement platform. The NuraLogix technology uses their patented Transdermal Optical Imaging (TOI™) in which a conventional video camera is used to extract facial blood flow information from the face. NuraLogix’s Anura technology is based on extensive peer-reviewed research and clinical studies, differentiating them from their competitors. NuraLogix has conducted multiple clinical studies and published research in many notable publications such as Frontiers in Psychology, Scientific Reports, and the Journal of Natural Sciences (JNS). NuraLogix currently holds 11 patents, with more pending. Their impressive client roster includes Japanese systems integration leader NTT Data; Sanitas, the second largest medical insurance company in Spain; and Lafiya Telehealth, a Nigerian-based health telehealth platform which provides 24/7 virtual healthcare services to residents in remote and rural areas.

To Learn More:

Visit our website:
Health in Transportation-  https://healthintransportation.com/
NuraLogix –https://www.nuralogix.ai/ 

Disclaimers:

Note: In the United States, this product is for Investigational Use only. The performance characteristics of this product have not been established.

For more Information: Chris Lin, Chief Marketing Officer, ChrisLin@nuralogix.ai, Tel: 437-928-2666; Bob Perry, President of Health in Transportation, bob@healthintransportation.com, Tel: 602-692-2734

Dada Group’s JDDJ fulfilled the first order in JD618 Grand Promotion, and saw sales surge

SHANGHAI, June 3, 2022 /PRNewswire/ — On May 31, only 10 minutes after the official opening of JD618 Grand Promotion, one consumer who lives in Chaoyang District, Beijing, had received the milk powder and kid toys she bought from JDDJ. These products labeled with “Shop Now”, are supported by Dada’s “One-hour” delivery service that guarantees timely deliveries.

From May 31, 8pm to June 1, 8pm, the sales generated on JDDJ and JD’s Shop Now service increased by 175% on a year-on-year basis. The sales of a number of categories increased by more than 2 times yoy, including cell phone, computer, clothing, drinks, mother and baby, home appliances, pets and personal cleaning.

Offline retail stores participated in JD618 Grand Promotion

JDDJ and JD’s Shop Now service leveraged more than 150,000 offline stores, across over 1,700 cities and counties engaged, to provide consumers in China with products across all categories, deliverable within one hour.

On-demand retail has become a key driver for offline retailers and brands’ omni-channel growth. On the first day, the online sales from brick and mortar retailers such as Decathlon, Zhongbai Supermarket, Jiarong Supermarket, Wangzhongwang Market, increased by more than 200% yoy. Rainbow Supermarket and Sofly participated the JD618 for the first time, also experienced significant growth.

Well-known brands also witnessed great growth on JDDJ and Shop Now. The first-day sales of brands like Unilever, Yili, Apple, Huawei, Honor, Dell, Xiaomi, Haier, Hisense, Estee Lauder, increased by more than 2 times year-on-year.

During this JD618 Grand Promotion, JDDJ upgrade the live broadcasting program and launched the “Thousands Stores LIVE Shopping Carnival.” By collaborating with more than 22,000 brick-and-mortar stores, the number of viewers exceeds 1.5 million in one single show.

Besides products, consumers can also enjoy convenient services such as house-keeping, laundry and shoe washing on JDDJ and Shop Now. On the first day, the order volume of JD’s self-operated house-keeping increased by 248% yoy, and laundry service increased by 233% yoy.

About Dada Group

Dada Group is a leading platform of local on-demand retail and delivery in China. It operates JDDJ, one of China’s largest local on-demand retail platforms for retailers and brand owners, and Dada Now, a leading local on-demand delivery platform open to merchants and individual senders across various industries and product categories. The company’s two platforms are inter-connected and mutually beneficial. The Dada Now platform enables improved delivery experience for participants on the JDDJ platform through its readily accessible fulfillment solutions and strong on-demand delivery infrastructure. Meanwhile, the vast volume of on-demand delivery orders from the JDDJ platform increases order volume and density for the Dada Now platform. In June 2020, Dada Group began trading on the Nasdaq Global Market, under the ticker symbol “DADA”.

About cooperation between Dada Group and JD.com

In October 2021, Dada Group and JD.com jointly launched the Shop Now service, and “Nearby”, a new tab on the homepage of JD.com’s app, which were designed to connect customers to nearby offline stores. The new business was overall undertaken by Dada Group. Shop Now service enhances on-demand location-based retail capabilities of both Dada and JD to provide one-hour retail and delivery services for consumers and partners. By clicking into the new Nearby tab, JD’s roughly 570 million users will have the opportunity to discover offline stores within a 3-5 kilometer radius of their shipping address with a wide array of product offerings.

Cision View original content to download multimedia:https://www.prnewswire.com/news-releases/dada-groups-jddj-fulfilled-the-first-order-in-jd618-grand-promotion-and-saw-sales-surge-301561062.html

CARGOBASE ACHIEVES ISO 27001 CERTIFICATION


The company is recognized for its commitment towards maintaining best practices for information security management systems

SINGAPORE, June 3, 2022 /PRNewswire/ — CARGOBASE, the global logistics tech platform for enterprise shippers, announced today that it has achieved ISO 27001 certification; a certification that recognizes proven commitment towards maintaining and protecting information security. The certification was issued by TÜV SÜD following an extensive audit process.

CARGOBASE, the global logistics tech platform for enterprise shippers, announced today that it has achieved ISO 27001 certification.

To achieve the ISO 27001 certification, organizations must demonstrate a systematic and documented approach to protecting and managing sensitive company and customer information, including intellectual property, employee and customer data, financial information and information entrusted to it by third parties.

“Receiving the ISO 27001 certification is a significant accomplishment for Cargobase that demonstrates our commitment to, and prioritization of, security management controls for our customers, partners and team members,” said Gert-Jan Spriensma, Chief Technology Officer at Cargobase. “As more enterprises look to process sensitive and confidential business data with cloud-based services like Cargobase, it’s critical they do so in a way that ensures their data will remain safe. Our customers carry this responsibility every single day, and it’s important that the vendors they select to process their data in the cloud approach that responsibility in the same way”, Spriensma continues.

ISO 27001 is a globally recognized standard mandating numerous controls for the establishment, maintenance, and certification of an Information Security Management System (ISMS). Cargobase received the certification upon its first ISO attempt, showcasing the completeness and rigor of its information security program.

About Cargobase

Cargobase is a Singapore headquartered enterprise software company offering a transport management system for contracted and non-contracted freight. Its solution supports global inbound and outbound logistics flows, including project, production and non-production supply chains. Cargobase’s land and expand approach gives the customers a solution that works in weeks, integrated or as a standalone solution, and delivers immediate ROI. The company was founded in Singapore, in 2013 and has since established offices in The Netherlands, United States and India. Its customer base is primarily large listed companies across industries using Cargobase on a daily basis across 55 countries.

ADO ebike Laboratory has been certified as “QTL Laboratory” by SGS

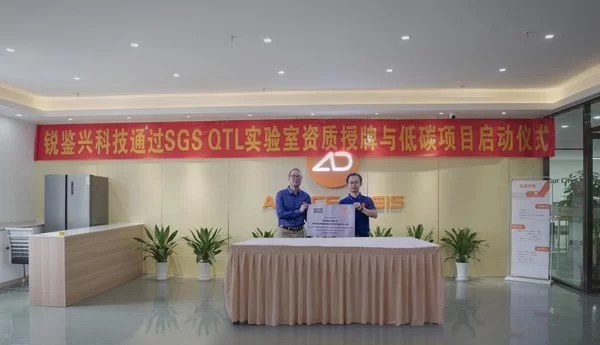
HUIZHOU, China, May 28, 2022 /PRNewswire/ — On May 27th, A DECE OASIS(ADO) ebike laboratory passed the internationally recognized organization SGS qualification as “QTL laboratory” certification! This is undoubtedly a breakthrough achievement and this is a new chapter for ADO right after the 1st anniversary ceremony.


The laboratory is about 3,300 square meters located in south of Huizhou, with a total investment of 15 million RMB .The ADO Laboratory is committed to research new technology for building a better electric bike, also incubating leading innovative products. However, SGS advanced testing technology would definitely benefit on upgrades the quality of products, enhance the product research ability, and technological innovation ability in the electric bike industry as well .

This certification is a recognized benchmark for quality and integrity. It provides comprehensive testing in accordance with EU, Canadian and other standards and issues widely recognized authoritative testing reports. It is the only leading brand designated by many notaries.

ADO’s DECE series products have passed SGS CE certification. However, the ADO laboratory has already met the SGS facility requirements and has many advanced testing instruments that can handle testing items such as comprehensive support for new product testing, component testing, electrical system safety assessment, and mechanical fatigue testing. It will cover functional testing of product, mechanical, material, strength properties, etc.

As of today, ADO has more than 16 patents and 6 software copyrights, and developed the ADO G-Drive dual-mode control system, forming a differentiated competitive advantage in product performance. Now, with the support of SGS, CE certification and QTL laboratory certific ation, it means that ADO has an international leading edge in product quality and specifications.

“We hope that ADO will become the best choice of pedelec for daily short trips to everyone”, to provide the best to their daily commute, to provide consumers with safe and reliable commuting experience; our users will get more happiness of life, to achieve more possibilities of life. This is the belief of ADO founder Mr. Sen.

ADO always puts users first, insists on product quality and service, and is committed to building an ebike community with full of love and growth. With the strategic goal of building a global brand of technological innovation in the pedelec vertical industry, the dream has come true and become a global trustworthy brand from China as “Crescent Moon Spring”.

www.adoebike.com

Facebook: https://www.facebook.com/Adoebike

CONTACT: Amy Wang, marketing@adoebike.com

Fanttik Anniversary Sale Offer Discounts with Unparalleled Giveaways

HOUSTON, May 28, 2022 /PRNewswire/ — Fanttik, the young and fast-growing automotive accessories brand kicks off its 2nd Anniversary Sale Event on Amazon and Fanttik.com today (May 27, 2022). The extravaganza will run for one month sale till June 27, 2022. During the sale, Fanttik is offering the biggest ever discounts on tire inflators, jump starters, power stations, and more. Owing to immense consumer appreciation and a myriad of international awards, Fanttik is giving back to the community during the sale by also organizing an unprecedented giveaway where the winners will win DJI and iPhone 13 by lucky draw every week.

FANTTIK DAY DEALS 5/27-6/27

Fanttik Anniversary Sale: Massive 50% discount on inflators and jump starters

From Friday, May 27 to Monday, June 27, those who shop on Fanttik Website and Amazon get up to 50% off their favorite Fanttik products. In addition to the attractive discounts, once they sign up, they will have the chance to win attractive prizes! There will be four rounds of giveaways in this one-month campaign. The most popular Fanttik products and respective discounts are as follows:

  • Fanttik X8 Apex, available at $79.97 with 38% discount (originally $129.97): Fanttik’s flagship inflator, the X8 Apex has a maximum pressure of 150psi to satisfy a wide variety of inflation needs, from tires on cars, motorcycles, bicycles and more to recreational inflatables such as sports balls. Utilizing advanced technology and a powerful motor, X8 Apex boasts 50% faster inflation speeds when compared to other inflators with accuracy within ±1psi. The inflator takes five minutes to fill a single car tire with zero air pressure and has enough power to inflate six 185/65 R15 tires from 0 to 2.4bar when fully charged. X8 Apex also comes equipped with five preset modes for easy inflation: car, motorcycle, bicycle, ball, and custom, allowing you to get fast and safe inflation for the inflatables at all times. It also won the Red Dot Design Award and the highly coveted IF Design Award. It is also widely endorsed by Tesla owners on social media.
     
  • Fanttik X8, available at $59.97 with 40% discount (originally $99.97): Fanttik’s best-seller, the X8 provides powerful inflation and many of the same features as the premium X8 Apex but at a modest price point. Featuring a high-performance chip and 150psi high-pressure capacity, this powerful air compressor inflates fast. When fully charged, it can continuously inflate 7 motorcycle tires (110/70 R17) from 0-35psi, taking 2.5 minutes to fully inflate a motorcycle tire. The most exciting feature of the X8 is its attractive appearance. The form is pleasingly rounded and pebble-like, so it fits nicely in the palm of one’s hand so it’s convenient to be packed in a backpack as an adventurous companion. It has also been widely endorsed by motorbike enthusiasts on social media.
     
  • Fanttik T8 Apex, available at $84.97 with 50% discount (originally $169.97): Fanttik T8 Apex comes with a wide range of high-performance, high stability, and easy-to-use features, with a unique muscle car look that stands out from others in the family of products. With a dual-way type-C 65W high-speed output and a one-way USB-A 18W port, users can enjoy a 6X faster charge for recharging laptops, phones, and other devices. In addition, the T8 Apex can provide a 2,000A peak current allowing jump-starting up to 8.5L Gas / 6.0L Diesel vehicles when fully charged. It can achieve 50 times jump-start with its 4-cell 20,000mAh battery. T8 Apex has a forced start function for dead cars, safe and spark-free operation. T8 Apex is the best tool to jump-start a dead car battery on the side of the road. Reviewers have called it “a lifesaver” numerous times.
     
  • Fanttik EVO 300 Power Station, available at $229.97 with 22% discount (originally $359.97): Fanttik EVO 300 is a must-have backup for camping parties or road trips that demand numerous power connections and a reliable and long battery life. Weighing only 8.8lbs, the portable EVO300 stands out among many other portable power stations on the market for its massive 299Wh battery capacity, stable output with 9 DC/AC ports, large LCD interactive display, a solar panel for fast and green recharging, as well as a design with 12 safety features. In addition to the multiple protective features, EVO’s large LED lighting, SOS first-aid mode, and IP65 waterproof rating, contribute to its adaptability for diverse outdoor activities.

Purchase links:
https://fanttik.com/pages/fanttikday
https://www.amazon.com/stores/FANTTIK/page/35DA621D-2547-47DE-AC21-55DD1E4040AE?ref_=ast_bln

Going forward, Fanttik not only looks to keep delivering as a trailblazer in the industry but also bring state-of-the-art innovative products to the reach of customers from all walks of life with their modest pricing. They are determined to push the envelope of their slogan of “We explore, we innovate, and we make it happen” to even higher magnitudes in the coming years.

FANTTIK X8 APEX TIRE INFLATOR

About Fanttik

Fanttik is a youthful dynamic brand, dedicated to outdoor and automotive products, that caters to every need for the perfect road trip. They believe that traveling is much more than simply going from point A to B, and their goal is to make every inch of every trip as enjoyable and as fulfilling as possible. They promote fun, safe, and fulfilling trips instead of vanilla commutes, be they day-to-day travels or outdoor adventures. They implement their products under the motto – “We explore, we innovate, and we make it happen.” They have earned the internationally revered Red Dot Design Award multiple times along with the prestigious IF Design Award. Their products have been reviewed by a myriad of esteemed YouTubers, such as Donut MediaSamcrac, and Silver Cymbal, to name a few. To learn more about Fanttik, please visit www.fanttik.com.

For more information, please visit: www.fanttik.com

Cision View original content to download multimedia:https://www.prnewswire.com/news-releases/fanttik-anniversary-sale-offer-discounts-with-unparalleled-giveaways-301555512.html

AUTOCRYPT closes Series B with $25.5 million to expand V2X and in-vehicle systems security for intelligent transport

SEOUL, South Korea, May 26, 2022 /PRNewswire/ — AUTOCRYPT, a leading secure mobility and V2X communications company, has raised a $25.5 million Series B round, with post-money valuation of $120 million. Leading backers included Korea Asset Investment Securities, Ulmus Investment, BSK Investment, Shinhan Venture Investments, JB Asset Management, STIC Ventures, Pathfinder H, and Hyundai Venture Investment. 

In 2020, the company closed its Series A round with $15 million and began its Series B round in late 2021 with the goal to expand its V2X offerings globally. Establishing subsidiaries in Toronto, Canada and Munich, Germany, AUTOCRYPT is quickly growing its foothold in Europe and North America, with plans to open its Singapore office later this year.  

CEO and co-Founder Daniel ES Kim said in a statement regarding the funding round, “We’re proud of AUTOCRYPT’s progressive growth, and believe the investments are a reflection of the tremendous amounts of effort we have put into cultivating relationships in this rapidly changing industry of connected mobility.”  

Kim continued regarding AUTOCRYPT’s plans for the next year, remarking, “We believe secure V2X will be the key to wider adoption of autonomous driving – this means implementing secure V2X connectivity in not just vehicles, but roads, infrastructure, but also pedestrian devices.” Kim refers to AutoCrypt SCMS, a tri-standard compliant PKI for message verification across all types of end-entities in the V2X environment. 

AUTOCRYPT is currently in talks with several public agencies across the globe to implement its V2X security and SCMS for C-ITS projects. AUTOCRYPT already manages security and PKI for all C-ITS projects on the Korean peninsula. 

Besides its advancements in V2X security, AUTOCRYPT has also added Security Analyzer™ and Security Fuzzer™ to its in-vehicle systems security solution. Security Analyzer is an SBOM-based software vulnerability analysis platform, protecting vehicle software throughout its entire lifecycle, while Security Fuzzer effectively detects software flaws through smart fuzzing. Both tools are essential for today’s increasingly software-oriented E/E architecture. The company also plans to showcase its newest Plug&Charge (PnC) and EV-related offerings in Oslo at the 2022 International Electric Vehicle Symposium & Exhibition (EVS35).  

About AUTOCRYPT 

AUTOCRYPT is the leading player in automotive and smart mobility technologies, paving the way for C-ITS and autonomous driving through a multi-layered, holistic approach. Through security solutions for V2X, V2G (including PnC security), in-vehicle systems, and fleet management, AUTOCRYPT ensures that security is prioritized before vehicles hit the road. For more information, contact global@autocrypt.io.

QIMA Joins the United Nations Global Compact Initiative


HONG KONG, May 16, 2022 /PRNewswire/ — QIMA, a leading provider of quality control and supply chain compliance solutions is pleased to announce their participation in the United Nations Global Compact initiative — a voluntary leadership platform for the development, implementation and disclosure of responsible business practices.

With this announcement, QIMA is proud to join thousands of other companies globally committed to taking responsible business action to create the world people want.

“At QIMA, our mission is to help our clients make products consumers can trust. A large part of that pertains to assessing the social and environmental footprint of consumer goods and food that end up on retail shelves; hence, it is only natural that we also commit to improving our own internal sustainability practices and live by the principles we help our clients enforce,” shares Sebastien Breteau, QIMA founder and CEO. “By communicating our commitment and best practices through UN Global compact’s principles, we are imposing on ourselves to be a positive contributor for a more sustainable global trade environment.”

The UN Global Compact is a call to companies everywhere to align their operations and strategies with ten universally accepted principles in the areas of human rights, labor, environment and anti-corruption, and to take action in support of UN goals and issues embodied in the Sustainable Development Goals (SDGs).

Launched in 2000, the UN Global Compact is the largest corporate sustainability initiative in the world, with more than 9,500 companies and 3,000 non-business signatories based in over 160 countries, and more than 70 Local Networks.

About QIMA
At QIMA we are on a mission to offer our clients smart solutions to make products consumers can trust. We combine on-the-ground experts for quality inspections, supplier audits, certification, and lab testing, with a digital platform that brings accuracy, visibility, and intelligence for quality and compliance data. We operate in 95 countries and help more than 17,000 global brands, retailers, manufacturers, and food growers achieve quality excellence.

Media Contact
Courtney Terrey
Director of Communications, QIMA
+852 3165 8838
press@qima.com

Cision View original content to download multimedia:https://www.prnewswire.com/news-releases/qima-joins-the-united-nations-global-compact-initiative-301546712.html

Yadea Celebrates Mother’s Day with #LegendaryMom Social Media Campaign

MUNICH, May 8, 2022 /PRNewswire/ — On Mother’s Day, Yadea, a leading electric two-wheeler brand, is celebrating moms around the world with the launch of its #LegendaryMom social media campaign, incorporating a new Mother’s Day video and a poster. At the center of Yadea’s Mother’s Day campaign is an energetic rap that embodies the brand’s youthful spirit and pays homage to the diverse identities of the modern mom.

“Mothers are not defined solely by the fact that they have children. Mothers have multiple identities in life: they can be family contributors, stylish women and eco-living advocates. As a brand, Yadea has always recognized and supported the plethora of roles that modern mothers occupy in our lives. This film pays tribute to the idea that all mothers around the world are absolutely and unquestionably legendary,” said Aska Zeng, General Manager at Yadea.

A celebration of the modern mom, Yadea’s #LegendaryMom campaign asks audiences to reflect on the diverse roles their mom played, and continue to play, in their lives, from educator to businesswoman and advocate for sustainable living. As their first teacher, mothers are the ones who help kids navigate every aspect of the world, from changing their diapers to helping them study for the big high school exam and enabling them to thrive professionally as they head off to work. They shape children into their best selves – as the rap says: “All your good qualities, they’re hereditary.” Finally, as a “true boss” lady and “real go-getter,” Yadea acknowledges that modern moms are eco-warriors that take action and use sustainable means of transportation to ensure the next generation become leaders in protecting the earth.

Yadea’s #LegendaryMom video launched across the brand’s social media platforms on May 8, 2022, alongside a dedicated Mother’s Day post, which celebrates the diverse roles mothers play, and invites its audience to share pictures to celebrate their own #LegendaryMom on social media.

As a reflection of Yadea’s continued efforts to empower mothers around the globe, the #LegendaryMom campaign forms part of the brand’s larger commitment to support moms as they raise their little ones. Yadea helps mothers guide their children to understand and protect the most important mother of all – Mother Earth – and makes life easier for parents with innovative products, such as its unique kids series. At the same time, Yadea consistently incorporates outstanding award-winning design into its products, including the 2020 Red Dot Design Award winner C1S. This combination of form and function enables children to appreciate and pursue beauty, while assisting mothers to look stylish in their busy daily lives.

As a champion of women everywhere, Yadea steadfastly recognizes and supports the diverse roles that moms play in the modern world. Looking ahead, the company will continue to create green, eco-friendly products that support #LegendaryMoms and accompany children to “Electrify Your Life” as they grow.

About Yadea
Yadea is a global leader in developing and manufacturing electric two-wheel vehicles including electric motorcycles, electric mopeds, electric bicycles and electric kick scooters. To date, Yadea has sold products to 60 million users in over 80 countries, and has a network of 40,000+ retailers worldwide. With a mission to help people “Electrify Your Life”, Yadea continues to invest in R&D, production and global expansion to build a shared and sustainable future for humankind.

For more information, visit our:
Official Website: https://www.yadea.com/
Facebook: https://www.facebook.com/Yadea.Official
Instagram: https://www.instagram.com/YADEA.GLOBAL/
Twitter: https://twitter.com/YadeaGlobal

Cision View original content to download multimedia:https://www.prnewswire.com/news-releases/yadea-celebrates-mothers-day-with-legendarymom-social-media-campaign-301542193.html

LinkieBuy has formally launched its plan to introduce 100 Japanese retail merchants to the Chinese market

HANGZHOU, China, April 26, 2022 /PRNewswire/ — LinkieBuy, a comprehensive cross-border e-commerce service provider in China, recently conducted an internal conference and declared publicly its intention to recruit 100 Japanese retail merchants to China market. The strategy focuses on the cross-border digital business of Japanese offline retailers, travel retail stores, duty-free stores, and other related industry merchants. The business includes cross-border mini program malls within the WeChat ecology, online marketing for e-commerce operations, cross-border warehousing and logistics, private domain core user repurchase, and other related cross-border businesses to China.

Chinese customers’ thirst for Japanese items has increased as a result of the pandemic, particularly during the Beijing Winter Olympics. The quick shift in consumption channel direction has resulted in a rise in cross-border internet channel penetration from China to Japan. The extension of the idea of imported DTC consumption to China has led to the rapid creation of the cross-border independent online store model, which is more favorable than traditional cross-border platforms, in the current wave of cross-border e-commerce tidal. Among them, the independent online store type cross-border e-commerce represented by the WeChat mini program mall within the ecology of WeChat, China’s largest social media APP, is gaining popularity with Japanese businesses.

“This year, we will increase our efforts to expand cooperation with Japanese offline retail merchants, ensure merchants’ sales in China through online mall building support, WeChat clients traffic support, B2B distribution channel support, and assist more Japanese offline retailers to realize digital transformation in China market,” said Simon Qi, general director of LinkieBuy and vice president of Xingyun Group.

Numerous Japanese companies have done business with China since the RCEP was implemented, resulting in increasing rivalry for product sales in China. LinkieBuy is a leading Chinese consumer goods digital supply chain service platform focused on assisting Japanese offline retail merchants in selling directly to Chinese consumers via the WeChat ecosystem. We aim to create more sales value for customers through years of accumulated digital cross-border operation capabilities.

It is reported that LinkieBuy has already partnered with more than 100 well-known Japanese retailers, including Seibu and Sogo Stores, KOMEHYO, Daimaru Matsuzakaya Department Stores, and Tsuruha. It offers Japanese offline shops in China cross-border digital transformation services such as WeChat mini program mall building, cross-border warehousing, logistics solutions, and online mall administration. It helps a variety of merchants access the Chinese market swiftly and we possess rich experience in how Japanese offline retailers doing e-commerce business in China.

Simon explained, “After the official launch of this Japanese 100 retail merchants to China introduction program. We will hold regular monthly online seminars for the Japanese market to explain the export policy to China, sales method of online business into China, cross-border mini program mall operation strategy, WeChat marketing skills, and other knowledge. Retailers who are interested in it can contact us via our official website or email.”

CONTACT: Hongting Chen, +86-19357597595, chen.hongting@xyb2b.com