Tag Archives: TLS

Globe Telecom sees pervasive 4G/LTE mobile data in PH by 2021

MANILA, Philippines, Nov. 20, 2020 — Aligning with the national plan to boost digital inclusivity and fulfill its commitment to serve its customers, Globe Telecom has been focusing on improving its network infrastructure by expanding its reach through new site builds and network upgrades all over the country.

As part of the national plan in shaping a new normal for the Philippines, the country is ramping up the shift into a new, digital economy. Technological enhancements to further boost the digital economy can help facilitate continuity of businesses and enhance productivity, especially as the country aims to thrive in the new normal. At a time when the majority of the population’s interactions are online, better connectivity is a necessity. Following the effects of COVID-19, people were forced to stay home and transition to business, academic, and leisure engagements via digital technology, and catapulted digital adoption for almost all industries.

By the third week of March 2020, independent analyst firm Opensignal, observed a large week on week increase in the time smartphone users spent connected to a Wifi network.[1] Users in the Philippines spend 63.3% of their time on Wifi. They reported that this was the largest increase that they have observed across all Asian countries under the study.

The mobile landscape in the Philippines comprises 173.2 million users[2] that have been known to use 2G and 3G pervasively. Perhaps not anymore, going by the latest report from independent analytics firm Opensignal which indicates 4G availability has risen to more than 80% as of November 2020[3].

The latest data supports Globe’s recent campaign to move its customers from 3G to 4G/LTE thus improving overall data experience. Globe believes 4G/LTE may yet become the new standard for mobile internet in the country, emphasizing that customers deserve higher speed and better connectivity.

"Internet services have become a critical need for many Filipinos. With the evolution of mobile technologies, it is high time for our country to have 4G/LTE everywhere as the basic mobile internet technology used by everyone. And for the most demanding mobile uses, 5G is here and now, too. Both 4G and 5G were designed for the internet, with 5G designed specifically for new uses such as video streaming, mobile gaming, and even IoT. That is why we call on all customers who still use 3G for mobile data to make the 4G/5G change — SIMs and handsets — and see the difference," adds Gil Genio, Globe’s Chief Technology and Information Officer.

As the PH government called on the telco sector to improve internet services, Globe committed to improve customer data experience by aggressively building new sites, upgrading existing sites to 4G/LTE using many different frequencies, and fast-tracking the fiberization of Filipino homes nationwide.

The builds, upgrades and optimization efforts are currently underway and will continue until the end of 2021. The company committed to spend one billion dollars for its network this year.

Globe supports the United Nations Sustainable Development Goal No. 9 which highlights the roles of infrastructure and innovation as crucial drivers of economic growth and development. Globe is committed to upholding the 10 United Nations Global Compact principles and 10 UN SDGs.

For more information, visit www.globe.com.ph.

[1] Analysis in Opensignal insight "Analyzing Mobile Experience during the coronavirus pandemic: Time on Wifi", published in March 2020 © 2020 Opensignal Limited

[2] Digital 2020: The Philippines report – January 2020: We Are Social 

[3] Opensignal Awards — Philippines: Mobile Network Experience Report November 2020, based on independent analysis of mobile measurements recorded during the period July 1 – September 28, 2020 © 2020 Opensignal Limited

About Globe Telecom

Globe Telecom, Inc. is a leading full-service telecommunications company in the Philippines and publicly listed in the Philippine Stock Exchange with the stock symbol GLO. The company serves the telecommunications and technology needs of consumers and businesses across an entire suite of products and services including mobile, fixed, broadband, data connectivity, internet and managed services. It has major interests in financial technology, digital marketing solutions, venture capital funding for startups, and virtual healthcare. In 2019, Globe became a signatory to the United Nations Global Compact, committing to implement universal sustainability principles. Its principals are Ayala Corporation and Singtel, acknowledged industry leaders in the country and in the region. For more information, visit www.globe.com.ph. Follow @enjoyglobe on Facebook, Twitter, Instagram and YouTube.

Related Links :

http://www.globe.com.ph

Black Friday & Cyber Monday Deal: Four Months Of TIDAL For Only $0.99 (Premium) And $1.99 (HiFi)

New Customers Can Take Advantage of Limited-Time Offer From November 24-December 2

NEW YORK, Nov. 19, 2020 — Today, global music streaming and entertainment platform, TIDAL, announced a Black Friday and Cyber Monday limited-time offer. From November 24 through December 2, 2020, new customers can receive four months of TIDAL at $0.99 for Premium or $1.99 for a HiFi membership (a value of $39.96 (Premium) and $79.96 (HiFi) for four months.) To take advantage of the offer this holiday season, new members can head to TIDAL.com/blackfriday.

TIDAL’s Premium and HiFi tiers offer music fans unlimited access to its extensive catalog of over 70 million tracks across all genres, thousands of expertly curated playlists by TIDAL’s seasoned editorial team, and endless artist radio stations. HiFi members have the added benefit of listening to the best quality of sound available, including TIDAL Masters and immersive sound experiences from Dolby Atmos Music and Sony 360 Reality Audio. Recently announced improvements including the expansion of TIDAL’s Masters catalog and TIDAL Connect, give HiFi members even more ways to enjoy the platform’s unparalleled lossless audio quality.

TIDAL brings its members closer to their favorite artists through virtual album experiences. Both Premium and HiFi members can sit back, relax and enjoy elevated listening with album commentary from artists like Alicia Keys and U2, animated artwork and performances with more interaction and dimension. Whether on the go or on the couch, members can tap into TIDAL’s full array of features across platforms and devices like: Plex, Roku, Amazon Alexa, Apple TV/Android TV, Apple CarPlay, Samsung Wearables and direct control with Sonos (Complete list here).

Following the four-month limited holiday membership, members can continue their subscription at $9.99/month for Premium and $19.99/month for HiFi – discounts are available for students (-50%), military (-40%), first responders (-40%) and families (6 accounts for $14.99 (Premium) or $29.99 (HiFi)). 

Additionally, Best Buy customers can purchase 12 months of TIDAL HiFi Standard or Family for the price of 6 months through the end of December 2020 both in-store and online.

About TIDAL

TIDAL is an artist-owned global music and entertainment platform that brings artists and fans closer together through unique original content and exclusive events. Available in 56 countries, the streaming service has more than 70 million songs and 250,000 high quality videos in its catalog along with original video series, podcasts, thousands of expertly curated playlists and artist discovery via TIDAL Rising. With the commitment of its owners to create a more sustainable model for the music industry, TIDAL is available in Premium and HiFi tiers—recordings which includes Master Quality Authenticated (MQA), Sony’s 360 Reality Audio recordings, and Dolby Atmos Music.


Related Links :

https://tidal.com/

Phoenix New Media Reports Third Quarter 2020 Unaudited Financial Results

Live Conference Call to be Held at 8:00 PM U.S. Eastern Time on November 17, 2020

BEIJING, Nov. 18, 2020 — Phoenix New Media Limited (NYSE: FENG) ("Phoenix New Media", "ifeng" or the "Company"), a leading new media company in China, today announced its unaudited financial results for the third quarter ended September 30, 2020.

Mr. Shuang Liu, CEO of Phoenix New Media, commented, "We remained steadfast in our commitment to providing a superior user experience, fortifying our content leadership, and augmenting our monetization capabilities in the third quarter of 2020. To further improve iFeng’s user engagement and user retention levels, we refined the platform’s content recommendation engine while also enhancing its user experience in turn. At the same time, we maintained our focus on boosting our leadership in those content verticals which we believe to have long-term strategic value. On the innovation front, we maintained focus on the cultivation of our existing business initiatives while also carefully exploring a number of other potential business opportunities. Looking ahead, we are convinced that our professional technical expertise, content leadership, and brand influence will continue to place us at the tip of the new media spear, allowing us to capture those segments of the market with promising growth potential as the world rebounds from the COVID-19 pandemic."

Mr. Edward Lu, CFO of Phoenix New Media, further stated, "In the face of macroeconomic uncertainties, the COVID-19 pandemic, and escalating geopolitical tensions, we maintained our laser-sharp focus on the refinement of our cost structures during the third quarter of 2020. In light of the current situation, we expect the new media industry in China to continue facing pressure throughout the remainder of the year. Nevertheless, despite these short-term setbacks, we believe that our steady progress on multiple fronts will provide us with additional opportunities to augment our business fundamentals, enhance our growth quality, and ultimately generate long-term return to our shareholders."

Third quarter 2020 Financial Results

As disclosed in the second quarter 2020 unaudited financial results announcement made on August 17, 2020, the Company sold all of its investment in Beijing Yitian Xindong Network Technology Co., Ltd. ("Yitian Xindong" or "Tadu") in the second quarter of 2020 and the disposal of Tadu was qualified for reporting as a "discontinued operation" in the Company’s financial statements. Accordingly, Tadu’s results of operations have been excluded from the Company’s results from continuing operations in the condensed consolidated statements of comprehensive income/(loss) and are presented in separate line items as discontinued operations for all prior periods. The related assets and liabilities associated with the discontinued operations in the prior year consolidated balance sheets were classified as assets/liabilities held for sale to provide the comparable financial information, and the financial information and non-GAAP financial information disclosed in this press release is presented on a continuing operations basis, unless otherwise specifically stated.

REVENUES

Total revenues in the third quarter of 2020 decreased by 10.9% to RMB303.0 million (US$44.6 million) from RMB339.9 million in the same period of 2019, which was primarily due to the negative impact of the COVID-19 outbreak and heightened industry competitions.

Net advertising revenues in the third quarter of 2020 decreased by 10.2% to RMB281.3 million (US$41.4 million) from RMB313.1 million in the same period of 2019. The decrease was primarily attributable to the negative impact of the COVID-19 outbreak and heightened industry competitions.

Paid services revenues[1] in the third quarter of 2020 decreased by 19.0% to RMB21.7 million (US$3.2 million) from RMB26.8 million in the same period of 2019. Revenues from paid contents in the third quarter of 2020 decreased by 34.3% to RMB8.9 million (US$1.3 million) from RMB13.5 million in the same period of 2019, which was mainly due to the tightening of rules and regulations on digital reading in China and in line with the broader market conditions. Revenues from MVAS and games were small and had been declining for the past years. Revenues from others in the third quarter of 2020 were RMB9.4 million (US$1.4 million), which remained almost unchanged from the same period of 2019. 

[1] Paid services revenues comprise of (i) revenues from paid contents excluding those from Tadu, which includes digital reading, audio books, paid videos, and other content-related sales activities, (ii) revenues from games, which includes web-based games and mobile games, (iii) revenues from MVAS, and (iv) revenues from others.

COST OF REVENUES

Cost of revenues in the third quarter of 2020 decreased by 12.3% to RMB150.0 million (US$22.1 million) from RMB171.1 million in the same period of 2019. The decrease in cost of revenues was mainly due to the following:

  • Content and operational costs in the third quarter of 2020 decreased by 13.4% to RMB129.7 million (US$19.1 million) from RMB149.9 million in the same period of 2019, mainly due to the Company’s strict cost control measures taken to enhance its operating efficiency in 2020. Share-based compensation included in the content and operational costs in the third quarter of 2020 decreased to RMB0.4 million (US$0.1 million) from RMB1.5 million in the same period of 2019.
  • Revenue sharing fees to telecom operators and channel partners in the third quarter of 2020 decreased by 17.7% to RMB6.0 million (US$0.9 million) from RMB7.3 million in the same period of 2019, primarily attributable to the decrease in revenue sharing fees paid to content providers.

The decrease was partially offset by the following:

  • Bandwidth costs in the third quarter of 2020 increased slightly to RMB14.3 million (US$2.1 million) from RMB13.9 million in the same period of 2019.

GROSS PROFIT

Gross profit in the third quarter of 2020 decreased by 9.4% to RMB153.0 million (US$22.5 million) from RMB168.8 million in the same period of 2019. Gross margin in the third quarter of 2020 increased to 50.5% from 49.7% in the same period of 2019, primarily attributable to the Company’s strict cost control measures taken to enhance its operating efficiency in 2020, as explained above.

To supplement the financial measures presented in accordance with the United States Generally Accepted Accounting Principles ("GAAP"), the Company has presented certain non-GAAP financial measures in this press release, which excluded the impact of certain reconciling items as stated in the "Use of Non-GAAP Financial Measures" section below. The related reconciliations to GAAP financial measures are presented in the accompanying "Reconciliations of Non-GAAP Results of Operation Measures to the Nearest Comparable GAAP Measures."

Non-GAAP gross margin in the third quarter of 2020, which excluded share-based compensation, increased to 50.6% from 50.1% in the same period of 2019.

OPERATING EXPENSES AND INCOME OR LOSS FROM OPERATIONS

Total operating expenses in the third quarter of 2020 decreased by 20.8% to RMB181.4 million (US$26.7 million) from RMB229.0 million in the same period of 2019, primarily attributable to the decreases in both the Company’s traffic acquisition expenses and the personnel-related expenses as a result of the strict cost control measures taken by the Company to enhance its operating efficiency in 2020, which was partially offset by the increase in bad debt expenses caused by the slower collection of receivables as a result of the COVID-19 outbreak. Share-based compensation included in operating expenses in the third quarter of 2020 was RMB1.3 million (US$0.2 million), compared to RMB1.9 million in the same period of 2019.

Loss from operations in the third quarter of 2020 was RMB28.4 million (US$4.2 million), compared to loss from operations of RMB60.2 million in the same period of 2019. Operating margin in the third quarter of 2020 was negative 9.4%, compared to negative 17.7% in the same period of 2019.

Non-GAAP loss from operations in the third quarter of 2020, which excluded share-based compensation, was RMB26.7 million (US$3.9 million), compared to non-GAAP loss from operations of RMB56.8 million in the same period of 2019. Non-GAAP operating margin in the third quarter of 2020, which excluded share-based compensation, was negative 8.8%, compared to negative 16.7% in the same period of 2019.

OTHER INCOME OR LOSS

Other income or loss reflects net interest income, foreign currency exchange gain or loss, income or loss from equity method investments, net of impairment, impairment of available-for-sale debt investments, changes in fair value of loan related to co-sale of Particle shares, and others, net[2]. Total net other income in the third quarter of 2020 was RMB30.9 million (US$4.6 million), compared to total net other income of RMB19.2 million in the same period of 2019. The increase in total net other income was mainly due to the following:

  • Net interest income in the third quarter of 2020 increased to RMB14.8 million (US$2.2 million) from RMB7.7 million in the same period of 2019, mainly caused by more investments in term deposits and short term investments in the third quarter of 2020, as the Company received the remaining payment of approximately US$99.3 million from Run Liang Tai on August 10, 2020, as mentioned in the section headed "CERTAIN BALANCE SHEET ITEMS" below.
  • Foreign currency exchange gain in the third quarter of 2020 was RMB3.2 million (US$0.5 million), compared to RMB6.1 million in the same period of 2019.
  • Income from equity method investments, net of impairment in the third quarter of 2020 was RMB6.0 million (US$0.9 million), which reflected the gain from disposal of the equity investment in certain investee incurred in the third quarter of 2020.
  • Impairment of available-for-sale debt investment in the third quarter of 2020 was RMB2.0 million (US$0.3 million), which reflected the amount of the impairment related to credit losses on the available-for-sale debt investment in certain investee incurred in the third quarter of 2020.
  • Changes in fair value of loan related to co-sale of Particle shares in the third quarter of 2020 were a loss of RMB4.5 million (US$0.7 million), mainly caused by the decline in the fair value of an interest-free loan with the principal of approximately US$9.7 million granted by the Company to Run Liang Tai. Run Liang Tai pledged 4,584,209 series D1 preferred shares of Particle to the Company to secure the repayment of the loan and transferred the pledged shares back to the Company in satisfaction of its obligation to repay the US$9.7 million loan in August 2020. In view of the nature of the loan which was collateralized by the above mentioned pledged shares, the Company elected to account for the loan under the fair value option.
  • Others, net, in the third quarter of 2020 increased to RMB13.4 million (US$2.0 million), from RMB5.4 million in the same period of 2019, mainly caused by more government subsidies received in the third quarter of 2020.

[2] "Others, net" primarily consists of government subsidies and litigation loss provisions.

NET INCOME OR LOSS FROM CONTINUING OPERATIONS ATTRIBUTABLE TO PHOENIX NEW MEDIA LIMITED

Net loss from continuing operations attributable to Phoenix New Media Limited in the third quarter of 2020 was RMB0.9 million (US$0.1 million), compared to net loss from continuing operations attributable to Phoenix New Media Limited of RMB50.9 million in the same period of 2019. Net margin from continuing operations in the third quarter of 2020 was negative 0.3%, compared to negative 15.0% in the same period of 2019. Net loss from continuing operations per diluted ADS[3] in the third quarter of 2020 was RMB0.01 (US$0.00), compared to net loss from continuing operations per diluted ADS of RMB0.70 in the same period of 2019.

Non-GAAP net income from continuing operations attributable to Phoenix New Media Limited, which excluded share-based compensation, income or loss from equity method investments, net of impairment, impairment of available-for-sale debt investments, changes in fair value of loan related to co-sale of Particle shares and changes in fair value of forward contract in relation to future disposal of investments in Particle, was RMB1.3 million (US$0.2 million) in the third quarter of 2020, compared to non-GAAP net loss from continuing operations attributable to Phoenix New Media Limited of RMB47.5 million in the same period of 2019. Non-GAAP net margin from continuing operations in the third quarter of 2020 was positive 0.4%, compared to negative 14.0% in the same period of 2019. Non-GAAP net income from continuing operations per basic and diluted ADS in the third quarter of 2020 was RMB0.02 (US$0.00), compared to non-GAAP net loss from continuing operations per basic and diluted ADS of RMB0.65 in the same period of 2019.

In the third quarter of 2020, the Company’s weighted average number of ADSs used in the computation of diluted net income from continuing operations per basic and diluted ADS was 72,790,541. As of September 30, 2020, the Company had a total of 582,324,325 ordinary shares outstanding, or the equivalent of 72,790,541 ADSs.

[3] "ADS" means American Depositary Share of the Company. Each ADS represents eight Class A ordinary shares of the Company.

CERTAIN BALANCE SHEET ITEMS

As of September 30, 2020, the Company’s cash and cash equivalents, term deposits and short term investments and restricted cash were RMB2.37 billion (US$349.5 million).

As previously announced by the Company, the Company entered into a share purchase agreement (the "SPA") with Run Liang Tai Management Limited, or Run Liang Tai, and its designated entities (the "Proposed Buyers") on March 22, 2019 and entered into a series of agreements with Run Liang Tai and the other shareholders of Particle to resolve certain issues in connection with the sale of preferred shares in Particle Inc. ("Particle") ("Previous Agreements"). The Company completed delivery of the first batch of preferred shares of Particle to the Proposed Buyers in the fourth quarter of 2019, and the Proposed Buyers were required to pay the remaining purchase price for the second batch of Particle shares to the Company on or before August 10, 2020. In August 2020, the Company announced that it had signed a new share purchase agreement (the "New SPA") with Run Liang Tai, which replaced the Company’s Previous Agreements with Run Liang Tai. Under the New SPA, the rights and obligations of both the Proposed Buyers and the Company with respect to the second batch of shares under the Previous Agreements were terminated, and instead, the Company agreed to sell a total of 140,248,775 shares of Particle to the Proposed Buyers at a total purchase price of US$150 million and a per share purchase price of US$1.0695 (the "Transaction"). On August 10, 2020, the Proposed Buyers paid approximately US$99.3 million (the "Remaining Payment") to the Company under the New SPA, which represents the difference between the total purchase price and the US$50 million deposit already paid by the Proposed Buyers to the Company under the Previous Agreements plus certain other accrued interests. As of today, the closing conditions for the New SPA have been satisfied. The shareholders of the Company’s parent company, Phoenix Media Investment (Holdings) Limited ("Phoenix TV"), approved the New SPA on October 14, 2020. The Transaction was closed on October 19, 2020.  

The fair value of the Company’s available-for-sale debt investments in Particle was increased from RMB1,057.8 million as of June 30, 2020 to RMB1,061.3 million (US$156.3 million) as of September 30, 2020. The available-for-sale debt investments as of September 30, 2020 included both the 140,248,775 shares of Particle to be delivered on October 19, 2020 and the 4,584,209 series D1 preferred shares of Particle transferred to the Company by Run Liang Tai in August 2020, which were previously pledged to the Company to secure the repayment of an interest-free loan with the principal of approximately US$9.7 million granted by the Company to Run Liang Tai. All the changes in fair value of available-for-sale debt investments in Particle recorded in the accumulated other comprehensive income or loss in shareholders’ equity related to the 140,248,775 shares of Particle delivered on October 19, 2020 are expected to be reclassified into gain on disposal of available-for-sale debt investments in the Company’s consolidated statements of comprehensive income/(loss) in the fourth quarter of 2020. The fair value of the investments in Particle as of September 30, 2020 was determined based on a valuation technique under the market approach, known as the guideline company method, as well as using observable transactions of Particle’s shares, as the selling price of the Transaction.

Business Outlook

For the fourth quarter of 2020, the Company expects its total revenues to be between RMB332.4 million and RMB362.4 million; net advertising revenues are expected to be between RMB309.6 million and RMB334.6 million; and paid services revenues are expected to be between RMB22.8 million and RMB27.8 million.

All of the above forecasts reflect the current and preliminary views of Company management, which are subject to change and substantial uncertainty, particularly in view of the potential impact of the COVID-19 outbreak, the effects of which are difficult to analyse and predict.

Conference Call Information

The Company will hold a conference call at 8:00 p.m. U.S. Eastern Time on November 17, 2020 (November 18, 2020 at 9:00 a.m. Beijing/Hong Kong time) to discuss its third quarter 2020 unaudited financial results and operating performance.

To participate in the call, please register in advance of the conference by navigating to http://apac.directeventreg.com/registration/event/4731548 . Upon registering, you will be provided with participant dial-in numbers, Direct Event passcode and unique registrant ID by email. Please dial in 10 minutes prior to the call, using the participant dial-in numbers, Direct Event Passcode and unique registrant ID which would be provided upon registering. You will be automatically linked to the live call after completion of this process.

A replay of the call will be available through November 25, 2020 by using the dial-in numbers and conference ID below:

International:

+61 2 8199 0299

Mainland China:

4006322162

Hong Kong:

+852 30512780

United States:

+1 646 254 3697

Conference ID:

4731548

A live and archived webcast of the conference call will also be available at the Company’s investor relations website at http://ir.ifeng.com.

Use of Non-GAAP Financial Measures

To supplement the consolidated financial statements presented in accordance with the United States Generally Accepted Accounting Principles ("GAAP"), Phoenix New Media Limited uses non-GAAP gross profit, non-GAAP gross margin, non-GAAP income or loss from operations, non-GAAP operating margin, non-GAAP net income or loss from continuing operations attributable to Phoenix New Media Limited, non-GAAP net margin from continuing operations and non-GAAP net income or loss from continuing operations per diluted ADS, each of which is a non-GAAP financial measure. Non-GAAP gross profit is gross profit excluding share-based compensation. Non-GAAP gross margin is non-GAAP gross profit divided by total revenues. Non-GAAP income or loss from operations is income or loss from operations excluding share-based compensation. Non-GAAP operating margin is non-GAAP income or loss from operations divided by total revenues. Non-GAAP net income or loss from continuing operations attributable to Phoenix New Media Limited is net income or loss from continuing operations attributable to Phoenix New Media Limited excluding share-based compensation, income or loss from equity method investments, net of impairment, impairment of available-for-sale debt investments, changes in fair value of loan related to co-sale of Particle shares, and changes in fair value of forward contract in relation to future disposal of investments in Particle. Non-GAAP net margin from continuing operations is non-GAAP net income or loss from continuing operations attributable to Phoenix New Media Limited divided by total revenues. Non-GAAP net income or loss from continuing operations per diluted ADS is non-GAAP net income or loss from continuing operations attributable to Phoenix New Media Limited divided by weighted average number of diluted ADSs. The Company believes that separate analysis and exclusion of the aforementioned non-GAAP to GAAP reconciling items add clarity to the constituent parts of its performance. The Company reviews these non-GAAP financial measures together with the related GAAP financial measures to obtain a better understanding of its operating performance. It uses these non-GAAP financial measures for planning, forecasting and measuring results against the forecast. The Company believes that using these non-GAAP financial measures to evaluate its business allows both management and investors to assess the Company’s performance against its competitors and ultimately monitor its capacity to generate returns for investors. The Company also believes that these non-GAAP financial measures are useful supplemental information for investors and analysts to assess its operating performance without the effect of items like share-based compensation, income or loss from equity method investments, net of impairment, which have been and will continue to be significant recurring items, and without the effect of impairment of available-for-sale debt investments, changes in fair value of loan related to co-sale of Particle shares and changes in fair value of forward contract in relation to future disposal of investments in Particle which have been significant and one-time items. However, the use of these non-GAAP financial measures has material limitations as an analytical tool. One of the limitations of using these non-GAAP financial measures is that they do not include all items that impact the Company’s gross profit, income or loss from operations and net income or loss from continuing operations attributable to Phoenix New Media Limited for the period. In addition, because these non-GAAP financial measures are not calculated in the same manner by all companies, they may not be comparable to other similarly titled measures used by other companies. In light of the foregoing limitations, you should not consider these non-GAAP financial measures in isolation from, or as an alternative to, the financial measures prepared in accordance with GAAP.

Exchange Rate

This announcement contains translations of certain RMB amounts into U.S. dollars ("USD") at specified rates solely for the convenience of the reader. Unless otherwise stated, all translations from RMB to USD were made at the rate of RMB6.7896 to US$1.00, the noon buying rate in effect on September 30, 2020 in the H.10 statistical release of the Federal Reserve Board. The Company makes no representation that the RMB or USD amounts referred could be converted into USD or RMB, as the case may be, at any particular rate or at all. For analytical presentation, all percentages are calculated using the numbers presented in the financial statements contained in this earnings release.

About Phoenix New Media Limited

Phoenix New Media Limited (NYSE: FENG) is a leading new media company providing premium content on an integrated Internet platform, including PC and mobile, in China. Having originated from a leading global Chinese language TV network based in Hong Kong, Phoenix TV, the Company enables consumers to access professional news and other quality information and share user-generated content on the Internet through their PCs and mobile devices. Phoenix New Media’s platform includes its PC channel, consisting of ifeng.com website, which comprises interest-based verticals and interactive services; its mobile channel, consisting of mobile news applications, mobile video application and mobile Internet website; and its operations with the telecom operators that provides mobile value-added services.

Safe Harbor Statement

This announcement contains forward−looking statements. These statements are made under the "safe harbor" provisions of the U.S. Private Securities Litigation Reform Act of 1995. These forward−looking statements can be identified by terminology such as "will," "expects," "anticipates," "future," "intends," "plans," "believes," "estimates" and similar statements. Among other things, the business outlook and quotations from management in this announcement, as well as Phoenix New Media’s strategic and operational plans, contain forward−looking statements. Phoenix New Media may also make written or oral forward−looking statements in its periodic reports to the U.S. Securities and Exchange Commission ("SEC") on Forms 20−F and 6−K, in its annual report to shareholders, in press releases and other written materials and in oral statements made by its officers, directors or employees to third parties. Statements that are not historical facts, including statements about Phoenix New Media’s beliefs and expectations, are forward−looking statements. Forward−looking statements involve inherent risks and uncertainties. A number of factors could cause actual results to differ materially from those contained in any forward−looking statement, including but not limited to the following: the Company’s goals and strategies; the Company’s future business development, financial condition and results of operations; the expected growth of online and mobile advertising, online video and mobile paid services markets in China; the Company’s reliance on online and mobile advertising and MVAS for a majority of its total revenues; the Company’s expectations regarding demand for and market acceptance of its services; the Company’s expectations regarding maintaining and strengthening its relationships with advertisers, partners and customers; the Company’s investment plans and strategies, fluctuations in the Company’s quarterly operating results; the Company’s plans to enhance its user experience, infrastructure and services offerings; the Company’s reliance on mobile operators in China to provide most of its MVAS; changes by mobile operators in China to their policies for MVAS; competition in its industry in China; relevant government policies and regulations relating to the Company; and the effects of the COVID-19 on the economy in China in general and on the Company’s business in particular. Further information regarding these and other risks is included in the Company’s filings with the SEC, including its registration statement on Form F−1, as amended, and its annual reports on Form 20−F. All information provided in this press release and in the attachments is as of the date of this press release, and Phoenix New Media does not undertake any obligation to update any forward−looking statement, except as required under applicable law.

For investor and media inquiries please contact:

Phoenix New Media Limited
Qing Liu
Email: investorrelations@ifeng.com

ICR, Inc.
Jack Wang
Tel: +1 (646) 405-4883
Email: investorrelations@ifeng.com


Phoenix New Media Limited

Unaudited Condensed Consolidated Balance Sheets

(Amounts in thousands)

December 31,

September 30,

September 30,

2019

2020

2020

RMB

RMB

US$

ASSETS

Current assets:

Cash and cash equivalents

310,876

109,386

16,111

Term deposits and short term investments

1,271,889

2,234,406

329,092

Restricted cash

66,234

29,067

4,281

Accounts receivable, net

609,627

624,676

92,005

Amounts due from related parties

56,653

41,617

6,130

Prepayment and other current assets

57,391

48,151

7,092

Assets held for sale

184,032

Total current assets

2,556,702

3,087,303

454,711

Non-current assets:

Property and equipment, net

97,357

71,115

10,474

Intangible assets, net

13,633

21,606

3,182

Goodwill

22,786

22,786

3,356

Available-for-sale debt investments

2,014,537

1,067,232

157,186

Equity investments, net

13,237

13,000

1,915

Deferred tax assets

73,688

88,955

13,102

Operating lease right-of- use assets, net

84,550

59,103

8,705

Other non-current assets

19,859

19,836

2,921

Assets held for sale

429,468

Total non-current assets

2,769,115

1,363,633

200,841

Total assets

5,325,817

4,450,936

655,552

LIABILITIES AND SHAREHOLDERS’ EQUITY

Current liabilities:

Accounts payable

249,018

198,422

29,224

Amounts due to related parties

34,155

26,535

3,908

Advances from customers

46,172

38,033

5,602

Taxes payable

287,765

295,564

43,532

Salary and welfare payable

157,784

107,595

15,847

Deposits in relation to future disposal of investment in Particle

355,212

1,021,515

150,453

Accrued expenses and other current liabilities

274,122

181,694

26,761

Operating lease liabilities

37,874

41,349

6,090

Liabilities held for sale

63,341

Total current liabilities

1,505,443

1,910,707

281,417

Non-current liabilities:

Deferred tax liabilities

192,142

93,774

13,811

Long-term liabilities

27,612

27,612

4,067

Operating lease liabilities

49,929

24,322

3,582

Liabilities held for sale

5,676

Total non-current liabilities

275,359

145,708

21,460

Total liabilities

1,780,802

2,056,415

302,877

Shareholders’ equity:

Phoenix New Media Limited shareholders’ equity:

Class A ordinary shares

17,499

17,499

2,577

Class B ordinary shares

22,053

22,053

3,248

Additional paid-in capital

1,611,484

1,616,941

238,150

Statutory reserves

88,583

88,583

13,047

Retained earnings

186,324

113,966

16,785

Accumulated other comprehensive income

1,405,808

507,045

74,680

Total Phoenix New Media Limited shareholders’ equity

3,331,751

2,366,087

348,487

Noncontrolling interests

213,264

28,434

4,188

Total shareholders’ equity

3,545,015

2,394,521

352,675

Total liabilities and shareholders’ equity

5,325,817

4,450,936

655,552


Phoenix New Media Limited

Unaudited Condensed Consolidated Statements of Comprehensive Income/(loss)

(Amounts in thousands, except for number of shares and per share (or ADS) data)

Three Months Ended

Nine Months Ended

September
30,

June 30,

September
30,

September
30,

September
30,

September
30,

September
30,

2019

2020

2020

2020

2019

2020

2020

RMB

RMB

RMB

US$

RMB

RMB

US$

Revenues:

Net advertising revenues

313,139

286,346

281,308

41,432

831,647

776,364

114,346

Paid service revenues

26,771

25,935

21,681

3,193

95,761

70,282

10,351

Total revenues

339,910

312,281

302,989

44,625

927,408

846,646

124,697

Cost of revenues

(171,076)

(124,728)

(150,036)

(22,098)

(494,511)

(380,062)

(55,977)

Gross profit

168,834

187,553

152,953

22,527

432,897

466,584

68,720

Operating expenses:

Sales and marketing expenses

(138,685)

(57,247)

(64,899)

(9,559)

(381,191)

(203,769)

(30,012)

General and administrative expenses

(36,748)

(62,161)

(74,782)

(11,014)

(138,806)

(207,215)

(30,519)

Technology and product development
expenses

(53,599)

(42,555)

(41,706)

(6,143)

(160,925)

(129,372)

(19,054)

Total operating expenses

(229,032)

(161,963)

(181,387)

(26,716)

(680,922)

(540,356)

(79,585)

(Loss)/income from operations

(60,198)

25,590

(28,434)

(4,189)

(248,025)

(73,772)

(10,865)

Other income/(loss):

Interest income, net

7,727

4,918

14,792

2,179

16,048

26,112

3,846

Foreign currency exchange gain

6,134

83

3,218

474

6,889

1,573

232

Income/(loss) from equity method
    investments, net of impairment

6,013

886

(3,447)

5,777

851

Impairment of available-for-sale debt
    investments

(2,000)

(295)

(2,000)

(295)

Changes in fair value of loan related to
   
co-sale of Particle shares

(20,049)

(4,486)

(661)

(24,535)

(3,614)

Changes in fair value of forward contract in
   
relation to future disposal of investments
   
in Particle

1,341

16,085

2,369

Others, net

5,301

8,635

13,360

1,968

11,680

27,111

3,993

(Loss)/income from continuing operations
    before income taxes

(41,036)

20,518

2,463

362

(216,855)

(23,649)

(3,483)

Income tax expense

(7,209)

(3,216)

(1,725)

(254)

(18,601)

(4,184)

(616)

Net (loss)/income from continuing operations

(48,245)

17,302

738

108

(235,456)

(27,833)

(4,099)

Net income/(loss) from discontinued
    operations, net of income taxes

50,276

(17,869)

38,882

(62,366)

(9,186)

Net income/(loss)

2,031

(567)

738

108

(196,574)

(90,199)

(13,285)

Net loss/(income) attributable to
    noncontrolling interests:

Net income from continuing operations
   
attributable to noncontrolling interests

(2,686)

(14,536)

(1,687)

(248)

(2,872)

(8,969)

(1,321)

Net loss from discontinued operations
   
attributable to noncontrolling interests

6,582

1,884

15,521

24,759

3,647

Net loss/(income) attributable to
    noncontrolling interests

3,896

(12,652)

(1,687)

(248)

12,649

15,790

2,326

Net income/(loss) attributable to Phoenix
    New Media Limited:

Net (loss)/income from continuing
    operations attributable to Phoenix New
    Media Limited

(50,931)

2,766

(949)

(140)

(238,328)

(36,802)

(5,420)

Net income/(loss) from discontinued
    operations attributable to Phoenix New
    Media Limited

56,858

(15,985)

54,403

(37,607)

(5,539)

Net income/(loss) attributable to Phoenix
    New Media Limited

5,927

(13,219)

(949)

(140)

(183,925)

(74,409)

(10,959)

Net income/(loss)

2,031

(567)

738

108

(196,574)

(90,199)

(13,285)

Other comprehensive income/(loss), net of
    tax: fair value remeasurement for
    available-for-sale investments

734,931

(886,110)

1,598

235

997,251

(884,512)

(130,275)

Other comprehensive income/(loss), net of
    tax: foreign currency translation
    adjustment

51,044

(1,602)

(43,077)

(6,345)

68,795

(14,251)

(2,099)

Comprehensive income/(loss)

788,006

(888,279)

(40,741)

(6,002)

869,472

(988,962)

(145,659)

Comprehensive loss/(income) attributable to
   
noncontrolling interests

3,896

(12,652)

(1,687)

(248)

12,649

15,790

2,326

Comprehensive income/(loss) attributable to

  Phoenix New Media Limited

791,902

(900,931)

(42,428)

(6,250)

882,121

(973,172)

(143,333)

Basic net income/(loss) per Class A and Class
    B ordinary share:

 -Continuing operations

(0.09)

0.00

0.00

0.00

(0.41)

(0.06)

(0.01)

 -Discontinued operations

0.10

(0.02)

0.00

0.00

0.09

(0.07)

(0.01)

Basic net income/(loss) per Class A and 
  
Class B ordinary share

0.01

(0.02)

0.00

0.00

(0.32)

(0.13)

(0.02)

Diluted net income/(loss) per Class A

  and Class B ordinary share:

 -Continuing operations

(0.09)

0.00

0.00

0.00

(0.41)

(0.06)

(0.01)

 -Discontinued operations

0.10

(0.02)

0.00

0.00

0.09

(0.07)

(0.01)

Diluted net income/(loss) per Class A
   
and Class B ordinary share

0.01

(0.02)

0.00

0.00

(0.32)

(0.13)

(0.02)

Basic income/(loss) per ADS (1 ADS

  represents 8 Class A ordinary shares):

 -Continuing operations

(0.70)

0.04

(0.01)

0.00

(3.27)

(0.50)

(0.07)

 -Discontinued operations

0.78

(0.22)

0.00

0.00

0.74

(0.52)

(0.08)

Basic net income/(loss) per ADS (1 ADS
   
represents 8 Class A ordinary shares)

0.08

(0.18)

(0.01)

0.00

(2.53)

(1.02)

(0.15)

Diluted net income/(loss) per ADS (1 ADS

  represents 8 Class A ordinary shares)

 -Continuing operations

(0.70)

0.04

(0.01)

0.00

(3.27)

(0.50)

(0.07)

 -Discontinued operations

0.78

(0.22)

0.00

0.00

0.74

(0.52)

(0.08)

Diluted net income/(loss) per ADS (1 ADS
   
represents 8 Class A ordinary shares)

0.08

(0.18)

(0.01)

0.00

(2.53)

(1.02)

(0.15)

Weighted average number of Class A and Class
    B ordinary shares used in computing net
    income/(loss) per share:

Basic

582,324,325

582,324,325

582,324,325

582,324,325

582,259,624

582,324,325

582,324,325

Diluted

582,324,325

582,324,325

582,324,325

582,324,325

582,259,624

582,324,325

582,324,325


Phoenix New Media Limited

Unaudited Condensed Segment Information

(Amounts in thousands)

Three Months Ended

Nine Months Ended

September 30,

June 30,

September 30,

September 30,

September 30,

September 30,

September 30,

2019

2020

2020

2020

2019

2020

2020

RMB

RMB

RMB

US$

RMB

RMB

US$

Revenues:

Net advertising service

313,139

286,346

281,308

41,432

831,647

776,364

114,346

Paid services

26,771

25,935

21,681

3,193

95,761

70,282

10,351

Total revenues

339,910

312,281

302,989

44,625

927,408

846,646

124,697

Cost of revenues

Net advertising service

157,054

117,536

143,463

21,130

442,730

358,232

52,762

Paid services

14,022

7,192

6,573

968

51,781

21,830

3,215

Total cost of revenues

171,076

124,728

150,036

22,098

494,511

380,062

55,977

Gross profit

Net advertising service

156,085

168,810

137,845

20,302

388,917

418,132

61,584

Paid services

12,749

18,743

15,108

2,225

43,980

48,452

7,136

Total gross profit

168,834

187,553

152,953

22,527

432,897

466,584

68,720


Phoenix New Media Limited

Unaudited Condensed Information of Cost of Revenues

(Amounts in thousands)

Three Months Ended

Nine Months Ended

September 30,

June 30,

September 30,

September 30,

September 30,

September 30,

September 30,

2019

2020

2020

2020

2019

2020

2020

RMB

RMB

RMB

US$

RMB

RMB

US$

Revenue sharing fees

7,319

2,371

6,026

888

23,396

12,653

1,864

Content and operational costs

149,871

107,404

129,749

19,110

431,421

324,183

47,746

Bandwidth costs

13,886

14,953

14,261

2,100

39,694

43,226

6,367

Total cost of revenues

171,076

124,728

150,036

22,098

494,511

380,062

55,977


Unaudited Reconciliations of Non-GAAP Results of Operations Measures to the Nearest Comparable GAAP
Measures

(Amounts in thousands, except for number of ADSs and per ADS data)

Three Months Ended September 30, 2019

Three Months Ended June 30, 2020

Three Months Ended September 30, 2020

GAAP

Non-GAAP

Adjustments

Non-

GAAP

GAAP

Non-GAAP

Adjustments

Non-

GAAP

GAAP

Non-GAAP

Adjustments

Non-

GAAP

RMB

RMB

RMB

RMB

RMB

RMB

RMB

RMB

RMB

Gross profit

168,834

1,476

(1)

170,310

187,553

842

(1)

188,395

152,953

401

(1)

153,354

Gross margin

49.7

%

50.1

%

60.1

%

60.3

%

50.5

%

50.6

%

(Loss)/income from
    operations

(60,198)

3,429

(1)

(56,769)

25,590

2,225

(1)

27,815

(28,434)

1,758

(1)

(26,676)

Operating margin

(17.7)

%

(16.7)

%

8.2

%

8.9

%

(9.4)

%

(8.8)

%

3,429

(1)

2,225

(1)

1,758

(1)

(2)

(2)

(6,013)

(2)

(3)

(1,341)

(3)

(3)

(4)

20,049

(4)

4,486

(4)

(5)

(5)

2,000

(5)

Net (loss)/income 
  from

  continuing 
  operations

  attributable to
  Phoenix

  New Media
  Limited

(50,931)

3,429

(47,502)

2,766

20,933

23,699

(949)

2,231

1,282

Net margin from
  continuing

  operations

(15.0)

%

(14.0)

%

0.9

%

7.6

%

(0.3)

%

0.4

%

Net (loss)/income from

  continuing operations

  per ADS—diluted

(0.70)

(0.65)

0.04

0.33

(0.01)

0.02

Weighted average
  number of

  ADSs used in
  computing

  diluted net
  (loss)/income

  per ADS

72,790,541

72,790,541

72,790,541

72,790,541

72,790,541

72,790,541

(1) Share-based compensation

(2) Income from equity method investments, net of impairment

(3) Changes in fair value of forward contract in relation to future disposal of investments in Particle 

(4) Changes in fair value of loan related to co-sale of Particle shares

(5) Impairment of available-for-sale debt investments 

Non-GAAP to GAAP reconciling items have no income tax effect.


Related Links :

http://www.ifeng.com

Autohome Wins Seven Awards from Prestigious Publisher Institutional Investor’s 2020 All-Asia Executive Team Ranking

BEIJING, Nov. 17, 2020 — Autohome Inc. (NYSE: ATHM) ("Autohome" or the "Company"), the leading online destination for automobile consumers in China, today announced that the Company has won seven awards from Institutional Investor’s "2020 All-Asia Executive Team" rankings, including "Honored Company," "Best CEO," and "Best CFO."

Recently, the global authoritative financial magazine Institutional Investor released the final results from its "2020 All-Asia Executive Team." After nearly six months of voting, Autohome finally emerged from the fierce competition, which included more than 1,000 outstanding listed companies being considered for excellence in corporate governance, executive leadership, and investor relations professionalism.

In the 2020’s rankings, Autohome was selected on the "Honored Companies" list by distinguishing itself with top rankings in the following categories/sub-categories: Min Lu was recognized as Best CEO, Jun Zou was recognized as Best CFO, and Autohome has also gained top 3 ranking in Best IR Professionals, Best IR Team, Best IR Program and Best ESG, respectively.

For 52 years, Institutional Investor has consistently distinguished itself among the world’s foremost media companies with groundbreaking journalism and incisive writing that provides essential intelligence for a global audience. In addition, Institutional Investor offers highly-respected proprietary benchmark research and rankings, including independent sell-side and corporate performance research and rankings, aiming to be the first-choice and independent validation source of qualitative market intelligence for all three sides of the investment community. Institutional Investor Research has a global presence, spanning Europe, All-Asia, the US and Latin America. Every year, Institutional Investor Research asks buy-side analysts, money managers and sell-side researchers at securities firms and financial institutions that cover the region to identify up to four companies that excel in investor relations in five specific categories – Best CEO, Best CFO, Best IR Professional, Best IR Company and Best ESG.

This year, a total of 1,921 portfolio managers and buy-side analysts, as well as 611 sell-side analysts, participated in the 2020 All-Asia Executive Team Honored Companies survey. This year, 1,472 companies, nominated across 18 sectors, were rated on nine core areas. The title of "Honored Company" goes to businesses earning a top-three position in one of the five categories. With its broad influence, the research is known for its strictness, objectivity, and professionalism and is deemed as the most valuable survey amongst the investment community every year. The seven awards Autohome had received from Institutional Investor demonstrates its wide recognition by the global capital markets.

In recent years, Autohome has made continuous efforts to strengthen its corporate governance. By leveraging its dominant leadership in digital analytics, Autohome has continued its first-mover advantage under the guidance of its "4+1" business strategy. The Company has been facilitating automakers to deepen the digital transformation with great value add to the auto industrial internet vertical, aiming to build a smart auto ecosystem. Winning multiple awards from the prestigious Institutional Investor is a testament to Autohome’s increasingly effective and prominent strategic transformation, as the Company’s operational capabilities, market competitiveness, and investment value have been highly recognized by global media and investment community. At the same time, it has also demonstrated Autohome’s progress and outstanding performance in corporate governance, executive leadership, information disclosure and investor communication with the capital markets community.

Mr. Min Lu, Chairman and Chief Executive Officer of Autohome, said, "In the future, Autohome will continue to strengthen fundamental advantages of its core business, capitalize on growth opportunities in new areas, and achieve steady and sustainable development."

Mr. Jun Zou, Chief Financial Officer of Autohome, added, "With the strong support of institutional investor groups, Autohome will remain focused on delivering long-term value to our customers, partners and investors."

About Autohome Inc.

Autohome Inc. (NYSE: ATHM) is the leading online destination for automobile consumers in China. Its mission is to enhance the car-buying and ownership experience for auto consumers in China. Autohome provides original generated content, professionally generated content, user-generated content, AI-generated content, a comprehensive automobile library, and extensive automobile listing information to automobile consumers, covering the entire car purchase and ownership cycle. The ability to reach a large and engaged user base of automobile consumers has made Autohome a preferred platform for automakers and dealers to conduct their advertising campaigns. Further, the Company’s dealer subscription and advertising services allow dealers to market their inventory and services through Autohome’s platform, extending the reach of their physical showrooms to potentially millions of internet users in China and generating sales leads for them. The Company offers sales leads, data analysis, and marketing services to assist automakers and dealers with improving their efficiency and facilitating transactions. Autohome operates its "Autohome Mall," a full-service online transaction platform, to facilitate transactions for automakers and dealers. Further, through its websites and mobile applications, it also provides other value-added services, including auto financing, auto insurance, used car transactions, and aftermarket services. For further information, please visit www.autohome.com.cn.

For investor and media inquiries, please contact:

In China:

Autohome Inc.
Investor Relations
Anita Chen
Tel: +86-10-5985-7483
Email: ir@autohome.com.cn

The Piacente Group, Inc.
Jenny Cai
Tel: +86-10-6508-0677
E-mail: autohome@tpg-ir.com

In the United States:

The Piacente Group, Inc.
Brandi Piacente
Tel: +1-212-481-2050
E-mail: autohome@tpg-ir.com

Related Links :

http://www.autohome.com.cn

500.com Limited to Report Third Quarter 2020 Financial Results on November 20, 2020

SHENZHEN, China, Nov. 16, 2020 — 500.com Limited (NYSE: WBAI) ("500.com" or the "Company"), an online sports lottery service provider in China, today announced that it plans to release its financial results for the third quarter ended September 30, 2020 after the close of U.S. markets on Friday, November 20, 2020.

About 500.com Limited

500.com Limited (NYSE: WBAI) is an online sports lottery service provider in China. The Company offers a comprehensive and integrated suite of online lottery services, information, user tools and virtual community venues to its users. 500.com was among the first companies to provide online lottery services in China, and is one of two entities that have been approved by the Ministry of Finance to provide online lottery sales services on behalf of the China Sports Lottery Administration Center, which is the government authority that is in charge of the issuance and sale of sports lottery products in China.

Safe Harbor Statements

This news release contains forward-looking statements within the meaning of Section 21E of the Securities Exchange Act of 1934, as amended, and as defined in the U.S. Private Securities Litigation Reform Act of 1995. These forward-looking statements can be identified by terminology such as "will," "expects," "anticipates," "future," "intends," "plans," "believes," "estimates," "target," "going forward," "outlook" and similar statements. Such statements are based upon management’s current expectations and current market and operating conditions, and relate to events that involve known or unknown risks, uncertainties and other factors, all of which are difficult to predict and many of which are beyond the Company’s control, which may cause the Company’s actual results, performance or achievements to differ materially from those in the forward-looking statements. Further information regarding these and other risks, uncertainties or factors is included in the Company’s filings with the U.S. Securities and Exchange Commission. The Company does not undertake any obligation to update any forward-looking statement as a result of new information, future events or otherwise, except as required under law.

For more information, please contact:

500.com Limited
ir@500wan.com

Christensen

In China
Mr. Eric Yuan
Phone: +86-10-5900-1548
E-mail: Eyuan@christensenir.com

In US
Ms. Linda Bergkamp
Phone: +1-480-614-3004
Email: lbergkamp@ChristensenIR.com

Related Links :

http://ir.500.com/

Megvii accelerates international roll-out of Koala smart access solution

BEIJING, Nov. 16, 2020 — Megvii Technology Limited announced the deployment of its facial recognition-based smart access solution, Koala, in Japan, Singapore, Thailand, Brazil, and the United Arab Emirates (UAE), to help international enterprise customers enhance safety and strengthen security in commercial and office settings. This represents another milestone in the Company’s efforts to help businesses across the globe accelerate their digital transformation with AI.

The Koala solution is designed to support enterprise customers in authenticating and controlling access to private and restricted locations, such as office buildings, school campuses, and residential compounds. Powered by Megvii’s proprietary algorithm, the solution enables swift authentication and registration of authorized personnel and supports functions such as attendance tracking and visitor registration and management.

Overseas locations that have recently installed Koala include:

  • Hug Gym, Chiang Mai, Thailand: Megvii customized and deployed a comprehensive smart access solution that allows gym managers to monitor and supervise the reception area with ease, including enabling one-to-one facial authentication for employees and registered gym members. The solution also encompasses real-time alerts to flag unauthorized access into the premises.
  • SEB High School, Brazil: Megvii deployed the Koala solution to improve campus safety and security, allowing for one-to-one facial authentication and identity verification of students, teachers, administrators, and other school staff. The system can also swiftly detect and flag access by unauthorized persons.
  • One of the Largest Oil Rig Builders in the United Arab Emirates (UAE): The Koala solution was deployed to enable the efficient verification of over 20,000 employees and registered visitors. This also removes the need for employees to use access cards or fingerprint verification, which can take considerably longer than one-to-one facial authentication, especially in the challenging environment of field operation.

About Megvii

Established in 2011, Megvii is a world-class AI company with a core competency in deep learning. Leveraging its proprietary AI productivity platform Brain++, Megvii focuses on three key verticals: Personal IoT, City IoT, and Supply Chain IoT. Megvii provides full-stack solutions to customers, integrating algorithms, software, hardware, and AI-empowered IoT devices.

Related Links :

https://www.megvii.com/

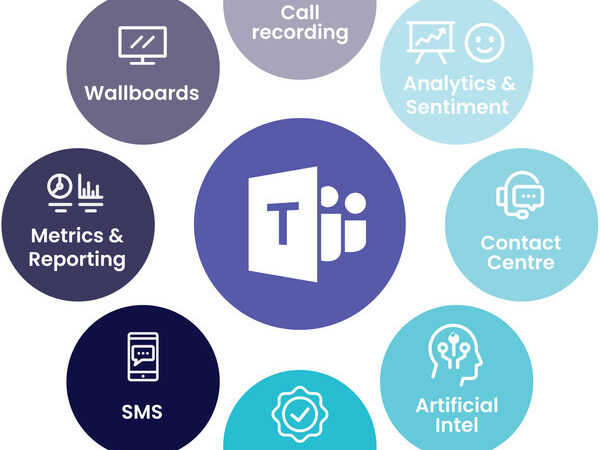
CommsChoice becomes Australia’s first vendor of Contact Centre for Microsoft Teams Direct Routing

SYDNEY, Nov. 16, 2020 — Leading cloud communications provider, ASX listed CommsChoice Group Limited (ASX: CCG), today announced that it has expanded its Microsoft Teams Direct Routing solution to include Contact Centre functionality, allowing companies to implement a call centre natively within their Teams environment.

CommsChoice Microsoft Teams Contact Centre Call Centre

CommsChoice Executive General Manager, Tony Dunphy, said that the Company was the first vendor in Australia to integrate this functionality with Microsoft Teams Direct Routing.

"We have delivered over 20 Teams contact centre and call centre solutions in our first two years of providing Teams calling, which I think means we can also lay claim to being one of Australia’s most experienced Microsoft Teams contact centre providers."

Call centres today act as one of the main channels of interaction for customers. And because of all the other ways customers engage with companies – phone, email, text, social – every member of the business has the potential to be involved in engaging a customer directly and therefore needs to have the right tools. This expanded scope of customer interactions across the entire business needs tools that provide consistency, continuous improvement, value added reporting and scale.

Mr Dunphy said, "Because the future of work has essentially been fast tracked, we’re seeing big demand for integrating contact centres with Microsoft Teams for customers deploying Teams Calling capabilities.

Direct routing means contact centre agents can make and receive calls within Microsoft Teams and it supports customer interaction work streams by acting as the hub for internal and external customer connection across all modes of communication including chat, video meetings and calling."

CommsChoice cloud-based software – Insights – provides access to features such as call recording, IVR, supervisor, reporting, and wallboards. The call recording feature captures incoming and outgoing customer calls and stores them securely, and in accordance with all compliance standards. Calls are stored in the same location as the Microsoft Office 365 tenancy, which is domiciled so local data compliance is also assured.

Mr Dunphy said, "We have a range of call centre options to suit companies with either an on-premises or cloud set up including native, semi native and hybrid contact centre solutions. Teams also enables ‘work from anywhere’ and will help ensure consistent and constantly improved customer engagement from any device, any channel, location or time zone."

ENDS

About CommsChoice

CommsChoice Group provides cloud communications for business. The company services SME and mid-tier corporate customers in Australia, Asia and internationally using its cloud based global business phone platform and Microsoft Teams calling/Direct routing integration combined with innovative SD-WAN technology and fibre and NBN access products.

For more information visit www.commschoice.com or follow the company on LinkedIn @CommsChoiceGroup or email us on enquiries@commschoice.com 

Related Links :

https://www.commschoice.com

H3C Wins the Bid for Japanese Education Network Construction Project with Cloudnet Solution

TOKYO, Nov. 14, 2020 — A leader in digital solutions, H3C has won the bidding for a networking construction project for Japanese schools. This project is part of the country’s GIGA School initiative launched by Japan’s Ministry of Education, Culture, Sports, Science and Technology (MEXT). The GIGA School initiative aims to provide high-speed and high-capacity communications standards to elementary, middle and high schools nationwide, in a bid to create the best ICT environments for applying the educational ideas of nurturing children’s creativity.

The GIGA School initiative is to improve the ICT environment to drive educational innovations.

H3C has been awarded the bid with a comprehensive plan of the latest Wi-Fi 6 products, Power over Ethernet (PoE) switch and Cloudnet solution, strengthening its pledge to provide high-performance wireless networks and intelligent cloud O&M management services. It also aligns to the GIGA School’s plan to connect the schools nationwide to high-speed Internet and high-quality digital learning services, and build high-speed and large-capacity communication environments.

With the deployment of H3C Cloudnet solution, the local education department is enabled to undertake unified management over wired and wireless networks of many schools with only one intelligent cloud O&M management platform. Furthermore, the Cloudnet solution enables users to perform the whole deployment process remotely on APP, which can save much time and costs and improve the efficiency of network management.

H3C will take this project as an opportunity to deploy the Cloudnet solution, a solution converging wired switches and WLAN products and services in the Japanese market. At the same time, to meet diverse needs and improve user experience, the technical team from H3C is optimizing the wireless networking performance applicable for different scenarios. For example, by visualizing the network of devices and systems as health indicators (including states not limited to normal or abnormal), the solution can provide users with more reliable operating information.

Since entering the Japanese market, H3C has been committed to helping move the digital transformation forward with cutting-edge products and services. 

"Adhering to our motto of ‘Shaping the Digital Future for a Better Life’, H3C is consistently innovating and promoting digital economy as an important part of the Japanese market. We will continue to help drive the digitalization of Japan and look forward to contributing to improving the everyday life," said Gary Huang, President of the International Business and Senior Vice President of H3C.

About H3C
H3C is an industry leader in the provision of Digital Solutions and is committed to becoming the most trusted partner of clients in their quest for business innovation and digital transformation. H3C offers a full portfolio of Digital Infrastructure products, spanning across computing, storage, networks, security and related domains. The company also  provides a comprehensive one-stop digital platform that includes cloud computing, big data, interconnectivity, information security, new safety, Internet of Things (IoT), edge computing, artificial intelligence (AI) and 5G solutions, as well as end-to-end technical services.

For more information, please visit H3C official website and social media pages: Facebook; Twitter;
LinkedIn

Related Links :

https://www.h3c.com/en/

AlpVision to offer free of charge security feature to protect COVID-19 relevant medicines against counterfeiting


VEVEY, Switzerland, Nov. 13, 2020 — On November 13th, 2020, AlpVision is launching the "AlpVision COVID-19 Initiative" helping pharmaceutical companies to protect COVID-19 relevant medicines against counterfeiting.

Authentication using smartphones

COVID-19 has caused not only a worldwide health crisis, but also created unprecedented economic challenges. In response, AlpVision has decided to launch the "AlpVision COVID-19 Initiative". The initiative supports pharmaceutical companies by providing them for free with the necessary tools to protect COVID-19 relevant medicines and vaccines against counterfeiting.

To do so, AlpVision will provide pharmaceutical companies and their suppliers with all necessary tools to deploy the Cryptoglyph on their packaging. The AlpVision Cryptoglyph is a digital security feature which can be implemented and deployed within just a few weeks. The Cryptoglyph is invisible to the human eye and authentication of a product protected with a Cryptoglyph is done using a regular smartphone. Securing of packaging with a Cryptoglyph is very easy as it neither changes the standard production process, nor requires additional consumables. In addition, the smartphone applications connect to AlpVision’s Brand Monitoring System (BMS), a centralized server platform through which pharmaceutical companies are able to monitor in real-time product authentication activities and gain important insight into counterfeiting activities.

The "AlpVision COVID-19 Initiative" starts on November 13th, 2020, and subscription will run for an initial period of three months. Participating companies will be able to protect their COVID-19 relevant products with zero additional cost for the authentication feature. AlpVision will provide this service gratuitously until the pandemic is officially declared as ended by the World Health Organization. Companies interested in participating in the initiative are invited to contact AlpVision. More information can be found online at www.alpvision.com/Covid/.

ALPVISION – MORE THAN ANTI-COUNTERFEIT SOLUTIONS

AlpVision was founded in 2001 and is the world’s leader in digital anti-counterfeiting technologies for product authentication and counterfeit protection. AlpVision’s digital anti-counterfeiting solutions for product authentication are applicable to a wide variety of items, including packaging and labelling, plastic and metal products, and high-value documents. AlpVision anti-counterfeiting solutions are commercialized worldwide under license agreements as entirely customizable turnkey computerized systems. Today AlpVision protects over 30 billion of products each year. More information is available at www.alpvision.com. Join us on LinkedIn and follow us on Twitter.

Cryptoglyph and AlpVision are registered trademarks of AlpVision SA. Smart Embossing, AlpVision Fingerprint® and Krypsos are trademarks of AlpVision SA.

Contact:

Martin Kutter 
+41 21 948 6464  
avinfo-20@alpvision.com

Photo – https://techent.tv/wp-content/uploads/2020/11/alpvision-to-offer-free-of-charge-security-feature-to-protect-covid-19-relevant-medicines-against-counterfeiting.jpg
Logo – https://techent.tv/wp-content/uploads/2020/11/alpvision-to-offer-free-of-charge-security-feature-to-protect-covid-19-relevant-medicines-against-counterfeiting-2.jpg


Related Links :

http://www.alpvision.com

Egis and Cylus Partner to launch a Center of Excellence, for Rail Cybersecurity Services

TEL AVIV, Israel, Nov. 13, 2020 — Egis and Cylus, the leading rail cybersecurity company, announced today that they are joining forces to form a Center of Excellence for advanced, rail-focused, cybersecurity services. The Center of Excellence will support rail companies around the world in building cyber resiliency and securing critical networks.

Cybersecurity is a growing concern for the railway industry. Egis and Cylus bring their combined expertise in offering end-to-end cybersecurity services, encompassing all aspects of the rail operational network’s life-cycle. Designed by the world’s foremost experts, based on methodologies, technologies, and standards (IEC 62443), the Center of Excellence delivers a wide array of advanced security solutions and services to customers worldwide. From development of strategy, through identification of cyber risks, to detection and response to incidents, railway companies will be supported in all aspects of cybersecurity.

"We are excited to collaborate with Cylus, the leading rail cybersecurity company. Joining forces enables us to provide our customers, unique domain expertise as well as cutting-edge cybersecurity know-how and best practices." Says Olivier Bouvart, Executive Director Rail of Egis and adds "We decided to take action and be proactive in supporting our customers by preparing them for the growing risk of cyber threats."

"We’re excited to work with Egis Rail, which has decades of experience in providing mobility services around the globe." Says Amir Levintal, CEO of Cylus, "This partnership strengthens our capabilities to provide end-to-end support to rail organizations in meeting the specter of cyber threats. Our joint services are designed specifically for the railway industry and will enable our customer to focus on their day-to-day operations, business, and growth, leaving their cyber-defense management to our security experts. We are certain that this partnership will drive the rail industry towards a cyber-safe future."

For more information, visit the Center of Excellence.

About Cylus

Cylus leads rail transport towards a cyber-safe future by protecting railway systems against cyber threats.

With a 100% focus on rail-cybersecurity, Cylus is the first software company to address the railway industry’s unique, complex and divergent needs. Cylus rail cybersecurity solutions are trusted by top-tier railway companies globally and the rail ecosystem as a whole. For more information please visit – https://www.cylus.com

Press contacts:
Ben Kapon – Tel.: +972-52-6100006
kapon@cylus.com 

About the Egis group

Egis is a major international group in the construction engineering and mobility services sectors whose unique global service range encompasses infrastructure consulting, engineering and operation. Through our capacity for innovation, we respond to the climate emergency and to the greatest challenges of our time by offering solutions and acknowledged know-how in the areas of transportation and mobility, sustainable city construction, buildings, water, the environment and energy.

A 75%-owned subsidiary of Caisse des Dépôts, with the remaining 25% held by partner executives and employees, Egis Imagine a sustainable future, working for populations and social progress.

€1.22 bn managed turnover in 2019
15,800 employees


Press contacts

Isabelle Bourguet Mayrand
Strategy, Marketing and Communications Director
Tel.: +33 (0)1 39 41 44 17 / +33 (0)6 17 10 29 70
isabelle.bourguet@egis.fr

Sabine Mendy

Deputy Communications Director

Tel.: +33 (0)1 39 41 43 05 / +33 (0)6 25 33 02 64
sabine.mendy@egis.fr


Related Links :

http://www.egis.fr