Tag Archives: STW

Truecaller for Business launches new and enhanced capabilities for enterprise customers

STOCKHOLM, Aug. 26, 2022 /PRNewswire/ — Truecaller for Business (“TfB”), Truecallers enterprise offering, is now launching several enhanced features like “Video Caller ID”, “Call Me back-function”, “Call Ratings” and “Surveys”. Improvements have also been made to the platform to be able to onboard new clients faster. The new capabilities significantly strengthen Truecallers current enterprise offering.

Truecaller for Business, Truecallers enterprise offering, which was launched late 2020 has since inception onboarded a large spectrum of clients across different sectors in India and other focus markets like South Africa, Egypt, Malaysia, and Israel. In total TfB now has customers in 32 countries.

TfB sees good traction across categories of businesses with use cases around service, support and fulfillment, ride-hailing, logistics and delivery, marketing and sales, security, and fraud management.

TfB’s solutions are aimed at protecting business’s brand and consumers from getting impacted by impersonation and fraud; it also brings in contact center efficiency, reducing costs on the customer support front. The offering has been well received by a wide range of well-known global and local brands and is the relatively fastest growing revenue stream for Truecaller.

In the effort to further build seamless CX (Customer Experience) among a large community of business customers, Truecaller has been working on developing new capabilities and agile experiences on the platform.

“Video Caller ID” capability is now rolled out fully to enable branded, contextual videos to differentiate business Caller Identity from the rest. After a successful early access program, the feature is live and has experienced initial good response among consumer brands, automobiles, real estate, fintech, and other sectors as part of their business calling communication lifecycle.

For businesses to get actionable intent from their customers receiving calls, the “Call Me Back” capability is now live on the platform. The feature enables enterprises to get call-back requests from customers that might miss an important call. This is one of the first of its kind capability in the market, allowing two-way communication between customers and businesses even when calls are unanswered, further enabling trusted and productive business communication. In addition, the capability will help companies to streamline their calling process and increase their ROI from the overall calling workflow.

Further capabilities like Call Ratings and Surveys are soon being launched as part of the expanded suite of business offerings that will allow businesses to derive real-world insights from end customers to evolve their communication experience.

As part of business platform experience evolution, the company has rolled out a refreshed Verified Business caller ID activation workflow which improves business onboarding by activating their numbers much faster and further shortens the go live cycle for businesses. With increased demand for TfB services, these platform enhancements allow more businesses to get started on the platform in a shorter time.

“I am very pleased that we now launch new products and features that further improves our value proposition to our enterprise customers. With this ramp up we improve our future growth prospects for our business offering” says Alan Mamedi CEO and co-founder of Truecaller.

For more information, please contact: 

Andreas Frid, Head of IR & Communication
+46 705 290800
andreas.frid@truecaller.com

About Truecaller:

Truecaller (TRUE B) is the leading global platform for verifying contacts and blocking unwanted communication. We enable safe and relevant conversations between people and make it efficient for business to connect with consumers. Fraud and unwanted communication are endemic to digital economies, especially in emerging markets. We are on a mission to build trust in communication. Truecaller is an essential part of everyday communication for more than 320 million active users, with half a billion downloads since launch and around 38 billion unwanted calls identified and blocked in 2021. Headquartered in Stockholm, since 2009, we are a co-founder led, entrepreneurial company, with a highly experienced management team. Truecaller is listed on Nasdaq Stockholm since 8 October 2021. For more information, please visit corporate.truecaller.com

This information was brought to you by Cision http://news.cision.com

https://news.cision.com/truecaller-ab/r/truecaller-for-business-launches-new-and-enhanced-capabilities-for-enterprise-customers,c3620711

The following files are available for download:

Kdan Mobile Expands Influence in Japanese Market, Integrates DottedSign with LINE WORKS

IRVINE, Calif., Aug. 25, 2022 /PRNewswire/ — Kdan Mobile Software, Ltd., a global SaaS company, continues to expand into the Japanese market with its latest collaboration with WORKS MOBILE Japan Corp. Kdan announced the integration of its e-signature solution, DottedSign, with LINE WORKS, the largest business communication platform provided by WORKS MOBILE, to help professionals manage their signing processes more efficiently.

“Integrating with LINE WORKS is an important milestone for us as we continue to expand our business in Japan,” says Kenny Su, CEO of Kdan Mobile. “We will keep working closely with WORKS MOBILE for more collaborations in the future.”

The integration between the two is designed to optimize efficiency in the workplace by shortening the time spent waiting on documents to be processed and signed. Users of LINE WORKS will receive real-time notifications when a new signature request is sent from DottedSign or when a document sent via DottedSign is signed by all parties.

DottedSign is a cloud-based electronic signature solution that provides users a smooth, secure, and efficient e-signing experience. The software allows users to sign across desktop and mobile devices remotely, anytime and anywhere. DottedSign currently integrates with Google Workspace, Microsoft Teams, Salesforce and Zapier.

LINE WORKS is a business communication platform integrated from the messaging platform, LINE, for professional collaboration. It offers a variety of features for use at work, including chats, bulletin boards for company announcements, and calendars. The platform is provided by WORKS MOBILE Japan Corp. and is used by over 350,000 companies worldwide.

“As we strive to improve efficiency for our users, we are delighted to have Kdan’s DottedSign integrated in LINE WORKS,” says President and CEO of WORKS MOBILE Japan, Ryuichi Masuda. “The integration adds value to LINE WORKS services .”

Kdan Mobile is looking to expand its market share in Japan through collaborations with local resellers and agencies beyond its partnership with WORKS MOBILE. The company plans to integrate its software solutions with other prominent business platforms to support a variety of business scenarios.

For any partnership request, please contact pr@kdanmobile or check Kdan Mobile’s website to learn more: www.kdanmobile.com/

About Kdan Mobile Software Ltd. and DottedSign

Kdan Mobile Software was founded in 2009 with a mission to empower modern professionals to better leverage their productivity and unleash their creativity. The company is a global SaaS provider, whose work is supported by over 200 million downloads, and over 10 million active members worldwide.

Their e-signature service, DottedSign, is used by over 2,000 enterprise clients and provides a smooth, secure and efficient cloud-based e- signing service. Their other solutions include a portfolio of different productivity and creativity-related tools.

For more information visit: Kdan Mobile.
For more information about DottedSign visit: DottedSign.

Cision View original content:https://www.prnewswire.com/news-releases/kdan-mobile-expands-influence-in-japanese-market-integrates-dottedsign-with-line-works-301611468.html

simPRO Expands Global Footprint with New Office Openings


simPRO accelerates its international expansion plans with two new office openings in high-growth markets of Singapore and the Netherlands

BROOMFIELD, Colo., Aug. 24, 2022 /PRNewswire/ — simPRO, the global leader in trade business management software, is pleased to announce the opening of two new office spaces in Singapore and the Netherlands. These offices will help accommodate an aggressive global expansion strategy and commitment to growing their customer base around the world.

The two new offices employ six local team members in each location in sales, business development and implementation consultant positions. simPRO also has locations in Brisbane, Australia; Auckland, New Zealand; Broomfield, CO; and St. Ives, UK.

“Our new office locations in Singapore and the Netherlands represent strategic growth of the simPRO brand and cements our global leadership position in trade business software,” said Sean Diljore, CEO of simPRO. “simPRO’s move into these high-growth markets builds on our core mission to help trade businesses that are essential small businesses for communities to grow and thrive.”

The openings of these locations were under development prior to the COVID pandemic which caused simPRO to put plans on hold. This gave them the opportunity to put more time and research into the regions under consideration. It also allowed more time for customer contacts to be made and demand for field management software to grow.

“The delay of the Singapore launch allowed us more time to research and make contacts before we set up an office on Cecil Street,” said Peter Darley, Sr. VP of New Markets, simPRO. “We are now speaking to a number of customers who are excited to have this type of software and be supported by a local entity. The future looks bright for Singapore.”

“simPRO was able to restart the European expansion plan in 2022,” said Sean Sadler, Director, New Markets, simPRO. “The Dutch market is not too dissimilar to the UK market. simPRO’s job management solutions will bring the same benefits that thousands of our UK customers benefit from today. The Netherlands trade businesses’ early adoption of technology will assist in our go to market activities, and the geographical position will allow simPRO to expand further into Northern European countries.”

The Singapore office is located at 20 Cecil Street, #13-01/02, Singapore. The Netherlands office is located at Mindspace, Nieuwezijds Voorburgwal 162, 1012 SJ, Amsterdam.

About simPRO 

simPRO is a global SaaS business providing operations management solutions to trade and specialty contracting industries. With 200,000 users in Australia, New Zealand, the United States, Canada, the United Kingdom and Ireland, its verticals broadly include security professionals, plumbers, electricians, HVAC, solar and data networking.

Led by CEO Sean Diljore and headquartered in Brisbane Australia, simPRO’s cloud-based software is an end-to-end operation solution that streamlines field workflows to maximize workforces and enable business growth.

simPRO has more than 480 employees over six global offices. 

Want to know more about simPRO? Visit our website.

Contact: Jennifer Pringle, Vice President, Brand Mktg
simPRO Software
Phone: 1-303-859-0331
Email: jennifer.pringle@simpro.us

simpro.com.au

Logo – https://techent.tv/wp-content/uploads/2022/08/simpro-expands-global-footprint-with-new-office-openings.jpg

LiveHire and CrintellTech Announce Strategic Integration to Automate Candidate Sourcing and Streamline the Recruiting Life-Cycle

MIAMI and CHEYENNE, Wyo., Aug. 23, 2022 /PR Newswire/ — LiveHire Ltd. (ASX: LVH), a global software-as-a-service (SaaS) Total Talent Acquisition platform that helps companies connect with and hire the talent they need, and CrintellTech, an AI-driven recruitment intelligence platform that automates candidate sourcing, announce their strategic integration to transform the recruiting life-cycle.

Today’s market for talent is tight and sourcing talent can be one of the most time consuming parts of a recruiter’s job, accentuating the need to reach out to passive candidates in addition to active candidates in order to meet hiring needs.

Companies using LiveHire to source and hire candidates can now automate their process for sourcing and engaging with passive candidates from job board databases and professional networks by leveraging the strategic integration to CrintellTech. The CrintellTech Chrome App/Extension provides two products for the sourcing of external candidates passing them directly into LiveHire; “Eva” and “Assist”.

With “Eva”, LiveHire recruiters can pass the details of a job or sourcing requirement directly to Eva, allowing Eva’s AI to source their desired number of candidates from integrated job board profile databases and then send emails and text messages to candidates to confirm their interest in applying. Eva’s AI automatically exports candidates to LiveHire and updates their status based on their responses.

With “Assist”, recruiters can export suitable candidates they find while on job board profile databases or professional networks straight into LiveHire, assigning them to jobs and including notes about why they think the candidate is a good fit. Furthermore, Crintell Assist can save recruiters time and money by identifying candidates that have already exported to LiveHire, thereby reducing the cost of external sourcing.

Once imported into LiveHire from CrintellTech through Eva or Assist, hiring teams on LiveHire can engage with candidates by leveraging workflow automations and native two-way email and text messaging all the way through to hiring, helping hiring teams deliver award-winning candidate experiences and outstanding recruitment outcomes.

“We are excited about the LiveHire integration with Crintell Technologies and our ability to accelerate the flow of qualified candidates and recruiter productivity,” says Christy Forest, LiveHire CEO. “LiveHire’s Total Talent Acquisition Platform (ATS + CRM) paired together with CrintellTech will streamline and modernize the hiring process and ultimately deliver a better candidate experience.”

“We are excited to be a part of this strategic partnership with LiveHire. I believe our technologies complement each other and aim to bring in quality candidates and greatly improve recruiter productivity.” says Arbind Joseph M, Founder and CEO of Crintell Technologies.

About LiveHire

LiveHire is a globally-leading recruitment and contingent direct sourcing platform – enabling clients to attract and engage both permanent employees and contingent workers to deliver Total Talent and Direct Sourcing solutions. LiveHire offers an award-winning candidate experience and provides talent-on-demand through its unique talent pooling and 2-way text messaging functionality, having successfully enabled end-to-end recruitment from sourcing through to hire of diverse workforces for over 200 clients across 20 verticals globally. For more information, visit https://www.livehire.com/

About CrintellTech

CrintellTech is an AI-driven recruitment intelligence platform that automates resume searches and transforms the recruitment process. The founding team at Crintell has decades of hands-on experience in staffing and recruitment and understands the conundrums faced by recruiters and employers. Crintell knew there was a need for a simple yet powerful solution that would facilitate and empower recruiters to do a better and more meaningful job. Crintell was birthed to provide better resolution to these issues and create measurable impact to the entire recruitment life cycle.

Cision View original content:https://www.prnewswire.com/news-releases/livehire-and-crintelltech-announce-strategic-integration-to-automate-candidate-sourcing-and-streamline-the-recruiting-life-cycle-301610422.html

8×8 CPaaS Achieves CSA Cyber Trust Mark Certification in Singapore

8×8 is One of the First Companies to be Awarded the Certification

SINGAPORE, Aug. 22, 2022 /PRNewswire/ — 8×8, Inc. (NYSE: EGHT), a leading integrated cloud communications platform provider, today announced that Singapore’s Cyber Security Agency (CSA) has recognised 8×8 CPaaS for its strong cybersecurity practices with the Cyber Trust mark certification. This cybersecurity certification for enterprises with more extensive digitalised business operations, distinguishes 8×8 for its robust cybersecurity practices and measures.

“Our Customer first mentality drives us to always focus on the customer and what they need to ensure their business communications are successful. This includes providing programmable communications and CPaaS capabilities that offer the highest levels of security and reliability while enabling businesses to build engaging customer experiences,” said Anton Shchekalov, Vice President of Engineering, CPaaS at 8×8, Inc. “We are honored to have our efforts recognized by the CSA and to be among the first organisations awarded the Cyber Trust mark certification.”

8×8 CPaaS includes the newly introduced 8×8 Connect Automation Builder no-code multiple-channel communications management solution, and a portfolio of communication APIs, including SMS, voice, chat apps, video, and performance monitoring. 8×8’s portfolio of communication APIs, are part of the 8×8 XCaaS™ (eXperience Communications as a Service™) cloud contact center, voice, team chat, and video meetings single-vendor solution.

About 8×8 Inc.
8×8, Inc. (NYSE: EGHT) is transforming the future of business communications as a leading Software as a Service provider of 8×8 XCaaS™ (eXperience Communications as a Service™), an integrated contact center, voice communications, video, chat, and API built on one global cloud communications platform. 8×8 uniquely eliminates the silos between Unified Communications as a Service (UCaaS) and Contact Center as a Service (CCaaS) to power the communications requirements of all employees globally as they work together to deliver differentiated customer experiences. For additional information, visit www.8×8.com, or follow 8×8 on LinkedIn, Twitter and Facebook.

8×8®, 8×8 XCaaS™, eXperience Communications as a Service™, eXperience Communications Platform™ are trademarks of 8×8, Inc.

Source: 8×8, Inc.

TraceLink joins AWS Partner Network


BOSTON, Aug. 16, 2022 /PRNewswire/ — TraceLink Inc., the leading digital network platform company, today announced that it has joined the Amazon Web Services (AWS) Partner Network (APN).

The company also announced that the TraceLink Supply Chain Work Management solution is now available in AWS Marketplace.

“TraceLink built Opus, the Platform for the Internet of Supply Chains (IoSC), on AWS to achieve the scalability and reliability required for end-to-end supply chain digitalization,” said Shabbir Dahod, President and CEO of TraceLink. “Supply Chain Work Management digitalizes work between trading partners. By joining APN and featuring Supply Chain Work Management, powered by Opus, in AWS Marketplace, TraceLink is allowing an even faster and easier path to digital transformation for AWS customers.”

What is TraceLink Supply Chain Work Management?

TraceLink Supply Chain Work Management is a revolutionary new way to execute supply chain management processes by digitalizing work across multiple tiers of supply chain partners. The solution allows teams to assign tasks, manage incidents, review documents, manage changes, and track progress with dashboards. As a result, exceptions are resolved faster, costs are reduced, and on-time, in-full (OTIF) delivery goals are exceeded.

Developed and hosted on the TraceLink Opus Digital Network Platform, Supply Chain Work Management lets manufacturers create digital networks with their partners, establish virtual teams, and empower those teams with the data and structured collaboration capabilities required to handle today’s supply chain challenges.

Learn more about TraceLink Supply Chain work Management in AWS Marketplace.

About TraceLink

TraceLink is the only business network creation platform for the Internet of Supply Chains™—integrated business ecosystems built with multienterprise applications on the TraceLink Opus platform. Business networks are the foundation of an end-to-end supply chain digitalization strategy that delivers customer-centric agility and resiliency leveraging the collective intelligence of an industry. The TraceLink Opus Digital Network Platform enables speed of open innovation and implementation with a partner ecosystem for no-code and low-code development of solutions and applications.

Hollysys Automation Technologies Reports Unaudited Financial Results for the Fiscal Year and the Fourth Quarter Ended June 30, 2022

Fiscal Year 2022 Financial Highlights

  • Total revenues were $707.5 million, an increase of 19.2% compared to the comparable prior year period.
  • Gross margin was 33.8%, compared to 36.8% for the comparable prior year period. Non-GAAP gross margin was 34.0%, compared to 36.8% for the comparable prior year period.
  • Net income attributable to Hollysys was $83.2 million, a decrease of 7.3% compared to the comparable prior year period. Non-GAAP net income attributable to Hollysys was $94.2 million, a decrease of 5.5% compared to the comparable prior year period. 
  • Diluted earnings per share was $1.35, a decrease of 7.5% compared to the comparable prior year period. Non-GAAP diluted earnings per share was $1.53, a decrease of 5.6% compared to the comparable prior year period.
  • Net cash provided by operating activities was $54.5 million.
  • Days sales outstanding (“DSO”) of 171 days, compared to 180 days for the comparable prior year period.
  • Inventory turnover days of 58 days, compared to 51 days for the comparable prior year period.

Fourth Quarter of Fiscal Year 2022 Financial Highlights

  • Total revenues were $182.1 million, an increase of 14.7% compared to the comparable prior year period.
  • Gross margin was 33.7%, compared to 37.8% for the comparable prior year period. Non-GAAP gross margin was 33.9%, compared to 37.9% for the comparable prior year period.
  • Net income attributable to Hollysys was $23.0 million, an increase of 4.9% compared to the comparable prior year period. Non-GAAP net income attributable to Hollysys was $24.7 million, a decrease of 12.0% compared to the comparable prior year period.
  • Diluted earnings per share was $0.37, an increase of 2.8% compared to the comparable prior year period. Non-GAAP diluted earnings per share was $0.40, a decrease of 13.0% compared to the comparable prior year period.
  • Net cash provided by operating activities was $38.8 million.
  • DSO of 174 days, compared to 194 days for the comparable prior year period.
  • Inventory turnover days of 73 days, compared to 47 days for the comparable prior year period.

See the section entitled “Non-GAAP Measures” for more information about non-GAAP gross margin, non-GAAP net income attributable to Hollysys and non-GAAP diluted earnings per share.

BEIJING, Aug. 12, 2022 /PRNewswire/ — Hollysys Automation Technologies Ltd. (NASDAQ: HOLI) (“Hollysys” or the “Company”), a leading provider of automation and control technologies and applications in China, today announced its unaudited financial results for fiscal year 2022 and the fourth quarter ended June 30, 2022. Dr. Changli Wang, the CEO and director of Hollysys, stated:

“We are delighted to report another fiscal year and the fourth quarter with solid financial and operational performance and firmly adhered to our tenet of automation for better lives, even under an unfavorable environment of the COVID-19 pandemic which constantly brings challenges. We are confident with our outstanding technologies, satisfactory services and established huge customer bases. Looking forward, Hollysys will unswervingly make progress based on the united efforts of our motivated and inspired management team, experts and employees, and will embrace jointly with our customers and investors for a more prosperous and vigorous future.”

The Industrial Automation (“IA”) business maintained its strong momentum with increased market shares as Hollysys undertook more key and challenging projects, which are expected to relieve the pain points of relevant industries by enhancing the efficiency in operation and contribute to achieving the national carbon peaking and carbon neutrality goals. In the chemical and petrochemical field, we adhere to the development strategy of enhancing our focus on significant projects in addition to normal projects. For example, a one-million-ton ethylene project was signed in Tianjin in which we will provide over 100,000 and 20,000 input/output (“I/O”) points that will be connected to our Optical Bus Control System (“OCS”)—the new released version of Distributed Control System (“DCS”), and Safety Instrumented System (“SIS”), along with Gas Detection System (“GDS”), respectively. The success in signing this project proves that Hollysys is capable of supplying control systems for any chemical process, as the advanced control of ethylene is known as the most sophisticated and critical process in the industry. Meanwhile, we present remarkable achievements and maintain our cooperation with national key customers like Sinopec Group and China National Petroleum Corporation (“CNPC”). For instance, a contract of huge SCADA system for the Guangxi Long-distance Natural Gas Pipeline Project was signed with Sinopec. Additionally, Hollysys also provided CNPC with Hia Advanced Process Control (“Hia APC”) for producing 450,000 tons of synthetic ammonia / 800,000 tons of urea fertilizer, which as another milestone, was the first set of a 100% domestic control system application in the large chemical fertilizer industry in China.

We have also manifested remarkable performance and witnessed business growth in the valve and instrument market. For example, we signed with a world leading copper pipe and rod manufacturer for a Phase I project of 150,000 tons of high-performance copper foil, in which Hollysys provided holistic customized integrated, intelligent solutions, and over 4000 sets of various types of meters and valves. The project represents another milestone for Hollysys in electrical instrument installation engineering.

We continue our business growth by upgrading the capabilities of products in the pharmaceutical field. For example, a project for a pharmaceutical company was delivered in which Hollysys provided a customized intelligent control system based on HiaBatch. HiaBatch is remarkably flexible and efficient, which facilitates customers to operate more smartly and is highly recognized among customers in the industry. We successively signed new projects, including a Good Manufacturing Practice (“GMP”) Application Programming Interface (“API”) pilot test and production project along with the supply of DCS, SIS, electrical instrument and Batch Processing System (“BATCH”).

Meanwhile, we constantly upgrade our Engineering Procurement Construction (“EPC”) capacity. In the fourth fiscal quarter, we signed two breakthrough EPC projects regarding the whole workshop’s engineering, which the lays foundation for our further exploration of EPC projects in the future.

Our business has witnessed continuous development in Indonesia and other overseas markets, and our control system, instruments and technologies are widely recognized. We have signed with Indonesian companies a contract for an electrical instrument engineering project and an additional contract of Phase II DCS and electrical instruments. To further cultivate and grow our business in the Central and Southeast Asia market, Hollysys will persevere in attracting talented people, optimizing market promotion and enhancing its overseas brand image.

In the high-speed rail sector, we continued to deliver on existing projects while retaining our market position. We provided on-ground solutions for Xiangyang East-Wanzhou North high-speed railway and participated in the reconstruction of the Beijing Fengtai Hub, which is now Asia’s largest railway hub. Meanwhile, we continued to explore opportunities in service markets, covering replacement and overhaul, upgrades, spare parts sales, etc. The highlight for the service business is the successful launch of China’s fifth high-speed railway with an operating speed of 350 km/h, the Shijiazhuang-Wuhan High-speed Railway. In this project, Hollysys actively responded to our client’s demand for speed acceleration by upgrading the existing on-board and on-ground products. In the subway sector, our SCADA system for Kunming Subway Line 5 was successfully delivered. This marked another contribution of Hollysys to Kunming rail construction following the successful completion of the Kunming Subway Line 3 project and Kunming Changshui Airport Express project (“Kunming Airport project”),. In the subway signaling business, we won the automated people mover project of the T3B terminal and the fourth runway of Chongqing Jiangbei International Airport. This project, which follows our first subway signaling project—Kunming Airport project—represents another significant advancement for Hollysys in subway signaling. The project will utilize our proprietary GoA4 Fully Automatic Operation system and achieve effective and energy-saving operations. We are grateful for the industry recognition gained from our clients in the past year and we expect to make more contributions to China’s urban rail transit system in the future.

The mechanical and electrical solutions (“M&E”) segment of the Company manifests a stable performance with our smooth executions on various projects. The risk monitor and control will still be our future focus in this field.

With our continuous dedication to the industry and the support of experienced and passionate experts, we believe that we will continue to create greater value for our clients and shareholders.

Fiscal Year and the Fourth Quarter Ended June 30, 2022 Unaudited Financial Results Summary

(In USD thousands, except for %, number of shares and per share data)

Three months ended

June 30,

Fiscal year ended

June 30,

,

2022

2021

%
Change

2022

2021

%
Change

Revenues

$

182,115

158,764

14.7 %

$

707,462

593,466

19.2 %

    Integrated solutions contracts
revenue

$

149,292

126,237

18.3 %

$

573,567

460,180

24.6 %

    Products sales

$

11,823

7,098

66.6 %

$

38,486

28,667

34.3 %

    Service rendered

$

21,000

25,429

(17.4) %

$

95,409

104,619

(8.8) %

Cost of revenues

$

120,780

98,705

22.4 %

$

468,105

375,187

24.8 %

Gross profit

$

61,335

60,059

2.1 %

$

239,357

218,279

9.7 %

Total operating expenses

$

42,215

44,402

(4.9) %

$

164,813

131,034

25.8 %

    Selling

$

10,863

9,601

13.1 %

$

45,301

35,197

28.7 %

    General and administrative

$

23,323

30,260

(22.9) %

$

80,241

69,982

14.7 %

    Research and development

$

16,629

14,194

17.2 %

$

69,580

55,954

24.4 %

    VAT refunds and government
subsidies

$

(8,600)

(9,653)

(10.9) %

$

(30,309)

(30,099)

0.7 %

Income from operations

$

19,120

15,657

22.1 %

$

74,544

87,245

(14.6) %

Other income, net

$

256

6,863

(96.3) %

$

2,185

10,449

(79.1) %

Foreign exchange gain (loss)

$

4,000

(942)

(524.6) %

$

1,789

(6,219)

(128.8) %

Gains on disposal of investments in an
    equity investee

$

$

7,995

Impairment loss of investments in cost
    investees

$

(773)

$

(773)

Share of net income (loss) of equity
    investees

$

1,280

(1,331)

(196.2) %

$

1,838

604

204.3 %

Losses on disposal of subsidiaries

(3)

Gains on disposal of an investment in
    securities

$

3,323

(100.0) %

$

3,323

(100.0) %

Dividend income from investments in
    securities

$

456

(100.0) %

$

85

912

(90.7) %

Interest income

$

3,363

4,278

(21.4) %

$

12,698

14,131

(10.1) %

Interest expenses

$

(141)

(125)

12.8 %

$

(731)

(553)

32.2 %

Income tax expenses

$

3,928

6,317

(37.8) %

$

16,634

20,554

(19.1) %

Net income (loss) attributable to non-

    controlling interests

$

155

(75)

(306.7) %

$

(189)

(371)

(49.1) %

Net income attributable to Hollysys
     Automation Technologies Ltd.

$

23,022

21,937

4.9 %

$

83,182

89,709

(7.3) %

Basic earnings per share

$

0.38

0.36

5.6 %

$

1.36

1.48

(8.1) %

Diluted earnings per share

$

0.37

0.36

2.8 %

$

1.35

1.46

(7.5) %

Share-based compensation expenses

$

1,327

6,036

(78.0) %

$

9,709

9,724

(0.2) %

Amortization of acquired intangible
assets

$

353

90

292.2 %

$

1,356

316

329.1 %

Non-GAAP net income attributable to
     Hollysys Automation Technologies Ltd.(1)

$

24,702

28,063

(12.0) %

$

94,247

99,749

(5.5) %

Non-GAAP basic earnings per share(1)

$

0.40

0.46

(13.0) %

$

1.54

1.65

(6.7) %

Non-GAAP diluted earnings per share(1)

$

0.40

0.46

(13.0) %

$

1.53

1.62

(5.6) %

Basic weighted average number of
    ordinary shares outstanding

61,195,317

60,698,727

0.8 %

61,007,506

60,566,709

0.7 %

Diluted weighted average number of
    ordinary shares outstanding

61,788,905

61,025,425

1.3 %

61,568,176

61,513,749

0.1 %

________

(1) See the section entitled “Non-GAAP Measures” for more information about these non-GAAP measures.

Operational Results Analysis for the Fiscal Year Ended June 30, 2022

Compared to the prior fiscal year, the total revenues for fiscal year 2022 increased from $593.5 million to $707.5 million, representing an increase of 19.2%. Broken down by the revenue types, integrated solutions contracts revenue increased by 24.6% to $573.6 million, products sales revenue increased by 34.3% to $38.5 million, and services revenue decreased by 8.8% to $95.4 million.

The Company’s total revenues can also be presented by segment as shown in the table below:

(In USD thousands)

Fiscal year ended June 30,

2022

2021

$

% to Total
Revenues

$

% to Total
Revenues

Industrial Automation

439,918

62.2

337,052

56.8

Rail Transportation Automation

183,785

26.0

188,171

31.7

Mechanical and Electrical Solution

83,759

11.8

68,243

11.5

Total

707,462

100.0

593,466

100.0

Gross margin was 33.8% for fiscal year 2022, as compared to 36.8% for the prior fiscal year. Gross margins for integrated solutions contracts, product sales, and services rendered were 26.4%, 73.4% and 62.7% for fiscal year 2022, as compared to 26.9%, 81.5% and 68.1% for the prior fiscal year, respectively. Non-GAAP gross margin was 34.0% for fiscal year 2022, as compared to 36.8% for the prior fiscal year. Non-GAAP gross margin of integrated solutions contracts was 26.6% for fiscal year 2022, as compared to 27.0% for the prior fiscal year. See the section entitled “Non-GAAP Measures” for more information about non-GAAP gross margin and non-GAAP gross margin of integrated solutions contracts.

Selling expenses were $45.3 million for fiscal year 2022, representing an increase of $10.1 million, or 28.7%, compared to $35.2 million for the prior fiscal year. The increase was in line with our sales growth. Selling expenses as a percentage of total revenues were 6.4% and 5.9% for fiscal year 2022 and 2021, respectively. The increase of selling expenses was mainly due to the significant increase of sales scale year over year.

General and administrative expenses were $80.2 million for fiscal year 2022, representing an increase of $10.3 million, or 14.7%, compared to $70.0 million for the prior fiscal year, which was primarily due to a $7.5 million increase in credit losses and a $5.7 million increase in labor cost. Share-based compensation expenses were $9.7 million and $9.7 million for fiscal year 2022 and 2021, respectively. General and administrative expenses as a percentage of total revenues were 11.3% and 11.8% for fiscal year 2022 and 2021, respectively. 

Research and development expenses were $69.6 million for fiscal year 2022, representing an increase of $13.6 million, or 24.4%, compared to $56.0 million for the prior fiscal year, which was primarily due to our increased investments in research and development in connection with the upgrading of mainstream products and new products developed to meet the needs of the digital infrastructure market, such as the new generation DCS Macs V7, SIS Upgrade, OCS, smart factory and smart city rail. R&D expenses as a percentage of total revenues were 9.8% and 9.4% for fiscal year 2022 and 2021, respectively.

The VAT refunds and government subsidies were $30.3 million for fiscal year 2022, as compared to $30.1 million for the prior fiscal year, representing a $0.2 million, or 0.7%, increase.

The income tax expenses and the effective tax rate were $16.6 million and 16.7% for fiscal year 2022, as compared to $20.6 million and 18.7% for the prior fiscal year. The effective tax rate fluctuates, as the Company’s subsidiaries contributed different pre-tax income at different tax rates.

Net income attributable to Hollysys was $83.2 million for fiscal year 2022, representing a decrease of 7.3% from $89.7 million reported in the prior fiscal year. Non-GAAP net income attributable to Hollysys was $94.2 million or $1.53 per diluted share. See the section entitled “Non-GAAP Measures” for more information about non-GAAP net income attributable to Hollysys.

Diluted earnings per share was $1.35 for fiscal year 2022, representing a decrease of 7.5% from $1.46 in the prior fiscal year. Non-GAAP diluted earnings per share was $1.53 for fiscal year 2022, representing a decrease of 5.6% from $1.62 in the prior fiscal year. These were calculated based on 61.6 million and 61.5 million diluted weighted average ordinary shares outstanding for the fiscal year ended June 30, 2022 and 2021, respectively. See the section entitled “Non-GAAP Measures” for more information about non-GAAP diluted earnings per share.

Operational Results Analysis for the Fourth Quarter Ended June 30, 2022

Compared to the fourth quarter of the prior fiscal year, the total revenues for the three months ended June 30, 2022 increased from $158.8 million to $182.1 million, representing an increase of 14.7%. Broken down by the revenue types, integrated solutions contracts revenue increased by 18.3% to $149.3 million, products sales revenue increased by 66.6% to $11.8 million, and services revenue decreased by 17.4% to $21.0 million.

The Company’s total revenues can also be presented by segment as shown in the table below:

(In USD thousands)

Three months ended June 30,

2022

2021

$

% to Total
Revenues

$

% to Total
Revenues

Industrial Automation

121,771

66.9

94,779

59.7

Rail Transportation Automation

34,215

18.8

47,533

29.9

Mechanical and Electrical Solution

26,129

14.3

16,452

10.4

Total

182,115

100.0

158,764

100.0

Gross margin was 33.7% for the three months ended June 30, 2022, as compared to 37.8% for the same period of the prior fiscal year. Gross margin of integrated solutions contracts, product sales, and service rendered was 27.1%, 75.4% and 57.1% for the three months ended June 30, 2022, as compared to 27.8%, 84.3% and 74.6% for the same period of the prior fiscal year, respectively. Non-GAAP gross margin was 33.9% for the three months ended June 30, 2022, as compared to 37.9% for the same period of the prior fiscal year. Non-GAAP gross margin of integrated solutions contracts was 27.3% for the three months ended June 30, 2022, as compared to 27.9% for the same period of the prior fiscal year. See the section entitled “Non-GAAP Measures” for more information about non-GAAP gross margin and non-GAAP gross margin of integrated solutions contracts.

Selling expenses were $10.9 million for the three months ended June 30, 2022, representing an increase of $1.3 million, or 13.1%, compared to $9.6 million for the same period of the prior fiscal year. The increase was in line with our sales growth. Selling expenses as a percentage of total revenues were 6.0% and 6.0% for the three months ended June 30, 2022 and 2021, respectively.

General and administrative expenses were $23.3 million for the three months ended June 30, 2022, representing a decrease of $6.9 million, or 22.9%, compared to $30.3 million for the same period of the prior fiscal year, which was primarily due to a $7.4 million decrease in third-party consulting fees and a $4.7 million decrease in share-based compensation expenses. Share-based compensation expenses were $1.3 million and $6.0 million for the three months ended June 30, 2022 and 2021, respectively. General and administrative expenses as a percentage of total revenues were 12.8% and 19.1% for the three months ended June 30, 2022 and 2021, respectively. The decrease of G&A in the fourth quarter is mainly due to the lower third-party consulting fees year-over-year.

Research and development expenses were $16.6 million for the three months ended June 30, 2022, representing an increase of $2.4 million, or 17.2%, compared to $14.2 million for the same period of the prior fiscal year. Research and development expenses as a percentage of total revenues were 9.1% and 8.9% for the three months ended June 30, 2022 and 2021, respectively.

The VAT refunds and government subsidies were $8.6 million for three months ended June 30, 2022, as compared to $9.7 million for the same period in the prior fiscal year, representing a $1.1 million, or 10.9%, decrease.

The income tax expenses and the effective tax rate were $3.9 million and 14.5% for the three months ended June 30, 2022, respectively, as compared to $6.3 million and 22.4% for the comparable period in the prior fiscal year, respectively. The effective tax rate fluctuates, as the Company’s subsidiaries contributed different pre-tax income at different tax rates.

Net income attributable to Hollysys was $23.0 million for three months ended June 30, 2022, representing an increase of 4.9% from $21.9 million reported in the comparable period in the prior fiscal year. Non-GAAP net income attributable to Hollysys was $24.7 million or $0.40 per diluted share. See the section entitled “Non-GAAP Measures” for more information about non-GAAP net income attributable to Hollysys.

Diluted earnings per share was $0.37 for the three months ended June 30, 2022, representing an increase of 2.8% from $0.36 for the comparable period in the prior fiscal year. Non-GAAP diluted earnings per share was $0.40 for the three months ended June 30, 2022, representing a decrease of 13.0% from $0.46 for the comparable period in the prior fiscal year. These were calculated based on 61.8 million and 61.0 million diluted weighted average ordinary shares outstanding for the three months ended June 30, 2022 and 2021, respectively. See the section entitled “Non-GAAP Measures” for more information about non-GAAP diluted earnings per share.

Contracts and Backlog Highlights

Hollysys achieved $1,057.9 million and $289.9 million in terms of the value of new contracts for the fiscal year and the three months ended June 30, 2022, respectively. The order backlog of contracts was $944.3 million as of June 30, 2022. The order backlog of contracts represents the amount of unrealized revenue to be earned from the contracts that Hollysys won. The detailed breakdown of new contracts and backlog by segment is shown in the table below:

(In USD thousands, except for %)

Value of New contracts
achieved for the fiscal
year

 ended June 30, 2022

Value of New contracts
achieved for the three
months

 ended June 30, 2022

Backlog as of Jun 30,
2022

$

% of  Total
Contract
Value

$

% of Total
Contract
Value

$

% of Total
Backlog

Industrial Automation

582,776

55.1

193,980

67.0

384,805

40.7

Rail Transportation

303,819

28.7

79,524

27.4

359,301

38.1

Mechanical and Electrical Solutions

171,333

16.2

16,359

5.6

200,166

21.2

Total

1,057,928

100.0

289,863

100.0

944,272

100.0

Cash Flow Highlights

For the fiscal year ended June 30, 2022, the total net cash inflow was $23.5 million. The net cash provided by operating activities was $54.5 million. The net cash provided by investing activities was $13.3 million, mainly consisting of $100.6 million maturity of short-term investments, $3.8 million proceeds from disposal of a subsidiary, $9.5 million proceeds received from disposal of equity investments, which was partially offset by $26.4 million purchases of property, plant and equipment, $64.4 million purchases of short-term investments, and $8.7 million cash prepaid for acquisition of a subsidiary. The net cash used in financing activities was $19.6 million, mainly consisting of $19.8 million payment of dividends.

For the three months ended June 30, 2022, the total net cash inflow was $6.9 million. The net cash provided by operating activities was $38.8 million. The net cash provided by investing activities was $23.6 million, mainly consisting of $37.8 million maturity of short-term investments, which was partially offset by $7.3 million purchases of property, plant and equipment, $6.9 million purchases of short-term investments. The net cash used in financing activities was $19.4 million, mainly consisting of $19.8 million payment of dividends.

Balance Sheet Highlights

The total amount of cash and cash equivalents was $679.8 million, $669.8 million, and $664.3 million as of June 30, 2022, March 31, 2022, and June 30, 2021, respectively.

For fiscal year ended June 30, 2022, DSO were 171 days, as compared to 180 days from the prior year, and inventory turnover was 58 days, as compared to 51 days from the prior year.

For the three months ended June 30, 2022, DSO was 174 days, as compared to 194 days for the comparable prior fiscal year and 215 days for the last fiscal quarter; inventory turnover days were 73 days, as compared to 47 days for the comparable prior fiscal year and 69 days for the last fiscal quarter. The significant increase in inventories was mainly due to the company’s increase in safety stock in response to supply chain fluctuations.

Financial Performance Guidance

Based on information available as of the date of this press release, Hollysys provides the following financial performance guidance for the full fiscal year 2023: 

 –   The revenue is expected to be between $810 million and $885 million, with a year-on-year increase of 15% to 25%.

About Hollysys Automation Technologies Ltd.

Hollysys is a leading automation control system solutions provider in China, with overseas operations in eight other countries and regions throughout Asia. Leveraging its proprietary technology and deep industry know-how, Hollysys empowers its customers with enhanced operational safety, reliability, efficiency, and intelligence which are critical to their businesses. Hollysys derives its revenues mainly from providing integrated solutions for industrial automation and rail transportation automation. In industrial automation, Hollysys delivers the full spectrum of automation hardware, software, and services spanning field devices, control systems, enterprise manufacturing management and cloud-based applications. In rail transportation automation, Hollysys provides advanced signaling control and SCADA (Supervisory Control and Data Acquisition) systems for high-speed rail and urban rail (including subways). Founded in 1993, with technical expertise and innovation, Hollysys has grown from a research team specializing in automation control in the power industry into a group providing integrated automation control system solutions for customers in diverse industry verticals. As of June 30, 2021, Hollysys had cumulatively carried out more than 35,000 projects for approximately 20,000 customers in various sectors including power, petrochemical, high-speed rail, and urban rail, in which Hollysys has established leading market positions.

SAFE HARBOR STATEMENTS

This release contains forward-looking statements within the meaning of the Private Securities Litigation Reform Act of 1995. All statements, other than statements of historical fact included herein are “forward-looking statements,” including statements regarding the ability of the Company to achieve its commercial objectives; the business strategy, plans and objectives of the Company and its subsidiaries; and any other statements of non-historical information. These forward-looking statements are often identified by the use of forward-looking terminology such as “will,” “expects,” “anticipates,” “future,” “intends,” “plans,” “believes,” “estimates,” “target,” “confident,” or similar expressions, involve known and unknown risks and uncertainties. Such forward-looking statements, based upon the current beliefs and expectations of Hollysys’ management, are subject to risks and uncertainties, which could cause actual results to differ from the forward looking statements. Although the Company believes that the expectations reflected in these forward-looking statements are reasonable, they do involve assumptions, risks and uncertainties, and these expectations may prove to be incorrect. Investors should not place undue reliance on these forward-looking statements, which speak only as of the date of this press release. The Company’s actual results could differ materially from those anticipated in these forward-looking statements as a result of a variety of factors, including those discussed in the Company’s reports that are filed with the Securities and Exchange Commission and available on its website (http://www.sec.gov). All forward-looking statements attributable to the Company or persons acting on its behalf are expressly qualified in their entirety by these factors. Other than as required under the securities laws, the Company does not assume a duty to update these forward-looking statements.

For further information, please contact:

Hollysys Automation Technologies Ltd.
www.hollysys.com
+8610-58981386
investors@hollysys.com

HOLLYSYS AUTOMATION TECHNOLOGIES LTD.

CONSOLIDATED STATEMENTS OF INCOME AND COMPREHENSIVE INCOME

(In USD thousands except for number of shares and per share data)

Three months ended

Fiscal year ended

June 30,

June 30,

2022

2021

2022

2021

(Unaudited)

(Unaudited)

(Unaudited)

(Unaudited)

Net revenues

Integrated solutions contracts revenue

$

149,292

$

126,237

$

573,567

$

460,180

Products sales

11,823

7,098

38,486

28,667

Revenue from services

21,000

25,429

95,409

104,619

Total net revenues

182,115

158,764

707,462

593,466

Costs of integrated solutions contracts

108,866

91,142

422,236

336,471

Cost of products sold

2,913

1,115

10,247

5,293

Costs of services rendered

9,001

6,448

35,622

33,423

Gross profit

61,335

60,059

239,357

218,279

Operating expenses

Selling

10,863

9,601

45,301

35,197

General and administrative

23,323

30,260

80,241

69,982

Research and development

16,629

14,194

69,580

55,954

VAT refunds and government subsidies

(8,600)

(9,653)

(30,309)

(30,099)

Total operating expenses

42,215

44,402

164,813

131,034

Income from operations

19,120

15,657

74,544

87,245

Other income, net

256

6,863

2,185

10,449

Foreign exchange gain (loss)

4,000

(942)

1,789

(6,219)

Gains on disposal of an investment in an equity investee

7,995

Losses on disposal of subsidiaries

(3)

Gains on disposal of an investment in securities

3,323

3,323

Impairment loss of investments in cost investees

(773)

(773)

Share of net income (loss) of equity investees

1,280

(1,331)

1,838

604

Dividend income from investments in securities

456

85

912

Interest income

3,363

4,278

12,698

14,131

Interest expenses

(141)

(125)

(731)

(553)

Income before income taxes

27,105

28,179

99,627

109,892

Income taxes expenses

3,928

6,317

16,634

20,554

Net income

23,177

21,862

82,993

89,338

Less: Net income (loss) attributable to non-controlling interests

155

(75)

(189)

(371)

Net income attributable to Hollysys Automation

\Technologies Ltd.

$

23,022

$

21,937

$

83,182

$

89,709

Other comprehensive (loss) income, net of tax of nil

Translation adjustments

(67,103)

18,280

(46,590)

96,577

Comprehensive (loss) income

(43,926)

40,142

36,403

185,915

Less: comprehensive income (loss) attributable to non-
    controlling interests

64

(12)

(1,310)

(125)

Comprehensive (loss) income attributable to Hollysys
Automation Technologies Ltd.

$

(43,990)

$

40,154

$

37,713

$

186,040

Net income per ordinary share:

Basic

0.38

0.36

1.36

1.48

Diluted

0.37

0.36

1.35

1.46

Shares used in net income per share computation:

Basic

61,195,317

60,698,727

61,007,506

60,566,709

Diluted

61,788,905

61,025,425

61,568,176

61,513,749

HOLLYSYS AUTOMATION TECHNOLOGIES LTD.

CONSOLIDATED BALANCE SHEETS

(In USD thousands except for number of shares and per share data)

June 30,

March 31,

2022

2022

(Unaudited)

(Unaudited)

ASSETS

Current assets

Cash and cash equivalents

$

679,754

$

669,799

Short-term investments

12,203

44,085

Restricted cash

38,486

36,298

Accounts receivable, net of allowance for credit losses of $77,603 and $76,061 as
    of June 30, 2022 and March 31, 2022, respectively

317,763

360,589

Costs and estimated earnings in excess of billings, net of allowance for credit losses
    of $12,178 and $11,077 as of June 30, 2022 and March 31, 2022, respectively

228,877

220,645

Accounts receivable retention

6,005

6,002

Other receivables, net of allowance for credit losses of $12,449 and $15,798 as of
    June 30, 2022 and March 31, 2022, respectively

26,100

28,734

Advances to suppliers

33,851

32,348

Amounts due from related parties

27,360

21,064

Inventories

91,243

89,175

Prepaid expenses

667

756

Income tax recoverable

258

164

Total current assets

1,462,567

1,509,659

Non-current assets

Restricted cash

787

6,026

Costs and estimated earnings in excess of billings

3,021

2,648

Accounts receivable retention

6,561

5,850

Prepaid expenses

1

2

Property, plant and equipment, net

98,249

97,700

Prepaid land leases

12,447

13,135

Intangible assets, net

10,742

11,767

Investments in equity investees

46,581

42,152

Investments securities

1,693

2,576

Goodwill

20,539

20,822

Deferred tax assets

4,540

16,186

Operating lease right-of-use assets

4,045

4,447

Total non-current assets

209,206

223,311

Total assets

1,671,773

1,732,970

LIABILITIES AND STOCKHOLDERS’ EQUITY

Current liabilities

Short-term bank loans

66

Current portion of long-term loans

15,210

15,346

Accounts payable

173,953

176,849

Construction costs payable

92

98

Deferred revenue

206,222

211,593

Accrued payroll and related expenses

23,535

17,878

Income tax payable

4,509

9,068

Warranty liabilities

3,280

6,814

Other tax payables

11,587

4,443

Accrued liabilities

37,282

36,051

Amounts due to related parties

6,299

2,250

Other liability

3

3

Operating lease liabilities

2,518

2,224

Total current liabilities

484,556

482,617

Non-current liabilities

Accrued liabilities

3,349

2,047

Long-term loans

434

523

Accounts payable

1,556

1,338

Deferred tax liabilities

12,966

13,600

Warranty liabilities

1,722

2,618

Operating lease liabilities

1,282

1,912

Other liability

80

76

Total non-current liabilities

21,389

22,114

Total liabilities

505,945

504,731

Commitments and contingencies

Stockholders’ equity:

Ordinary shares, par value $0.001 per share, 100,000,000 shares authorized;
    61,962,449 shares and 61,962,249 shares issued and outstanding as of June 30,
    2022 and March 31, 2022, respectively

62

62

Additional paid-in capital

243,476

242,149

Statutory reserves

77,263

64,978

Retained earnings

857,141

866,215

Accumulated other comprehensive income

(12,655)

54,358

Total Hollysys Automation Technologies Ltd. stockholder’s equity

1,165,287

1,227,762

Non-controlling interests

541

477

Total equity

1,165,828

1,228,239

Total liabilities and equity

$

1,671,773

$

1,732,970

HOLLYSYS AUTOMATION TECHNOLOGIES LTD

CONSOLIDATED STATEMENTS OF CASH FLOWS

(In USD thousands).


Three months ended

Fiscal year ended

June 30, 2022

June 30, 2022

(Unaudited)

(Unaudited)

Cash flows from operating activities:

Net income

$

23,177

$

82,993

Adjustments to reconcile net income to net cash provided by operating activities:

Depreciation of property, plant and equipment

2,568

10,263

Amortization of prepaid land leases

70

382

Amortization of intangible assets

311

1,356

Allowance for credit losses

7,411

16,122

Gains on disposal of property, plant and equipment

(52)

(75)

Share of net income of equity investees

(1,280)

(1,838)

Share-based compensation expenses

1,327

9,709

Deferred income tax expenses

10,981

4,179

Losses on disposal of subsidiaries

3

3

Impairment loss on investment in a cost investee

773

773

Gains on disposal of an investment in an equity investee

25

(7,995)

Changes in operating assets and liabilities:

Accounts receivable and retention

12,682

(11,807)

Costs and estimated earnings in excess of billings

(20,444)

(39,839)

Inventories 

(6,636)

(40,007)

Advances to suppliers

(3,184)

(14,274)

Other receivables 

1,251

(3,425)

Prepaid expenses

80

257

Due from related parties

(8,528)

4,903

Accounts payable

5,570

28,470

Deferred revenue

5,541

19,221

Accruals and other payables

(146)

(16,417)

Due to related parties

4,049

4,638

Income tax payable

(4,373)

1,423

Other tax payables

7,650

5,511

Net cash provided by operating activities

38,826

54,526

Cash flows from investing activities:

Purchases of short-term investments

(6,937)

(64,383)

Purchases of property, plant and equipment

(7,291)

(26,369)

Proceeds from disposal of a subsidiary


3,797

Proceeds from disposal of property, plant and equipment

63

140

Maturity of short-term investments

37,813

100,562

Investment of an equity investee


(1,261)

Proceeds received from disposal of equity investments

9,497

Acquisition of a subsidiary, net of cash acquired

(8,726)

Net cash provided by investing activities

23,648

13,257

Cash flows from financing activities:

Proceeds from short-term bank loans

68

128

Repayments of short-term bank loans

1

(59)

Proceeds from long-term bank loans

537

876

Repayments of long-term bank loans

(151)

(673)

Payment of dividends

(19,828)

(19,828)

Net cash used in financing activities

(19,373)

(19,556)

Effect of foreign exchange rate changes

(36,197)

(24,747)

Net increase in cash, cash equivalents and restricted cash

$

6,904

23,480

Cash, cash equivalents and restricted cash, beginning of period

$

712,123

695,547

Cash, cash equivalents and restricted cash, end of period

719,027

719,027

Non-GAAP Measures

To supplement our consolidated financial statements, which are prepared and presented in accordance with GAAP, in evaluating our results, we use the following non-GAAP financial measures: non-GAAP gross profit and non-GAAP gross margin, non-GAAP gross profit and non-GAAP gross margin of integrated solutions contracts, non-GAAP net income attributable to Hollysys Automation Technologies Ltd., as well as non-GAAP basic and diluted earnings per share.

These non-GAAP financial measures serve as additional indicators of our operating performance and not as any replacement for other measures in accordance with U.S. GAAP. We believe these non-GAAP measures help identify underlying trends in the Company’s business that could otherwise be distorted by the effect of the share-based compensation expenses, which are calculated based on the number of shares or options granted and the fair value as of the grant date, and amortization of acquired intangible assets. They will not result in any cash inflows or outflows. We believe that using non-GAAP measures help our shareholders to have a better understanding of our operating results and growth prospects.

Non-GAAP gross profit and non-GAAP gross margin, non-GAAP gross profit and non-GAAP gross margin of integrated solutions contracts, non-GAAP net income attributable to Hollysys Automation Technologies Ltd., as well as non-GAAP basic and diluted earnings per share should not be considered in isolation or construed as an alternative to gross profit and gross margin, gross profit and gross margin of integrated solutions contracts, net income attributable to Hollysys Automation Technologies Ltd., basic and diluted earnings per share, or any other measure of performance, or as an indicator of the Company’s operating performance. Investors are encouraged to review the historical non-GAAP financial measures to the most directly comparable GAAP measures. Non-GAAP gross profit and gross margin, non-GAAP gross profit and non-GAAP gross margin of integrated solutions contracts, non-GAAP net income attributable to Hollysys Automation Technologies Ltd., as well as non-GAAP basic and diluted earnings per share presented here may not be comparable to similarly titled measures presented by other companies. Other companies may calculate similarly titled measures differently, limiting their usefulness as comparative measures to the Company’s data. The Company encourages investors and others to review the Company’s financial information in its entirety and not rely on a single financial measure.

We define non-GAAP gross profit and non-GAAP gross margin as gross profit and gross margin, respectively, adjusted to exclude non-cash amortization of acquired intangibles. The following table provides a reconciliation of our gross profit and gross margin to non-GAAP gross profit and non-GAAP gross margin for the periods indicated.

(In USD thousands, except for %)

Three months ended

Fiscal year ended

June 30,

June 30,

2022

2021

2022

2021

(Unaudited)

(Unaudited)

(Unaudited)

(Unaudited)

Gross profit

$

61,335

$

60,059

$

239,357

$

218,279

Gross margin(1)

33.7 %

37.8 %

33.8 %

36.8 %

Add:

  Amortization of acquired intangible assets

353

90

1,356

316

Non-GAAP gross profit

$

61,688

$

60,149

$

240,713

$

218,595

Non-GAAP gross margin(2)

33.9 %

37.9 %

34.0 %

36.8 %

__________

(1)           Gross margin represents gross profit for the period as a percentage of revenues for such period.

(2)           Non-GAAP gross margin represents non-GAAP gross profit for the period as a percentage of revenues for such period.

We define non-GAAP gross profit and non-GAAP gross margin of integrated solutions contracts as gross profit and gross margin of integrated solutions contracts, respectively, adjusted to exclude non-cash amortization of acquired intangibles associated with integrated solutions contracts. The following table provides a reconciliation of the gross profit of integrated solutions contracts to non-GAAP gross profit and non-GAAP gross margin of integrated solutions contracts for the periods indicated.

(In USD thousands, except for %)

Three months ended June 30,

Fiscal year ended June 30,

2022

2021

2022

2021

(Unaudited)

(Unaudited)

(Unaudited)

(Unaudited)

Gross profit of integrated
    solutions contracts

$

40,426

$

35,095

$

151,331

$

123,709

Gross margin of integrated

    solutions contracts(1)

27.1 %

27.8 %

26.4 %

26.9 %

Add:

  Amortization of acquired intangible
    assets

353

90

1,356

316

Non-GAAP gross profit of
    integrated solutions contracts

$

40,779

$

35,185

$

152,687

$

124,025

Non-GAAP gross margin of
    integrated solutions contracts(2)

27.3 %

27.9 %

26.6 %

27.0 %

__________

(1)           Gross margin of integrated solutions contracts represents gross profit of integrated solutions contracts for the period as a percentage of integrated solutions contracts revenue for such period.

(2)           Non-GAAP gross margin of integrated solutions contracts represents non-GAAP gross profit of integrated solutions contracts for the period as a percentage of integrated solutions contracts revenue for such period.

We define non-GAAP net income attributable to Hollysys as net income attributable to Hollysys adjusted to exclude the share-based compensation expenses and non-cash amortization of acquired intangible assets. The following table provides a reconciliation of net income attributable to Hollysys to non-GAAP net income attributable to Hollysys for the periods indicated.

(In USD thousands)

Three months ended

Fiscal year ended

June 30,

June 30,

2022

2021

2022

2021

(Unaudited)

(Unaudited)

(Unaudited)

(Unaudited)

Net income attributable to Hollysys Automation
    Technologies Ltd.

$

23,022

$

21,937

$

83,182

$

89,709

Add:

Share-based compensation expenses

1,327

6,036

9,709

9,724

Amortization of acquired intangible assets

353

90

1,356

316

Non-GAAP net income attributable to Hollysys
    Automation Technologies Ltd.

$

24,702

$

28,063

$

94,247

$

99,749

Non-GAAP basic (or diluted) earnings per share represents non-GAAP net income attributable to Hollysys divided by the weighted average number of ordinary shares outstanding during the periods (or on a diluted basis). The following table provides a reconciliation of our basic (or diluted) earnings per share to non-GAAP basic (or diluted) earnings per share for the periods indicated.

(In USD thousands, except for number of shares and per share data)

Three months ended

Fiscal year ended

June 30,

June 30,

2022

2021

2022

2021

(Unaudited)

(Unaudited)

(Unaudited)

(Unaudited)

Net income attributable to Hollysys 
    Automation Technologies Ltd.

$

23,022

$

21,937

$

83,182

$

89,709

Add:

Share-based compensation expenses

1,327

6,036

9,709

9,724

Amortization of acquired intangible assets

353

90

1,356

316

Non-GAAP net income attributable to
    Hollysys Automation Technologies
    Ltd.

$

24,702

$

28,063

$

94,247

$

99,749

Weighted average number of basic ordinary
    shares

61,195,317

60,698,727

61,007,506

60,566,709

Weighted average number of diluted ordinary
    shares

61,788,905

61,025,425

61,568,176

61,513,749

Basic earnings per share(1)

$

0.38

$

0.36

$

1.36

$

1.48

Add:
    Non-GAAP adjustments to net income per

    share(2)

0.02

0.10

0.18

0.17

    Non-GAAP basic earnings per share(3)

$

0.40

$

0.46

$

1.54

$

1.65

Diluted earnings per share(1)

$

0.37

$

0.36

$

1.35

$

1.46

Add:
    Non-GAAP adjustments to net income per
    share(2)

0.03

0.10

0.18

0.16

Non-GAAP diluted earnings per share(3)

$

0.40

$

0.46

$

1.53

$

1.62

________

(1)           Basic (or diluted) earnings per share is derived from net income attributable to ordinary shareholders for computing basic (or diluted) earnings per share divided by weighted average number of shares (or on a diluted basis).

(2)           Non-GAAP adjustments to net income per share are derived from non-GAAP adjustments to net income divided by weighted average number of shares (or on a diluted basis).

(3)           Non-GAAP basic (or diluted) earnings per share is derived from non-GAAP net income attributable to ordinary shareholders for computing non-GAAP basic (or diluted) earnings per share divided by weighted average number of shares (or on a diluted basis).

Cision View original content:https://www.prnewswire.com/news-releases/hollysys-automation-technologies-reports-unaudited-financial-results-for-the-fiscal-year-and-the-fourth-quarter-ended-june-30-2022-301604882.html

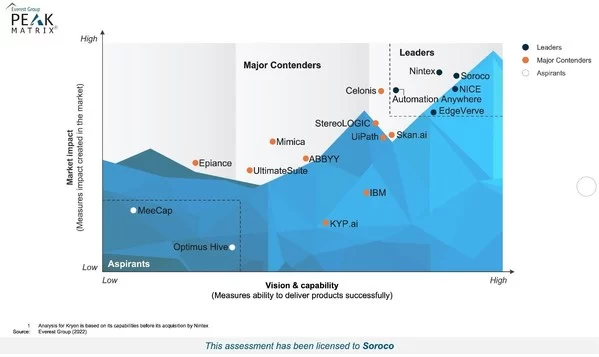
Soroco Named a Leader in Everest Group’s PEAK Matrix® for Task Mining Technology Provider 2022

BOSTON, Aug. 9, 2022 /PRNewswire/ — Soroco, the world’s first work graph company, has been named a Leader in the first-ever Task Mining Products PEAK Matrix® Assessment 2022 released by Everest Group, a leading research and analyst firm. The evaluation was based on specific criteria that analyzed the company’s flagship product, Scout for its market impact, vision, and capability.

Everest Group Task Mining Products PEAK Matrix® Assessment 2022[1]

There is a new category of enterprise software that relies on a previously untapped data source — human-computer interactions emanating from daily work. Today, over 60% of this data originates from millions of interactions teams and users have across applications, emails, chats, and documents at work.

This undocumented and unstructured data from human-computer interactions is key to unlocking tremendous business value and accelerating data-based digital transformation programs. This data enables organizations to build a map of how their teams get work done and use it to power their digital transformation programs.

“We are very happy to be recognized by Everest Group as a Leader,” said Samson David, CEO, Soroco. “This recognition reflects our dedication to delivering a powerful work graph platform that provides a 360-degree view into the last mile of work to teams and organizations and empowers them with structured insights – the key lever for driving the business forward and architecting transformation initiatives. Our vast experience in the enterprise sector and our extended partner ecosystem is helping organizations to reimagine the way work gets done and enables them to remain competitive in the digital landscape.” 

According to Amardeep Modi, Vice President, Everest Group, “Soroco’s task mining product strategy is aimed at helping enterprises understand how teams execute work and strengthen businesses in their digital transformation initiatives.”  He further added, “Its position as a Leader in Everest Group’s Task Mining Products PEAK Matrix® Assessment 2022 is underpinned by its strong market vision, focus on product innovation and customer success, depth and breadth of product functionalities, and high value delivered to its clients.”

Everest Group’s Task Mining PEAK Matrix Assessment 2022 includes 17 technology providers within the task mining industry. The report consists of PEAK Matrix, which classifies task mining providers into Leaders, Major Contenders, and Aspirants. Leaders have demonstrated high overall market impact, strong vision, and capability to respond to the demand for holistic task mining solutions.  

Soroco leads the category because of its focus on enterprise-scale needs serving 1000s of users in each customer, which includes:

  • Privacy-aware data capture with zero IT integration: Patented deep capture technology to capture millions of interactions while protecting end-user privacy, flexible PII filtering, and being aligned to GDPR compliance.
  • Discovery, insights, and extensibility: Discovering patterns of work specific to each team, AI-driven recommendations on ROI and optimization levers, and APIs to extend new insights via BI tools such as Power BI.
  • Flexible hosting: Built cloud-native to scale – available in both PaaS and SaaS.

Soroco’s Scout, a work graph platform, is uniquely positioned to help enterprises to drive actionable and structured insights from this huge, untapped data source and improve the digital experiences of users and teams.   

About Soroco  

Soroco is building the world’s first and most bleeding-edge work graph platform. We are a deep tech company with ~40 patents. Our flagship product Scout, powered by the work graph, provides near real-time insights into how work gets done on the ground and helps enterprises in their transformation journey.

Clarivate Selected by Singapore’s National Library Board to Play a Part in Building Libraries of the Future


Providing software solutions from Innovative for library staff and patrons across the country

LONDON, Aug. 8, 2022 /PRNewswire/ — Clarivate Plc (NYSE: CLVT), a global leader in providing trusted information and insights to accelerate the pace of innovation, has been selected by The National Library Board of Singapore (NLB) to provide library software solutions from Innovative, part of Clarivate, to support NLB’s Libraries and Archives Blueprint 2025 (LAB25).

Under the contract, the Polaris Integrated Library System (ILS) and Vega Discover applications from Innovative will be used by NLB as automation solutions for its library staff and patrons across Singapore. These solutions will help to improve the library experience for staff and patrons, whether in the library or online.

With decades of experience, Innovative has implemented and supported systems in some of the largest public libraries around the world. This expertise paired with a shared vision of a personalized library experience, proved to the NLB that Innovative is committed to redefining the standards of library automation and discovery for decades to come.

“We are very proud to provide our solutions as critical components in accelerating progress by bringing NLB’s blueprint for the future of libraries to life,” said Jerre Stead, Executive Chair and Chief Executive Officer, Clarivate. “At Clarivate, our mission is to help customers solve some of the world’s most complex problems and providing our solutions to NLB is another great example of how we help our customers reimagine the future.”

Established in 1995, the National Library Board, Singapore, promotes reading, learning and history through its network of libraries, the National Library and the National Archives of Singapore. LAB25 (Libraries and Archives Blueprint 2025) is an NLB initiative to collaborate with partners and the community to reimagine libraries and archives in Singapore.

About Clarivate

Clarivate™ is a global leader in providing solutions to accelerate the pace of innovation. Our bold mission is to help customers solve some of the world’s most complex problems by providing actionable information and insights that reduce the time from new ideas to life-changing inventions in the areas of Academia & Government, Life Sciences & Healthcare, Professional Services and Consumer Goods, Manufacturing & Technology. We help customers discover, protect and commercialize their inventions using our trusted subscription and technology-based solutions coupled with deep domain expertise. For more information, please visit clarivate.com.

Media contact:

Amy Bourke-Waite
External Communications Director (Academia and Government)
newsroom@clarivate.com

Logo – https://techent.tv/wp-content/uploads/2022/08/clarivate-selected-by-singapores-national-library-board-to-play-a-part-in-building-libraries-of-the-future.jpg

Baidu to Report Second Quarter 2022 Financial Results on August 30, 2022

BEIJING, Aug. 5, 2022 /PRNewswire/ — Baidu, Inc. (Nasdaq: BIDU; HKEX: 9888) (“Baidu” or the “Company”), a leading AI company with strong Internet foundation, today announced that it will report its financial results for the Second Quarter 2022 ended June 30, 2022, before the U.S. market opens on August 30, 2022. Baidu’s management will hold an earnings conference call at 8:00 AM on August 30, 2022, U.S. Eastern Time (8:00 PM on August 30, 2022, Beijing Time).

Please register in advance of the conference call using the link provided below. It will automatically direct you to the registration page of “Baidu Inc Q2 2022 Earnings Conference Call”. Please follow the steps to enter your registration details, then click “Register”. Upon registering, you will then be provided with the dial-in number, the passcode, and your unique access PIN. This information will also be emailed to you as a calendar invite.

For pre-registration, please click:
https://s1.c-conf.com/diamondpass/10024320-jfgv94.html

In the 10 minutes prior to the call start time, you may use the conference access information (including dial-in number(s), the passcode and unique access PIN) provided in the calendar invite that you have received following your pre-registration.

Additionally, a live and archived webcast of this conference call will be available at https://ir.baidu.com

A replay of the conference call may be accessed by phone at the following number until September 7, 2022:
US: 1855 883 1031
Reply PIN: 10024320

About Baidu

Founded in 2000, Baidu’s mission is to make the complicated world simpler through technology. Baidu is a leading AI company with strong Internet foundation, trading on Nasdaq under “BIDU” and the HKEX under “9888.” One Baidu ADS represents eight Class A ordinary shares.

Cision View original content:https://www.prnewswire.com/news-releases/baidu-to-report-second-quarter-2022-financial-results-on-august-30-2022-301600662.html

Source: Baidu, Inc.