Tag Archives: STW

Nintex Honours Top Partners with 2022 Nintex Partner Awards


Eighteen leading channel partners recognised for driving digital transformation to help organisations deliver business outcomes across every major industry, with the Nintex Process Platform

AUCKLAND, New Zealand, Sept. 28, 2022 /PRNewswire/ — Nintex, the global standard for process intelligence and automation, today announced the regional winners of the 2022 Nintex Partner Awards across AMER, APAC and EMEA.

18 leading channel partners recognized for driving digital transformation to help organizations deliver business outcomes across every major industry, with the Nintex Process Platform.

“Every 2022 Nintex Partner Award winner has consistently displayed invaluable expertise, helping organisations to reimagine the way they work with the ease and power of the Nintex platform,” said Eric Johnson, Nintex Chief Executive Officer. “This year’s award-winning group of channel partners has an unwavering commitment to help companies digitise their critical business processes, to meet their individual businesses challenges.”

Nintex Partner Award winners were selected based on measurable, high-impact business results and continuous process improvements for public and private sector organisations across every industry and geographic region during Nintex’s fiscal year 2022, extending from 1 July 2021 to 30 June 2022.

2022 Nintex Partner Award winners by category and region include:

Business Excellence – bringing the Nintex Process Platform to new organisations:          

  • AMER: Protiviti, Inc.
  • EMEA: Sure Global Technology
  • APAC: Myriad Technologies

Customer Success – supporting long-term adoption and success of the Nintex Process Platform:

  • AMER: BOOST Strategy Partners
  • EMEA: Data One GmbH
  • APAC: Alrighty Labs

Business Acceleration – strong expansion of automation subscriptions year-over-year:

  • AMER: ImageTech Systems
  • EMEA: Interactive Saudi Arabia Ltd
  • APAC: Cumulus International Co

Regional Spotlight – regional market impact and momentum with customers:

  • AMER: InnoVelocity
  • EMEA: S A Partners
  • APAC: ACW Solutions

Business Transformation – top customer entries to the 2022 Nintex Solution Innovation Awards

  • AMER: Elantis
  • EMEA: SakalGB
  • APAC: rapidMation

Nintex Workflow Cloud Upgrades – for driving generational upgrades to Nintex Workflow Cloud

  • AMER: ImageTech Systems, LLC
  • EMEA: IOZ AG
  • APAC: PlanB Consulting

Learn more about the Nintex Partner Network by visiting https://partner.nintex.com/. 

Media Contact
Laetitia Smith
laetitia.smith@nintex.com
cell: +64 21 154 7114                                                                                                              

About Nintex
Nintex is the global standard for process intelligence and automation. Today more than 10,000 public and private sector organisations across 90 countries turn to the Nintex Process Platform to accelerate progress on their digital transformation journeys by quickly and easily managing, automating and optimising business processes. Learn more by visiting www.nintex.com and experience how Nintex and its global partner network are shaping the future of Intelligent Process Automation (IPA).

Product or service names mentioned herein may be the trademarks of their respective owners.

Photo – https://techent.tv/wp-content/uploads/2022/09/nintex-honours-top-partners-with-2022-nintex-partner-awards.jpg
Logo – https://techent.tv/wp-content/uploads/2022/09/nintex-honours-top-partners-with-2022-nintex-partner-awards-1.jpg

Amazon Leads as Top Channel for Product Research, According to New Data from ChannelAdvisor


Survey Shows that 75% of Australian Consumers Regularly Shop On Multiple Online Marketplaces

A survey of over 5,000 global consumers provides brands and retailers with actionable insights into when, where and how they shop online, ahead of the festive season

MELBOURNE, Australia, Sept. 26, 2022 /PRNewswire/ — ChannelAdvisor Corporation (NYSE: ECOM), a leading provider of cloud-based e-commerce solutions, today released the results of its 2022 E-Commerce Consumer Survey, which gauged the shopping behaviours of over 5,000 respondents in Australia, U.S. and Europe. The global survey found consumers in Australia trust a brand’s website and marketplaces for product research, with social media found to be the least trusted platform.

The results of the survey offer brands and retailers actionable insights into the current perspectives of online shoppers and found 50% of consumers in Australia trust a brand’s website or marketplaces (44%) for product research, compared to just 6% who trust social media.

Despite this lack of trust in social media, 29% of respondents said they discovered products through sites like Instagram and TikTok.

Survey participants shared their preferences for online marketplaces and retailer sites they visit to research and purchase products while weighing factors such as product selection and delivery methods.  The survey results also revealed how inflation and rising costs are affecting consumer purchasing decisions and their priorities when conducting online research before or during an in-store shopping experience.

“To stay competitive and agile in this changing environment, brands and retailers must first understand how, where and why consumers are shopping,” said Mike Shapaker, chief marketing officer at ChannelAdvisor. “These survey results provide valuable insights that will help empower sellers to gain strategies to help capture consumer attention as the festive season approaches.”

Key findings that emerged from this year’s survey data include:

  • The majority of Australian consumers are shopping on more than one marketplace
  • Retail Media ads are influencing consumer purchase decisions
  • The 2022 festive season will continue to involve heavy online research and purchasing activity

Australian trends indicate shopping journeys involve more activity across retail sites and marketplaces

  • 85% of global consumers use multiple digital touchpoints during their buying journey
  • 75% of consumers tend to use multiple marketplaces on a regular basis for browsing, shopping or buying
    • 20% of consumers regularly use three marketplaces on a regular basis for browsing, shopping or buying, and 16% use 4 or more
  • 50% of consumers have purchased an item from a foreign retail site or marketplace in the past 12 months
    • These purchases are more frequent among younger consumers (63% of 18- to 25-year-olds) than older consumers (32% of consumers aged 65+)
  • 54% of Australian consumers have used click and collect in the past 12 months

Marketplaces are the most common channels to discover new products

  • 88% of Australian consumers browse items on marketplaces or retail sites without the direct intention to purchase something
  • 43% of Australian consumers “discovered” products they’ve purchased in the past 12 months by browsing marketplaces

Retail media advertising is becoming essential to increase product awareness

  • 39% of Australian consumers have clicked on a sponsored or promoted ad that they saw on a marketplace or retail site in the past 12 months
    • This activity is higher among younger shoppers (55% of consumers aged 18-25 and 48% of consumers aged 26-35)
  • 28% of consumers have purchased an item on Amazon after seeing an ad for that product on Amazon

Google remains the top channel for product research in Australia

  • In the past 12 months, consumers have researched products on these sites*
    • Facebook: 41%
    • Instagram: 28%
    • Google: 85%
    • Amazon: 56%
    • eBay: 71%

Pricing is a major factor for Australian consumers before making a purchase:

  • 86% of consumers usually compare prices before making a purchase
  • 98% of consumers consider price a somewhat or very important factor in product selection
  • 65% of consumers indicated their reason for researching products online before or during shopping in-store “often” involves checking prices

The 2022 Australian festive season will continue to involve heavy online research and purchasing activity:

  • 84% of consumers plan to spend the same amount of time or more shopping for festive gifts online compared to last year
  • 26% of 18- to 25-year-old consumers plan to conduct festive shopping research on social media sites

Click here to view the entire report of survey results.

Survey Methodology

ChannelAdvisor commissioned leading research firm Dynata to survey 5,000 consumers in the U.S., U.K., France, Germany and Australia about their online shopping and research habits in 2022. Respondents, who ranged in ages from 18 to 65, were screened and sampled in partnership with Dynata. There were 1,000 respondents in the Australian segment.

To learn more about industry insights from this recent consumer survey, including holiday and category-specific results, view ChannelAdvisor’s on-demand webinar.

For more details about ChannelAdvisor, visit ChannelAdvisor’s blog, follow ChannelAdvisor on Twitter @ChannelAdvisor, like ChannelAdvisor on Facebook and connect with ChannelAdvisor on LinkedIn.

About ChannelAdvisor

ChannelAdvisor (NYSE: ECOM) is a leading multichannel commerce platform whose mission is to connect and optimise the world’s commerce. For over two decades, ChannelAdvisor has helped brands and retailers worldwide improve their online performance by expanding sales channels, connecting with consumers across the entire buying cycle, optimising their operations for peak performance, and providing actionable analytics to improve competitiveness. Thousands of customers depend on ChannelAdvisor to securely power their e-commerce operations on channels such as Amazon, eBay, Google, Facebook, Walmart, and hundreds more. For more information, visit www.channeladvisor.com.au/.

ChannelAdvisor Media Contact
Helen de Souza 
helen.desouza@channeladvisor.com  
+61 3 9034 3412

Logo – https://techent.tv/wp-content/uploads/2022/09/amazon-leads-as-top-channel-for-product-research-according-to-new-data-from-channeladvisor.jpg  

Huawei Hosts the 9th Global Rail Summit in Berlin

BERLIN, Sept. 24, 2022 /PRNewswire/ — In parallel with InnoTrans 2022, Huawei held the 9th Huawei Global Rail Summit, themed “Driving Digitalization in Future Rail, Create New Value Together”. The summit brought together global industry leaders, ecosystem partners, and technical experts to discuss the future of the rail industry.

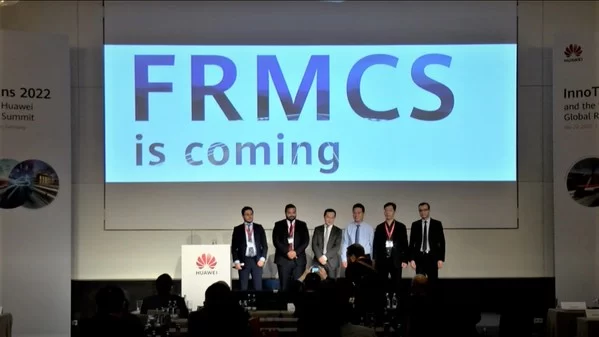
At the summit, Huawei launched the Future Railway Mobile Communication System (FRMCS) Solution, which aims to help build a more secure, efficient, and smarter railway mobile communications system. Mr. Wang Guoyu, COO of Huawei Aviation & Rail BU, and other guests attended the launch.

Launch of Huawei's FRMCS Solution
Launch of Huawei’s FRMCS Solution

“Huawei helps customers go digital. We use innovative technologies — such as FRMCS, Wi-Fi 6, and all-optical networks — to reshape connections, reconstruct digital platforms, and facilitate data sharing and collaboration across multiple service systems in the rail industry. We hope to enable intelligent rail operations and O&M through joint innovation with our partners.” said Mr. Xiang Xi, Vice President of Huawei Aviation & Rail BU.

Adhering to the concept of openness and cooperation, Huawei is committed to driving digital transformation along with rail customers and ecosystem partners. We complement each other’s strengths, innovate together, explore industry standards, and build an ecosystem for rail digitalization.

At the summit, Jeffrey Sim, CEO of SBS Transit Rail Business, explained the company’s digital journey. Vincenzo Bloise, International Sales Director of Almaviva, introduced how modern ICT solutions can boost digitalization in railways and Mr. Li Jie, President of Huawei Enterprise Wireless Domain, demonstrated how Huawei’s FRMCS solution enables railway digitalization. In addition, Steven Xiong, CTO for the rail industry of Huawei Aviation & Rail BU, delivered a keynote speech titled “Driving Digitalization in Future Rail, Create New Value Together” and shared industry digitalization cases.

Huawei exhibited its innovative solutions and flagship products for the rail industry at InnoTrans 2022. These include leading ICT infrastructure, green energy, smart urban rail, and smart railway solutions.

Huawei aims to reshape rail connectivity and enable secure, intelligent, green, and sustainable development. We will continue to dive into innovative practices and deploy its leading ICTs to lay a digital foundation for the industry. Huawei will build smart applications in collaboration with our partners, steadily advancing industry digital transformation.

Huawei Launches FRMCS Solution to Facilitate Digital Transformation of Railway

BERLIN, Sept. 23, 2022 /PRNewswire/ — Huawei officially launched the Future Railway Mobile Communication System (FRMCS) solution at the InnoTrans 2022 and the 9th Huawei Global Rail Summit in Berlin, Germany, where special guests, Wang Guoyu, COO of Huawei Aviation & Rail BU, and Li Jie, President of Huawei Enterprise Wireless Domain, spoke about its success. This solution is a remarkable achievement for Huawei, as a result of its extensive research and experience in ICT deployment within the railway industry of over two decades. With a focus on improving safety and reliability, Huawei FRMCS expands train-to-ground wireless services from train control and dispatch to railway O&M, railway IoT, and more. It empowers widespread digital transformation of the rail sector, ensures train operation safety, and improves railway operations efficiency.

Huawei launches the FRMCS solution

The demand for smart railways that can carry huge capacity is growing. Huawei FRMCS can not only provide the required high reliability and low latency for train control and dispatch, but also support new services such as locomotive status monitoring, train operation monitoring, and visualized dispatch of O&M personnel, improving fault prediction accuracy and O&M efficiency.

The FRMCS solution uses a new technology, 8T8R Smart MIMO, which allows it to achieve the same coverage in the 1900 MHz band as that of GSM-R in the 900 MHz band when working with high-power devices from Huawei’s partners. This slashes deployment and maintenance costs of FRMCS on 1900 MHz and simplifies the deployment of FRMCS networks. By providing three levels of redundancy, including key boards, key network elements, and wireless networks, Huawei FRMCS eliminates single-point failures on networks, ensures high reliability of devices and networks, and meets the requirements of the European Train Control System (ETCS). Its architecture complies with railway industry standards, which facilitates the interconnection between wireless networks and railway industry applications, as well as the deployment of new services.

Li Jie said: “The railway industry is now in a critical period of digital transformation when the requirements for train-to-ground wireless communication systems are higher than ever before. Huawei FRMCS can meet these requirements by integrating Huawei’s 4G and 5G technologies. It can help railway customers build high-reliability, high-bandwidth, future-oriented train-to-ground wireless broadband networks that are safe, reliable, converged, simplified, and capable of long-term evolution.”

Huawei will work with industry standards organizations, industry customers, and partners to promote the maturing and large-scale commercial rollout of FRMCS, and build a wireless digital foundation for smart railways.

Ant Group listed as a Representative Vendor in the 2022 Gartner® Market Guide for Multiexperience Development Platforms

SINGAPORE, Sept. 23, 2022 /PRNewswire/ — Ant Group has been mentioned as a Representative Vendor in the latest Gartner Market Guide for Multi experience Development Platforms, published in August, 2022. It was recognized for its mPaaS, a one-stop mobile development solution.

According to the report, “an MXDP is an opinionated, integrated set of front-end development tools and “backend for frontend” (BFF) capabilities. It enables a distributed, scalable development approach (in terms of both teams and architecture) to build fit-for-purpose apps across digital touchpoints and interaction modalities.”

Ant Group’s mPaaS solution, which provides a cloud-to-end, one-stop solution for mobile development, can generate initialization code and offer the modular development mode for collaborative development. This lowers technological barriers, reduces R&D costs, increases development efficiency, and enables the enterprise to quickly build a stable, high-quality mobile App.

“Multi experience development platforms enable delivery of a consistent user experience across multiple devices, touchpoints and modalities.” stated the Market Guide, and Gartner forecasts that by 2025, the MXDP market will reach $4.7 billion.

Fudian Bank, a Yunnan province joint-stock commercial bank, launched its new app powered by mPaaS in January 2022. This enabled the bank to offer more diverse operational functions and enrich the business use cases on their app. In May, the number of new mobile banking customers surged by 305% year on year, while MAU increased by 52%.

mPasS has served more than 100 financial institutions, and over 2,000 public cloud companies, including Fudian Bank, China CITIC Bank International, New China Life Insurance, Shanghai Metro and so on.

“We are committed to offering our years of expertise to the industry and help our customers in developing effective and reliable mobile services.” Said Bin Yu, Vice President of Digital Technology Business Group, Ant Group.

Gartner, Market Guide for Multiexperience Development Platforms, Adrian Leow, Jason Wong, August 2022.

Gartner does not endorse any vendor, product or service depicted in its research publications, and does not advise technology users to select only those vendors with the highest ratings or other designation. Gartner research publications consist of the opinions of Gartner’s research organization and should not be construed as statements of fact. Gartner disclaims all warranties, expressed or implied, with respect to this research, including any warranties of merchantability or fitness for a particular purpose. Gartner is a registered trademark and service mark of Gartner, Inc. and/or its affiliates in the U.S. and internationally and is used herein with permission. All rights reserved.

About mPaaS

mPaaS (Mobile PaaS) is a mobile development platform developed by Ant Goup, which provides clients a cloud-to-end solution for mobile development, testing, maintenance and operations. mPaaS lowers the technology barrier of mobile development and helps businesses quickly build stable and high-quality mobile apps at scale. This helps clients reduce R&D costs, improve development efficiency and accelerate the rollout of go-to-market services.

Trip.com Group Limited Reports Unaudited Second Quarter and First Half of 2022 Financial Results

SHANGHAI, Sept. 22, 2022 /PRNewswire/ — Trip.com Group Limited (Nasdaq: TCOM; HKEX: 9961) (“Trip.com Group” or the “Company”), a leading one-stop travel service provider of accommodation reservation, transportation ticketing, packaged tours and corporate travel management, today announced its unaudited financial results for the second quarter and first half of 2022.

Key Highlights for the Second Quarter of 2022

The Company delivered resilient results in the second quarter despite the continued disruptions resulting from the COVID-19 resurgence in China.

  • Net income for the second quarter was RMB43 million (US$6 million), which improved from net loss of RMB1.0 billion for the previous quarter.
  • Adjusted EBITDA for the second quarter was RMB355 million (US$53 million), representing a 290% increase from RMB91 million for the previous quarter,
  • Staycation travel continued to serve as a major contributor to the recovery of the Chinese domestic market, with local hotel bookings increasing by over 30% compared to the same period in 2019.
  • Both air-ticket and hotel bookings on global platforms increased over 100% year over year in the second quarter.

“In the second quarter, the global travel industry has made continued progress towards full recovery. The recovery momentum in Europe and the United States remained robust, and the rebound of travel activities in the Asia-Pacific region also sped up due to further relaxation of travel restrictions,” said James Liang, Executive Chairman. “With our product innovation and service enhancement, we are confident in further strengthening our competitive position and capturing the pent-up demand. “

“Despite the challenges in the China domestic market in the first two months of the second quarter, the fundamental demand for travel remained solid. We are delighted to see the domestic hotel bookings quickly bouncing back to the pre-pandemic level at the end of the second quarter with such momentum extended into the following months.” said Jane Sun, Chief Executive Officer. “We will continue to improve our operating efficiency and conduct prudent cost control in the face of the changing environment. All these efforts will enable us to remain flexible and pave the way for long-term growth.”

Second Quarter of 2022 Financial Results and Business Updates

In the second quarter of 2022, the COVID-19 resurgence continued to disrupt the travel industry in China, which discouraged user demand for the Company’s services. As a result, the Company’s results of operations for the second quarter of 2022 were materially and adversely affected.

For the second quarter of 2022, Trip.com Group reported net revenue of RMB4.0 billion (US$598 million), representing a 32% decrease from the same period in 2021 and a 2% decrease from the previous quarter, primarily due to the continued disruptions resulting from the COVID-19 resurgence in China.

Accommodation reservation revenue for the second quarter of 2022 was RMB1.4 billion (US$203 million), representing a 45% decrease from the same period in 2021 and a 6% decrease from the previous quarter, primarily due to the continued disruptions resulting from the COVID-19 resurgence in China.

Transportation ticketing revenue for the second quarter of 2022 was RMB1.8 billion (US$263 million), representing a 15% decrease from the same period in 2021, primarily due to the continued disruptions resulting from the COVID-19 resurgence in China. Transportation ticketing revenue increased by 6% from the previous quarter, primarily driven by strong recovery of air travel in the overseas market.

Packaged-tour revenue for the second quarter of 2022 was RMB122 million (US$18 million), representing a 67% decrease from the same period in 2021 and a 2% decrease from the previous quarter, primarily due to the continued disruptions resulting from the COVID-19 resurgence in China.

Corporate travel revenue for the second quarter of 2022 was RMB210 million (US$31 million), representing a 46% decrease from the same period in 2021 and a 5% decrease from the previous quarter, primarily due to the continued disruptions resulting from the COVID-19 resurgence in China.

Cost of revenue for the second quarter of 2022 was RMB976 million (US$146 million), representing a 20% decrease from the same period in 2021, which was in line with the decrease in net revenue. Cost of revenue decreased by 9% from the previous quarter. Cost of revenue as a percentage of net revenue was 24% for the second quarter of 2022.

Product development expenses for the second quarter of 2022 decreased by 20% to RMB1.8 billion (US$264 million) from the same period in 2021 and decreased by 10% from the previous quarter, primarily due to a decrease in product development personnel related expenses. Product development expenses as a percentage of net revenue was 44% for the second quarter of 2022.

Sales and marketing expenses for the second quarter of 2022 decreased by 41% to RMB826 million (US$123 million) from the same period in 2021 and decreased by 2% from the previous quarter, primarily due to a decrease in expenses relating to sales and marketing promotion activities. Sales and marketing expenses as a percentage of net revenue was 21% for the second quarter of 2022.

General and administrative expenses for the second quarter of 2022 decreased by 15% to RMB604 million (US$90 million) from the same period in 2021, primarily due to a decrease in general and administrative personnel related expenses. General and administrative expenses increased by 3% from the previous quarter. General and administrative expenses as a percentage of net revenue was 15% for the second quarter of 2022.

Income tax expense for the second quarter of 2022 was RMB173 million (US$26 million), compared to income tax expense of RMB97 million for the same period in 2021 and income tax benefit of RMB14 million in the previous quarter. The change in Trip.com Group’s effective tax rate was primarily due to the combined impacts of changes in respective profitability of its subsidiaries with different tax rates, certain non-taxable income or loss resulting from the fair value changes in equity securities investments and exchangeable senior notes, and changes in valuation allowance provided for deferred tax assets.

Net income for the second quarter of 2022 was RMB43 million (US$6 million), compared to net loss of RMB659 million for the same period in 2021 and net loss of RMB1 billion for the previous quarter. Adjusted EBITDA for the second quarter of 2022 was RMB355 million (US$53 million), compared to RMB916 million for the same period in 2021 and RMB91 million for the previous quarter. Adjusted EBITDA margin was 9% for the second quarter of 2022, compared to 16% for the same period in 2021 and 2% for the previous quarter.

Net income attributable to Trip.com Group’s shareholders for the second quarter of 2022 was RMB69 million (US$10 million), compared to net loss attributable to Trip.com Group’s shareholders of RMB647 million for the same period in 2021 and net loss attributable to Trip.com Group’s shareholders of RMB989 million for the previous quarter. Excluding share-based compensation charges, fair value changes of equity securities investments and exchangeable senior notes recorded in other income/(expense) and their tax effects, non-GAAP net loss attributable to Trip.com Group’s shareholders was RMB203 million (US$31 million), compared to non-GAAP net income attributable to Trip.com Group’s shareholders of RMB728 million in the same period in 2021 and non-GAAP net loss attributable to Trip.com Group’s shareholders of RMB36 million for the previous quarter.

Diluted income per ordinary share and per ADS was RMB0.10 (US$0.01) for the second quarter of 2022. Excluding share-based compensation charges, fair value changes of equity securities investments and exchangeable senior notes and their tax effects, non-GAAP diluted loss per ordinary share and per ADS was RMB0.31 (US$0.05) for the second quarter of 2022. Each ADS currently represents one ordinary share of the Company.

As of June 30, 2022, the balance of cash and cash equivalents, restricted cash, short-term investment, held to maturity time deposit and financial products was RMB65.6 billion (US$9.8 billion).

Conference Call

Trip.com Group’s management team will host a conference call at 8:00 PM EST on September 21, 2022 (or 8:00 AM CST on September 22, 2022) following this announcement.

The conference call will be available live on Webcast and for replay at: https://investors.trip.com. The call will be archived for twelve months on our website.

All participants must pre-register to join this conference call using the Participant Registration link below:

https://register.vevent.com/register/BIe6a1088f8c3f4a77a18a7d5b03d2bc2e

Upon registration, each participant will receive details for this conference call, including dial-in numbers and a unique access PIN. To join the conference, please dial the number provided, enter your PIN, and you will join the conference instantly.

Safe Harbor Statement

This announcement contains forward-looking statements. These statements are made under the “safe harbor” provisions of the U.S. Private Securities Litigation Reform Act of 1995. These forward-looking statements can be identified by terminology such as “may,” “will,” “expect,” “anticipate,” “future,” “intend,” “plan,” “believe,” “estimate,” “is/are likely to,” “confident” or other similar statements. Among other things, quotations from management in this press release, as well as Trip.com Group’s strategic and operational plans, contain forward-looking statements. Forward-looking statements involve inherent risks and uncertainties. A number of important factors could cause actual results to differ materially from those contained in any forward-looking statement. Potential risks and uncertainties include, but are not limited to, severe or prolonged downturn in the global or Chinese economy, general declines or disruptions in the travel industry, the impact of COVID-19 pandemic to Trip.com Group’s business operations, volatility in the trading price of Trip.com Group’s ADSs or shares, Trip.com Group’s reliance on its relationships and contractual arrangements with travel suppliers and strategic alliances, failure to compete against new and existing competitors, failure to successfully manage current growth and potential future growth, risks associated with any strategic investments or acquisitions, seasonality in the travel industry in the relevant jurisdictions where Trip.com Group operates, failure to successfully develop Trip.com Group’s existing or future business lines, damage to or failure of Trip.com Group’s infrastructure and technology, loss of services of Trip.com Group’s key executives, adverse changes in economic and political policies of the PRC government, inflation in China, risks and uncertainties associated with PRC laws and regulations with respect to the ownership structure of Trip.com Group’s affiliated Chinese entities and the contractual arrangements among Trip.com Group, its affiliated Chinese entities and their shareholders, and other risks outlined in Trip.com Group’s filings with the U.S. Securities and Exchange Commission or the Stock Exchange of Hong Kong Limited. All information provided in this press release and in the attachments is as of the date of the issuance, and Trip.com Group does not undertake any obligation to update any forward-looking statement, except as required under applicable law.

About Non-GAAP Financial Measures

To supplement Trip.com Group’s unaudited condensed consolidated financial statements presented in accordance with United States Generally Accepted Accounting Principles (“GAAP”), Trip.com Group uses non-GAAP financial information related to adjusted net income attributable to Trip.com Group Limited, adjusted EBITDA, adjusted EBITDA margin and adjusted diluted earnings per ordinary share and per ADS, each of which is adjusted from the most comparable GAAP result to exclude the share-based compensation charges that are not tax deductible and fair value changes of equity securities investments and exchangeable senior notes, net of tax. Trip.com Group’s management believes the non-GAAP financial measures facilitate better understanding of operating results from quarter to quarter and provide management with a better capability to plan and forecast future periods.

Non-GAAP information is not prepared in accordance with GAAP, does not have a standardized meaning under GAAP, and may be different from non-GAAP methods of accounting and reporting used by other companies. The presentation of this additional information should not be considered a substitute for GAAP results. A limitation of using non-GAAP financial measures is that non-GAAP measures exclude share-based compensation charges, fair value changes of equity securities investments and exchangeable senior notes and their tax effects that have been and will continue to be significant recurring expenses in Trip.com Group’s business for the foreseeable future.

Reconciliations of Trip.com Group’s non-GAAP financial data to the most comparable GAAP data included in the consolidated statement of operations are included at the end of this press release.

About Trip.com Group Limited

Trip.com Group Limited (Nasdaq: TCOM; HKEX: 9961) is a leading global one-stop travel platform, integrating a comprehensive suite of travel products and services and differentiated travel content. It is the go-to destination for travelers in China, and increasingly for travelers around the world, to explore travel, get inspired, make informed and cost-effective travel bookings, enjoy hassle-free on-the-go support, and share travel experience. Founded in 1999 and listed on Nasdaq in 2003 and HKEX in 2021, the Company currently operates under a portfolio of brands, including Ctrip, Qunar, Trip.com and Skyscanner, with the mission “to pursue the perfect trip for a better world.”

For further information, please contact:

Investor Relations

Trip.com Group Limited
Tel: +86 (21) 3406-4880 X 12229
Email: iremail@trip.com

Trip.com Group Limited

Unaudited Consolidated Balance Sheets

(In millions, except share and per share data)

December 31, 2021

June 30, 2022

June 30, 2022

RMB (million)

RMB (million)

USD (million)

ASSETS

Current assets:

Cash, cash equivalents and restricted cash

21,196

22,959

3,427

Short-term investments

29,566

30,721

4,587

Accounts receivable, net 

4,649

5,445

813

Prepayments and other current assets 

10,697

10,778

1,609

Total current assets

66,108

69,903

10,436

Property, equipment and software

5,534

5,307

792

Intangible assets and land use rights

13,046

12,929

1,931

Right-of-use assets

777

925

138

Investments (Includes held to maturity time deposit and
financial products of RMB13,112 million and RMB11,891
million as of December 31,2021 and June 30, 2022,
respectively)

44,961

44,075

6,580

Goodwill

59,353

59,326

8,857

Other long-term assets

396

398

60

Deferred tax asset

1,684

1,765

263

Total assets

191,859

194,628

29,057

LIABILITIES

Current liabilities:

Short-term debt and current portion of long-term debt

39,866

36,203

5,405

Accounts payable

6,019

6,745

1,007

Advances from customers

7,535

7,822

1,168

Other current liabilities

12,798

11,926

1,781

Total current liabilities

66,218

62,696

9,361

Deferred tax liability

3,527

3,491

521

Long-term debt

11,093

17,402

2,598

Long-term lease liability

400

591

88

Other long-term liabilities

165

170

25

Total liabilities

81,403

84,350

12,593

SHAREHOLDERS’ EQUITY

Total Trip.com Group Limited shareholders’ equity

109,677

109,542

16,354

Non-controlling interests

779

736

110

Total shareholders’ equity

110,456

110,278

16,464

Total liabilities and shareholders’ equity

191,859

194,628

29,057

Trip.com Group Limited

Unaudited Consolidated Statements of Income/(Loss)

(In millions, except share and per share data)

Three Months Ended

Six Months Ended

June 30, 2021

March 31, 2022

June 30, 2022

June 30, 2022

June 30, 2021

June 30, 2022

June 30, 2022

RMB (million)

RMB (million)

RMB (million)

USD (million)

RMB (million)

RMB (million)

USD (million)

Revenue:

Accommodation reservation 

2,455

1,450

1,357

203

4,035

2,807

419

Transportation ticketing 

2,066

1,663

1,763

263

3,572

3,426

512

Packaged-tour 

367

124

122

18

536

246

37

Corporate travel

390

222

210

31

642

432

64

Others

614

652

564

84

1,216

1,216

181

Total revenue

5,892

4,111

4,016

599

10,001

8,127

1,213

Less: Sales tax and surcharges

(2)

(2)

(5)

(1)

(3)

(7)

(1)

Net revenue

5,890

4,109

4,011

598

9,998

8,120

1,212

Cost of revenue

(1,223)

(1,067)

(976)

(146)

(2,257)

(2,043)

(305)

Gross profit

4,667

3,042

3,035

452

7,741

6,077

907

Operating expenses:

Product development *

(2,226)

(1,974)

(1,772)

(264)

(4,451)

(3,746)

(559)

Sales and marketing *

(1,402)

(843)

(826)

(123)

(2,354)

(1,669)

(249)

General and administrative *

(713)

(584)

(604)

(90)

(1,397)

(1,188)

(178)

Total operating expenses

(4,341)

(3,401)

(3,202)

(477)

(8,202)

(6,603)

(986)

Income/(Loss) from operations

326

(359)

(167)

(25)

(461)

(526)

(79)

Interest income 

472

591

544

81

890

1,135

169

Interest expense

(418)

(341)

(351)

(52)

(825)

(692)

(103)

Other (expense)/income

(848)

(707)

469

70

1,660

(238)

(35)

(Loss)/Income before income tax
expense and equity in income of
affiliates

(468)

(816)

495

74

1,264

(321)

(48)

Income tax (expense)/benefit

(97)

14

(173)

(26)

(138)

(159)

(24)

Equity in loss of affiliates

(94)

(199)

(279)

(42)

(20)

(478)

(71)

Net (loss)/income

(659)

(1,001)

43

6

1,106

(958)

(143)

Net loss attributable to non-controlling interests

12

12

26

4

27

38

6

Net (loss)/income attributable to
Trip.com Group Limited

(647)

(989)

69

10

1,133

(920)

(137)

(Losses)/Earnings per ordinary share

– Basic

(1.02)

(1.52)

0.10

0.01

1.76

(1.42)

(0.21)

– Diluted

(1.02)

(1.52)

0.10

0.01

1.73

(1.42)

(0.21)

(Losses)/Earnings per ADS

– Basic

(1.02)

(1.52)

0.10

0.01

1.76

(1.42)

(0.21)

– Diluted

(1.02)

(1.52)

0.10

0.01

1.73

(1.42)

(0.21)

Weighted average ordinary shares outstanding

– Basic

635,476,056

647,812,835

647,866,001

647,866,001

644,666,248

647,843,829

647,843,829

– Diluted

635,476,056

647,812,835

650,906,465

650,906,465

656,483,984

647,843,829

647,843,829

* Share-based compensation included in Operating expenses above is as follows:

  Product development 

181

107

146

22

332

253

38

  Sales and marketing 

34

18

28

4

56

46

7

  General and administrative 

151

98

130

19

272

228

34

Trip.com Group Limited

Unaudited reconciliation of  GAAP and Non-GAAP Results

(In millions, except % and per share data)

Three Months Ended

Six Months Ended

June 30, 2021

March 31, 2022

June 30, 2022

June 30, 2022

June 30, 2021

June 30, 2022

June 30, 2022

RMB (million)

RMB (million)

RMB (million)

USD (million)

RMB (million)

RMB (million)

USD (million)

Net (loss)/income

(659)

(1,001)

43

6

1,106

(958)

(143)

Less: Interest income

(472)

(591)

(544)

(81)

(890)

(1,135)

(169)

Add: Interest expense

418

341

351

52

825

692

103

Add: Other expense/(income)

848

707

(469)

(70)

(1,660)

238

35

Add: Income tax expense/(benefit)

97

(14)

173

26

138

159

24

Add: Equity in loss of affiliates

94

199

279

42

20

478

71

Income/(Loss) from operations

326

(359)

(167)

(25)

(461)

(526)

(79)

Add: Share-based compensation

366

223

304

45

660

527

79

Add: Depreciation and amortization

224

227

218

33

501

445

66

Adjusted EBITDA

916

91

355

53

700

446

66

Adjusted EBITDA margin

16 %

2 %

9 %

9 %

7 %

5 %

5 %

Net (loss)/income attributable to Trip.com Group Limited

(647)

(989)

69

10

1,133

(920)

(137)

Add: Share-based compensation

366

223

304

45

660

527

79

Add: Loss/(Gain) from fair value changes of equity securities investments
and exchangeable senior notes

1,053

785

(668)

(100)

(1,314)

117

17

Add: Tax effects on fair value changes of equity securities investments and
exchangeable senior notes

(44)

(55)

92

14

45

37

6

Non-GAAP net income/(loss) attributable to Trip.com Group Limited

728

(36)

(203)

(31)

524

(239)

(35)

Weighted average ordinary shares outstanding- Diluted-non GAAP 

645,021,131

647,812,835

647,866,001

647,866,001

656,483,984

647,843,829

647,843,829

Non-GAAP Diluted income/(losses) per share

1.13

(0.06)

(0.31)

(0.05)

0.80

(0.37)

(0.06)

Non-GAAP Diluted income/(losses) per ADS

1.13

(0.06)

(0.31)

(0.05)

0.80

(0.37)

(0.06)

Notes for all the condensed consolidated financial schedules presented:

Note 1: The conversion of Renminbi (RMB) into U.S. dollars (USD) is based on the certified exchange rate of USD1.00=RMB6.6981 on June 30, 2022 published by the Federal Reserve Board.

Cision View original content:https://www.prnewswire.com/news-releases/tripcom-group-limited-reports-unaudited-second-quarter-and-first-half-of-2022-financial-results-301629661.html

p-Chip Corporation Introduces First-of-its-Kind p-Chip Code Tracker to Revolutionize QR Code Security

CHICAGO, Sept. 16, 2022 /PRNewswire/ — p-Chip Corporation, a company that is revolutionizing the tracking of physical products and materials with its cutting-edge microtransponder technology, today introduced its newest breakthrough, the p-Chip Code™ secure tracking tag. The p-Chip Code tracker combines a silicon-based p-Chip® microtransponder with a standard 2D matrix code to create hyper-secure QR codes, bar codes and other matrix codes.

Secure QR code technology for tracing and security

“The pandemic brought widespread QR code use into the center of the consumer mainstream,” said Joe Wagner, CEO of p-Chip Corporation. “But for many businesses, including food brands, pharmaceutical companies, automobile manufacturers and others, QR codes pose a host of potential security risks, since they are incredibly easy to create and replicate. The new p-Chip Code technology provides an additional layer of security for QR codes or other matrix codes, delivering a breakthrough in reliable traceability at an affordable price.”

The p-Chip Code tracker functions like a tiny digital anchor for physical items. The nearly invisible p-Chip microtransponder is embedded directly into a 2D matrix code label, which is then placed onto virtually anything, including food and agriculture products, medicine bottles, automobile parts and more. 

Any standard 2D matrix code, like a QR code, can then be validated via its embedded p-Chip microtransponder, and businesses can manage tracking data with web, cloud or blockchain applications. This provides added security—as well as an opportunity to associate additional, internal data with the physical product.

Companies can digitally trace ingredients, components and materials to enhance product security, safety compliance and quality control. Additionally, in certain cases, consumers can scan a QR code to determine if they are part of a product recall, and companies can then validate those claims via the more secure p-Chip Code microtransponder.

The p-Chip Code tracking tag allows for the serialization of physical materials; counterfeit-resistant security at a scalable price; visibility into secure, granular data across the supply chain; and minimization of the risks and vulnerabilities associated with QR codes alone.

About p-Chip Corporation
Since 2017, p-Chip Corporation has revolutionized the tracking of physical products and materials with its breakthrough microtransponder technology. Its p-Chip tracker, a highly durable technology as small as a grain of salt, functions like a digital anchor for physical items, delivering breakthrough visibility and index-ability at a scalable price point. From pharmaceuticals to electronics, automotive components to agricultural ingredients, companies worldwide rely on patented p-Chip tracking technology to unlock business intelligence, deepen brand loyalty and enhance revenue. To learn more, visit www.p-chip.com.

SHUTTERSTOCK APPOINTS SEJAL AMIN AS CHIEF TECHNOLOGY OFFICER

NEW YORK, Sept. 13, 2022 /PRNewswire/ — Shutterstock, Inc. (NYSE: SSTK) (the “Company”), a leading global creative platform for transformative brands and media companies, today announced that Sejal Amin is joining the Company’s leadership team and Executive Committee as Chief Technology Officer (CTO), effective September 12, 2022.

With more than 20 years of global leadership, product and technology experience, Sejal will deliver a technology vision and strategy that transforms Shutterstock’s technology platform to deliver a new and unparalleled experience to customers and contributors.

“I am thrilled to welcome Sejal to Shutterstock, as we continue our digital transformation to a full-service creative platform that democratizes creativity, pushes creative boundaries, and provides unparalleled experiences for our customers and contributors around the world,” said Paul Hennessy, Chief Executive Officer at Shutterstock. “Sejal is a well-respected and revered leader with a proven track record of growth and innovation, and I am confident that she will be successful in leading Shutterstock’s technology platform into its next disruptive phase.”

“Shutterstock is a company that has transformed immensely from its inception almost 20 years ago, and I am honored to be the next Chief Technology Officer,” said Sejal Amin. “The innovation the Company has achieved – from world class workflow applications to industry-leading proprietary technology – is tremendous, and I look forward to expanding upon the Company’s vision, harnessing the potential of Shutterstock’s diversified offering as we celebrate a new era for Shutterstock.”

Recently, she was Chief Product and Technology Officer for Khoros, a Vista Portfolio company where she was integrating a distributed Product and Technology organization while defining a Product and Operational strategy to execute on the company’s vision and growth goals. Just prior to that, she was CTO for the Thomson Reuters Tax and Accounting Tax Professionals Business. She has a wide range of technology leadership experience across several business units at Thomson Reuters managing global product development teams and portfolios of growing size and complexity for 15+ years.

With Sejal’s appointment to CTO, Shutterstock now has three women on the Executive Committee, and two women leading the product development strategy, including Chief Product Officer, Meghan Schoen.

About Shutterstock, Inc.
Shutterstock, Inc. (NYSE: SSTK), is a leading global creative platform for transformative brands and media companies. Directly and through its group subsidiaries, Shutterstock’s comprehensive collection includes high-quality licensed photographs, vectors, illustrations, 3D models, videos and music. Working with its growing community of over 2 million contributors, Shutterstock adds hundreds of thousands of images each week, and currently has more than 415 million images and more than 26 million video clips available.

Headquartered in New York City, Shutterstock has offices around the world and customers in more than 150 countries. The Company also owns Splash News, the world’s leading entertainment news agency for newsrooms and media companies worldwide, Pond5, the world’s largest video marketplace, TurboSquid, the world’s largest 3D content marketplace; PicMonkey, a leading online graphic design and image editing platform; Offset, a high-end image collection; Shutterstock Studios, an end-to-end custom creative shop; PremiumBeat, a curated royalty-free music library; Shutterstock Editorial, a premier source of editorial images and videos for the world’s media; Amper Music, an AI-driven music platform; and Bigstock, a value-oriented stock media offering.

For more information, please visit www.shutterstock.com and follow Shutterstock on Twitter and on Facebook.

Source: Shutterstock, Inc.

Nature’s Miracle, a Leader in the Controlled Environment Agriculture Industry, to be Listed on Nasdaq Through Business Combination with Lakeshore Acquisition II Corp.

  • Nature’s Miracle is a fast-growing agriculture technology company providing services to growers in Controlled Environment Agriculture (“CEA”) settings in North America;
  • Nature’s Miracle provides hardware as well as software to design, build and operate various indoor growing settings including greenhouse, vertical farming and indoor-growing spaces;
  • Nature’s Miracle, through its two wholly-owned subsidiaries, Visiontech Group, Inc. and Hydroman, Inc., provides grow lights as well as other hydroponic products to hundreds of indoor growers in North America;
  • Nature’s Miracle has also developed a robust pipeline to build commercial-scale greenhouse in the U.S. and Canada to meet the growing needs of fresh and local vegetable products. The Company offers turnkey solutions to its operating partners by providing design, construction and hardware installment services;
  • Nature’s Miracle has established its first manufacturing footprint in North America with its grow-light assembly plant in Manitoba, Canada and is expecting to set up additional manufacturing/assembly facilities in North America;
  • The implied pro-forma enterprise value of the combined company is approximately $265 million, assuming no redemptions from the trust account. The business combination is expected to be completed in the first quarter of 2023;
  • This transaction is expected to accelerate Nature’s Miracle’s development of commercial greenhouse in the U.S. and Canada.

UPLAND, Calif., Sept. 10, 2022 /PRNewswire/ — Nature’s Miracle Inc. (“Nature’s Miracle”), a leader in the Controlled Environment Agriculture Industry, and Lakeshore Acquisition II Corp. (“together with its successors, Lakeshore”) (Nasdaq: LBBB) today announced that they have entered into a definitive business combination agreement (the “Merger Agreement”). Upon closing, the combined company is expected to change its name to Nature’s Miracle Holding Inc. and its common stock is expected to be traded on the Nasdaq Global Market.

Management Comments

“In the face of global energy shortage, food security, drought and life-style change, Nature’s Miracle is excited to offer an alternative farming mode which saves transportation cost, reduces irrigation water requirements by up to 90% and ensures fresh and local supply of produces for health-conscious consumers. We have developed a robust pipeline of greenhouse projects in the U.S. and Canada for the next twenty-four months,” said Tie “James” Li, Founder, Chairman and Chief Executive Officer of Nature’s Miracle. “By combining with Lakeshore, Nature’s Miracle will be able to tap into the public equity and debt market to fund its aggressive growth plan going forward. We look forward to working with Lakeshore team to complete the transaction and to list on Nasdaq.”

“We are thrilled to partner with Nature’s Miracle on its public company journey,” said Bill Chen, Chairman and Chief Executive Officer of Lakeshore. “After learning of Nature’s Miracle’s business model and its position in the rapidly growing Controlled Environment Agriculture market, we immediately realized the vast potential for the Company’s growth in this very important market segment.”

Key Transaction Terms

Pursuant to the Merger Agreement, Nature’s Miracle will merge with LBBB Merger Sub Inc., a Delaware corporation and a wholly-owned subsidiary of Lakeshore (the “Merger”), with Nature’s Miracle surviving and Lakeshore acquiring 100% of the equity securities of Nature’s Miracle. In exchange for their equity securities, the stockholders of Nature’s Miracle (the “Company Stockholders”) will receive an aggregate number of shares of common stock of Lakeshore (the “Merger Consideration”) with an aggregate value equal to: (a) two hundred thirty million U.S. dollars ($230,000,000), minus (b) any Closing Net Indebtedness (as defined in the Merger Agreement).

The Merger has been approved by the boards of directors of each of Lakeshore and Nature’s Miracle. The Merger will require the approval of the stockholders of Lakeshore and Nature’s Miracle and is subject to other customary closing conditions, including a registration statement on Form S-4 being declared effective by the U.S. Securities and Exchange Commission. The transaction is expected to close in the first quarter of 2023.

Advisors

Hunter Taubman Fischer & Li LLC. is acting as legal advisor to Nature’s Miracle and Loeb & Loeb is acting as legal advisor to Lakeshore. Maxim Group is acting as M&A advisor to Lakeshore.

Management Presentation

A presentation made by the management teams of both Nature’s Miracle and Lakeshore regarding the transaction will be available on the websites of Nature’s Miracle at https: //www.Nature-Miracle.com and Lakeshore at https://www.lakeshoreacquisition.com/tzzy. Lakeshore will also file the presentation with the SEC in a Current Report on Form 8-K, which will be accessible at www.sec.gov.

About Lakeshore Acquisition II Corp.

Lakeshore Acquisition II Corp. is a blank check company, also commonly referred to as a special purpose acquisition company, or SPAC, formed for the purpose of effecting a merger, share exchange, asset acquisition, share purchase, reorganization or similar business combination with one or more businesses or entities.

About Nature’s Miracle Holdings Inc.

Nature’s Miracle is a fast-growing agriculture technology company providing services to growers in the Controlled Environment Agriculture (“CEA”) industry which also include vertical farming in North America. The Company offers integrated solutions which include hardware as well as software to design, build and operate various indoor growing settings including greenhouse and indoor-growing spaces. Nature’s Miracle, through its two wholly-owned subsidiaries, Visiontech Group, Inc. and Hydroman, Inc., provides grow lights as well as other hydroponic products to hundreds of indoor growers in North America. Nature’s Miracle has also developed a robust pipeline to build commercial-scale greenhouse in the U.S. and Canada to meet the growing needs of fresh and local vegetable products. The Company offers turnkey solutions to its operating partners by providing the design, construction and hardware installment services; Nature’s Miracle has established its first manufacturing footprint in North America with its grow-light assembly plant in Manitoba, Canada and is expected to set up additional manufacturing/assembly facilities in North America.  

Important Information About the Proposed Business Combination and Where to Find It

This press release relates to a proposed business combination between Lakeshore and Nature’s Miracle. A full description of the terms of the business combination will be provided in a Registration Statement on Form S-4 and proxy statement to be filed with the SEC by Lakeshore. The proxy statement will be mailed to Lakeshore’s shareholders as of a record date to be established for voting at the shareholders’ meeting relating to the proposed transactions. This press release does not contain all the information that should be considered concerning the proposed business combination and is not intended to form the basis of any investment decision or any other decision in respect of the proposed business combination. Lakeshore’s shareholders and other interested persons are advised to read, when available, the Registration Statement on Form S-4 and proxy statement and the amendments thereto and other documents filed in connection with the proposed business combination, as these materials will contain important information about Nature’s Miracle, Lakeshore and the proposed business combination. The Registration Statement on Form S-4 and the proxy statement and other documents filed with the SEC, once available, may be obtained without charge at the SEC’s website at www.sec.gov, or by directing a written request to Lakeshore, 667 Madison Avenue, New York, NY 10065.

Participants in the Solicitation

Lakeshore, certain shareholders of Lakeshore, and their respective directors and executive officers may be deemed participants in the solicitation of proxies from Lakeshore’s shareholders with respect to the proposed business combination. A list of the names of Lakeshore’s directors and executive officers and a description of their interests in Lakeshore is contained in Lakeshore’s registration statement on Form S-1, which was filed with the SEC and is available free of charge at the SEC’s web site at www.sec.gov, or by directing a written request to Lakeshore, 667 Madison Avenue, New York, NY 10065. Additional information regarding the interests of such participants will be contained in the Registration Statement on Form S-4 and proxy statement for the proposed business combination when available.

Nature’s Miracle and its directors and executive officers may also be deemed to be participants in the solicitation of proxies from the shareholders of Lakeshore in connection with the proposed business combination. A list of the names of such directors and executive officers and information regarding their interests in the proposed business combination will be included in the proxy statement for the proposed business combination when available.

Forward-looking Statements

Except for historical information contained herein, this press release contains certain “forward-looking statements” within the meaning of the federal U.S. securities laws with respect to the proposed business combination between Lakeshore and Nature’s Miracle, the benefits of the transaction, the amount of cash the transaction will provide Nature’s Miracle, the anticipated timing of the transaction, the services and markets of Nature’s Miracle, our expectations regarding future growth, results of operations, performance, future capital and other expenditures, competitive advantages, business prospects and opportunities, future plans and intentions, results, level of activities, performance, goals or achievements or other future events. These forward-looking statements generally are identified by words such as “anticipate,” “believe,” “expect,” “may,” “could,” “will,” “potential,” “intend,” “estimate,” “should,” “plan,” “predict,” or the negative or other variations of such statements, reflect our management’s current beliefs and assumptions and are based on the information currently available to our management. Forward-looking statements are predictions, projections and other statements about future events that are based on current expectations and assumptions and, as a result, are subject to risks and uncertainties. Many factors could cause actual results or developments to differ materially from those expressed or implied by such forward-looking statements, including but not limited to: (i) the risk that the transaction may not be completed in a timely manner or at all, which may adversely affect the price of Lakeshore’s securities; (ii) the risk that the transaction may not be completed by Lakeshore’s business combination deadline and the potential failure to obtain an extension of the business combination deadline if sought by Lakeshore; (iii) the failure to satisfy the conditions to the consummation of the transaction, including the approval of the business combination agreement by the stockholders of Lakeshore, the satisfaction of the minimum cash amount following any redemptions by Lakeshore’s public stockholders and the receipt of certain governmental and regulatory approvals; (iv) the lack of a third-party valuation in determining whether or not to pursue the proposed transaction; (v) the occurrence of any event, change or other circumstance that could give rise to the termination of the business combination agreement; (vi) the effect of the announcement or pendency of the transaction on Nature’s Miracle’s business relationships, operating results and business generally; (vii) risks that the proposed transaction disrupts current plans and operations of Nature’s Miracle; (viii) the outcome of any legal proceedings that may be instituted against Nature’s Miracle or Lakeshore related to the business combination agreement or the proposed transaction; (ix) the ability to maintain the listing of Lakeshore’s securities on a national securities exchange; (x) changes in the competitive industries in which Nature’s Miracle operates, variations in operating performance across competitors, changes in laws and regulations affecting Nature’s Miracle’s business and changes in the combined capital structure; (xi) the ability to implement business plans, forecasts and other expectations after the completion of the proposed transaction, and identify and realize additional opportunities; (xii) the risk of downturns in the market and Nature’s Miracle’s industry including, but not limited to, as a result of the COVID-19 pandemic; (xiii) costs related to the transaction and the failure to realize anticipated benefits of the transaction or to realize estimated pro forma results and underlying assumptions, including with respect to estimated stockholder redemptions; (xiv) risks and uncertainties related to Nature’s Miracle’s business, including, but not limited to risks relating to the uncertainty of the projected financial information with respect to Nature’s Miracle; risks related to Nature’s Miracle’s limited operating history, the roll-out of Nature’s Miracle’s business and the timing of expected business milestones; Nature’s Miracle’s ability to implement its business plan and scale its business; Nature’s Miracle’s ability to develop products and technologies that are more effective or commercially attractive than competitors’ products; Nature’s Miracle’s ability to maintain accelerate rate of growth recently due to lifestyle changes in the wake of COVID-19 pandemic; risks of increased costs as a result of being a public company; risks relating to Nature’s Miracle’s being unable to renew the leases of their facilities and warehouses; Nature’s Miracle’s ability to grow the size of its organization and management in response of the increase of sales and marketing infrastructure; risks relating to potential tariffs or a global trade war that could increase the cost of Nature’s Miracle’s products; risks relating to product liability lawsuits that could be brought against Nature’s Miracle;; Nature’s Miracle’s ability to formulate, implement and modify as necessary effective sales, marketing, and strategic initiatives to drive revenue growth; Nature’s Miracle’s ability to expand internationally; acceptance by the marketplace of the products and services that Nature’s Miracle markets; and government regulations and Nature’s Miracle’s ability to obtain applicable regulatory approvals and comply with government regulations. The foregoing list of factors is not exclusive. You should carefully consider the foregoing factors and the other risks and uncertainties described in the “Risk Factors” section of proxy statement, when available, and other documents filed by Lakeshore from time to time with the SEC. These filings identify and address other important risks and uncertainties that could cause actual events and results to differ materially from those contained in the forward-looking statements. Forward-looking statements speak only as of the date on which they are made, and neither Nature’s Miracle nor Lakeshore assume any obligation to update or revise any forward-looking statements or other information contained herein, whether as a result of new information, future events or otherwise. You are cautioned not to put undue reliance on these forward-looking statements. Neither Lakeshore nor Nature’s Miracle gives any assurance that either Lakeshore or Nature’s Miracle, or the combined company, will achieve its expectations.

Non-solicitation

This press release is not a proxy statement or solicitation of a proxy, consent or authorization with respect to any securities or in respect of the potential business combination or any other matter and shall not constitute an offer to sell or a solicitation of an offer to buy the securities of Lakeshore, Nature’s Miracle or the combined company, nor shall there be any sale of any such securities in any state or jurisdiction in which such offer, solicitation, or sale would be unlawful prior to registration or qualification under the securities laws of such state or jurisdiction. No offer of securities shall be made except by means of a prospectus meeting the requirements of the Securities Act of 1933, as amended.

Contacts

info@nature-miracle.com

Source: Lakeshore Acquisition II Corp.

Experlogix Expands Senior Sales Leadership Team with Appointment of Two New VPs

SOUTH JORDAN, Utah and VEENENDAAL, Netherlands, Sept. 7, 2022 /PRNewswire/ — Experlogix, a leading provider of Configure, Price, Quote (CPQ) and Document Automation software, announced today an expansion of its sales team: Mark Conway joined the company as Vice President of Sales for EMEA, and Angie Cox has come on board as Vice President of Sales for North America.

Experlogix is a leader in CPQ and document generation and automation software for Microsoft Dynamics 365, Salesforce, NetSuite, SugarCRM, and many other top CRM and ERP platforms.

Conway brings to Experlogix over two decades of global experience in the software/IT services industry, managing clients across the US, UK, Europe and Asia. Before joining Experlogix, Conway was Executive Director EMEA at Flintfox since 2019 where he defined and led their sales, marketing, service level management and technical support teams. He has built successful business development teams within the industry with a focus on all things digital and disruptive technology. He has successfully collaborated with C- level client stakeholders on many strategic businesses and IT digital and data transformation deals that have brought forward immense value to client organizations.

“I am honoured and elated to join Experlogix which has built a robust foundation and culture over the years, to deliver a world class CPQ experience to their clients globally,” said Conway. “I look forward to collaborating with the leadership team to leverage their rich knowledge coupled with its winning software to drive further value of our clients’ digital journey.”

Cox brings more than 20 years of sales leadership experience, with an extensive background in building and developing successful business units and teams. She is an expert in building top producing sales teams through strategic account planning, product development, critical partnerships, and tactical coaching. Before joining Experlogix, Cox led the acquisition of a B2B software solution to one of the world’s largest software companies.

“I am excited for the opportunity to lead the North America Sales Team as we develop and win new business by continuing to deliver best-in-class CPQ, Document Generation and Document Automation solutions.” Cox said. “I look forward to building on the company’s strong track record of success.”

“The addition of Angie and Mark to our team positions us well for even stronger growth”, says Beth Thornton, CRO of Experlogix. “Their depth of combined global experience will accelerate our results and our existing and future talent will be poised for even greater levels of success. I am very pleased with what I am seeing so far.”

Experlogix has expanded teams across multiple regions and departments over the last year, resulting in more than 100 new hires from 2021 to 2022 to support an increasingly global customer base. Worldwide, more than 600 organizations leverage Experlogix CPQ and Document Automation software with more than 100,000+ users.

About Experlogix 

Experlogix solutions simplify and humanize the most complex products and processes to unlock workflow velocity and create a better customer experience. Experlogix CPQ makes configuration and other processes faster than you ever thought possible and simpler than you dared to imagine. Experlogix Document Automation simplifies and optimizes even the most complex document processes for companies worldwide, in any industry. Experlogix — simplifying the complex.

Experlogix is a global company headquartered in Salt Lake City, with European headquarters in Veenendaal, Netherlands. We’re online at www.experlogix.com.