Tag Archives: REA

LED CHINA 2020 to Launch Interactive Virtual Exhibition to Benefit Global Buyers

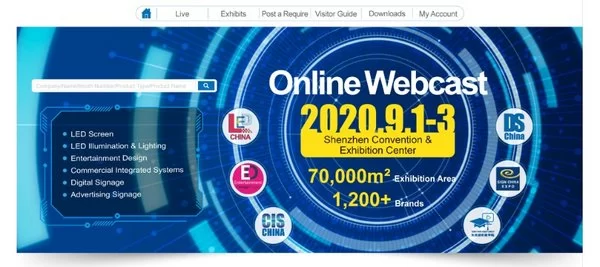
1 ~ 3 September, both in-person and virtual version of LED CHINA 2020 will be held as planned, presenting the latest trends in LED displays and its vertical application domains.

SHENZHEN, China, Aug. 24, 2020 — LED CHINA 2020 has recently launched a B2B online webcast platform – LED CHINA I Live (https://live.ledchina.com/), to complement its in-person event which is coming in September. With rich content and powerful functions, such platform offers a brand-new experience and ongoing opportunities to source, learn and interactive, without the constraints of time, space and costs.

LED CHINA B2B Online Webcast Platform

What Visitors Can Do at LED CHINA I Live:

  1. To look up over 1,200 brands from the robust B2B search engine, and to learn trending technologies such as pixel-pitch/micro LED, new vision of 5G internet + 8K video display.
  2. To interact with targeted suppliers through live webcast, online chatting or video call.
  3. To post requirements and join the business 1-to-1 matching or simply let the qualified suppliers come up to you.

LED CHINA I Live is the virtual version of physical LED CHINA 2020 from 1 to 3 September. It’s open to all professionals free of charges. To enable visitors to have a smooth and efficient experience on the platform, more information, such as platform’s function introduction, user guide, exhibitor list and webcast timetable will be available here: https://bit.ly/2Ekupa8

LED CHINA 2020 to Launch Interactive Virtual Exhibition to Benefit Global Buyers

Concurrent Events Offer Solutions Designed Vertical Application Domains

Apart from the Live Online Webcast, LED CHINA 2020 will also be co-hosted with Entertainment Design Expo 2020, Commercial Integrated System China 2020, Digital Signage China 2020 and Sign China 2020, all events together will offer solutions designed for its vertical application domains:

Entertainment / Staging / Broadcasting / Hospitality / Stadiums & Venues / Conferencing / Brand Marketing & Advertising / Experiential Design / Command & Control Rooms / Retail Environments / DOOH Networks / Conference & Multimedia / Pro AV & Installation

About LED CHINA:

Established in 2005, LED CHINA is the initiator of international LED exhibition in the world. Being the benchmark of the global LED industrial chain, LED CHINA· Shenzhen is devoted to build a one-stop trading platform with a wide range of LED related products, LED applications in different industrial fields. (For more, visit: www.LEDChina.com)

About the Organiser:

Informa Markets Trust, a joint venture of Informa Markets. Informa Markets is a leading B2B information services group and the largest B2B event organizer in the world. It has over 11,000 staff and provides business service to over 40 countries for more than 50 different industries. Over 500 leading exhibitions across the globe are organised by Informa Markets

Contact: Jenee Liao, +86-02-38106261

Photo – https://photos.prnasia.com/prnh/20200824/2893115-1-a?lang=0
Photo – https://photos.prnasia.com/prnh/20200824/2893115-1-b?lang=0

Related Links :

http://ledchina.com

Meituan Dianping Announces Financial Results for the Three and Six Months Ended June 30, 2020


HONG KONG, Aug. 21, 2020 — Meituan Dianping (HKG: 3690) (the "Company" or "Meituan"), China’s leading e-commerce platform for services, today announced the unaudited consolidated results of the Company for the three and six months ended June 30, 2020.

Company Financial Highlights

Although the COVID-19 pandemic continued to impact the daily operations of our merchants, including restaurants, hotels and other local services merchants, our businesses demonstrated resilience and recovered at a gradual pace. Total revenues for the second quarter of 2020 increased by 8.9% year-over-year to RMB 24.7 billion from RMB 22.7 billion for the same period of 2019. Operating profit improved to RMB 2.2 billion in the second quarter of 2020, increasing by 95.5% year-over-year, while operating margin increased from 4.9% to 8.8%. Both adjusted EBITDA and adjusted net profit experienced positive year-over-year growth and improved to RMB 2.6 billion and RMB 2.7 billion, respectively. Our operating cash flow also turned to positive RMB 5.6 billion for the second quarter of 2020 from negative RMB5 .0 billion for the first quarter of 2020. We had cash and cash equivalents of RMB 13.9 billion and short-term investments of RMB44.5 billion as of June 30, 2020, compared to the balances of RMB 14.1 billion and RMB 42.4 billion, respectively, as of March 31, 2020.

"Although we continued to see impacts from the outbreak of COVID-19 in the second quarter, our business demonstrated resilience and recovered at a good pace," said Xing Wang, Chairman and CEO of Meituan. "During the quarter, we helped our merchants to weather the storm, which created value for our vast community of consumers and merchants, and, as a result, stimulated the progressive recovery of the local services industry from the pandemic. We further boosted the competitive advantages of our core businesses while enhancing our ecosystem during our business recovery process. In the second quarter, we utilized advanced digital operations tools to enable more merchants, enhanced our on-demand delivery infrastructure to better facilitate the digital lifestyle of consumers, and accelerated the online penetration and digitization of essential local services on both the demand and supply side."

"As the leading e-commerce platform for services, Meituan will continue to fulfill our social responsibilities," Wang said. "We will help to further boost consumption growth and to recover local economies to the best of our abilities despite the uncertainties and challenges in the next few quarters. We believe that our philosophy of focusing on the long-term growth and rewards will continue to yield positive results for all participants in the Meituan ecosystem."

Company Business Highlights

Food delivery

For the second quarter of 2020, GTV of our food delivery business increased by 16.9% year-over-year to RMB108.8 billion. The daily average number of food delivery transactions increased by 6.9% year-over-year to 24.5 million. The average value per order of our food delivery business increased by 9.4% year-over-year. Monetization Rate[i] of our food delivery business decreased to 13.4% for the second quarter of 2020 from 13.8% for the same period of 2019. As a result, revenues of food delivery business increased by 13.2% year-over-year to RMB 14.5 billion for the second quarter of 2020. Operating profit from our food delivery business turned to positive RMB 1.3 billion for the second quarter of 2020, compared to operating loss of RMB70.9 million for the first quarter of 2020, while operating margin turned to positive 8.6% from negative 0.7%. Moreover, operating profit from the food delivery business increased by 65.7% year-over-year, while operating margin improved by 2.7 percentage points year-over-year.

Despite the pandemic’s continuous impact, we further demonstrated the unique competitiveness of our business model and validated the essential needs for food delivery services from both consumers and merchants. Especially, our immediate response to the COVID-19 new cases that occurred in Beijing showcased our increasing experience in managing the recurring outbreaks of COVID-19. To ensure the safety of our delivery riders and consumers, among other measures, we immediately organized nucleic acid testing for all of our delivery riders in Beijing, expanded the use of "intelligent lockers" in the city, and further upgraded our contactless delivery process. For merchants, we rolled out targeted support and commission rebate programs to help them better survive the COVID-19 new cases that occurred in Beijing. We also created a portal for merchants to upload their green COVID-19 testing results so as to provide consumers with extra food safety assurance.

In the second quarter of 2020, we continued to launch various promotional campaigns to stimulate the recovery of our food delivery business. For example, we rolled out the "June 18 Food Delivery Festival" and engaged around 4,000 reputable restaurants and brands to provide consumers with a wide variety of attractive promotions in the period. We were also spot-on in identifying consumers’ behavioral changes and used targeted promotions to actively increase the consumption of afternoon tea and late-night snacks. Moreover, we have further stepped up the portion of subsidies allocated to targeted repeat consumers through our effective food delivery membership program. As a result, the order volume of our food delivery business experienced positive year-over-year growth in the second quarter of 2020, with the daily average number of food delivery transactions increasing by 6.9% year-over-year to 24.5 million.

On the merchant side, a further recovery in merchant operation and consumer consumption led to the strong marketing demand from merchants in the second quarter of 2020. Meanwhile, the pandemic has accelerated the restaurants’ online migration, increasing the mix of high-quality merchants on our platform during the period. Notably, the number of newly-onboard branded merchants increased by more than 110% in the second quarter as compared to the prior year period. Their increased demand for online traffic has accelerated their adoption of our online marketing services. As a result, online marketing services revenues experienced rapid growth in the second quarter of 2020, increased by 62.2% year-over-year.

On the delivery front, we further improved our delivery efficiency in the second quarter of 2020, attributable to the refinement of our proprietary dispatching system algorithms and the continuous improvement of the operation of our delivery network. In addition, the sufficient delivery capacity and the favorable weather condition across the country enabled us to reduce the amount of seasonal incentives paid to delivery riders on a quarter-over-quarter basis. These factors together have allowed us to better control delivery cost per order on both a quarter-over-quarter and a year-over-year basis. Meantime, the importance of our on-demand delivery network as a critical component of society’s broader logistical infrastructure has been substantially elevated post the outbreak of COVID-19. Our delivery network helped to ensure continuity in people’s daily lives during the pandemic and served as a stabilizing force for society by creating abundant employment opportunities. We will continue to explore diversified delivery models and invest in the cutting-edge technology for autonomous delivery to further improve our operating efficiency and enlarge our capacity while striving to serve the needs of our merchants and consumers in more service categories.

In-store, hotel & travel

Revenues from our in-store, hotel & travel businesses decreased by 13.4% year-over-year to RMB4.5 billion in the second quarter of 2020. Operating profit of our in-store, hotel & travel businesses decreased by 11.9% year-over-year, but increased by 178.1% quarter-over-quarter to RMB 1.9 billion in the second quarter of 2020, while operating margin increased by 0.7 percentage points year-over-year and by 19.6 percentage points quarter-over-quarter to 41.6%.

During the second quarter of 2020, the in-store segment continued to recover at a slower pace than the food delivery business as consumers needed more time to rebuild confidence in certain discretionary in-store consumptions. In order to stimulate local services consumption and restore local economies, we cooperated with local governments to launch the "Safe Consumption Festival" in more than 60 cities and issued e-Vouchers during this quarter. These e-Vouchers were mainly for in-store dining initially, but we have since expanded them to cover hotels, shopping, and other local services. We also launched a series of promotional campaigns in the second quarter of 2020, including Labour Day promotions, Dragon Boat Festival promotions, and June 18 Marketing Festival promotions. These events covered all the aspects of our in-store services and helped to accelerate our collaborations with popular merchant brands to further improve our merchant base and offer consumers a wider variety of choices in turn. As a result, the recovery of transaction volume and merchants’ marketing demand of our in-store segment was on the right track. The year-over-year decline in commission revenues and online marketing services revenues were significantly narrowed from the first quarter of 2020. Moreover, we published a new 2020 version of our reputable "Must List Series." This series has evolved into a comprehensive and professional local services guide over the years. During the COVID-19 pandemic, we noticed that consumers became more price-sensitive and conscious of hygiene factors, which further compounded the ability of our trusted Must List Series to attract user traffic and guide consumers to quality merchants. It also created a positive feedback loop for merchants to upgrade their services and better meet the emerging needs of consumers.

Our hotel business continued to be significantly affected by the pandemic, with the number of domestic room nights consumed on our platform in the second quarter of 2020 decreasing by 17% year-over-year. Nevertheless, we kept increasing our partnership with more hotels via our "Safe Stay" program to provide travelers with accommodation options that are more conducive to their desires and the quarantine environment. Meantime, in light of the increasing demand for intra-city and short-distance local travel, we also launched the "Safe Travel" program to help expedite the recovery of the industry. More notably, the pace of development for our high-star hotel partnerships also picked up, and we established a significant increase in relationships with these types of hotels in the second quarter of 2020 by increasing their non-lodging revenues through our "hotel + x" program. As a result, the contribution from high-end hotels further increased year-over-year.

New initiatives and others

Revenues from the new initiatives and others segment increased by 22.1% year-over-year to RMB5.6 billion in the second quarter of 2020. On a sequential basis, operating loss from the new initiatives and others segment expanded by 7.0% to RMB1.5 billion for the second quarter of 2020 from RMB 1.4 billion for the first quarter of 2020, while operating margin improved by 6.8 percentage points to negative 25.9% for the second quarter of 2020 from negative 32.7% for the first quarter of 2020. Operating loss from the new initiatives and others segment narrowed by 11.3% on a year-over-year basis, while operating margin improved by 9.8 percentage points year-over-year.

The COVID-19 pandemic was a catalyst for several of our new initiatives, and we saw a noticeable shift in the online shopping behavior on the consumer side and accelerated online penetration of traditional offline service businesses during the pandemic. During the second quarter of 2020, we maintained the rapid expansion of our key businesses, especially grocery retail business. Our marketplace model "Meituan Instashopping" achieved stellar revenue growth during the second quarter of 2020 on a year-over-year basis as we expanded our product variety and SKU categories to significantly grow our merchant base. "Caidaquan," our relatively nascent fresh produce-focused brand under "Meituan Instashopping," enabled more than 300 traditional wet markets to sell online and operate digitally. Our self-operated model, "Meituan Grocery," not only significantly expanded its coverage in key cities, such as Beijing and Shenzhen, but also began operations in new cities, such as Guangzhou, in July 2020. During the second quarter of 2020, we also established a new business division for community group purchase services, rolling out the "Meituan Selected" service brand accordingly in Jinan, Shandong in July 2020, which offers carefully selected fresh produce and daily necessities at attractive prices for local consumers living in different communities. Group leaders are appointed by us in each community to promote our discounted grocery products via WeChat groups. Group members can place orders through our WeChat Mini Program and pick up their products the next day at self-pickup points located in nearby convenience stores.

For bike-sharing services, we replaced around 1.5 million old bikes with new "Meituan Bikes" during the second quarter of 2020. The average turnover rate per bike improved incrementally and the unit economics also improved. Additionally, we launched more than 290,000 electric bikes. During this period, the average turnover rate per electric bike achieved better unit economics as compared to traditional bikes and demonstrated a clear path to independent profitability.

For the full announcement of Meituan 2020 interim results, please visit:
http://meituan.todayir.com/attachment/202008211704561761848748_en.pdf

About Meituan Dianping

Meituan Dianping (HKG: 3690) (the "Company" or "Meituan") is China’s leading e-commerce platform for services. With the mission of "We help people eat better, live better," the Company’s platform uses technology to connect consumers and merchants. Service offerings on the platform address people’s daily needs for food, and extend further to broad lifestyle and travel services. Meituan is the world’s leading on-demand food delivery service provider and China’s leading e-commerce platform for in-store dining services. Meituan helps consumers discover merchant information, make informed decisions, complete online and offline transactions and enjoy on-demand delivery. The Company currently owns several household brands in China, including Meituan, China’s leading online marketplace for services, Dianping, China’s leading online destination for discovering local services, Meituan Waimai for on-demand delivery services, and Meituan Bikes for bike-sharing services. Meituan has 457.3 million Annual Transacting Users and 6.3 million Annual Active Merchants as of June 30, 2020. The Company operates in over 2,800 cities and counties in China.

Forward-Looking Statements

This press release contains forward-looking statements relating to the business outlook, forecast business plans and growth strategies of the Company. These forward-looking statements are based on information currently available to the Company and are stated herein on the basis of the outlook at the time of this press release. They are based on certain expectations, assumptions and premises, some of which are subjective or beyond our control. These forward-looking statements may prove to be incorrect and may not be realized in future. Underlying the forward-looking statements is a large number of risks and uncertainties. Further information regarding these risks and uncertainties is included in our other public disclosure documents on our corporate website.

For media inquiries, please contact:
Meituan Dianping
pr.global@meituan.com   
ir@meituan.com

Edmond Lococo
ICR Inc.
Email: Edmond.Lococo@icrinc.com
Tel: +86 138-1079-1408

[i] Monetization rate equals the revenues for the period divided by the Gross Transaction Volume for the period.

Related Links :

https://www.meituan.com/

H-E-B and STRATACACHE Announce Expansion of Innovation Partnership


DAYTON, Ohio, Aug. 20, 2020 — H-E-B, consistently rated one of the top grocery retailers in the US, and STRATACACHE, leaders in marketing technology and in-store customer experiences, today announced an expansion of a successful multi-year innovation partnership, focusing on delivering new actionable data and insights to create an even greater customer shopping experience.

H-E-B continuously seeks improvement to the customer shopping experience. Using sensor-based insights gathered from STRATACACHE’s Walkbase solution, H-E-B gains a richer understanding of the service level in their stores, and will use the actionable data to advance many aspects of the in-store shopping experience. With the expansion of the existing Walkbase advanced solution, H-E-B will gain an even richer understanding of how to better serve their customers.

"STRATACACHE has proved to be a valued innovation partner with a clear history of delivering customer-focused solutions," said Paul Tepfenhart, Senior Vice President of Omnichannel Commerce & Emerging Technology at H-E-B. "At H-E-B, we never stop looking for ways to improve our experience by providing the best customer and partner solutions. Our relationship with STRATACACHE moves us forward on this mission."

"H-E-B is a great retail partner to bring STRATACACHE’s customer insights solutions to stores. Well known for a laser focus on delivering the best customer experiences, H-E-B has made continuous investments in technology that directly optimize their customers’ journey, making it more relevant and more efficient," said Chris Riegel, CEO of STRATACACHE. "We have built a strong partnership over several years, and now H-E-B has new customer insights to better serve their customers."

Learn more about H-E-B at www.heb.com and STRATACACHE at www.stratacache.com.

About STRATACACHE
STRATACACHE delivers in-store retail experience transformation and exceptional customer journeys through a wide array of marketing technology. Our solutions enable retailers to learn deeply about their customers’ shopping preferences and behaviors, delivering targeted promotional or task-based messaging on any digital display. With 3.3 million+ software activations globally, we power the biggest digital networks for the world’s largest brands. Across the STRATACACHE family of complementary Marketing Technology solution companies, we have the technology, expertise and track record to bring retail innovation that delivers results. Learn more about the STRATACACHE family at www.stratacache.com, on Twitter @STRATACACHE or on Facebook.

About H-E-B
H-E-B, with sales of $28 billion, operates more than 400 stores in Texas and Mexico. Known for its innovation and community service, H-E-B celebrates its 115th anniversary this year. Recognized for its fresh food, quality products, convenient services, and a commitment to environmental responsibility and sustainability, H-E-B strives to provide the best customer experience and lowest prices. Based in San Antonio, H-E-B employs over 120,000 Partners in Texas and Mexico and serves millions of customers in more than 300 communities. For more information, visit HEB.com and HEB.com/Newsroom.

Logo – https://mma.prnasia.com/media2/659530/STRATACACHE_Logo.jpg?p=medium600  

Related Links :

http://www.stratacache.com

Industry Aficionado Paul Peros Launches World’s First Tech-led Full Haircare Precision System


NEUCHATEL, Switzerland, Aug. 20, 2020 — The world’s only precision beauty company, REDUIT, has enjoyed unprecedented growth in its first months of launching, undeniably emerging as the ‘Tesla of Beauty’.

Paul Peros CEO REDUIT

Accelerating the growth of this Swiss brand is its release of 14 products in 14 weeks, with a further 13 products still to come. The patented haircare portfolio is now fully available in 40 countries worldwide, with a hotly anticipated skincare line coming soon.

Pioneered by Paul Peros, a notable global CEO, REDUIT’s vision was to reimagine the haircare category and offer a sustainable, yet powerful solution for all hair types through the use of innovation and technology to apply treatments, yet remain sustainably friendly to the planet.

"In French ‘Reduit’ means ‘reduced’; we reduce packaging, amplify results; reduce time, amplify efficacy; reduce steps and amplify beauty," says Paul Peros.

Currently available are 3 REDUIT devices to choose from (REDUIT One, REDUIT One Gold and REDUIT One Pro) which will all work with the 5 REDUIT Hairpods™, and 5 REDUIT LED Hairpods™.

Using game changing technology, innovation and Swiss design, REDUIT almost completely reduced the need for stabilizers, thickeners and fillers in haircare and created highly concentrated formulas and a revolutionary precision delivery system for amplified results.

"Most active ingredients in beauty products go to waste through inferior delivery systems. REDUIT’s technology ensures maximum performance: 38x more efficacious than traditional products, while reducing the waste by 20x. We are shaping a category which has been relatively immune to advancement in technology and innovation but we are also showing the giants how to do this and encourage sustainability at the same time," adds Peros.

In its first month of launching, REDUIT avoided over 30 tons of CO2 output compared to traditional products, and that figure is projected to near 400 kilo-tons by the end of the year, meaning REDUIT may be outperforming the beauty giants in its first year of operation.

With the current trajectory and continuing on its mission, REDUIT will have launched 25 products,including the full haircare line, and a full skincare line which is expected to include technological innovations of skincare devices powered with Skinpods™ to suit a multitude of skin types and for specific skin conditions, by the end of 2020 and available to 40 countries including China, US and UK.

Logo – https://techent.tv/wp-content/uploads/2020/08/industry-aficionado-paul-peros-launches-worlds-first-tech-led-full-haircare-precision-system-2.jpg
Photo – https://techent.tv/wp-content/uploads/2020/08/industry-aficionado-paul-peros-launches-worlds-first-tech-led-full-haircare-precision-system.jpg


Luxury brands embrace social media marketing in China

BEIJING, Aug. 20, 2020 — A news report by China.org.cn on China’s luxury goods market:


On August 6, the well-known luxury brand Louis Vuitton held a fashion show in Shanghai — its first since the coronavirus outbreak. Livestreamed across multiple social media platforms such as Douyin, the Chinese version of TikTok; Weibo, China’s Twitter; and a WeChat mini program, the show drew a sizeable audience, garnering more than 50 million views on Weibo alone.

The show’s popularity reflects the impressive performance of the Chinese luxury goods market. In the face of the ongoing COVID-19 crisis, the global luxury goods market is expected to shrink dramatically, while sales of many brands in Europe and America have plummeted. However, assessments of the China’s market are far rosier. The financial reports of groups such as LVMH and Kering all show that sales in China were significantly higher than those in other regions in the second quarter of 2020.

But it is not only in the luxury goods sector; the Chinese consumer market as a whole looks promising. The financial reports of many American companies, including Tesla and Nike, reveal that the Chinese market has helped offset the damage from tumbling sales in other regions. During this tough period, China has become a lucrative market for many international companies.

The reasons behind this are that China has contained the epidemic and recovered rapidly. China is regarded as one of the world’s largest and fastest growing consumer markets. Over the past few years, household wealth in the country has risen, the middle class continues to grow, and the spending power of consumers in second-, third- and fourth-tier cities has also increased significantly; millennials and Generation Z hold enormous influence in the market with their unique consumption habits; and online shopping and multi-channel retail is shaping consumption in China in new ways. One report even predicts that China will contribute around half of all global luxury consumption by 2025, which demonstrates the country’s vast consumer market and huge potential.

It is worth noting that due to the effect of COVID-19 on travel, many of the world’s top luxury companies have responded by promoting their brands on Chinese social media platforms such as Douyin and "Little Red Book". They have posted and livestreamed frequently to attract more Chinese consumers. In fact, the pandemic has acted more like a catalyst: social networking, which promotes individuality and interconnectivity, has crept into traditional brand promotion and sales, forming a new business model and generating returns. In the future, this model will become the new normal, helping to further unleash consumption potential and stimulate economic growth.

China Mosaic
http://www.china.org.cn/video/node_7230027.htm

Luxury brands embrace social media marketing in China
http://www.china.org.cn/video/2020-08/20/content_76618686.htm

ECOVACS ROBOTICS introduces DEEBOT OZMO T8 & T8+ to the T8 Family, its high-end intelligent floor cleaning robots series

The DEEBOT OZMO T8 is the first robotic vacuum cleaner to feature ECOVACS’ cutting-edge TrueDetect 3D obstacle detection and avoidance technology to deliver ultimate home cleaning experience

JAKARTA, Indonesia, Aug. 20, 2020 — ECOVACS ROBOTICS, the world’s leader of Home Service Robotics, today announces the launch of DEEBOT OZMO T8 and T8+. As the first robotic vacuum cleaner powered by ECOVACS’ cutting-edge TrueDetect 3D Technology, the revolutionary robot vacuum cleaners provide users with ultimate intelligent cleaning experience. Along with leading features including TrueMapping Technology, and the OZMO Mopping System, DEEBOT OZMO T8 and T8+ deliver enhanced and powerful in-depth smart cleaning capabilities.

DEEBOT OZMO T8
DEEBOT OZMO T8

"The DEEBOT OZMO T8 is the latest addition to the DEEBOT OZMO T8 Family and is the first robotic vacuum cleaner to feature ECOVACS cutting-edge TrueDetect 3D Technology which allows the robot to precisely identify objects and avoid collisions," said David Qian, CEO of ECOVACS ROBOTICS. "It is part of our commitment to provide consumers with the latest smart and complete cleaning experiences as they increasingly move towards automated home care."

DEEBOT OZMO T8 Family

Smart-Environmental Perception Technology to Identify and Avoid Obstacles

By using ECOVACS’ advanced TrueDetect 3D Technology, which is based on a structured light technology and 3D scanning algorithm widely used in advanced facial recognition and mobile payments, DEEBOT OZMO T8 can identify obstacles precisely and avoid them accordingly, allowing it to move freely when cleaning.

For millimeter-level detection accuracy, DEEBOT OZMO T8 can detect objects in front from a distance of 4.5cm up to 30cm to obtain high-precision resolution and depth information. It can additionally detect objects as small as 1mm, which is 10 times more accurate than traditional infrared technology. By using real-time 3D scanning, its millimeter-level detection capability allows T8 to detect small objects including cables, slippers and slim furniture, reducing the risk of getting stuck or tangled and enabling quicker and smoother cleaning.

Efficient and Thorough Whole-House Cleaning Coverage

Equipped with TrueMapping laser-based mapping and navigation technology, an aerospace-standard detection technology with a dToF sensor first adopted for this function in the industry, floor maps can be created in seconds by DEEBOT OZMO T8 to improve overall cleaning efficiency. This allows the robot to intelligently navigate the user’s home, bringing intelligent and thorough cleaning experience.

Compared with the previous generation of laser guidance technology, DEEBOT OZMO T8 can detect a double distance and has four-fold precision to detect objects. The distance is up to 10m and objects as small as 2mm can be detected. Larger family homes will particularly benefit from this feature as it improves cleaning efficiency and builds more detailed and accurate home cleaning maps.

With Multi-floor Mapping Technology, DEEBOT OZMO T8 can also scan and store multiple maps of different levels of the user’s home, allowing the robot to customize its cleaning process for each level once it identifies the appropriate map. Users can further customize where they would like the robot to clean in each map with the customized cleaning function, and restrict the robot to clean a specific area with the Virtual Boundary™ function.

Powerful In-depth Cleaning Performance

With its OZMO™ Mopping System, DEEBOT OZMO T8 provides powerful mopping and vacuuming capabilities at the same time, maximizing cleaning efficiency and removes over 99%[1] of bacteria. The robot can easily mop and clean stains, and dust will be removed in crevices up to 4mm deep, ensuring optimal cleaning results thanks to the four-step cleaning process.

The carpet detection technology allows DEEBOT OZMO T8 to automatically increase suction power on carpets when vacuuming and avoid carpets when mopping, keeping the cleaning experience completely automated and thorough for users.

Power-up Kits

Two power-up kits are now available for DEEBOT OZMO T8 to enhance overall cleaning performance and user experience. The OZMO™ Pro Oscillating Mopping System kit enables robots to deal with stubborn stains by using electrically powered high-frequency vibration, and a unique fine mopping mode which is comparable to an electronic mop. The oscillating mop vibrates up to 480 times per minute. Bundled with DEEBOT OZMO T8 and making it as DEEBOT OZMO T8+, the other kit is Auto-Empty Station which clears the robot’s dustbin automatically after cleaning. The station’s disposable dust bag holds up to 30 days of dirt and debris to dramatically reduce the need to frequently clear the dustbin, so users can enjoy cleaning homes for weeks without the hassle of dumping the bag.

Intelligent Control for Remote Cleaning Management

Paired with the ECOVACS HOME App, or smart home devices such as Amazon Echo/Dot and Google Home, users can control DEEBOT OZMO T8 remotely to enjoy the comfort of intelligent cleaning.

Pricing and Availability

DEEBOT OZMO T8 is available on Tokopedia, Lazada, Shopee and Blibli for IDR 7.990.000, and DEEBOT OZMO T8+ (T8 bundled set with the Auto-Empty Station) is available on Tokopedia, Shopee, and Blibli for IDR 9.990.000. For more information, please visit ecovacs.com or connect with us on Instagram.

About ECOVACS ROBOTICS

Innovating Since Day One – Creating the Intelligent Home.

At ECOVACS ROBOTICS, we care about innovating solutions to enhance your lifestyle. Based on deep understanding of use cases and consumer experiences, we design robots that help you to "live smart, enjoy life".

With over 20 years of design and industry-leading research, we have led the market as homes become more intelligent and responsive. We are building a world where your home asks less of your attention, becomes more seamless and powerful, and frees you to spend more time doing what you love.

[1] Certified by Hygiene & Microbiology Research Center, Japan, 2019 

Photo – https://photos.prnasia.com/prnh/20200812/2883454-1-a?lang=0
Photo – https://photos.prnasia.com/prnh/20200812/2883454-1-b?lang=0

Related Links :

http://ecovacs.com

Vipshop Reports Unaudited Second Quarter 2020 Financial Results

Conference Call to Be Held at 7:30 A.M. U.S. Eastern Time on August 19, 2020

GUANGZHOU, China, Aug. 19, 2020 — Vipshop Holdings Limited (NYSE: VIPS), a leading online discount retailer for brands in China ("Vipshop" or the "Company"), today announced its unaudited financial results for the second quarter ended June 30, 2020.

Second Quarter 2020 Highlights

  • Total net revenue for the second quarter of 2020 increased by 6.0% year over year to RMB24.1 billion (US$3.4 billion) from RMB22.7 billion in the prior year period.
  • GMV[1] for the second quarter of 2020 increased by 9% year over year to RMB38.4 billion from RMB35.1 billion in the prior year period.
  • Gross profit for the second quarter of 2020 was RMB4.9 billion (US$699.2 million), as compared with RMB5.1 billion in the prior year period.
  • Net income attributable to Vipshop’s shareholders for the second quarter of 2020 increased by 88.9% year over year to RMB1.5 billion (US$217.5 million) from RMB813.5 million in the prior year period.
  • Non-GAAP net income attributable to Vipshop’s shareholders[2] for the second quarter of 2020 increased by 24.3% year over year to RMB1.3 billion (US$186.9 million) from RMB1.1 billion in the prior year period.
  • The number of active customers[3] for the second quarter of 2020 increased by 17% year over year to 38.8 million from 33.1 million in the prior year period.
  • Total orders[4] for the second quarter of 2020 increased by 15% year over year to 170.5 million from 147.8 million in the prior year period.

Mr. Eric Shen, Chairman and Chief Executive Officer of Vipshop, stated, "We are delighted to have delivered solid financial and operational results in the second quarter of 2020, driven by our strong merchandising capability. In particular, our number of active customers during the quarter increased by 17% year over year to 38.8 million from 33.1 million in the same period last year. We have seen strong recovery in demand for apparel since early May and ran a successful promotional campaign in June after daily life in China has returned to normal. Looking ahead, we will continue to focus on enhancing our product offerings, working more effectively with our suppliers to provide our customers with top-notch apparel assortments. We believe that we are well positioned to continue to gain market share in China’s discount retail segment."

Mr. Donghao Yang, Chief Financial Officer of Vipshop, further commented, "We finished the second quarter of 2020 with healthy topline growth and improved year-over-year net margin attributable to Vipshop’s shareholders. During the quarter, repeat customers as a percentage of total active customers increased to 90% from 87% in the prior year period, representing a meaningful enhancement in our customer stickiness. These successes were made possible by our team’s solid execution in optimizing our product assortment to meet our customers’ needs. Looking ahead, we will continue to execute on our merchandising strategy, aiming to deliver strong topline growth balanced with solid profitability."

Second Quarter 2020 Financial Results

REVENUE

Total net revenue for the second quarter of 2020 increased by 6.0% year over year to RMB24.1 billion (US$3.4 billion) from RMB22.7 billion in the prior year period, primarily driven by the growth in the number of total active customers.

GROSS PROFIT

Gross profit for the second quarter of 2020 was RMB4.9 billion (US$699.2 million), as compared with 5.1 billion in the prior year period. Gross margin for the second quarter of 2020 was 20.5%, as compared with 22.4% in the prior year period, primarily attributable to the Company’s strategy to reinvest into discounts and coupons during this year’s June promotional event.

OPERATING EXPENSES

Total operating expenses for the second quarter of 2020 decreased to RMB3.8 billion (US$540.0 million) from RMB4.2 billion in the prior year period. As a percentage of total net revenue, total operating expenses for the second quarter of 2020 decreased to 15.8% from 18.5% in the prior year period.

  • Fulfillment expenses for the second quarter of 2020 decreased to RMB1.7 billion (US$237.3 million) from RMB2.2 billion in the prior year period. As a percentage of total net revenue, fulfillment expenses for the second quarter of 2020 decreased to 7.0% from 9.7% in the prior year period, primarily attributable to the change in fulfillment logistic arrangement.
  • Marketing expenses for the second quarter of 2020 were RMB1.0 billion (US$145.6 million), as compared with RMB877.6 million in the prior year period. As a percentage of total net revenue, marketing expenses for the second quarter of 2020 were 4.3%, as compared with 3.9% in the prior year period.
  • Technology and content expenses for the second quarter of 2020 decreased to RMB305.4 million (US$43.2 million) from RMB422.3 million in the prior year period. As a percentage of total net revenue, technology and content expenses for the second quarter of 2020 decreased to 1.3% from 1.9% in the prior year period.
  • General and administrative expenses for the second quarter of 2020 were RMB804.6 million (US$113.9 million), as compared with RMB706.3 million in the prior year period. As a percentage of total net revenue, general and administrative expenses for the second quarter of 2020 were 3.3%, as compared with 3.1% in the prior year period.

INCOME FROM OPERATIONS

Income from operations for the second quarter of 2020 increased by 28.4% year over year to RMB1.2 billion (US$175.5 million) from RMB965.4 million in the prior year period. Operating margin for the second quarter of 2020 increased to 5.1% from 4.2% in the prior year period.

Non-GAAP income from operations[5] for the second quarter of 2020, which excluded share-based compensation expenses and amortization of intangible assets resulting from business acquisitions, increased by 27.1% year over year to RMB1.5 billion (US$211.4 million) from RMB1.2 billion in the prior year period. Non-GAAP operating income margin[6] for the second quarter of 2020 increased to 6.2% from 5.2% in the prior year period.

NET INCOME

Net income attributable to Vipshop’s shareholders for the second quarter of 2020 increased by 88.9% year over year to RMB1.5 billion (US$217.5 million) from RMB813.5 million in the prior year period. Net margin attributable to Vipshop’s shareholders for the second quarter of 2020 increased to 6.4% from 3.6% in the prior year period. Net income attributable to Vipshop’s shareholders per diluted ADS[7] for the second quarter of 2020 increased to RMB2.24 (US$0.32) from RMB1.21 in the prior year period.

Non-GAAP net income attributable to Vipshop’s shareholders for the second quarter of 2020, which excluded (i) share-based compensation expenses, (ii) amortization of intangible assets resulting from business acquisitions, (iii) tax effect of amortization of intangible assets resulting from business acquisitions, (iv) investment gain and revaluation of investments excluding dividends, (v) tax effect of investment gain and revaluation of investments excluding dividends, and (vi) share of loss in investment of limited partnership that is accounted for as an equity method investee, increased by 24.3% year over year to RMB1.3 billion (US$186.9 million) from RMB1.1 billion in the prior year period. Non-GAAP net margin attributable to Vipshop’s shareholders[8] for the second quarter of 2020 increased to 5.5% from 4.7% in the prior year period. Non-GAAP net income attributable to Vipshop’s shareholders per diluted ADS[9] for the second quarter of 2020 increased to RMB1.92 (US$0.27) from RMB1.58 in the prior year period.

For the quarter ended June 30, 2020, the Company’s weighted average number of ADSs used in computing diluted income per ADS was 686,613,335.

BALANCE SHEET AND CASH FLOW

As of June 30, 2020, the Company had cash and cash equivalents and restricted cash of RMB8.1 billion (US$1.1 billion) and short term investments of RMB5.9 billion (US$840.7 million).

For the quarter ended June 30, 2020, net cash from operating activities was RMB5.1 billion (US$720.3 million), and free cash flow[10], a non-GAAP measurement of liquidity, was as follows:

For the three months ended

Jun 30, 2019

RMB’000

Jun 30, 2020

RMB’000

Jun 30, 2020

US$’000

Net cash from operating activities

3,438,809

5,088,869

720,283

Add: Net impact from Internet financing
activities[11]

(1,254,977)

(311,652)

(44,111)

Less: Capital expenditures

(936,124)

(452,630)

(64,066)

Free cash inflow

1,247,708

4,324,587

612,106

For the trailing twelve months ended

Jun 30, 2019

RMB’000

Jun 30, 2020

RMB’000

Jun 30, 2020

US$’000

Net cash from operating activities

10,207,552

11,549,627

1,634,744

Add: Net impact from Internet financing
activities[11]

(1,829,324)

(4,027,419)

(570,044)

Less: Capital expenditures

(3,954,839)

(3,375,199)

(477,728)

Free cash inflow

4,423,389

4,147,009

586,972

Recent Development

Mr. Donghao Yang will step down from the Company’s Chief Financial Officer position for personal reasons in November 2020, and the Company’s Board of Directors has appointed Mr. Yang as a new Non-Executive Director, effective simultaneously with the change of his position. Mr. Yang has served as the Company’s Chief Financial Officer since 2011 and made significant contributions to the Company’s growth and transformation from a privately held company into a publicly listed company with effective internal control and compliance systems in the past nine years. The Company has already commenced a search process for a new Chief Financial Officer. 

Business Outlook

For the third quarter of 2020, the Company expects its total net revenue to be between RMB20.6 billion and RMB21.6 billion, representing a year-over-year growth rate of approximately 5% to 10%. These forecasts reflect the Company’s current and preliminary view on the market and operational conditions, which is subject to change.

Exchange Rate

The Company’s business is primarily conducted in China and the significant majority of revenues generated are denominated in Renminbi. This announcement contains currency conversions of Renminbi amounts into U.S. dollars solely for the convenience of the reader. Unless otherwise noted, all translations from Renminbi to U.S. dollars are made at a rate of RMB7.0651 to US$1.00, the effective noon buying rate on June 30, 2020 as set forth in the H.10 statistical release of the Federal Reserve Board. No representation is made that the Renminbi amounts could have been, or could be, converted, realized or settled into U.S. dollars at that rate on June 30, 2020, or at any other rate.

Conference Call Information

The Company will hold a conference call on Wednesday, August 19, 2020 at 7:30 am Eastern Time or 7:30 pm Beijing Time to discuss its financial results and operating performance for the second quarter of 2020.

All participants wishing to join the conference call must pre-register online using the link provided below. Once pre-registration has been complete, participants will receive dial-in numbers, a passcode, and a unique registrant ID. To join the conference, simply dial the number in the calendar invite you receive after pre-registration, enter the passcode followed by your PIN, and you will join the conference instantly.

Conference ID

#2094639

Registration Link

http://apac.directeventreg.com/registration/event/2094639

The replay will be accessible through August 27, 2020 by dialing the following numbers:

United States Toll Free:

+1-855-452-5696

International:

+61-2-8199-0299

Conference ID:

#2094639

A live and archived webcast of the conference call will also be available at the Company’s investor relations website at http://ir.vip.com.

About Vipshop Holdings Limited

Vipshop Holdings Limited is a leading online discount retailer for brands in China. Vipshop offers high quality and popular branded products to consumers throughout China at a significant discount to retail prices. Since it was founded in August 2008, the Company has rapidly built a sizeable and growing base of customers and brand partners. For more information, please visit www.vip.com.

Safe Harbor Statement

This announcement contains forward-looking statements. These statements are made under the "safe harbor" provisions of the U.S. Private Securities Litigation Reform Act of 1995. These forward-looking statements can be identified by terminology such as "will," "expects," "anticipates," "future," "intends," "plans," "believes," "estimates" and similar statements. Among other things, the business outlook and quotations from management in this announcement, as well as Vipshop’s strategic and operational plans, contain forward-looking statements. Vipshop may also make written or oral forward-looking statements in its periodic reports to the U.S. Securities and Exchange Commission (the "SEC"), in its annual report to shareholders, in press releases and other written materials and in oral statements made by its officers, directors or employees to third parties. Statements that are not historical facts, including statements about Vipshop’s beliefs and expectations, are forward-looking statements. Forward-looking statements involve inherent risks and uncertainties. A number of factors could cause actual results to differ materially from those contained in any forward-looking statement, including but not limited to the following: Vipshop’s goals and strategies; Vipshop’s future business development, results of operations and financial condition; the expected growth of the online discount retail market in China; Vipshop’s ability to attract customers and brand partners and further enhance its brand recognition; Vipshop’s expectations regarding demand for and market acceptance of flash sales products and services; competition in the discount retail industry; the potential impact of the COVID-19 to Vipshop’s business operations and the economy in China and elsewhere generally; fluctuations in general economic and business conditions in China and assumptions underlying or related to any of the foregoing. Further information regarding these and other risks is included in Vipshop’s filings with the SEC. All information provided in this press release is as of the date of this press release, and Vipshop does not undertake any obligation to update any forward-looking statement, except as required under applicable law.

Use of Non-GAAP Financial Measures

The condensed consolidated financial information is derived from the Company’s unaudited interim condensed consolidated financial statements prepared in conformity with accounting principles generally accepted in the United States of America ("U.S. GAAP"), except that comparative consolidated statements of income and cash flows for the period presented and detailed footnote disclosures required by Accounting Standards Codification 270, Interim Reporting ("ASC270"), have been omitted. Vipshop uses non-GAAP net income attributable to Vipshop’s shareholders, non-GAAP net income attributable to Vipshop’s shareholders per diluted ADS, non-GAAP income from operations, non-GAAP operating income margin, non-GAAP net margin attributable to Vipshop’s shareholders, and free cash flow, each of which is a non-GAAP financial measure. Non-GAAP net income attributable to Vipshop’s shareholders is net income attributable to Vipshop’s shareholders excluding (i) share-based compensation expenses, (ii) amortization of intangible assets resulting from business acquisitions, (iii) tax effect of amortization of intangible assets resulting from business acquisitions, (iv) investment gain and revaluation of investments excluding dividends, (v) tax effect of investment gain and revaluation of investments excluding dividends, and (vi) share of loss in investment of limited partnership that is accounted for as an equity method investee. Non-GAAP net income attributable to Vipshop’s shareholders per diluted ADS is computed using non-GAAP net income attributable to Vipshop’s shareholders divided by weighted average number of diluted ADS outstanding for computing diluted earnings per ADS. Non-GAAP income from operations is income from operations excluding share-based compensation expenses and amortization of intangible assets resulting from business acquisitions. Non-GAAP operating income margin is non-GAAP income from operations as a percentage of total net revenue. Non-GAAP net margin attributable to Vipshop’s shareholders is non-GAAP net income attributable to Vipshop’s shareholders as a percentage of total net revenue. Free cash flow is net cash from operating activities adding back the impact from Internet financing activities and less capital expenditures, which include purchase and deposits of property and equipment and land use rights, and purchase of other assets. Impact from Internet financing activities added back or deducted from free cash flow contains changes in the balances of financial products, which are primarily consumer financing and supplier financing that the Company provides to customers and suppliers. The Company believes that separate analysis and exclusion of the non-cash impact of (a) share-based compensation, (b) amortization of intangible assets resulting from business acquisitions, (c) investment gain and revaluation of investments excluding dividends, and (d) share of loss in investment of limited partnership that is accounted for as an equity method investee adds clarity to the constituent parts of its performance. The Company reviews these non-GAAP financial measures together with GAAP financial measures to obtain a better understanding of its operating performance. It uses these non-GAAP financial measures for planning, forecasting and measuring results against the forecast. The Company believes that non-GAAP financial measures are useful supplemental information for investors and analysts to assess its operating performance without the effect of (1) non-cash share-based compensation expenses, (2) amortization of intangible assets resulting from business acquisitions, (3) investment gain and revaluation of investments excluding dividends, and (4) share of loss in investment of limited partnership that is accounted for as an equity method investee. Free cash flow enables the Company to assess liquidity and cash flow, taking into account the impact from Internet financing activities and the financial resources needed for the expansion of fulfillment infrastructure and technology platform. Share-based compensation expenses and amortization of intangible assets have been and will continue to be significant recurring expenses in its business. However, the use of non-GAAP financial measures has material limitations as an analytical tool. One of the limitations of using non-GAAP financial measures is that they do not include all items that impact the Company’s net income for the period. In addition, because non-GAAP financial measures are not measured in the same manner by all companies, they may not be comparable to other similar titled measures used by other companies. One of the key limitations of free cash flow is that it does not represent the residual cash flow available for discretionary expenditures.

The presentation of these non-GAAP financial measures is not intended to be considered in isolation from, or as a substitute for, the financial information prepared and presented in accordance with U.S. GAAP. For more information on these non-GAAP financial measures, please see the table captioned "Vipshop Holdings Limited Reconciliations of GAAP and Non-GAAP Results" at the end of this release.

[1] "Gross merchandise value (GMV)" is defined as the total Renminbi value of all products and services sold through the Company’s online sales business, online marketplace platform, offline stores, and Shan Shan Outlets during the relevant period, including through the Company’s websites and mobile apps, third-party websites and mobile apps, Vipshop offline stores and Vipmaxx offline stores, as well as Shan Shan Outlets that were fulfilled by either the Company or its third-party merchants, regardless of whether or not the goods were delivered or returned. GMV includes shipping charges paid by buyers to sellers. For prudent considerations, the Company does not consider products or services to be sold if the relevant orders were placed and canceled pre-shipment and only included orders that left the Company’s or other third-party vendors’ warehouses.

[2] Non-GAAP net income attributable to Vipshop’s shareholders is a non-GAAP financial measure, which is defined as net income attributable to Vipshop’s shareholders excluding (i) share-based compensation expenses, (ii) amortization of intangible assets resulting from business acquisitions, (iii) tax effect of amortization of intangible assets resulting from business acquisitions, (iv) investment gain and revaluation of investments excluding dividends, (v) tax effect of investment gain and revaluation of investments excluding dividends, and (vi) share of loss in investment of limited partnership that is accounted for as an equity method investee.

[3] "Active customers" is defined as registered members who have purchased from the Company’s online sales business or the Company’s online marketplace platforms at least once during the relevant period.

[4] "Total orders" is defined as the total number of orders placed during the relevant period, including the orders for products and services sold through the Company’s online sales business and the Company’s online marketplace platforms (excluding, for the avoidance of doubt, orders from the Company’s offline stores and outlets), net of orders returned.

[5] Non-GAAP income from operations is a non-GAAP financial measure, which is defined as income from operations excluding share-based compensation expenses and amortization of intangible assets resulting from business acquisitions.

[6] Non-GAAP operating income margin is a non-GAAP financial measure, which is defined as non-GAAP income from operations as a percentage of total net revenues.

[7] "ADS" means American depositary share, each of which represents 0.2 Class A ordinary share.

[8] Non-GAAP net margin attributable to Vipshop’s shareholders is a non-GAAP financial measure, which is defined as non-GAAP net income attributable to Vipshop’s shareholders, as a percentage of total net revenues.

[9] Non-GAAP net income attributable to Vipshop’s shareholders per diluted ADS is a non-GAAP financial measure, which is defined as non-GAAP net income attributable to Vipshop’s shareholders, divided by the weighted average number of diluted ADS outstanding for computing diluted earnings per ADS.

[10] Free cash flow is a non-GAAP financial measure, which is defined as net cash from (used in) operating activities adding back the impact from Internet financing activities and less capital expenditures, which include purchase and deposits of property and equipment and land use rights, and purchase of other assets.

[11] Net impact from Internet financing activities represents net cash flow relating to the Company’s financial products, which are primarily consumer financing and supplier financing that the Company provides to its customers and suppliers.


Vipshop Holdings Limited

Unaudited Condensed Consolidated Statements of Income and Comprehensive Income 

(In thousands, except for share and per share data)

Three Months Ended

June 30, 2019

March 31, 2020

June 30, 2020

June 30, 2020

RMB’000

RMB’000

RMB’000

USD’000

Product revenues 

21,721,951

17,964,195

23,213,007

3,285,588

Other revenues(1)

1,021,767

828,660

897,660

127,055

Total net revenues

22,743,718

18,792,855

24,110,667

3,412,643

Cost of revenues

(17,654,577)

(15,175,739)

(19,170,864)

(2,713,460)

Gross profit

5,089,141

3,617,116

4,939,803

699,183

Operating expenses:

Fulfillment expenses(2)

(2,198,543)

(1,393,690)

(1,676,229)

(237,255)

Marketing expenses

(877,573)

(412,305)

(1,028,903)

(145,632)

Technology and content expenses

(422,314)

(338,398)

(305,381)

(43,224)

General and administrative expenses

(706,252)

(839,220)

(804,619)

(113,886)

Total operating expenses

(4,204,682)

(2,983,613)

(3,815,132)

(539,997)

Other operating income

80,904

148,688

115,336

16,325

Income from operations

965,363

782,191

1,240,007

175,511

Investment gain and revaluation of investments

15,012

42,553

551,443

78,052

Impairment loss of investments

0

(5,046)

0

0

Interest expense

(12,194)

(35,395)

(21,070)

(2,982)

Interest income

41,732

81,190

100,286

14,195

Foreign exchange gain (loss)

30,920

48,754

(14,272)

(2,020)

Income before income tax expense and share of (loss) gain of equity method investees

1,040,833

914,247

1,856,394

262,756

Income tax expenses 

(213,392)

(172,716)

(324,883)

(45,984)

Share of (loss) gain of equity method investees

(9,572)

(60,639)

7,588

1,074

Net income

817,869

680,892

1,539,099

217,846

Net (gain) loss attributable to non-controlling interests

(4,351)

3,933

(2,179)

(308)

Net income attributable to Vipshop’s shareholders

813,518

684,825

1,536,920

217,538

Shares used in calculating earnings per share(3):

Weighted average number of Class A and Class B ordinary shares:

—Basic

133,403,777

134,326,928

134,956,142

134,956,142

—Diluted

134,648,293

136,909,242

137,322,667

137,322,667

Net earnings per Class A and Class B ordinary share

Net income attributable to Vipshop’s shareholders–Basic

6.10

5.10

11.39

1.61

Net income attributable to Vipshop’s shareholders–Diluted

6.04

5.00

11.19

1.58

Net earnings per ADS (1 ordinary share equals to 5 ADSs)

Net income attributable to Vipshop’s shareholders–Basic

1.22

1.02

2.28

0.32

Net income attributable to Vipshop’s shareholders–Diluted

1.21

1.00

2.24

0.32

(1) Other revenues primarily consist of revenues from third-party logistics services, product promotion and online advertising, fees
charged to third-party merchants which the Company provides platform access for sales of their products, interest income from
microcredit and consumer financing services, and inventory and warehouse management services to certain suppliers.

(2) Fulfillment expenses include shipping and handling expenses, which amounted RMB 1.21 billion, RMB 0.8 billion, and RMB 1.1
billion in the three month periods ended June 30,2019, March 31,2020 and June 30,2020, respectively.

(3) Authorized share capital is re-classified and re-designated into Class A ordinary shares and Class B ordinary shares, with each Class
A ordinary share being entitled to one vote and each Class B ordinary share being entitled to ten votes on all matters that are subject to
shareholder vote.

Three Months Ended

June 30, 2019

March 31, 2020

June 30, 2020

June 30, 2020

RMB’000

RMB’000

RMB’000

USD’000

Share-based compensation expenses included are as follows

Fulfillment expenses

37,497

27,215

25,905

3,667

Marketing expenses

10,970

3,939

4,661

660

Technology and content expenses

58,010

44,402

45,201

6,398

General and administrative expenses

103,048

171,455

172,136

24,364

Total

209,525

247,011

247,903

35,089

Vipshop Holdings Limited

Unaudited Condensed Consolidated Balance Sheets

(In thousands, except for share and per share data)

December 31, 2019

June 30, 2020

June 30, 2020

RMB’000

RMB’000

USD’000

ASSETS

CURRENT ASSETS

Cash and cash equivalents

6,573,808

7,395,029

1,046,698

Restricted cash 

1,145,477

704,630

99,734

Short term investments

3,052,726

5,939,873

840,734

Accounts receivable, net

1,295,766

537,530

76,082

Amounts due from related parties

47,964

359,327

50,859

Other receivables and prepayments,net

2,897,893

2,480,658

351,114

Loan receivables,net

306,115

90,401

12,795

Inventories

7,708,292

5,764,895

815,968

Total current assets

23,028,041

23,272,343

3,293,984

NON-CURRENT ASSETS

Property and equipment, net

11,256,810

12,391,200

1,753,860

Deposits for property and equipment

101,800

62,283

8,816

Land use rights, net

5,541,108

5,874,963

831,547

Intangible assets, net

337,310

360,309

50,998

Investment in equity method investees

3,112,952

2,119,858

300,046

Other investments

2,002,756

2,502,921

354,265

Other long-term assets

608,073

488,708

69,172

Amounts due from related party-non current

102,000

59,446

8,414

Goodwill

236,711

369,902

52,356

Deferred tax assets, net

539,561

612,344

86,672

Operating lease right-of-use assets

1,715,556

1,988,535

281,459

Total non-current assets

25,554,637

26,830,469

3,797,605

TOTAL ASSETS

48,582,678

50,102,812

7,091,589

LIABILTIES AND  EQUITY 

CURRENT LIABILITIES

Short term loans

1,093,645

1,850,828

261,968

Accounts payable

13,792,200

11,901,904

1,684,605

Advance from customers 

1,233,165

1,053,406

149,100

Accrued expenses and other current liabilities 

6,534,575

5,872,404

831,185

Amounts due to related parties 

532,788

337,595

47,784

Deferred income 

405,994

324,510

45,931

Operating lease liabilities

333,268

291,701

41,288

Total current liabilities

23,925,635

21,632,348

3,061,861

NON-CURRENT LIABILITIES

Long term loans

64,515

197,858

28,005

Deferred tax liability 

165,098

388,251

54,953

Deferred income-non current 

782,068

926,827

131,184

Operating lease liabilities

1,395,665

1,737,726

245,959

Other long term liabilities 

0

40,085

5,674

Total non-current liabilities

2,407,346

3,290,747

465,775

TOTAL LIABILITIES

26,332,981

24,923,095

3,527,636

EQUITY:

Class A ordinary shares (US$0.0001 par value, 483,489,642 shares authorized, and
117,584,362 and 118,686,997 shares issued and outstanding as of December 31,
2019 and June 30,2020, respectively) 

76

77

11

Class B ordinary shares (US$0.0001 par value, 16,510,358 shares authorized, and
16,510,358 and 16,510,358 shares issued and outstanding as of December 31, 2019
and June 30,2020, respectively) 

11

11

2

Additional paid-in capital

9,959,497

10,443,055

1,478,119

Retained earnings

11,924,228

14,055,203

1,989,385

Accumulated other comprehensive loss

(56,656)

(34,342)

(4,867)

Non-controlling interests

422,541

715,713

101,303

Total shareholders’ equity

22,249,697

25,179,717

3,563,953

TOTAL LIABILITIES AND SHAREHOLDERS’ EQUITY 

48,582,678

50,102,812

7,091,589

Vipshop Holdings Limited

 Reconciliations of GAAP and Non-GAAP Results

Three Months Ended

June 30, 2019

June 30, 2020

June 30, 2020

RMB’000

RMB’000

USD’000

Income from operations

965,363

1,240,007

175,511

Share-based compensation expenses

209,525

247,903

35,089

Amortization of intangible assets resulting from business acquisitions 

511

5,896

835

Non-GAAP income from operations

1,175,399

1,493,806

211,435

Net income

817,869

1,539,099

217,846

Share-based compensation expenses

209,525

247,903

35,089

Investment gain and revaluation of investments excluding dividends

(2,198)

(551,443)

(78,052)

Share of loss in investment of limited partnership that is accounted for as an equity
method investee

24,218

27,739

3,926

Tax effect of investment gain and revaluation of investments excluding dividends

17,150

55,044

7,791

Amortization of intangible assets resulting from business acquisitions

511

5,896

835

Tax effect of amortization of intangible assets resulting from business acquisitions

(128)

(1,474)

(209)

Non-GAAP net income

1,066,947

1,322,764

187,226

Net income attributable to Vipshop’s shareholders

813,518

1,536,920

217,538

Share-based compensation expenses

209,525

247,903

35,089

Investment gain and revaluation of investments excluding dividends

(2,198)

(551,443)

(78,052)

Share of loss in investment of limited partnership that is accounted for as an equity
method investee

24,218

27,739

3,926

Tax effect of investment gain and revaluation of investments excluding dividends

17,150

55,044

7,791

Amortization of intangible assets resulting from business acquisitions 

501

5,896

835

Tax effect of amortization of intangible assets resulting from business acquisitions 

(125)

(1,474)

(209)

Non-GAAP net income attributable to Vipshop’s shareholders

1,062,589

1,320,585

186,918

Shares used in calculating earnings per share:

Weighted average number of Class A and Class B ordinary shares:

–Basic

133,403,777

134,956,142

134,956,142

–Diluted

134,648,293

137,322,667

137,322,667

Non-GAAP net income per Class A and Class B ordinary share

Non-GAAP net income attributable to Vipshop’s shareholders–Basic

7.97

9.79

1.39

Non-GAAP net income attributable to Vipshop’s shareholders–Diluted

7.89

9.62

1.36

Non-GAAP net income per ADS (1 ordinary share equal to 5 ADSs)

Non-GAAP net income attributable to Vipshop’s shareholders–Basic

1.59

1.96

0.28

Non-GAAP net income attributable to Vipshop’s shareholders–Diluted

1.58

1.92

0.27

Related Links :

http://www.vip.com

Blis keeps finger on the pulse of consumer behaviour with global sentiment tracker


1 in 3 Singaporeans would save additional funds as sentiment starts to slowly decline

SINGAPORE, Aug. 19, 2020 — Blis, a trusted leader in location-powered advertising and analytics has today released the Blis consumer confidence pulse, an interactive tracker that captures a quick snapshot of consumer sentiment. The tracker plots how consumers are feeling about their local economy, household finances and spending intent and the survey is running in Singapore, the UK, USA, UAE and Australia.

Based on three highly topical questions around finances the Blis pulse is updated twice monthly to provide a rounded picture of how consumers are reacting to changes in their situation, both personally and on a national scale.

Head of Insights, Alex Wright speaking on the tracker said, "We started this tracker in the wake of the COVID-19 outbreak being declared a pandemic to give us a quick read on consumer sentiment. Armed with the knowledge of what consumers are telling us, we can then plot this against our retail foot traffic and consumer movement data to give a rounded view of progress through crisis, stability and recovery."

Over the past six months, physical movement restrictions have ebbed and flowed in different cities across the country with daily activities requiring new safety measures. As a result, most consumers are behaving differently, with many working from home, avoiding crowded public spaces and communicating virtually. For brands, this tracker provides an opportunity to contextualise other data sources to really understand the concerns of their audience.

For the most part sentiment towards the Singaporean economy has remained remarkably robust, except for a dramatic swing in June. This coincided with Prime Minister Lee’s address to the nation and messaging from several government ministers that the Covid-19 pandemic meant the road to recovery would be a long one. Early July saw the most optimism in both the economy and household finances although we’re beginning to see a decline in sentiment once again. Interestingly, the pessimistic spike in early June led to a surge in intent to spend additional funds on home improvement, as people prepared to settle in for the long haul. Aside from this, Singaporeans have consistently declared their intent to save any spare income.

"2020 has been nothing short of a rollercoaster year. Everyone has been impacted differently and now people are not only concerned about the health crisis, but also the global financial crisis. Since March, we’ve seen brands pivot their operations, strategy and messaging multiple times to meet their consumers’ concerns about safety. Looking ahead, it’s essential for brands to pivot again and remain sensitive to their audience’s financial confidence. The Blis consumer confidence pulse allows brands a quick snapshot of the direction of sentiment," said Fionn Hyndman, Managing Director Asia.

The interactive trackers can be found here and will be updated twice monthly.

For associated images click here.

About Blis

Blis is the trusted leader in location-powered advertising and analytics, helping brands understand, reach and engage consumers globally to deliver measurable results. Because location data is the most accurate indicator of ‘real’ behaviour and intent at scale vs any other type of data, Blis uses this data to map real-world consumer behaviours based on where people are and where they’ve been, uncovering the truth about what people actually do.

Blis’ Smart Platform provides unmatched transparency, accuracy and scale. Its three tried and tested proprietary technologies – Smart Pin, Smart Scale and Smart Places – and its new Smart Households technology allow for more effective planning, activation and measurement for marketers and business decision makers alike.

Established in the UK in 2004, Blis now operates in 42 offices across five continents. Working with the world’s largest and most customer-driven companies across all verticals including Unilever, Samsung, McDonald’s, HSBC, Mercedes Benz and Peugeot, as well as every major media agency, Blis reaches over a billion mobile devices a year.

To learn more, visit blis.com.

Logo – https://techent.tv/wp-content/uploads/2020/08/blis-keeps-finger-on-the-pulse-of-consumer-behaviour-with-global-sentiment-tracker.jpg

Related Links :

https://blis.com

Baemin Introduces an Outdoor Delivery Robot “The City of the Future Became A Reality”

– Baedal Minjok started an outdoor delivery robot service at “Gwanggyo Alley Way,” a multipurpose housing complex in Gwanggyo

– When orders are placed in restaurants within the plaza via Baemin application, the robot delivers to the ground floor of customer’s residence

– Delivery fee goes down thanks to the robot covering short distance delivery … less burden for customers and higher revenue for restaurant owners

SEOUL, South Korea, Aug. 18, 2020The service that allows delivery robots to come and go outdoor between restaurants and apartments to deliver food has become a reality for the first time in Korea. Woowa Brothers Corp. (CEO Bomjun Kim), the mother company that runs "Baedal Minjok" (hereinafter Baemin) stated on August 18 that the company has started a delivery service using self-driving outdoor delivery robot, "Dilly Drive," at "Gwanggyo Alley Way," a multipurpose housing complex in Gwanggyo, Suwon city.

Woowa Brothers Corp. (CEO Bomjun Kim), the mother company that runs "Baedal Minjok" (hereinafter Baemin) has started a delivery service using self-driving outdoor delivery robot, "Dilly Drive," at "Gwanggyo Alley Way," a multipurpose housing complex in Gwanggyo, Suwon city.

The outdoor delivery robot service newly introduced to Gwanggyo Alley Way can be used by anyone, including residents and visitors. 1,100 residents of apartments and studio flats in Gwanggyo Alley Way can choose the menu and make orders from the restaurants and cafes within the apartment complex by just opening their Baemin applications and scanning QR codes in their houses. Orders can also be made at the plaza within the complex, using QR codes placed on outdoor tables.

When there’s an order, the five Dilly drives at Gwanggyo Alley Way go from the station to the restaurant on its own. And once the restaurant staff places the food in Dilly Drive and press ‘go’ button, the robot starts the delivery. Customers can check the current location of Dilly Drive via Baemin application and get notifications 100m before and upon arrival. Customers can receive food either on the first floor of the building or at the designated outdoor table in the plaza.

The Dilly Drive at Gwanggyo Alley Way has evolved with a newly added remote control function, which the Dilly Drive used at the Konkuk University campus did not have. With its 6 wheels, Dilly Drive walks in the speed of 4~5 km per hour, which is the speed of a person walking. Once charged, it can run for more than 8 hours, and with its headlights, it can deliver at night as well. Dilly Drive can carry about 6 lunch boxes or 12 cups of beverages per delivery.

Woowa Brothers has prepared various safety measures to guarantee the safe driving of Dilly Drive. The company has thoroughly examined the road condition and travel route of the people in the complex, and set Dilly Drive to go slowly in parts where there usually are a lot of people or children. At crosswalks with a lot of cars, Dilly Drive comes to a stop, and its safety has been enhanced with the real time control via the video surveillance system installed at the apartment complex. For the first month of service, Dilly Drive will run from 11 a.m. to 3 p.m. during the weekdays, and its hours of operation will gradually be extended.

It is a first time in Korea and not very common worldwide for a delivery robot to receive food from restaurants and deliver outdoors. There is a higher technological barrier for outdoor self-driving robots than for indoor robots. Outdoor self-driving robots have to detect the subtle movements of not only cars and bicycles but also children and companion animals, and can only be commercialized when they operate stably even on bumpy roads and ever-changing weather conditions.

In November 2019, Woowa Brothers has conducted a month-long pilot test in Konkuk University campus to commercialize Dilly Drive. At the time, Dilly Drive has carried out more than 2,000 deliveries and improved its service quality. And from last June, Woowa Brothers has been working together with SK Telecom to conduct tests to build the control system crucial to outdoor delivery robot service.

The outdoor delivery robot service via Dilly Drive is going to be a new source of income for restaurant and café owners. Until now, customers were reluctant to make close-range deliveries due to delivery fees. Since robots carry out close-range deliveries at half the existing delivery fee, owners can now expect new sales revenue.

Woowa Brothers plans to keep enhancing the technological standard of outdoor delivery robot. For now, Dilly Drive can self drive from the restaurant to the first floor of an apartment, but it will be able to deliver right to the door in the first half of 2021.

Joseph Kim, Head of Robot Business Development at Woowa Brother said, "Outdoor delivery robot service includes a lot more obstacles that interrupt the robot’s drive, such as the road surface, obstacles, the weather, unexpected events, and so on. It can be commercialized when sophisticated technology and service know-hows come together." He also added that "Woowa Brothers will continue the development of delivery robot service for advanced delivery ecosystem."

Woowa Brothers operate South Korea’s most favored food delivery platform, "Baedal Minjok." While the company ceaselessly works to innovate the food-tech industry through robotics technology, recently, it also launched ‘B Mart,’ a service that delivers groceries under 30 minutes, to expand its line of business. Since the company first launched the app in 2010, Woowa Brothers grew to attract 10 million monthly active users and accomplished KRW 8.7 trillion yearly transactions last year.

Media Contact
Sungjun Huh
toto@woowahan.com

It can run for more than 8 hours, and it can deliver at night as well with its headlights. Dilly Drive can carry about 6 lunch boxes or 12 cups of beverages per delivery.

Related Links :

https://woowahan.com/

Oucica Will Release Its New Photocatalyst Air Purifier to Markets in Late August

SHENZHEN, China, Aug. 15, 2020 — Oucica, a Sub-brand of Huntkey, expert of air purification solutions will release its desktop air purifier DJ010 in the late of August. Like its previously released air purification products, the DJ010 is still developed and manufactured by photocatalyst technology. Different from the previous products, DJ010 is smaller and more suitable for use in small spaces such as desktops and cars.

https://en.huntkey.com/wp-content/uploads/2020/08/oucica-desktop-air-purifier.jpg

What is Photocatalyst?

Photocatalyst is a general term for photo-semiconductor materials with photocatalytic function represented by nano-sized titanium dioxide. It is coated on the surface of the substrate and produces strong catalytic degradation function under the action of ultraviolet light and visible light. Photocatalyst can effectively kill bacteria and virus in the air and decompose harmful substances in the air into water and carbon dioxide. It is a ideal solution for removing formaldehyde, deodorizing, anti-pollution and purifying air.

Reasons to choose Oucica DJ010

Reliable and stable technology

Oucica uses patented spraying technology to uniformly spray titanium dioxide on the surface of the substrate, which is firm and durable, and the addition of antibacterial metal to further enhance the performance of ordinary photocatalyst.

No consumable material design

When Oucica DJ010 works, the air will first pass through the preliminary filter, which can be washed with water. The photocatalyst filter can usually be used for a lifetime without cleaning. There is no problem removing it for cleaning if users want.

Exquisite and compact

It measures a dimension of φ108*160mm, which is easy for users to carry and suitable for air cleaning for a space of 8-10cbm. It features a standby consumption of lower than 200mW, as well as a noise level of 38dB(A) at the maximum. For more product information, please visit: https://en.huntkey.com/

Specifications:
Model: DJ010
Input: 5V/2A (Min. 4.6V, Max. 5.5V)
Rated Power: 8W
Standby Consumption: <200mW
Noise Level (Max.): 38dB(A)
Air Volume: 10cbm/h (Max.)
Applicable Space: 8-10cbm
Dimensions: φ108*160mm

About Oucica

Oucica, a subsidiary of Huntkey, specializes in the development of photocatalyst air purifiers. To improve the air quality of working, living or studying, it has developed a series of air purifiers including model KJ380 for large spaces, CJ001 for car sterilizing and DJ010 for desktops.

Contact
Melody Kim
+86-755-8960-6593
jinzm@huntkey.net


Related Links :

Home