Tag Archives: OTC

China Customer Relations Centers, Inc. Announces Financial Results for the First Half of 2020

Revenues and EPS Increased by 33.4% and 106.4%, Respectively, for the First Half of 2020

TAI’AN, China, Dec. 19, 2020 — China Customer Relations Centers, Inc. (NASDAQ: CCRC) ("CCRC" or the "Company"), a leading business process outsourcing ("BPO") service provider serving internet, e-commerce, banking, and telecommunications clients in China, today announced its unaudited financial results for the six months ended June 30, 2020.

First Half of 2020 Highlights (all comparisons to prior year unless noted)

  • Revenues increased by 33.4% to $97.72 million, driven by strong demand for our business from existing BPO clients and the contribution from new clients including Huaxia Bank, Ping’An Bank, Suning Insurance, and Vipshop, among others.
  • Gross profit increased by 38.9% to $25.91 million. Gross margin was 26.5%, compared to 25.5% for the same period of the prior year.
  • Operating income increased by 89.1% to $10.06 million. Operating margin increased by 3.0 percentage point to 10.3%.
  • Net income attributable to common shareholders increased by 106.4% to $10.30 million.
  • Earnings per share was $0.56, compared to $0.27 for the same period of the prior year.        

First Half of 2020 Financial Results (Unaudited)

For the Six Months Ended June 30,

($ millions, except per share data)

2020

2019

% Change

Revenues

$97.72

$73.27

33.4%

Gross profit

$25.91

$18.65

38.9%

Gross margin

26.5%

25.5%

1.0 pp*

Operating income

$10.06

$5.32

89.1%

Operating margin

10.3%

7.3%

3.0 pp*

Net income attributable to CCRC

$10.30

$4.99

106.4%

EPS – basic and diluted

$0.56

$0.27

107.4%

*pp: percent points

Revenues

For the six months ended June 30, 2020, revenues increased by $24.45 million, or 33.4%, to $97.72 million from $73.27 million for the same period of the prior year. We continued to see strong demand for our business from existing BPO clients while adding new clients with notable additions including Huaxia Bank, Ping’An Bank, Suning Insurance, and Vipshop, among others, during the six months ended June 30, 2020.

We continued to increase our service capacity, which increased by 2,969 seats, or 13.3%, to 25,329 seats as of June 30, 2020 from 22,360 seats at the end of 2019. 

Cost of revenues

Cost of revenues consists primarily of salaries, payroll taxes and employee benefits costs of our customer service associates and other operations personnel. Cost of revenues also includes direct communications costs, rent expense, IT costs, and facilities support expenses. Cost of revenues increased by $17.19 million, or 31.5%, to $71.81 million for the six months ended June 30, 2020 from $54.62 million for the same period of the prior year. The increase in cost of revenues was in line with the increase in revenues. As a percentage of revenues, cost of revenues was 73.5% for the six months ended June 30, 2020, compared to 74.5% for the same period of the prior year.

Gross profit and gross margin

Gross profit increased by $7.26 million, or 38.9%, to $25.91 million for the six months ended June 30, 2020 from $18.65 million for the same period of the prior year. The increase in gross profit was primarily driven by increased revenues as well as COVID-19 related social security and rent relief benefits received during the pandemic. Gross margin increased by 1.0 percentage point to 26.5% for the six months ended June 30, 2020 from 25.5% for the same period of the prior year.

Selling, general and administrative expense

Selling, general and administrative ("SG&A") expenses consist primarily of sales and administrative employee-related expenses, professional fees, travel costs, research and development costs, and other corporate expenses. SG&A expenses increased by $2.52 million, or 18.9%, to $15.85 million for the six months ended June 30, 2020 from $13.33 million for the same period of the prior year. As a percentage of revenues, SG&A expenses decreased from 18.2% for the six months ended June 30, 2019 to 16.2% for the six months ended June 30, 2020.

Operating income and operating margin

Income from operations increased by $4.74 million, or 89.1%, to $10.06 million for the six months ended June 30, 2020 from $5.32 million for the same period of the prior year. The increase in operating income was related to increased gross profit which was partially offset by increased SG&A expenses. Operating margin was 10.3% for the six months ended June 30, 2020, compared to 7.3% for the same period of the prior year.

Other income

We recognized government grants, which are discretionary and unpredictable in nature, of $1.38 million during the six months ended June 30, 2020, compared to $0.56 million recognized during the same period of the prior year. Total other income, net of other expenses, increased by $1.30 million, or 184.7%, to $2.01 million for the six months ended June 30, 2020 from $0.71 million for the same period of the prior year.

Income before provision for income taxes

Income before provision for income taxes increased by $6.05 million, or 100.3%, to $12.07 million for the six months ended June 30, 2020 from $6.03 million for the same period of the prior year. The increase in income before provision for income taxes was due to increased operating income as well as government grants and other income.

Income taxes

Provision for income taxes was $1.73 million for the six months ended June 30, 2020, compared to $0.96 million for the same period of the prior year.

Net income and earnings per share

Net income increased by $5.27 million, or 104.1%, to $10.34 million for the six months ended June 30, 2020 from $5.07 million for the same period of the prior year. After deducting net income attributable to noncontrolling interest, net income attributable to common shareholders was $10.30 million, or $0.56 per basic and diluted share, for the six months ended June 30, 2020, compared to $4.99 million, or $0.27 per basic and diluted share, for the same period of the prior year.

Financial Conditions

As of June 30, 2020, the Company had cash of $28.67 million, compared to $25.33 million at December 31, 2019. Total working capital was $58.59 million as of June 30, 2020, compared to $47.50 million at the end of 2019.

Net cash provided by operating activities was $7.87 million for the six months ended June 30, 2020, compared to net cash used in operating activities of $1.34 million for the same period of the prior year. Net cash used in investing activities was $1.81 million for the six months ended June 30, 2020, compared to $1.30 million for the same period of the prior year. Net cash used in financing activities was $2.17 million for the six months ended June 30, 2020, compared to net cash provided by financing activities of $0.03 million for the same period of the prior year.  

Notice

Rounding amounts and percentages: Certain amounts and percentages included in this press release have been rounded for ease of presentation. Percentage figures included in this press release have not in all cases been calculated on the basis of such rounded figures, but on the basis of such amounts prior to rounding. For this reason, certain percentage amounts in this press release may vary from those obtained by performing the same calculations using the figures in the financial statements. In addition, certain other amounts that appear in this press release may not sum due to rounding.

About China Customer Relations Centers, Inc.

The Company is a leading BPO service provider in China focusing on the complex, voice-based and online-based segments of customer care services, including:

  •  customer relationship management;
  •  technical support;
  •  sales;
  •  customer retention;
  •  marketing surveys; and
  •  research.

The Company currently has a service capacity of approximately 25,329 seats for its call centers. More information about the Company can be found at: www.ccrc.com.

Forward-Looking Statement

This press release contains forward-looking statements as defined by the Private Securities Litigation Reform Act of 1995. Forward-looking statements include statements concerning plans, objectives, goals, strategies, future events or performance, and underlying assumptions and other statements that are other than statements of historical facts. When the Company uses words such as "may," "will," "intend," "should," "believe," "expect," "anticipate," "project," "estimate" or similar expressions that do not relate solely to historical matters, it is making forward-looking statements.  Specifically, the Company’s statements regarding its: 1) the impact of COVID-19; and 2) continued growth, shareholder returns and business outlook, are forward-looking statements. Forward-looking statements are not guarantee of future performance and involve risks and uncertainties that may cause the actual results to differ materially from the Company’s expectations discussed in the forward-looking statements. These statements are subject to uncertainties and risks including, but not limited to, the following:  the Company’s goals and strategies; the Company’s future business development; product and service demand and acceptance; changes in technology; economic conditions; the growth of the call center business process outsourcing market in China; reputation and brand; the impact of competition and pricing; government regulations; fluctuations in general economic and business conditions in China and assumptions underlying or related to any of the foregoing and other risks contained in reports filed by the Company with the Securities and Exchange Commission.  For these reasons, among others, investors are cautioned not to place undue reliance upon any forward-looking statements in this press release. Additional factors are discussed in the Company’s filings with the U.S. Securities and Exchange Commission, which are available for review at www.sec.gov. The Company undertakes no obligation to publicly revise these forward–looking statements to reflect events or circumstances that arise after the date hereof.

For more information, please contact:

Sherry Zheng 
Weitian Group LLC
Email: shunyu.zheng@weitian-ir.com
Phone: +1-718-213-7386

CHINA CUSTOMER RELATIONS CENTERS, INC. AND SUBSIDIARIES
CONSOLIDATED BALANCE SHEETS

 June 30,

 December 31,

2020

2019

(Unaudited)

ASSETS

 Cash and cash equivalents

$

28,673,083

$

25,328,486

 Accounts receivable, net

47,438,549

42,606,485

 Prepayments

2,912,547

2,396,646

 Prepayment, related party

78,109

90,429

 Due from related party, current

212,218

 Income taxes recoverable

201,283

712,459

 Other current assets

3,911,556

3,408,704

     Total current assets

83,427,345

74,543,209

 Equity investments

3,396,904

3,446,346

 Property and equipment, net

9,788,227

10,115,782

 Deferred tax assets

239,379

242,863

 Due from related party, non-current

215,307

 Operating lease right-of-use assets

9,882,185

9,827,114

 Operating lease right-of-use assets – related party

92,732

172,121

     Total non-current assets

23,399,427

24,019,533

 Total assets

$

106,826,772

$

98,562,742

 LIABILITIES AND EQUITY

 Accounts payable

$

2,836,918

$

2,602,972

 Accounts payable – related parties

49,945

149,658

 Accrued liabilities and other payables

4,677,490

4,641,892

 Deferred revenue

235,293

456,331

 Wages payable

10,261,274

10,472,596

 Income taxes payable 

1,247,114

452,961

 Operating lease liabilities, current

3,369,036

3,797,069

 Operating lease liabilities – related party, current

40,670

163,995

 Short term loans

2,122,181

4,306,138

     Total current liabilities

24,839,921

27,043,612

Operating lease liabilities, non-current

7,164,013

6,068,702

     Total non-current liabilities

7,164,013

6,068,702

     Total liabilities

32,003,934

33,112,314

 Equity 

 Common shares, $0.001 par value, 100,000,000 shares authorized, 18,329,600 shares issued and outstanding as of June 30, 2020 and December 31, 2019

18,330

18,330

 Additional paid-in capital

18,485,598

15,074,267

 Retained earnings

52,891,042

47,347,781

 Statutory reserves

7,161,554

5,818,330

 Accumulated other comprehensive loss

(4,352,452)

(3,411,744)

     Total China Customer Relations Centers,

Inc. shareholders’ equity  

74,204,072

64,846,964

 Noncontrolling interest

618,766

603,464

     Total equity  

74,822,838

65,450,428

 Total liabilities and equity 

$

106,826,772

$

98,562,742


CHINA CUSTOMER RELATIONS CENTERS, INC. AND SUBSIDIARIES
CONSOLIDATED STATEMENTS OF INCOME AND COMPREHENSIVE INCOME
(Unaudited)

For The Six Months Ended June 30,

2020

2019

Revenues, net

$

97,720,912

$

73,274,748

Cost of revenues

71,809,229

54,623,472

Gross profit

25,911,683

18,651,276

Operating expenses:

Selling, general & administrative expenses

15,848,053

13,329,194

Total operating expenses

15,848,053

13,329,194

Income from operations

10,063,630

5,322,082

Interest expense

(109,430)

(30,475)

Government grants

1,384,198

555,229

Other income

758,268

201,945

Other expense

(23,242)

(20,722)

Total other income

2,009,794

705,977

Income before provision for income taxes

12,073,424

6,028,059

Income tax provision

1,733,355

961,021

Net income

10,340,069

5,067,038

Less: net income attributable to noncontrolling interest

42,253

77,947

Net income attributable to China Customer Relations Centers, Inc.

$

10,297,816

$

4,989,091

Comprehensive income

Net income

$

10,340,069

$

5,067,038

Other comprehensive income (loss)

Foreign currency translation adjustment

(967,659)

(6,737)

Total Comprehensive income

9,372,410

5,060,301

Less: Comprehensive income attributable to noncontrolling interest

15,302

140,467

Comprehensive income attributable to China Customer Relations Centers, Inc.

$

9,357,108

$

4,919,834

Earnings per share attributable to China Customer Relations Centers, Inc.

Basic

$

0.56

$

0.27

Diluted

$

0.56

$

0.27


CHINA CUSTOMER RELATIONS CENTERS, INC. AND SUBSIDIARIES
CONSOLIDATED STATEMENTS OF CASH FLOWS
(Unaudited)

For The Six Months Ended June 30,

2020

2019

Cash flows from operating activities

Net income

$

10,340,069

$

5,067,038

Adjustments to reconcile net income to net cash provided by (used in) operating activities:

Depreciation

2,445,941

2,845,134

Loss on disposal of property and equipment

226,974

68,475

Non-cash lease expense

436,327

Changes in assets and liabilities:

Accounts receivable

(5,471,004)

(5,493,897)

Prepayments

(1,010,254)

(917,156)

Prepayment, related party

11,079

(1,783)

Other current assets

(554,215)

(97,228)

Operating lease liabilities

135,277

(843,053)

Accounts payable

272,668

(130,978)

Accounts payable – related parties

(98,062)

(55,237)

Wages payable

(62,836)

412,029

Income taxes recoverable

503,504

207,879

Income taxes payable

804,727

(56,564)

Deferred revenue

(215,584)

(114,931)

Accrued liabilities and other payables

101,960

(2,226,854)

Net cash provided by (used in) operating activities

7,866,571

(1,337,126)

Cash flows from investing activities

Purchase of property and equipment

(1,808,750)

(1,371,577)

Proceeds from sale of property and equipment

988

28,210

Repayment from related parties

44,222

Net cash used in investing activities

(1,807,762)

(1,299,145)

Cash flows from financing activities

Borrowings from short-term loans

4,231,293

3,725,560

Repayment of short-term loans

(6,398,592)

(3,694,345)

Net cash provided by (used in) financing activities

(2,167,299)

31,215

Effect of exchange rate changes on cash and cash equivalents

(546,913)

(62,102)

Net change in cash and cash equivalents

3,344,597

(2,667,158)

Cash and cash equivalents, beginning of the period

25,328,486

24,419,912

Cash and cash equivalents, end of the period

$

28,673,083

$

21,752,754

Supplemental cash flow information

   Interest paid

$

109,433

$

82,531

   Income taxes paid

$

905,535

$

1,139,416

Non-cash investing and financing activities

Transfer from prepayments to property and equipment

$

457,666

$

Liabilities assumed in connection with purchase of property and equipment

$

$

17,792


China Telecom Honored with “ESG Leading Enterprise Award” by Bloomberg Businessweek / Chinese Edition

HONG KONG, Dec. 4, 2020 — China Telecom Corporation Limited ("China Telecom" or "the Company"; HKEx: 00728; NYSE: CHA) is pleased to announce that the Company was awarded "ESG Leading Enterprise Award" the category of market capitalization over HK$20 billion in the second ESG Leading Enterprise Awards 2020 organized by Bloomberg Businessweek/Chinese Edition, a leading business magazine in the Greater China region offering in-depth coverage with local insights and a global perspective, and Deloitte, a leading global professional services provider.

China Telecom Honored with “ESG Leading Enterprise Award” by Bloomberg Businessweek / Chinese Edition

The ESG Leading Enterprise Awards 2020 aims at encouraging enterprises to adopt Environmental, Social, and Governance (ESG) best practices and enhance transparency in ESG reporting and disclosure, ultimately to foster a sustainable business culture with positive impact on the environment and society. The awards are adjudicated by a panel of professional judges including economists, financial analysts and accountants, ensuring objectivity and credibility of the assessment process.

The accreditation received by China Telecom is a testimony to the achievement of the Company’s outstanding performance in ESG strategies, initiatives and disclosures. China Telecom well recognizes the growing importance attached to the Company’s performance in ESG by the capital market, with such performance being increasingly integrated into investment decisions. Therefore, the Company will continue to strengthen the disclosure and explanation in ESG to give investors a fuller understanding of the Company’s execution, goals and strategies.

Related Links :

http://www.chinatelecom-h.com

Mycronic receives order for two SLX mask writers

STOCKHOLM, Dec. 4, 2020 Mycronic AB (publ) has received an order for SLX mask writers from an existing customer in the US. The order consists of two SLX mask writers and the total order value is between USD 12 and 16 million. Delivery of the first system is planned for the first quarter of 2022, while delivery of the second system is planned for the third quarter of the same year.

The SLX laser mask writer was launched at the end of October 2019 to meet rising demand for photomasks for the semiconductor industry, which is driven by long-term trends, and to meet the future need for replacement and modernization. Photomasks made by laser mask writers are very important in the manufacture of semiconductors and account for 70-75 percent of all photomasks produced. SLX is a new and modern mask writer based on the same technology as Micronics’s mask writers for displays.

"We are proud that Mycronic been entrusted to deliver additional SLX mask writers to an existing customer. It is gratifying that we see a continued great interest in SLX and that our product plan meets the semiconductor industry’s most demanding requirements on laser mask writers," says Charlott Samuelsson, Sr VP Pattern Generators at Mycronic.

Mycronic provides mask writers for manufacturing photomasks in several fields of application. These comprise display manufacturing (TVs, smartphones and tablets), production of semiconductors and applications in the multi-purpose market, a broad segment that comprises many different areas of application.

For additional information, please contact:

Charlott Samuelsson
Sr VP Pattern Generators
Tel: +46 709 844 282
e-mail: charlott.samuelsson@mycronic.com 

Tobias Bulow
Director Investor Relations
Tel: +46 734 018 216
e-mail: tobias.bulow@mycronic.com

The information in this press release was published on December 4, 2020, at CET 08:00 a.m.

About Mycronic

Mycronic AB is a Swedish high-tech company engaged in the development, manufacture and marketing of production equipment with high precision and flexibility requirements for the electronics industry. Mycronic’s headquarters are located in Täby, north of Stockholm and the Group has subsidiaries in France, Japan, China, the Netherlands, Singapore, the United Kingdom, South Korea, Germany and the USA. Mycronic is listed on Nasdaq Stockholm. www.mycronic.com

This information was brought to you by Cision http://news.cision.com

https://news.cision.com/mycronic-ab/r/mycronic-receives-order-for-two-slx-mask-writers,c3248672

The following files are available for download:


WeTrade Group Inc. Reports Third Quarter 2020 Unaudited Financial Results

BEIJING, Dec. 3, 2020 — WeTrade Group Inc. ("Wetrade" or the "Company") (US: WETG), an emerging growth company engaged in the business of providing technical services and solutions via its membership-based social e-commerce platform, today reports its unaudited financial results for the third quarter ended September 30, 2020.

Mr. Pijun Liu, Chief Executive Officer of Wetrade, commented, "We are very pleased to report our markets and businesses continue to prove resilient in the face of a challenging macro-environment of COVID-19. Our third quarter results were above our expectations across the group from the top line to the bottom line. Revenue and net income were recorded $2.01 million and $0.74 million respectively. Our Q3 gross margin reached 78.7%, proving our strong profitability." 

Mr. Liu continued, "The competition among merchants on mainstream ecommerce platforms in China is intensifying, which creates opportunities for WeChat e-commerce(micro-business) and benefits its service providers like us. As a new decentralized model, WeChat e-commerce is the inevitable development of the next era and small and medium-sized merchants are the inevitable choice to seize traffic. Our customers are adapting to a new cadence in this environment, and we continue to adapt to support them in their evolving ways of working. The number of WeChat e-commerce users is expected to reach 100 million, 200 million and 360 million by the end of 2020, 2021 and 2022 respectively, demonstrating micro-business is a high-growth industry with a large total addressable market. To address this market, we independently developed a cloud intelligent system ("YCloud") for WeChat e-commerce through big data learning, social connection building, multi-channel data analysis, etc. We are engaging in providing better cloud intelligent solutions for micro-business users."

Mr. Kean Tat Che, Chief Financial Officer of Wetrade, commented, "We are very pleased to see that the Company maintains a sustained and rapid development. The revenue growth this quarter mainly comes from the Company’s technology and supply chain empowerment which enables customers to rapidly expand their consumer groups and establishing solid consumer base form a stable repurchase. YCloud in Q3 has served many customers including 12 million individuals, 60,000 Wechat group owners and over 2,000 hotels. Looking forward, we will focus on in-depth empowerment of new applications in the vertical field of WeChat e-commerce business, providing more scene-based applications and seeking new partnerships to explore new opportunities."

Third Quarter of 2020 Financial Results

For the Three Months Ended September 30,

($ millions, except per share data)

2020

2019

% Change

Revenue

2.01

NM

Gross Profit

1.58

NM

Gross Margin

78.7%

-%

NM

Operations Profit/(Loss)

1.18

(0.11)

NM

Net Income/(Loss)

0.74

(0.11)

NM

Earnings/(Loss) Per Share

0.00

(0.00)

NM

*Notes: pp represents percentage points

Revenue

Total revenue was $2.01 million for the three months ended September 30, 2020, compared with nil for the same period of last year, which was mainly due to increase in service revenue generated from auto-billing management system from micro-business users.

Cost of Sales

Total cost of sales was $0.43 million for the three months ended September 30, 2020, compared with nil for the same period of last year.

Gross profit and gross margin

Gross profit was $1.58 million for three months ended September 30, 2020, compared with nil for the same period of last year. 

Gross margin was 78.7% for the three months ended September 30, 2020, compared with nil for the same period of last year.

Operations Profit/(Loss)

General and administrative expenses increased by $0.30 million, or 267.0%, to $0.41 million for the three months ended September 30, 2020 from $0.11 million for the same period of last year. The increase was mainly due to increase in the payroll expenses as a result of 77 new staffs were recruited during the period.

Operations profit was $1.18 million for the three months ended September 30, 2020, compared with operations loss of $0.11 million for the same period of last year.

Net Income (loss)

Net income was $0.74 million for the three months ended September 30, 2020, compared with net loss of $0.11 million for the same period of last year. Basic and diluted earnings per share was nil for the three months ended September 30, 2020, compared with nil for the same period of last year.

Nine months ended September 30, 2020 Financial Results

For the Nine Months Ended September 30,

($ millions, except per share data)

2020

2019

% Change

Revenue

2.89

NM

Gross Profit

2.37

NM

Gross Margin

82.2%

-%

NM

Operations Profit/(Loss)

1.76

(0.26)

NM

Net Income/(Loss)

1.31

(0.26)

NM

Earnings/(Loss) Per Share

0.00

(0.00)

NM

*Notes: pp represents percentage points

Revenue

Total revenue was $2.89 million for the nine months ended September 30, 2020, compared with nil for the same period of last year, which was mainly from the service revenue generated from auto-billing management system from customers.

Cost of Sales

Total cost of sales was $0.52 million for the nine months ended September 30, 2020, compared with nil for the same period of last year.

Gross profit and gross margin

Gross profit was $2.37 million for nine months ended September 30, 2020, compared with nil for the same period of last year. 

Gross margin was 82.2% for the nine months ended September 30, 2020, compared with nil for the same period of last year.

Operations Profit/(Loss)

General and administrative expenses increased by $0.36 million, or 142.0%, to $0.62 million for the nine months ended September 30, 2020 from $0.26 million for the same period of last year. The increase was mainly due to increase in the payroll expenses as a result of 77 new staffs were recruited during the period.

Operations profit was $1.76 million for the nine months ended September 30, 2020, compared with operations loss of $0.26 million for the same period of last year.

Net Income/(loss)

Net income was $1.31 million for the nine months ended September 30, 2020, compared with net loss of $0.26 million for the same period of last year. Basic and diluted earnings per share was nil for the nine months ended September 30, 2020, compared with nil for the same period of last year.

Financial Condition

As of September 30, 2020, the Company had cash and cash equivalents for $6.79 million, compared to $6.59 million as of December 31, 2019. Net cash used in operating activities was $1,042,610 for the nine months ended September 30, 2020, compared to $509 for the same period of last year. Net cash provided by financing activities was $0.84 million for the nine months ended September 30, 2020, compared to $0.22 million for the same period of last year.

About WeTrade Group Inc.

WeTrade Group Inc. is an emerging growth company engaged in the business of providing technical services and solutions via its membership-based social e-commerce platform and the Company targets to provide technical and auto-billing management services for 100 million micro-business users in China. Wetrade has conducted its business operations in mainland China and trial operation in Hong Kong, Philippines and Singapore.  WeTrade has also formed the long-term technical cooperation with Yuetao App, Daren App, Yuebei App, Jingdong App, Yuedian App and Lvyue App. For more information, please visit http://www.wetradegroup.net.

Forward-Looking Statements

This press release contains information about the Company’s view of its future expectations, plans and prospects that constitute forward-looking statements. Actual results may differ materially from historical results or those indicated by these forward-looking statements as a result of a variety of factors including, but not limited to, risks and uncertainties associated with its ability to raise additional funding, its ability to maintain and grow its business, variability of operating results, its ability to maintain and enhance its brand, its development and introduction of new products and services, the successful integration of acquired companies, technologies and assets into its portfolio of products and services, marketing and other business development initiatives, competition in the industry, general government regulation, economic conditions, dependence on key personnel, the ability to attract, hire and retain personnel who possess the technical skills and experience necessary to meet the requirements of its clients, and its ability to protect its intellectual property. The Company’s encourages you to review other factors that may affect its future results in the Company’s annual reports and in its other filings with the Securities and Exchange Commission.

For more information, please contact:

WeTrade Group Inc.
ir@wetradegroup.net

Ascent Investor Relations LLC
Tina Xiao
+1-917-609-0333
tina.xiao@ascent-ir.com  


WETRADE GROUP INC

BALANCE SHEETS

(All amounts shown in U.S. Dollars)

September 30,
2020

December 31,
2019

(unaudited)

(audited)

ASSETS

Current Assets:

Cash and Cash Equivalents

$

6,787,535

$

6,591,128

Accounts Receivables

1,030,920

Other receivables

276,400

Prepayments

197,097

Non current Assets:

Right of use assets

2,832,007

Intangible asset, net

77,196

Prepaid expense

10,327

Total Assets:

11,211,481

6,591,128

LIABILITIES AND STOCKHOLDERS’ EQUITY

Current Liabilities:

Accrued expenses

220,412

32,000

Tax payables

556,802

Amount due to related parties

416,500

1,754,515

Lease liabilities, current

304,973

Total Current Liabilities

1,498,687

1,786,515

Lease liabilities, non- current

2,581,882

Total Liabilities

4,080,569

1,786,515

Stockholders’ Equity:

Common Stock; $0.00 per share par value; 305,451,498 issued and outstanding at September 30,

2020 and 300,222,000 issued and outstanding at December 31, 2019*

Additional Paid in Capital

6,057,520

222,020

Share to be issued

5,000,000

Accumulated other comprehensive income (loss)

183,673

Retained Earning/ (Accumulated Deficit)

889,719

(417,407)

Total Stockholders’ Equity

7,130,912

4,804,613

Total Liabilities and Stockholders’ Equity

$

11,211,481

$

6,591,128

*Share and per share amounts have been retroactively adjusted to reflect the increased number of shares resulting from a 1:3 stock split. 


WETRADE GROUP INC

STATEMENTS OF OPERATIONS

Unaudited

Three

 Months

ended S

eptember

30

2020

Three

Months

 ended

September

30

2019

Nine

 Months

 ended

September

 30,

2020

 From

 inception to

 September 30, 2019

Revenue:

Service revenue, non-related party

518,269

$

518,269

Service revenue, related party

1,493,829

2,370,192

Total Revenue:

2,012,098

2,888,461

Cost of revenue

(427,647)

(515,195)

Gross Profit

1,584,451

2,373,266

Operating Costs and expenses:

General and Administrative

407,067

110,921

617,216

255,010

Operations Profit/ (Loss)

1,177,384

(110,921)

1,756,050

(255,010)

Other income/ (loss)

38,939

39,060

Net Profit/ (Loss) before Income Tax

1,216,323

(110,921)

1,795,110

(255,010)

Income tax expense

475,431

487,984

Net income (loss) attributable to noncontrolling interest

740,893

(110,921)

1,307,126

(255,010)

Other Comprehensive Income (Loss)

Foreign currency translation adjustment

244,292

183,826

Total comprehensive Income (Loss)

985,185

(110,921)

1,490,952

(255,010)

Basic and Diluted Net Income (Loss) per share:

0.00

(0.00)

0.00

(0.00)

Weighted average number of shares outstanding*; Basic and

Diluted

308,704,888

300,073,998

304,166,073

300,024,666

*Share and per share amounts have been retroactively adjusted to reflect the increased number of shares resulting from a 1:3 stock split.


WETRADE GROUP INC

STATEMENTS OF CASH FLOWS

 From the

period

March 28,

2019

For the

Period

September

30, 2020

 (Inception)

to

September 

30,2019

(unaudited)  

(unaudited) 

Cash Flows from Operating Activities:

Net Income/ (Loss)

$

1,307,126

(255,010)

Changes in Operating Assets and Liabilities:

Trade Receivables

(1,028,044)

Other receivables

(275,629)

Prepaid expenses

(206,845)

Amount due to related parties

(560,020)

144,501

Intangible assets

(76,980)

Accrued expenses

187,839

110,000

Tax payables

555,248

Right of use assets

(824,106)

Lease liabilities

878,801

Net Cash Flows Used in Operating Activities:

(1,042,610)

(509)

Cash flow from financing activities:

Proceeds from issuance of common stock

835,500

222,020

Net cash provided by financing activities:

835,500

222,020

Effect of exchange rate changes on cash

403,517

Change in Cash and Cash Equivalents:

196,407

221,511

Cash and Cash Equivalents, Beginning of Period

6,591,128

Cash and Cash Equivalents, End of Period

$

6,787,535

221,511

Supplemental Cash Flow Information:

Cash paid for interest

$

Cash paid for taxes

WeTrade Group Inc. Attends The 7th World Internet Conference in China

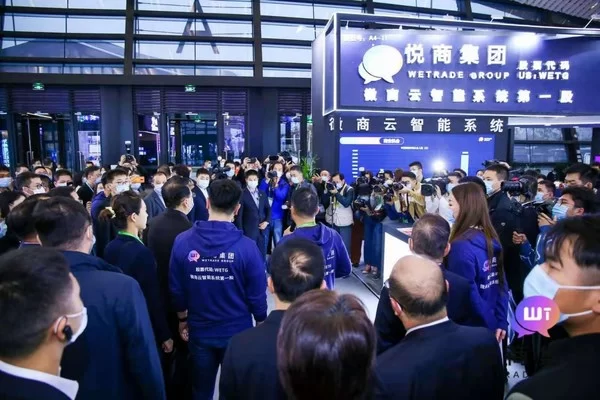
BEIJING, Nov. 27, 2020 — WeTrade Group Inc. ("Wetrade" or the "Company") (US: WETG), an emerging growth company engaged in the business of providing technical services and solutions via its membership-based social e-commerce platform, today announced that it attended The 7th World Internet Conference ("WIC") –Internet Development Forum in China on November 22, 2020.

WIC, also known as the Wuzhen Summit, is an annual international event, first held in 2014, organized by Chinese government. It is a state-run event, and a platform for global tech leaders to discuss internet issues and policies, which attracted top U.S. names including Apple’s Tim Cook and Google’s Sundar Pichai in past years. Representatives of enterprises and research institutes gathered to showcase the latest products and technologies in 5G, AI, cloud-computing, big data, and cybersecurity.


The Company was invited to participate in this year’s WIC to display its Cloud intelligent system ("YCloud") application for WeChat e-commerce(micro-business). Many officials visited the Company’s booth and listened to the report from Mr. Zheng Dai, Chairman of Wetrade, including Mr. Jiajun Yuan, Secretary of the Zhejiang Provincial Party Committee, Mr. Zeliang Zhao, Deputy Director of the Central Cyberspace Affairs Office, Mr. Liehong Liu, Vice Minister of the Ministry of Industry and Information Technology, and Mr. Guoxian Zhu, Publicity Minister of Standing Committee of the Zhejiang Provincial Party Committee.

Mr. Zheng Dai, Chairman of Wetrade, commented, "In recent years, driven by the rapid development of Internet technology, micro-commerce, e-commerce, and livestream sales gradually become mainstream for new individual economies. However, a large number of platforms and individuals flocked to the micro-business field to compete fiercely in prices and supply chains. While enjoying traffic dividends, they ignored the current technological gaps in the industry. To address this market, we accurately grasped this big demand in the industry, developed and launched the YCloud. Through technology and big data, YCloud has strengthened users’ marketing relationship tracking, CPS commission income management, community AI fission and management, improving supply chain system, increasing payment scenarios and revenue, and team leader management to help customers increase revenue. Up to now, YCloud has successfully landed in Southeast Asian countries such as the Philippines and Singapore, covering multiple industries including micro-business, tourism, hotel, livestream and short video, aesthetic medical and retail."

About WeTrade Group Inc.

WeTrade Group Inc. is an emerging growth company engaged in the business of providing technical services and solutions via its membership-based social e-commerce platform and the Company targets to provide technical and auto-billing management services for 100 million micro-business users in China. Wetrade has conducted its business operations in mainland China and trial operation in Hong Kong, Philippines and Singapore.  WeTrade has also formed the long-term technical cooperation with Yuetao App, Daren App, Yuebei App, JD Zhiding App, Yuedian App and Lvyue App. For more information, please visit http://www.wetradegroup.net.

Forward-Looking Statements

This press release contains information about the Company’s view of its future expectations, plans and prospects that constitute forward-looking statements. Actual results may differ materially from historical results or those indicated by these forward-looking statements as a result of a variety of factors including, but not limited to, risks and uncertainties associated with its ability to raise additional funding, its ability to maintain and grow its business, variability of operating results, its ability to maintain and enhance its brand, its development and introduction of new products and services, the successful integration of acquired companies, technologies and assets into its portfolio of products and services, marketing and other business development initiatives, competition in the industry, general government regulation, economic conditions, dependence on key personnel, the ability to attract, hire and retain personnel who possess the technical skills and experience necessary to meet the requirements of its clients, and its ability to protect its intellectual property. The Company’s encourages you to review other factors that may affect its future results in the Company’s annual reports and in its other filings with the Securities and Exchange Commission.

Related Links :

http://www.wetradegroup.net

China Telecom Honored with “The Best of Asia – Icon on Corporate Governance”

Asia’s Best Awards in CEO, CFO and CSR

HONG KONG, Nov. 20, 2020 — China Telecom Corporation Limited ("China Telecom" or "the Company"; HKEx: 00728; NYSE: CHA) was awarded "The Best of Asia – Icon on Corporate Governance" in the "Corporate Governance Asia Recognition Awards 2019", organized by Corporate Governance Asia, a prestigious regional journal on corporate governance. It is the 13th time the Company honored with this award. Mr. Ke Ruiwen, Executive Director, Chairman and CEO, was accredited the "Asian Corporate Director Recognition Award 2019".

China Telecom Honored with “The Best of Asia - Icon on Corporate Governance”
China Telecom Honored with “The Best of Asia – Icon on Corporate Governance”

In addition, China Telecom was honored with the following corporate governance grand awards in its "Asian Excellence Award 2020":

  • Asia’s Best CEO – Mr. Ke Ruiwen
  • Asia’s Best CFO – Madam Zhu Min
  • Asia’s Best CSR
  • Best Investor Relations Company

Corporate Governance Asia acknowledged that China Telecom strives to maintain a high level of corporate governance and has inherited an excellent, prudent and efficient corporate governance concept and continuously enhances its corporate governance methodology. The sustained enhancement of the company’s corporate governance aligned with the long-term best interest of shareholders. In addition, China Telecom was also honored with the accomplishment in its investor relations practice by providing shareholders and investors with essential information that helps them make informed and timely decisions.

"Corporate Governance Asia Recognition Awards" honors corporates who have outstanding performance on various aspects including quality of management, their business model, growth prospects, financial performance and relative position in their industries. Corporate Governance Asia honors corporates that remain in good standing as far as corporate governance is concerned. "Asian Excellence Awards" recognizes corporates’ achievements and excellence in management acumen, financial performance, corporate social responsibility, environmental practices and investor relations. These awards are in the tradition of the high standards set and uphold by Corporate Governance Asia, the authoritative voice in corporate governance practices in the region. The accolades are based both on the scores from the data that was submitted by readers and from interviews conducted with investors.

China Telecom would like to sincerely thank the capital market and investors for their support and trust all along.

China Telecom Honored with Asia’s Best Awards in CEO, CFO and CSR

Related Links :

http://www.chinatelecom-h.com

MediaTek Unveils Its Newest 5G Chipset, Dimensity 700, For Mass Market 5G Smartphones

Dimensity 700 caters to growing consumer demand for 5G devices

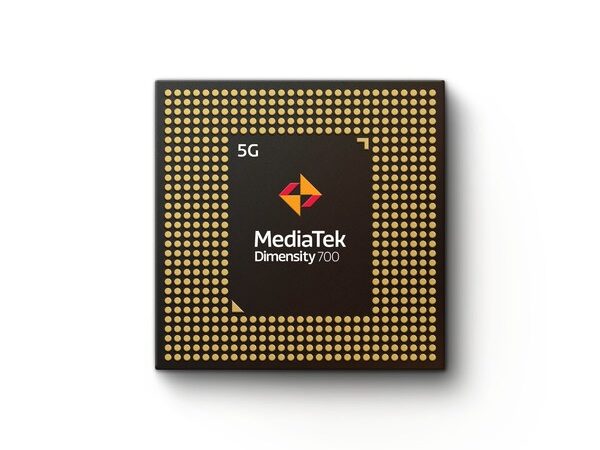
HSINCHU, Taiwan, Nov. 11, 2020 — MediaTek today unveiled its new Dimensity 700 5G smartphone chipset, a 7nm SoC designed to bring advanced 5G capabilities and experiences to the mass market. The addition of the Dimensity 700 to MediaTek’s Dimensity family of 5G chips gives device makers a full suite of options for 5G smartphone models – from flagship and premium to mid-range and mass market devices – making 5G more accessible for consumers everywhere.

Dimensity 700
Dimensity 700

"With our expanded Dimensity portfolio we’re bringing the latest 5G capabilities to every smartphone tier so more people can enjoy 5G experiences," said Dr. JC Hsu, Corporate VP and GM of MediaTek’s Wireless Communications Business Unit. "The Dimensity 700 has an impressive mix of 5G connectivity features, advanced camera capabilities like night shot enhancements and multiple voice assistant support, all in a super power-efficient design."

The Dimensity 700 packs advanced connectivity features including 5G Carrier Aggregation (2CC 5G-CA) and 5G dual SIM dual standby (DSDS), giving users access to the fastest speeds and 5G-exclusive Voice over New Radio (VoNR) services from either connection. On the processing power side, the chip integrates two Arm Cortex-A76 big cores in its octa-core CPU and operates at up to 2.2GHz.

Key features of Dimensity 700 include:

  • MediaTek 5G UltraSave: Delivers advanced power-saving technologies to improve battery life. It includes UltraSave Network Environment Detection, MediaTek 5G UltraSave OTA Content Awareness, Dynamic BWP and Connected Mode DRX. The built-in technology intelligently manages a device’s 5G connection so you can do more and charge your device less often.
  • Premium 90Hz Display: Brands can design smartphones with crisp, high resolution FullHD+ displays and ultra-fast refresh rates to reduce blur in animations, scrolling and games for the best user experience.
  • Up to 64MP Cameras & Night Shot Enhancements: Supports 48MP or 64MP main camera sensors with AI-bokeh, AI-color and AI-beauty features. Plus, the integrated hardware-based imaging accelerators enable multi-frame noise reduction so users can capture high quality shots with low noise, even at night.  
  • Multiple Voice Assistant Support: Supports voice assistants from global brands such as Alibaba, Amazon, Baidu, Google and Tencent to give device makers more configuration options.

Dimensity 700 Infographic

The Dimensity 700 continues MediaTek’s legacy of bringing advanced connectivity, multimedia and imaging features to consumers everywhere. MediaTek’s Dimensity 5G family of chips bring smart and fast together to power 5G devices across all tiers, and with the Dimensity 700 5G devices will now be accessible to even more consumers.

For full specifications and further details on MediaTek’s Dimensity 700 series and 5G portfolio visit: https://i.mediatek.com/mediatek-5g

About MediaTek Inc.

MediaTek Incorporated (TWSE: 2454) is a global fabless semiconductor company that enables 1.5 billion connected devices a year. We are a market leader in developing innovative systems-on-chip (SoC) for mobile device, home entertainment, connectivity and IoT products. Our dedication to innovation has positioned us as a driving market force in several key technology areas, including highly power-efficient mobile technologies, automotive solutions and a broad range of advanced multimedia products such as smartphones, tablets, digital televisions, 5G, Voice Assistant Devices (VAD) and wearables. MediaTek empowers and inspires people to expand their horizons and achieve their goals through smart technology, more easily and efficiently than ever before. We work with the brands you love to make great technology accessible to everyone, and it drives everything we do. Visit www.mediatek.com for more information.

MediaTek Press Office:

PR@mediatek.com
Kevin Keating, MediaTek
+1- 206-321-7295
10188 Telesis Ct #500, San Diego, CA 92121, USA

Related Links :

http://www.mediatek.com

Ericsson Capital Markets Day 2020

STOCKHOLM, Nov. 10, 2020

  • Turn-around completed establishing a strong platform to accelerate growth and investments in 5G enterprise applications
  • New long-term EBITA margin target, excluding restructuring, for the Group of 15% – 18%
  • New long-term Free Cash flow (before M&A) target of 9% – 12% of sales
  • The 2022 operating margin target, excluding restructuring, of 12 – 14% remains for the Group with some adjustments between segments

Ericsson (NASDAQ: ERIC) will outline revised strategic growth ambitions and new long-term financial targets at its Capital Markets Day 2020 on November 10, 2020.

Executives from across the business will join President and CEO, Börje Ekholm, to share insights from the company’s three-year focused turnaround, and articulate ambitions to strengthen the Group, with a particular emphasis on long-term growth in the enterprise market. 

Since the launch of the focused business strategy in 2017, the company has restored profitability, delivered organic growth and is on track towards its 2020 financial targets. With global technology leadership and growing market share in 5G the company is now turning to the next phase of its journey – growing the business through incremental core business growth and acceleration of enterprise focus.

Börje Ekholm, President and CEO, says: "The execution on our focused strategy has delivered a turnaround which creates a robust base for the future and delivered global leadership in 5G today. The Covid-19 pandemic is a humbling reminder that wireless connectivity fundamentally underpins future global growth and so urgent deployment is critical. It will support a global innovation opportunity for consumers and enterprise which touches every corner of our world and every sector of the economy. Our future value is inextricably linked to wider economic growth and we are well-positioned to play a lead role in the ecosystem of operators, businesses, and decision-makers on whose combined shoulders 5G’s full success rests."

Long-term targets

Beyond 2022, the long-term profitability target is an EBITA margin excluding restructuring charges of 15% – 18% for the Group. The company aims to achieve this through improvement activities across the Group. Growth as well as gross margin improvements, driven by software sales and operational leverage, will be the cornerstones in reaching the long-term targets.

The company will continue its focus on free cash flow (before M&A) with a target of 9% – 12% of sales.

2022 profitability targets

The 2022 profitability target for the Group remains unchanged with an operating margin of 12% – 14%, excluding restructuring charges. Each segment target for 2022 is updated with operating margin targets per segment detailed in the table below.

The increased target in segment Networks is mainly driven by our foot-print gains in the market. The 2022 operating margin target for Networks is raised to 16% – 18% (15% – 17%).

In segment Digital Services, the priority continues to be restoring profitability. Due to the increase in R&D spend in combination with the decline in legacy sales the Operating Margin target is adjusted to 4% – 7% (10% – 12%) in 2022.

In segment Managed Services, expected margin growth will be achieved through R&D investments in Artificial Intelligence and automation. The 2022 target for Managed Services is raised to 9% – 11% (8% – 10%).

In segment Emerging Business and Other focus continues to be on establishing new businesses which drive organic growth. Revenue growth will be targeted through the rapid and disciplined product deployment in 5G and IoT as well as the recent acquisition of Cradlepoint.

Financial targets 2022 and long-term

Investor Update 2019 numbers in brackets.

% of sales

Networks

Digital Services

Managed Services

Emerging Business and Other

Group

2022 EBIT excluding restructuring

16% – 18%

 (15% – 17%)

4% – 7%

(10% – 12%)

9% – 11%

(8% – 10%)

12%-14%

(no change)

Long-term target EBITA excluding restructuring

15% – 18%

Long-term Free Cash Flow (before M&A)

9% – 12%

Addition to Risk Factors (as published in Annual and Quarterly Reports)

Ongoing geopolitical and trade uncertainty from a range of factors may have a material adverse impact on Ericsson’s business, operations, business prospects and consequently on operating results, financial conditions and our ability to meet its targets.  These uncertainties, include the effects from ongoing trade disputes – notably between the US and China, and the uncertainty on how the change in US administration following the result of the 2020 Presidential Election may impact that trade dispute; and uncertainties for the future bilateral trading relationship between Sweden and China as a result of the decision of the Swedish Post and Telecom Authority to exclude Chinese vendors from participation in 5G.

Speakers and details of the event

Börje Ekholm, President and CEO, and Carl Mellander, CFO, will be joined by members of the company’s Executive Team. The speakers include Erik Ekudden, CTO, Fredrik Jejdling, Head of Business Area Networks, Jan Karlsson, Head of Business Area Digital Services, Peter Laurin, Head of Business Area Managed Services, Åsa Tamsons, Head of Business Area Technologies and New Businesses, Niklas Heuveldop, Head of Market Area North America, and Chris Houghton, Head of Market Area North East Asia.

Ericsson’s Capital Markets Day event can be accessed via the Ericsson website:

https://www.ericsson.com/en/investors/events-and-presentations/CMD2020  

Presentation materials can also be downloaded from the website once the webcast has started.

NOTES TO EDITORS:

FOLLOW US:

Subscribe to Ericsson press releases here.

www.twitter.com/ericsson

www.facebook.com/ericsson

www.linkedin.com/company/ericsson

FOR FURTHER INFORMATION, PLEASE CONTACT

Contact person
Peter Nyquist, Head of Investor Relations
Phone: +46 705 75 29 06
E-mail: peter.nyquist@ericsson.com

Additional contact
Stella Medlicott, Senior Vice President, Marketing and Corporate Relations
Phone: +46 730 95 65 39
E-mail: media.relations@ericsson.com

Investors
Stefan Jelvin, Director, Investor Relations
Phone: +46 709 86 02 27
E-mail: stefan.jelvin@ericsson.com

Lena Häggblom, Director, Investor Relations
Phone:  +46 72 593 27 78
E-mail:  lena.haggblom@ericsson.com

Media
Peter Olofsson, Head of Corporate Communications
Phone: +46 702 67 34 45
E-mail: media.relations@ericsson.com

Corporate Communications
Phone: +46 10 719 69 92
E-mail: media.relations@ericsson.com

About Ericsson

Ericsson enables communications service providers to capture the full value of connectivity. The company’s portfolio spans Networks, Digital Services, Managed Services, and Emerging Business and is designed to help our customers go digital, increase efficiency and find new revenue streams. Ericsson’s investments in innovation have delivered the benefits of telephony and mobile broadband to billions of people around the world. The Ericsson stock is listed on Nasdaq Stockholm and on Nasdaq New York. www.ericsson.com

Forward-looking statements

This release includes forward-looking statements, including statements reflecting management’s current views relating to the growth of the market, future market conditions, future events, financial condition, and expected operational and financial performance, including, in particular the following:

  • Our goals, strategies, planning assumptions and operational or financial performance expectations
  • Industry trends, future characteristics and development of the markets in which we operate
  • Our future liquidity, capital resources, capital expenditures, cost savings and profitability
  • The expected demand for our existing and new products and services as well as plans to launch new products and services including research and development expenditures
  • The ability to deliver on future plans and to realize potential for future growth
  • The expected operational or financial performance of strategic cooperation activities and joint ventures
  • The time until acquired entities and businesses will be integrated and accretive to income
  • Technology and industry trends including the regulatory and standardization environment in which we operate, competition and our customer structure.

The words "believe," "expect," "foresee," "anticipate," "assume," "intend," "likely," "projects," "may," "could," "plan," "estimate," "forecast," "will," "should," "would," "predict," "aim," "ambition," "seek," "potential," "target," "might," "continue," or, in each case, their negative or variations, and similar words or expressions are used to identify forward-looking statements. Any statement that refers to expectations, projections or other characterizations of future events or circumstances, including any underlying assumptions, are forward-looking statements.

We caution investors that these statements are subject to risks and uncertainties many of which are difficult to predict and generally beyond our control that could cause actual results to differ materially from those expressed in, or implied or projected by, the forward-looking information and statements.

Important factors that could affect whether and to what extent any of our forward-looking statements materialize include, but are not limited to, the factors described in the section "Risk Factors" in the latest interim report, and in "Risk Factors" in the Annual Report 2019.

These forward-looking statements also represent our estimates and assumptions only as of the date that they were made. We expressly disclaim a duty to provide updates to these forward-looking statements, and the estimates and assumptions associated with them, after the date of this release, to reflect events or changes in circumstances or changes in expectations or the occurrence of anticipated events, whether as a result of new information, future events or otherwise, except as required by applicable law or stock exchange regulations.

This information is information that Telefonaktiebolaget LM Ericsson is obliged to make public pursuant to the EU Market Abuse Regulation. The information was submitted for publication, through the agency of the contact person set out above at 10:00 pm CET on November 9, 2020.

This information was brought to you by Cision http://news.cision.com

https://news.cision.com/ericsson/r/ericsson-capital-markets-day-2020,c3234079

The following files are available for download:

https://mb.cision.com/Main/15448/3234079/1332731.pdf

Ericsson Capital Markets Day 2020


Electrolux Q3 2020 Interim report: Strong results and cash flow on rebounding markets

STOCKHOLM, Oct. 23, 2020

The comments and figures in this report refer to continuing operations unless otherwise stated

Highlights of the third quarter of 2020

  • Net sales amounted to SEK 32,004m (30,330). Organic sales increased by 15.2%.
  • Record high operating income of SEK 3,220m (1,063), corresponding to a margin of 10.1% (3.5), mainly driven by strong volumes and prices. The comparison period included non-recurring items of SEK -290m.
  • Significant market recovery driven mainly by pent-up demand and government stimulus programs.
  • Income for the period amounted to SEK 2,356m (610) and earnings per share was SEK 8.20 (2.12).
  • Operating cash flow after investments was SEK 6,005m (2,499).
  • The Board proposes to reinstate a dividend for 2019 of SEK 7.00 (8.50) per share, to be paid in one instalment.

President and CEO Jonas Samuelson’s comment

In the third quarter Electrolux reported record earnings of SEK 3,220m, or 10.1% of net sales, driven by pent-up demand and government stimulus programs impacting consumer spending. This drove significant volume growth, and positive price and mix improvement, resulting in organic sales growth of 15.2%. The record high operating income translated into a strong operating cash flow after investments of SEK 6,005m.

The strong demand in the quarter was to a significant extent a recovery of the very low market volumes in March-May due to store closures and restrictions on movement. Demand was further enhanced by stimulus programs, more than compensating for the weaker economy caused by the pandemic. Due to pandemic restrictions during the first half of the year, we entered the quarter with unusually low inventory levels, which have remained during the quarter despite high production levels, somewhat impacting our ability to meet the strong demand across all regions. 

Sales also benefitted from consumers spending more time at home, using their appliances more intensively and allocating more of their household budgets to home improvement. This in combination with our relentless focus on consumer experience innovation has continued to improve demand for our more highly featured products, driving favorable product mix.

One great experience innovation example is the Frigidaire Gallery AirFry cooker that recently received the 2020 innovation award at the Home Depot. The AirFry cooker also delivers a significantly higher gross margin compared to traditional cookers. Innovation is truly a key pillar for creating value and that is why we will showcase how we are driving profitable growth through innovation at our online Capital Markets Update on November 17.

The Board of Directors proposed to reinstate a dividend for the fiscal year 2019 based on the recovery in earnings and cash flow. The proposed dividend of SEK 7 per share will be up for decision at an Extraordinary General Meeting on November 3. Our strong commitment to sustainability remains unchanged with the target of climate neutrality by 2050, and I am pleased that the long-term incentive program for senior managers proposed by the Board includes a substantial climate impact reduction element.

Looking into the fourth quarter, visibility remains limited as demand may be impacted by several factors, especially as the pandemic is still very much present. However, we currently anticipate that consumer demand and thus financial performance will normalize gradually going forward. Considering this and the catch-up effect during the third quarter, we are revising our market outlook for the full-year 2020 upwards. We anticipate market demand for appliances in Europe to be slightly positive, in North America to be slightly positive to positive and in Latin America to be positive. It is only the combined demand in our larger markets in the Asia-Pacific, Middle East and Africa region that we still expect to be negative for 2020.

I am very proud of how we as an organization successfully have navigated in these challenging times. My colleagues around the world has done a great job in executing on our strategy. That is why I am confident that Electrolux remains well positioned to create value.

Telephone conference 09.00 CET

A telephone conference is held at 09.00 CET today, October 23. Jonas Samuelson, President and CEO and Therese Friberg, CFO will comment on the report.

Details for participation by telephone are as follows:

Participants in Sweden: +46 8 566 426 51

Participants in UK/Europe: +44 3333 000 804

Participants in US: +1 631 9131 422

Pin code: 36830556#

Slide presentation for download:

www.electroluxgroup.com/ir

Link to webcast:

https://edge.media-server.com/mmc/p/yv4vxegt

For further information, please contact:

Sophie Arnius, Head of Investor Relations +46 70 590 80 72

Åsa Öhman, Electrolux Press Hotline, +46 8 657 65 07

This is information that AB Electrolux is obliged to make public pursuant to the EU Market Abuse Regulation. The information was submitted for publication, through the agency of the contact person set out above, at 0800 CET on October 23, 2020.

This information was brought to you by Cision http://news.cision.com

https://news.cision.com/electrolux/r/electrolux-q3-2020-interim-report–strong-results-and-cash-flow-on-rebounding-markets,c3221416

The following files are available for download:

Recon Technology, Ltd Reports Financial Results for Fiscal Year 2020

BEIJING, Oct. 10, 2020 — Recon Technology, Ltd. (Nasdaq: RCON) ("Recon" or the "Company"), a China-based independent solutions integrator in the oilfield service and environmental protection, electric power and coal chemical industries, today announced its financial results for fiscal year 2020.

Fiscal 2020 Financial Highlights:

  • Total cost of revenues for fiscal year 2020 decreased by 36.4% to $6.5 million (RMB46.2 million).
  • Gross profit for fiscal year 2020 was $2.8 million (RMB19.6 million). Gross profit margin for fiscal year 2020 was 29.8%, an increase of 0.6 percentage points compared to fiscal year 2019.
  • Net loss attributable to Recon for fiscal year 2020 was $2.7 million (RMB19.2 million), or $0. 59 (RMB4.16) per basic and diluted share, compared to $3.5 million (RMB24.0 million), or $0.92 (RMB6.49) per basic and diluted share for the fiscal year 2019.

Management Commentary

Mr. Shenping Yin, co-founder and CEO of Recon, stated, "The COVID-19 pandemic had a significant impact on our operation of the second-half of fiscal 2020, resulted in a delay in project performance timeline and thus delayed recognition of revenue. Nevertheless, we are pleased with our ability to handle such challenge and we believe our delayed projects will be completed methodically as social and overall conditions in China resume. We’re also very proud that our clients remained stable and we believe our strategy to establish long term cooperation with clients valuing our essential automation solution and value-added services will help us reposition our business by bringing more resources through companies that want to adopt effective online and industrial automotive solutions and Internet-of-Things in China."

"We believe Recon has been prepared for larger projects in automation and environmental protection segments. We never stop improving our business structure and focusing on opportunities that can leverage our knowledge and experience in energy industry. We believe all our current efforts will drive our long-term net profit growth targets," concluded Mr. Yin.

Fiscal 2020 Financial Results:

Revenue

Total revenues were approximately RMB65.8 million ($9.3 million), representing a decrease of 35.8% compared to fiscal year 2019.

Automation products and software. Revenues from automation products and software decreased to approximately RMB51.4 million ($7.3 million), representing a decrease of 19.1% from fiscal year 2019. The decrease was primarily due to the postponed acceptance of several projects and less expenditures budgeted by Shenhua Group and decreased orders from Xinjiang East Hope New Energy Co., Ltd.

Equipment and accessories. Revenue from equipment and accessories decreased to approximately RMB14.2 million ($2.0 million), representing a decrease of 40.6% from fiscal year 2019, mainly due to less demand of the Company’s products by oilfield companies as a result of low oil price.

Oilfield environmental protection. Revenue from oilfield environmental protection decreased by 99.2% to almost nil for this period, mainly affected by late acceptance inspection of the Company’s Gansu production project, thus orders were not fulfilled and revenue was not recognized during the fiscal year 2020.

Cost and Margin

Total cost of revenues decreased by 36.4% to approximately RMB46.2 million ($6.5 million), mainly due to the decreased cost in line with revenue.

Gross profit decreased to approximately RMB19.6 million ($2.8 million), representing a decrease of 34.4% from fiscal year 2019. Gross margin was maintained at a same level of 29.8%, compared to a 29.2% of last year. Specifically, gross margin for automation and equipment segments were all improved during fiscal year 2020. The Company expects that the gross margin for oilfield environmental protection segment will be back to a 40% level when the treatment process is completed and revenue is recognized.

Operating Expenses

Total operating expenses decreased to approximately RMB39.8 million ($5.6 million), representing a decrease of 26.5%.

Selling and distribution expenses. Selling and distribution expenses were approximately RMB4.4 million ($0.6 million), representing a 51.3% decrease from fiscal year 2019. This decrease was mainly caused by less traveling expenses and entertainment expenses as the Company tried to control its operating expenditure, as well as the restriction on travelling and outdoor activities imposed by PRC government due to the COVID-19 during the fiscal year 2020.

General and Administrative Expenses. General and administrative expenses was approximately RMB26.1 million ($3.7 million), representing a 36.7% decrease from fiscal year 2019. The decrease was mainly due to the decrease in stock-based compensation expense.

Research and development expenses. Research and development expenses were approximately RMB7.0 million ($1.0 million), representing an increase of 7.6% from fiscal year 2019. This increase was primarily due to more expenses spent on design of new automation platform systems.

Net Loss

Loss from operations was RMB20.2 million ($2.9 million), representing a decrease of 22.0% from fiscal year 2019, which was a loss of RMB25.8 million.

Basic and diluted EPS. Basic and diluted net loss per share were RMB4.16 ($0.59), compared to RMB6.49 ($0.92) in fiscal year 2019.

Financial Condition

As of June 30,2020, the Company had cash of RMB30.3 million ($4.3 million), compared to RMB4.5 million as of June 30, 2019. As of June 30, 2020, the Company had working capital of RMB64.1 million ($9.1 million), while as of June 30, 2019, the Company had working capital of RMB55.7 million. The increase was mainly contributed to securities offerings during May and June of 2020.

Net cash used in operating activities was RMB5.2 million ($0.7 million) for fiscal year 2020, compared to net cash used in operating activities of approximately RMB32.2 million for fiscal year 2019. Net cash used in investing activities was RMB2.1 million ($0.3 million) for fiscal year 2020, compared to RMB13.5 million for fiscal year 2019. Net cash provided by financing activities was RMB33.2 million ($4.7 million) for fiscal year 2020, compared to net cash provided by financing activities of RMB3.5 million for fiscal year 2019.

Exchange Rate

The translation of RMB amounts into U.S. dollars are included solely for the convenience of readers and have been made at the rate of RMB7.06973 to $1.00, the approximate exchange rate prevailing on December 31, 2019.

About Recon Technology, Ltd.

Recon Technology, Ltd. (RCON) is China’s first non-state-owned oil and gas field service company listed on NASDAQ. Recon supplies China’s largest oil exploration companies with advanced automated technologies, efficient gathering and transportation equipment and reservoir stimulation measures for increasing petroleum extraction levels, reducing impurities and lowering production costs. Since 2017, the Company has expanded its business operations into other segments of the broader energy industry including electric power, coal chemicals, renewable energy and environmental protection in the energy and chemical industries. Through the years, Recon has taken leading positions on several market segments of the oil and gas field service industry. Recon also has developed stable long-term cooperation relationships with its major clients, and its products and service are well accepted by clients. For additional information please visit: www.recon.cn.

Safe Harbor Statement

This news release contains forward-looking statements as defined by the Private Securities Litigation Reform Act of 1995. Forward-looking statements include statements concerning plans, objectives, goals, strategies, future events or performance, and underlying assumptions and other statements that are other than statements of historical facts. These statements are subject to uncertainties and risks including, but not limited to, product and service demand and acceptance, changes in technology, economic conditions, the impact of competition and pricing, government regulation, the effect of novel coronavirus and other health matters on target markets, and other risks contained in reports filed by the company with the Securities and Exchange Commission. All such forward-looking statements, whether written or oral, and whether made by or on behalf of the company, are expressly qualified by the cautionary statements and any other cautionary statements which may accompany the forward-looking statements. In addition, the company disclaims any obligation to update any forward-looking statements to reflect events or circumstances after the date hereof.

IR contact:

In China:

Ms. Liu Jia
Recon Technology, Ltd.
Phone: +86 (10) 8494-5799
Email: info@recon.cn


RECON TECHNOLOGY, LTD

CONSOLIDATED BALANCE SHEETS

As of June 30

As of June 30

As of June 30

2019

2020

2020

ASSETS

RMB

RMB

U.S. Dollars

Current assets

Cash

¥

4,521,325

¥

30,336,504

$

4,291,042

Notes receivable

3,073,680

4,180,885

591,378

Trade accounts receivable, net

68,535,282

48,244,015

6,824,026

Trade accounts receivable- related party, net

3,409,912

3,068,920

434,093

Inventories, net

1,270,523

1,985,723

280,877

Other receivables, net

5,665,593

6,350,802

898,309

Loans to third parties

4,960,000

3,200,377

452,687

Purchase advances, net

1,343,576

178,767

25,286

Contract assets, net

4,633,940

31,537,586

4,460,933

Prepaid expenses

192,837

198,294

28,048

Prepaid expenses – related parties

217,600

Total current assets

97,824,268

129,281,873

18,286,679

Property and equipment, net

3,661,321

29,756,879

4,209,055

Construction in progress

21,524,994

Land use right, net

1,307,887

1,280,648

181,145

Investment in unconsolidated entity

31,078,971

31,541,850

4,461,536

Long-term other receivables, net

440,015

3,640

515

Prepayments for construction in progress

1,144,098

Operating lease right-of-use assets (including ¥Nil and ¥803,503
($113,654) from a related party as of June 30, 2019 and 2020, respectively)

2,549,914

360,681

Total Assets

¥

156,981,554

¥

194,414,804

$

27,499,611

LIABILITIES AND STOCKHOLDERS’ EQUITY

Current liabilities

Short-term bank loans

¥

2,500,000

¥

9,520,000

$

1,346,586

Trade accounts payable

14,089,293

23,034,347

3,258,163

Other payables

2,246,410

2,609,486

369,107

Other payable- related parties

2,290,873

4,498,318

636,279

Contract Liabilities

120,000

3,486,033

493,093

Accrued payroll and employees’ welfare

1,384,529

1,917,635

271,246

Investment payable

6,400,000

6,400,000

905,268

Taxes payable

2,180,847

1,108,288

156,765

Short-term borrowings

1,081,096

200,000

28,290

Short-term borrowings – related parties

9,010,525

10,230,746

1,447,120

Long-term borrowings – related party – current portion

780,797

847,346

119,856

Operating lease liabilities – current (including ¥Nil and ¥450,728
($63,755) from a related party as of June 30, 2019 and 2020, respectively)

1,328,976

187,981

Total Current Liabilities

42,084,370

65,181,175

9,219,754

Operating lease liabilities – non-current (including ¥Nil and ¥352,775
($49,899) from a related party as of June 30, 2019 and 2020, respectively)

1,210,088

171,165

Long-term borrowings – related party

8,196,204

7,379,253

1,043,782

Total Liabilities

50,280,574

73,770,516

10,434,701

Commitments and Contingencies

Equity

Common stock, ($ 0.0925 U.S. dollar par value, 20,000,000 shares
authorized; 4,361,634 shares and 7,202,832 shares issued and outstanding
as of June 30, 2019 and June 30, 2020, respectively) *

2,712,773

4,577,233

647,441

Additional paid-in capital

250,624,798

282,505,455

39,959,870

Statutory reserve

4,148,929

4,148,929

586,858

Accumulated deficit

(164,780,885)

(184,027,586)

(26,030,358)

Accumulated other comprehensive gain

2,909,936

2,825,731

399,694

Total stockholders’ equity

95,615,551

110,029,762

15,563,505

Non-controlling interests

11,085,429

10,614,526

1,501,405

Total equity

106,700,980

120,644,288

17,064,910

Total Liabilities and Equity

¥

156,981,554

¥

194,414,804

$

27,499,611


RECON TECHNOLOGY, LTD

CONSOLIDATED STATEMENTS OF OPERATIONS AND COMPREHENSIVE LOSS

For the years ended June 30,

2018

2019

2020

2020

RMB

RMB

RMB

USD

Revenues

Revenues – third party

¥

84,135,037

¥

98,657,433

¥

65,760,651

$

9,301,722

Revenues – related party

577,009

3,726,894

Revenues

84,712,046

102,384,327

65,760,651

9,301,722

Cost of revenues

Cost of revenues – third party

80,097,834

70,316,198

46,154,255

6,528,433

Cost of revenues – related party

464,027

2,202,765

Cost of revenues

80,561,861

72,518,963

46,154,255

6,528,433

Gross profit

4,150,185

29,865,364

19,606,396

2,773,289

Selling and distribution expenses

8,013,353

9,076,266

4,417,413

624,835

General and administrative expenses

34,687,317

41,288,351

26,120,099

3,694,644

Provision for (net recovery of) doubtful accounts

(841,242)

610,776

2,203,531

311,685

Research and development expenses

3,215,653

3,133,545

7,042,385

996,132

Operating expenses

45,075,081

54,108,938

39,783,428

5,627,296

Loss from operations

(40,924,896)

(24,243,574)

(20,177,032)

(2,854,007)

Other income (expenses)

Subsidy income

371,650

1,149,016

1,210,318

171,197

Interest income

68,028

40,391

54,746

7,744

Interest expense

(897,521)

(1,589,045)

(1,451,890)

(205,367)

Income (loss) from investment in unconsolidated entity

(959,905)

462,879

65,473

Impairment loss of investment in unconsolidated entity

(4,037,736)

Foreign exchange transaction gain (loss)

(4,068)

56,603

(17,720)

(2,506)

Other income

65,539

162,585

78,417

11,092

Other income (expense), net

(4,434,108)

(1,140,355)

336,750

47,633

Loss before income tax

(45,359,004)

(25,383,929)

(19,840,282)

(2,806,374)

Income tax expenses

16,230

398,477

282,322

39,934

Net loss

(45,375,234)

(25,782,406)

(20,122,604)

(2,846,308)

Less: Net loss attributable to non-controlling interests

(1,302,913)

(426,501)

(875,903)

(123,895)

Net loss attributable to Recon Technology, Ltd

¥

(44,072,321)

¥

(25,355,905)

¥

(19,246,701)

$

(2,722,413)

Comprehensive loss

Net loss

(45,375,234)

(25,782,406)

(20,122,604)

(2,846,308)

Foreign currency translation adjustment

1,765,249

1,393,843

(84,205)

(11,911)

Comprehensive loss

(43,609,985)

(24,388,563)

(20,206,809)

(2,858,219)

Less: Comprehensive loss attributable to non-controlling
interests

(1,302,913)

(426,501)

(875,903)

(123,895)

Comprehensive loss attributable to Recon Technology,
Ltd

¥

(42,307,072)

¥

(23,962,062)

¥

(19,330,906)

$

(2,734,324)

Loss per common share – basic and diluted

¥

(19.19)

¥

(6.49)

¥

(4.16)

$

(0.59)

Weighted – average shares -basic and diluted

2,296,693

3,908,833

4,624,615

4,624,615


RECON TECHNOLOGY, LTD

CONSOLIDATED STATEMENTS OF CASH FLOWS    

For the years ended

2018

2019

2020

2020

RMB

RMB

RMB

U.S. Dollars

Cash flows from operating activities:

Net loss

¥

(45,375,234)

¥

(25,782,406)

¥

(20,122,604)

$

(2,846,308)

Adjustments to reconcile net loss to net cash used in
operating activities:

Depreciation and amortization

1,119,049

1,124,011

1,609,700

227,689

Gain from disposal of equipment

(78,285)

(89,156)

(12,611)

Provision for (net recovery of) doubtful accounts

(841,242)

610,776

2,203,531

311,685

Provision for slow moving inventories

65,245

65,380

56,817

8,037

Amortization of right of use assets

1,408,551

199,237

Reversal of interests expense

(81,096)

(11,471)

Restricted shares issued for management and employees

15,462,124

21,288,204

7,944,835

1,123,782

Loss (income) from investment in unconsolidated entity

959,905

(462,879)

(65,473)

Impairment loss of investment in unconsolidated entity

4,037,736

Restricted shares issued for services

3,050,896

845,781

33,927

4,799

Changes in operating assets and liabilities:

Notes receivable

2,116,998

922,282

(1,107,205)

(156,612)

Trade accounts receivable

11,972,175

(40,461,376)

18,428,088

2,606,619

Trade accounts receivable-related party

(3,409,912)

Inventories

(5,012,984)

(1,197,529)

(1,124,935)

(159,120)

Other receivable

(1,717,096)

(928,882)

(206,146)

(29,159)

Purchase advance

(296,903)

5,784,669

1,210,309

171,196

Contract assets

(127,325)

7,554,745

(26,938,013)

(3,810,332)

Prepaid expense

318,759

316,845

(5,457)

(772)

Prepaid expense – related parties

(217,600)

217,600

30,779

Operating lease liabilities

(1,419,402)

(200,772)

Trade accounts payable

(2,706,304)

(400,034)

8,205,660

1,160,675

Other payables

(179,507)

(861,620)

(23,600)

(3,338)

Other payables-related parties

(102,563)

(920,584)

2,207,445

312,239

Deferred revenue

(1,174,585)

Advance from customers

27,756

(37,856)

3,366,033

476,119

Accrued payroll and employees’ welfare

140,828

784,095

533,109

75,407

Accrued expenses

9,425

1,333

Taxes payable

(269,358)

1,748,934

(1,085,213)

(153,501)

Net cash used in operating activities

(19,569,820)

(32,212,172)

(5,230,676)

(739,873)

Cash flows from investing activities:

Investment in unconsolidated entity

(4,037,736)

(4,205,080)

Purchases of property and equipment

(1,503,410)

(1,735,956)

(85,974)

(12,161)

Proceeds from disposal of equipment

32,000

900

127

Payments for land use right

(1,361,969)

Repayments from loans to third parties

435,250

1,000,000

11,239,623

1,589,824

Payments made for loans to third parties

(1,960,000)

(4,000,000)

(9,480,000)

(1,340,928)

Payments and prepayments for construction in progress

(9,157,103)

(4,606,823)

(3,782,912)

(535,086)

Net cash used in investing activities

(17,552,968)

(13,547,859)

(2,108,363)

(298,224)

Cash flows from financing activities:

Proceeds from short-term bank loans

45,000

2,500,000

9,520,000

1,346,586

Repayments of short-term bank loans

(45,000)

(2,500,000)

(353,620)

Proceeds from short-term borrowings

4,600,000

1,081,096

200,000

28,290

Repayments of short-term borrowings

(4,900,000)

(1,000,000)

(141,448)

Proceeds from short-term borrowings-related parties

20,188,318

5,000,000

17,415,000

2,463,319

Repayments of short-term borrowings-related parties

(21,332,036)

(5,000,000)

(16,195,000)

(2,290,753)

Proceeds from long-term borrowings-related party

10,000,000

Repayments of long-term borrowings-related party

(371,975)

(684,191)

(747,630)

(105,751)

Proceeds from sale of common stock, net of issuance costs

65,004,531

26,141,051

3,697,603

Refund of capital contribution by a non-controlling
shareholder

(200,000)

Capital contribution by non-controlling shareholders

3,700,000

850,000

405,000

57,286

Net cash provided by financing activities

76,888,838

3,546,905

33,238,421

4,701,512

Effect of exchange rate fluctuation on cash

1,765,249

1,393,873

(84,203)

(11,906)

Net (decrease) increase in cash

41,531,299

(40,819,253)

25,815,179

3,651,509

Cash at beginning of year

3,809,279

45,340,578

4,521,325

639,533

Cash at end of year

¥

45,340,578

¥

4,521,325

¥

30,336,504

$

4,291,042

Supplemental cash flow information

Cash paid during the year for interest

¥

868,042

¥

1,542,381

¥

1,400,462

$

198,093

Cash paid (received) during the year for taxes

¥

(22,671)

¥

2,002

¥

282,322

$

39,934

Non-cash investing and financing activities

Shares issued to settle salary payable

¥

1,554,908

¥

¥

$

Issuance of common stock in exchange of shares of FGS,
net of issuance costs

¥

¥

21,433,796

¥

$

Investment payable in exchange of interest of FGS

¥

¥

6,400,000

¥

$

Right-of-use assets obtained in exchange for operating
lease obligations

¥

¥

¥

1,228,963

$

173,834

Inventories used for fixed assets

¥

¥

¥

409,735

$

57,956

Payable for construction in progress

¥

3,096,781

¥

5,694,980

¥

732,513

$

103,613

Receivable for disposal of property and equipment

¥

81,900

¥

¥

110,000

$

15,559

Payable for issuance cost of common stock

¥

¥

¥

374,696

$

53,000

The accompanying notes are an integral part of these consolidated financial statements.

* Retrospectively restated for effect of stock split on December 27, 2019.


Related Links :

http://www.recon.cn/