Tag Archives: OTC

INX Customer Data and Funds are Secure After Recent Attack on Third-Party Service Provider

Swift Response and Assurance: Customer Accounts and Security Uncompromised Despite Third-Party Service Provider Cybersecurity Incident

TORONTO, Dec. 30, 2023 /PRNewswire/ — The INX Digital Company, Inc. (NEO: INXD, OTCQB: INXDF, INXATS: INX) (the “Company” or “INX”), a security token and digital asset trading platform, U.S. broker-dealer, alternative trading system, transfer agent, and inter-dealer broker (through its subsidiaries), announced that on December 20, 2023, it learned of a cyberattack that occurred on the computer systems of a third-party vendor providing services to one of the Company’s subsidiaries. 

As a result, a malicious actor managed to access the third-party vendor’s servers and executed unauthorized trades which resulted in a loss of funds of the Company’s subsidiary of approximately $1.6 million. The Company took immediate actions to remediate the security vulnerability and to investigate the nature and scope of the incident. The Company also notified relevant law enforcement in the appropriate jurisdictions and is working with the affected trading venue to investigate this incident and take appropriate legal action.  

INX customers were not affected by the incident, and the security breach at the third-party provider did not have any impact on the platforms and servers of INX. No personal information or other data of INX’s customers was compromised, and INX.One remains fully operational. The Company placed additional security measures in place and continues to actively monitor any suspicious activity. 

The Company holds a “Reserve Fund” (which is not part of the Company’s operational capital) in the amount of $36,023,000, which is restricted and specifically designed to cover customer and INX losses, if any, that result from cybersecurity breaches or theft, errors in execution of the trading platform or its technology, and counterparty defaults, including instances where counterparties lack sufficient collateral to cover losses. The Company will seek to recover the lost funds through any means necessary. If unsuccessful, and after these efforts are exhausted, the Company will utilize the Reserve Fund for the recovery of the loss that resulted from this security incident. There is no assurance that any such lost funds will be recovered.

The Company does not expect this incident to have a material impact on its business operations or its financial results.

About INX:
INX provides regulated trading platforms for digital securities and cryptocurrencies. With the combination of traditional market expertise and a disruptive fintech approach, INX provides state-of-the-art solutions to modern financial problems. INX is led by an experienced and dedicated team of business, finance, and technology veterans with the shared vision of redefining the world of capital markets via blockchain technology and a disciplined regulatory approach.

About The INX Digital Company, Inc.:
The INX Digital Company, Inc. is the holding company for the INX Group, which includes regulated trading platforms for digital securities and cryptocurrencies. The INX Group’s vision is to be the preferred global regulated hub for digital assets on the blockchain. The INX Group’s overall mission is to bring communities together and empower them with financial innovation. Our journey started with our initial public token offering of the INX Token, in which we raised US$84 million. The INX Group is shaping the blockchain asset industry through its willingness to work in a regulated environment with oversight from regulators like the SEC and FINRA. For more information, please visit the INX Group website at https://www.inx.co/.

Cautionary Note Regarding Forward-Looking Information and Other Disclosures
This press release contains statements that constitute “forward-looking information (“forward-looking information”) within the meaning of the applicable Canadian securities legislation. All statements, other than statements of historical fact, are forward-looking information and are based on expectations, estimates and projections as at the date of this news release. Any statement that discusses predictions, expectations, beliefs, plans, projections, objectives, assumptions, future events or performance (often but not always using phrases such as “expects”, or “does not expect”, “is expected”, “anticipates” or “does not anticipate”, “plans”, “budget”, “scheduled”, “forecasts”, “estimates”, “believes” or “intends” or variations of such words and phrases or stating that certain actions, events or results “may” or “could”, “would”, “might” or “will” be taken to occur or be achieved) are not statements of historical fact and may be forward-looking information. In disclosing the forward-looking information contained in this press release, INX has made certain assumptions, including with respect to, the continuous development of the INX trading platform, the completion of the transactions described herein, and the development of the digital asset industry. Although INX believes that the expectations reflected in such forward-looking information are reasonable, it can give no assurance that the expectations of any forward-looking information will prove to be correct. Known and unknown risks, uncertainties, and other factors which may cause the actual results and future events to differ materially from those expressed or implied by such forward-looking information. Such factors include but are not limited to regulatory developments, the state of the digital securities and cryptocurrencies markets, and general economic conditions. Accordingly, readers should not place undue reliance on the forward-looking information contained in this press release. Except as required by law, INX disclaims any intention and assumes no obligation to update or revise any forward-looking information to reflect actual results, whether as a result of new information, future events, changes in assumptions, changes in factors affecting such forward-looking information or otherwise.

Neo Exchange is not responsible for the adequacy or accuracy of this press release. This news release does not constitute an offer to sell or a solicitation of an offer to buy any of the securities in the United States. The securities have not been and will not be registered under the U.S. Securities Act or any state securities laws and may not be offered or sold within the United States or to U.S. persons unless registered under the U.S. Securities Act and applicable state securities laws or an exemption from such registration is available.

For further information, contact:
The INX Digital Company, Inc.
Investor Relations
+1 855 657 2314
Contact: Alan Silbert
Email: investorrelations@inx.co

Source: The INX Digital Company, Inc.

IronNet Inc. Files Voluntary Chapter 11 Petitions

MCLEAN, Va., Nov. 4, 2023 /PRNewswire/ — IronNet, Inc. (“IronNet” or “the Company”) stabilizes operations and continues plan of reorganization under Chapter 11 of the United States Bankruptcy Code in the United States Bankruptcy Court for the District of Delaware (the “Court” and such cases, the “Chapter 11 Cases” or “Restructuring”).

On October 10, 2023, IronNet entered into a binding term sheet (the “Term Sheet”) with ITC Global Advisors (“ITC”) for a $10M debtor-in-possession financing facility (“DIP”).

On October 12, 2023, IronNet filed a variety of “first day” motions seeking customary relief intended to enable the Company and its subsidiaries to continue ordinary course operations during the Restructuring. On October 13, 2013, the Court approved these first day motions, and authorized, on an interim basis, the execution of a reinstatement agreement with Amazon Web Services to reinstate and reactivate its cloud computing services.

Linda Zecher, CEO of IronNet, said, “Against a backdrop of intense restructuring in an uncertain capital raising environment, we remain intent on stabilizing IronNet and serving our customers. With the DIP financing provided by ITC, we believe we are better positioned to act in the interests of our stakeholders through the Restructuring.”

About IronNet

Founded in 2014 by GEN (Ret.) Keith Alexander, IronNet, Inc. (OTCMKTS: IRNTQ) is a global cybersecurity leader that is transforming how organizations secure their networks by delivering the first-ever collective defense platform operating at scale. Employing a number of former NSA cybersecurity operators with offensive and defensive cyber experience, IronNet integrates deep tradecraft knowledge into its industry-leading products to solve the most challenging cyber problems facing the world today.

Cautionary Statements

The Company cautions that trading in the Company’s securities during the pendency of the Restructuring is highly speculative and poses substantial risks. Trading prices for the Company’s securities may bear little or no relationship to the actual recovery, if any, by holders of the Company’s securities in the Restructuring.

Certain statements in this release are forward-looking statements which are subject to risks, uncertainties, and other factors potentially causing actual materially differing results from those expressed or implied by such statements, and are based upon estimates and assumptions that, while considered reasonable by the Company and its management, are inherently uncertain, including statements with respect to the Company’s pursuit of bankruptcy protection. Forward-looking statements generally relate to future events and can be identified by terminology such as or similar to “may,” “should,” “could,” “future,” “expect,” “intend,” “intent,” “will,” “estimate,” “believe,” “predict,” “potential,” “anticipate” or “continue,” or the negatives of these terms or variations of them or similar terminology.

Factors relating to the Company’s Restructuring potentially causing actual results to differ materially from current expectations include, but are not limited to; the ability to obtain Court approval of motions filed, risks associated with any third-party motions, potential adverse effects of the Restructuring on the Company’s liquidity or results of operations and increased legal and other professional costs necessary to execute the Company’s reorganization, duration of the Restructuring, Court rulings in and the outcome of the Restructuring in general, and any effects of Restructuring on the Company and on the interests of various constituents.

Additionally, conditions to which the Company’s cash collateral is subject and the risk that these conditions may not be satisfied for various reasons, including reasons outside of the Company’s control; consequences of the acceleration of the Company’s debt obligations and the trading price and volatility of the Company’s common stock, and risks and uncertainties stated in the sections entitled “Risk Factors” and “Cautionary Note Regarding Forward-Looking Statements” of the Company’s Annual Report on Form 10-K for the fiscal year ended January 31, 2023, and other documents filed by the Company from time to time with the SEC. Forward-looking statements speak only as of the date they are made. Readers are cautioned not to put undue reliance on forward-looking statements, and the Company assumes no obligation and does not intend to update or revise these forward-looking statements other than as required by applicable law. The Company does not give any assurance that it will achieve its expectations.

Investor Contact: IR@ironnet.com
Media Contact: Media@ironnet.com

Source: IronNet, Inc.

Recon Technology, Ltd Reports Financial Year Results for Fiscal Year 2023

BEIJING, Oct. 28, 2023 /PRNewswire/ — Recon Technology, Ltd (NASDAQ: RCON) (“Recon” or the “Company”), a China-based independent solutions integrator in the oilfield service and environmental protection, electric power and coal chemical industries, today announced its financial results for fiscal year 2023.

Fiscal Year Ended June 30, 2023 Financial Highlights:

–  Total revenue decreased by approximately RMB16.7 million ($2.3 million) or 19.9% to RMB67.1 million ($9.3 million) for the year ended June 30, 2023 from RMB83.8million ($12.5 million) for the same period in 2022.

–  Gross profit decreased to RMB18.9 million ($2.6 million) for the year ended June 30, 2023, from RMB19.4 million ($2.9 million) for the same period in 2022.

–  Gross margin increased to 28.1% for the year ended June 30, 2023 from 23.2% for the same period in 2022.

–  Net loss was RMB61.5 million ($8.5 million) for the year ended June 30, 2023, an increase of RMB155.8 million ($21.5 million) from net income of RMB94.3 million ($14.1 million) for the same period of 2022.

For the Years Ended

June 30,

2023

2022

Increase /(Decrease)

Percentage
Change

(in RMB millions, except
earnings per share;
differences due to rounding)

Revenue

RMB

67.1

RMB

83.8

RMB

(16.7)

(19.9)

%

Gross profit

18.9

19.4

(0.5)

(2.9)

%

Gross margin

28.1 %

23.2 %

6.0 %

——

Net income (loss)

(61.5)

94.3

(155.8)

(165.2)

%

Net earnings per share –
Basic and diluted

(1.7)

3.2

(4.9)

(154.5)

%

Management Commentary

Mr. Shenping Yin, Founder and CEO of Recon said, “Fiscal year ended 2023 was a year of change, challenge and opportunity for Recon. As a result of the impact of the outbreak and changes in the industry, our established business volume temporarily declined and recovered less than optimally, and resulting in a decline in overall revenue in fiscal year ended 2023, but our gross margins improved due to management efficiencies and the overall recovery of the industry.

We believe that China’s investment and demand in the oil industry will not decrease in the near future, and we believe that there are still many opportunities for growth in the oil industry. Recon will continue to benefit from this trend. We expect a significant increase in the volume of business in the oilfield services segment in the coming year. We are also expanding our business focus from oilfield service segment to broader energy sectors, including carbon-zero opportunities and alternative materials for primary petroleum products. We are actively exploring the chemical recycling business of low-value plastics based on waste treatment and recycling, and have reached preliminary cooperation agreements and market expansion and sales intentions with key upstream and downstream customers. Our drive has always been to maximize the long-term benefits for our company and our shareholders based on our experience and resources in the petrochemical and energy industries.”

Fiscal Year Ended 2023 Financial Results:

Revenue

Total revenues for the year ended June 30, 2023 were approximately RMB67.1 million ($9.3 million), a decrease of approximately RMB16.7 million ($2.3 million) or 19.9% from RMB83.8million ($12.5 million) for the same period in 2022. The overall decrease in revenue was mainly due to decrease from all four segments during the year ended June 30, 2023.

 –  Revenue from automation product and software decreased by RMB5.3 million ($0.7 million) or 316.6%. The decrease was mainly caused by decreased orders from JiDong oilfield as this client reduced their investment budget and oil and gas extraction activities.

 –  Revenue from equipment and accessories decreased by ¥0.9 million ($0.1 million) or 5.3% as we decided not to continue working with some oilfield client with low production levels and allocated our sales and service resources into some larger oilfield companies. We believe this was a temporary decline. Our revenue from this segment will increase in the coming year.

 –  Revenue from oilfield environmental protection decreased by RMB6.2million ($0.9 million) or 24.5%. This was mainly caused by less raw materials we could collect. As a result, our revenue decreased due to lower processing volume compared to the same period last year.

 –  Revenue from platform outsourcing services decreased by RMB4.2 million ($0.6 million) or 45.2%. The decrease was mainly due to less overall economic activities and lower refueling volumes at gas stations, and change in the method of settlement with major customers, from the original service fee based on a percentage of the volume and transaction amount to a basic fixed monthly service fee. 

Cost of revenue

Cost of revenues decreased from RMB64.4 million ($9.6 million) for the year ended June 30, 2022 to RMB48.2 million ($6.7 million) for the same period in 2023. This decrease was mainly caused by the decreased cost of revenue from automation product and software, oilfield environmental protection and platform outsourcing services segments, which was partially offset by the decreased cost of revenue from equipment and accessories segment during the year ended June 30, 2023.

Gross profit

Gross profit decreased to RMB18.9 million ($2.6 million) for the year ended June 30, 2023 from RMB19.4 million ($2.9 million) for the same period in 2022. Gross profit as a percentage of revenue increased to 28.1% for the year ended June 30, 2023 from 23.2% for the same period in 2022.

– For the years ended June 30, 2022 and 2023, our gross profit from automation product and software was approximately RMB2.1 million and RMB3.0 million ($0.4 million), respectively, representing an increase in gross profit of approximately RMB0.9 million ($0.1 million) or 42.4%. In year 2021, we mainly carried out contracts that were signed during the COVID-19 and low oil price period, during which we used a low-margin strategy to maintain our cooperation business with clients. As oil price increase in 2022, our customers recovered and contract terms were improved and our margin increased and the margin percentage will also be higher.

–  For the years ended June 30, 2022 and 2023, gross profit from equipment and accessories was approximately RMB6.7 million and RMB7.3 million ($1.0 million), respectively, representing a slight increase of approximately RMB0.6 million ($0.09 million) or 9.3%. This was mainly driven by high oil price and more demands for heating furnaces with higher margin rather than accessories with lower margin.

–  For the years ended June 30, 2022 and 2023, gross profit from oilfield environmental protection was approximately RMB5.1 million and RMB5.2 million ($0.7 million), respectively, maintaining at a stable level.

–  For the years ended June 30, 2022 and 2023, gross profit from platform outsourcing services was approximately RMB5.5 million and RMB3.4 million ($0.5 million), respectively, representing a decrease of approximately RMB2.1 million ($0.3 million) or 38.6%, this was mainly because personnel expenses, which constitutes major part of our costs, reduced during the year ended June 30, 2023.

Operating expenses

Selling expenses increased by 4.8%, or RMB0.4 million ($0.07 million), from RMB10.2 million in the year ended June 30, 2022 to RMB10.6 million ($1.5 million) in the same period of 2023.

General and administrative expenses decreased by 7.8%, or RMB6.5 million ($0.9 million), from RMB83.3 million in the year ended June 30, 2022 to RMB76.8 million ($10.6 million) in the same period of 2023. 

Net recovery of credit losses of RMB0.7 million for the year ended June 30, 2022 as compared to net recovery of credit losses of RMB9.0 million ($1.2 million) for the same period in 2023. 

Research and development expenses remained relatively stable with a slight decrease by 1.8%, or RMB0.2 million ($0.02 million) from RMB9.0 million for the year ended June 30, 2022 to RMB8.8 million ($1.2 million) for the same period of 2023.

Loss from operations

Loss from operations was RMB69.3 million ($9.6 million) for the year ended June 30, 2023, compared to a loss of RMB82.3 million for the same period of 2022. This RMB13.0 million ($1.8 million) decrease in loss from operations was primarily due to the decrease in operating expense as discussed above.

Gain in fair value changes of warrant liability

The Company classified the warrants issued in connection with common share offering as liabilities at their fair value and adjusted the warrant instrument to fair value at each reporting period. This liability is subject to re-measurement at each balance sheet date until exercised, and any change in fair value is recognized in our statement of operations. Gain in change in fair value of warrant liability was RMB174.5 million and RMB6.1 million ($0.8 million) for the years ended June 30, 2022 and 2023, respectively.

Impairment loss on goodwill and intangible assets

In conjunction with the preparation of our consolidated financial statement for years ended June 30, 2022 and 2023, the management performed evaluation on the impairment of goodwill and intangible assets and recorded an impairment loss on goodwill and intangible assets of RMB2.3 million and RMB10.0 million ($1.4 million) for the years ended June 30, 2022 and 2023, respectively. The impairment was mainly due to the decision of the major customers to develop their own autonomous unified system and to significantly reduce the procurement of third-party services. This change has had a significant and negative impact on FGS’s business model and enterprise value. 

Interest income

Net interest income was RMB11.1 million ($1.5 million) for the year ended June 30, 2023, compared to net interest income of RMB3.8 million for the same period of 2022. The RMB.3 million ($1.0 million) increase in net interest income was primarily due to the increased interest-bearing loans to third parties and increased short-term investments we invested during the year ended June 30, 2023.

Other income (expenses), net.

Other net income was RMB0.7 million ($0.1 million) for the year ended June 30, 2023, compared to other net expenses of RMB0.1 million for the same period of 2022.

Net income (loss)

As a result of the factors described above, net loss was RMB61.5 million ($8.5 million) for the year ended June 30, 2023, an increase of RMB155.8 million ($21.5 million) from net income of RMB94.3 million for the same period of 2022.

Cash and short-term investment

As of June 30, 2023, we had cash in the amount of approximately RMB104.1 million ($14.4 million) and short-term investment in bank fixed income product of approximately RMB184.2 million ($25.4 million). As of June 30, 2022, we had cash in the amount of approximately RMB317.0 million ($47.3 million).

About Recon Technology, Ltd (“RCON”)

Recon Technology, Ltd (NASDAQ: RCON) is the People’s Republic of China’s first NASDAQ-listed non-state owned oil and gas field service company. Recon supplies China’s largest oil exploration companies, Sinopec (NYSE: SNP) and The China National Petroleum Corporation (“CNPC”), with advanced automated technologies, efficient gathering and transportation equipment and reservoir stimulation measure for increasing petroleum extraction levels, reducing impurities and lowering production costs. Through the years, RCON has taken leading positions within several segmented markets of the oil and gas filed service industry. RCON also has developed stable long-term cooperation relationship with its major clients. For additional information please visit: http://www.recon.cn/.

Forward-Looking Statements

Recon includes “forward-looking statements” within the meaning of the federal securities laws throughout this press release. A reader can identify forward-looking statements because they are not limited to historical fact or they use words such as “scheduled,” “may,” “will,” “could,” “should,” “would,” “expect,” “believe,” “anticipate,” “project,” “plan,” “estimate,” “forecast,” “goal,” “objective,” “committed,” “intend,” “continue,” or “will likely result,” and similar expressions that concern Recon’s strategy, plans, intentions or beliefs about future occurrences or results. Forward-looking statements are subject to risks, uncertainties and other factors that may change at any time and may cause actual results to differ materially from those that Recon expected. Many of these statements are derived from Recon’s operating budgets and forecasts, which are based on many detailed assumptions that Recon believes are reasonable, or are based on various assumptions about certain plans, activities or events which we expect will or may occur in the future. However, it is very difficult to predict the effect of known factors, and Recon cannot anticipate all factors that could affect actual results that may be important to an investor. All forward-looking information should be evaluated in the context of these risks, uncertainties and other factors, including those factors disclosed under “Risk Factors” in Recon’s most recent Annual Report on Form 20-F and any subsequent half-year financial filings on Form 6-K filed with the Securities and Exchange Commission. All forward-looking statements are qualified in their entirety by the cautionary statements that Recon makes from time to time in its SEC filings and public communications. Recon cannot assure the reader that it will realize the results or developments Recon anticipates, or, even if substantially realized, that they will result in the consequences or affect Recon or its operations in the way Recon expects. Forward-looking statements speak only as of the date made. Recon undertakes no obligation to update or revise any forward-looking statements to reflect events or circumstances arising after the date on which they were made, except as otherwise required by law. As a result of these risks and uncertainties, readers are cautioned not to place undue reliance on any forward-looking statements included herein or that may be made elsewhere from time to time by, or on behalf of, Recon.

RECON TECHNOLOGY, LTD

CONSOLIDATED BALANCE SHEETS

As of June 30

As of June 30

As of June 30

2022

2023

2023

RMB

RMB

U.S. Dollars

ASSETS

Current assets

Cash

¥

316,974,857

¥

104,125,800

$

14,359,604

Restricted cash

723,560

731,545

100,885

Short-term investments

184,184,455

25,400,198

Notes receivable

10,828,308

3,742,390

516,099

Accounts receivable, net

22,577,980

27,453,415

3,785,999

Inventories, net

3,894,369

6,330,701

873,044

Other receivables, net

5,501,833

2,185,733

301,427

Loans to third parties

50,383,822

123,055,874

16,970,181

Purchase advances, net

178,208

2,680,456

369,652

Contract costs, net

33,858,820

49,572,685

6,836,386

Prepaid expenses

420,284

350,119

48,284

Prepaid expenses- related parties

275,000

Total current assets

445,617,041

504,413,173

69,561,759

Property and equipment, net

25,474,162

24,752,864

3,413,576

Construction in progress

239,739

Intangible assets, net

5,950,000

Long-term other receivables, net

1,564,381

3,640

502

Goodwill

4,730,002

Operating lease right-of-use assets (including ¥765,241 and ¥335,976 ($46,333) from a related party as of June 30, 2022 and
2023, respectively)

6,666,759

2,654,900

366,127

Total Assets

¥

490,242,084

¥

531,824,577

$

73,341,964

LIABILITIES AND EQUITY

Current liabilities

Short-term bank loans

¥

10,000,000

¥

12,451,481

$

1,717,138

Accounts payable

16,739,989

10,791,721

1,488,246

Other payables

3,533,918

5,819,010

802,478

Other payable- related parties

2,240,135

2,592,395

357,508

Contract liabilities

2,001,277

2,748,365

379,017

Accrued payroll and employees’ welfare

2,250,547

2,382,516

328,564

Taxes payable

2,210,958

1,163,006

160,386

Short-term borrowings – related parties

9,009,156

20,018,222

2,760,639

Long-term borrowings – related party – current portion

999,530

Operating lease liabilities – current (including ¥429,265 and ¥335,976 ($46,333) from a related party as of June 30, 2022 and
2023, respectively)

3,892,774

3,066,146

422,841

Total Current Liabilities

52,878,284

61,032,862

8,416,817

Operating lease liabilities – non-current (including ¥335,976 and ¥nil ($nil) from a related party as of June 30, 2022 and 2023,
respectively)

2,184,635

25,144

3,468

Long-term borrowings – related party

5,511,076

Contract liabilities – non-current

106,000

Warrant liability

16,677,328

31,615,668

4,360,000

Total Liabilities

77,357,323

92,673,674

12,780,285

Commitments and Contingencies

Equity

Class A ordinary shares, $0.0925 U.S. dollar par value, 150,000,000 shares authorized; 29,700,718 shares and 40,528,218 shares
issued and outstanding as of June 30, 2022 and 2023, respectively

18,001,670

24,912,822

3,435,635

Class B ordinary shares, $0.0925 U.S. dollar par value, 20,000,000 shares authorized; 4,100,000 shares and 7,100,000 shares
issued and outstanding as of June 30, 2022 and 2023, respectively

2,408,498

4,340,731

598,614

Additional paid-in capital

496,038,696

551,118,133

76,002,666

Statutory reserve

4,148,929

4,148,929

572,163

Accumulated deficit

(111,273,525)

(170,440,826)

(23,504,865)

Accumulated other comprehensive income

11,307,461

35,127,173

4,844,259

Total shareholders’ equity

420,631,729

449,206,962

61,948,472

Non-controlling interests

(7,746,968)

(10,056,059)

(1,386,793)

Total equity

412,884,761

439,150,903

60,561,679

Total Liabilities and Equity

¥

490,242,084

¥

531,824,577

$

73,341,964

 *The accompanying notes are an integral part of these consolidated financial statements.

RECON TECHNOLOGY, LTD

CONSOLIDATED STATEMENTS OF OPERATIONS AND COMPREHENSIVE INCOME (LOSS)

For the years ended

June 30, 

2021

2022

2023

2023

RMB

RMB

RMB

USD

Revenue

Revenue – third parties

¥

47,852,918

¥

83,777,571

¥

67,114,378

$

9,255,496

Revenue – related party

85,657

Revenue

47,938,575

83,777,571

67,114,378

9,255,496

Cost of revenue

Cost of revenue – third parties

40,723,547

64,352,834

48,247,395

6,653,620

Cost of revenue

40,723,547

64,352,834

48,247,395

6,653,620

Gross profit

7,215,028

19,424,737

18,866,983

2,601,876

Selling and distribution expenses

8,038,965

10,150,802

10,638,978

1,467,182

General and administrative expenses

45,949,157

83,281,958

76,784,396

10,589,052

Allowance for (net recovery of) credit losses

8,191,247

(658,823)

(9,038,985)

(1,246,533)

Impairment loss of property and equipment and other long-lived assets

768,312

1,009,124

139,165

Research and development expenses

5,846,295

8,964,217

8,806,205

1,214,431

Operating expenses

68,793,976

101,738,154

88,199,718

12,163,297

Loss from operations

(61,578,948)

(82,313,417)

(69,332,735)

(9,561,421)

Other income (expenses)

Subsidy income

355,667

11,993

325,425

44,878

Interest income

918,629

5,367,979

13,603,487

1,876,007

Interest expense

(2,210,005)

(1,522,526)

(2,514,850)

(346,814)

Income (loss) from investment in unconsolidated entity

(266,707)

15,411

Gain in fair value changes of warrants liability

35,365,792

174,485,575

6,116,000

843,435

Remeasurement gain of previously held equity interests in connection with step acquisition

979,254

Foreign exchange transaction gain (loss)

(146,898)

(118,456)

241,652

33,325

Impairment loss on goodwill and intangible assets

(2,266,893)

(9,980,002)

(1,376,305)

Other income

192,137

15,855

82,970

11,442

Other income, net

35,187,869

175,988,938

7,874,682

1,085,968

Income (loss) before income tax

(26,391,079)

93,675,521

(61,458,053)

(8,475,453)

Income tax expenses (benefit)

(524,251)

(613,874)

18,339

2,529

Net income (loss)

(25,866,828)

94,289,395

(61,476,392)

(8,477,982)

Less: Net loss attributable to non-controlling interests

(3,034,094)

(1,297,400)

(2,309,091)

(318,438)

Net income (loss) attributable to Recon Technology, Ltd

¥

(22,832,734)

¥

95,586,795

¥

(59,167,301)

$

(8,159,544)

Comprehensive income (loss)

Net income (loss)

(25,866,828)

94,289,395

(61,476,392)

(8,477,982)

Foreign currency translation adjustment

(850,895)

9,332,625

23,819,712

3,284,889

Comprehensive income (loss)

(26,717,723)

103,622,020

(37,656,680)

(5,193,093)

Less: Comprehensive loss attributable to non- controlling interests

(3,034,094)

(1,297,400)

(2,309,091)

(318,438)

Comprehensive income (loss) attributable to Recon Technology, Ltd

¥

(23,683,629)

¥

104,919,420

¥

(35,347,589)

$

(4,874,655)

Earnings (loss) per share – basic and diluted

¥

(1.80)

¥

3.19

¥

(1.74)

$

(0.24)

Weighted – average shares -basic and diluted

12,697,024

30,002,452

33,923,112

33,923,112

*The accompanying notes are an integral part of these consolidated financial statements.

RECON TECHNOLOGY, LTD

CONSOLIDATED STATEMENTS OF CASH FLOWS

For the years ended June 30,

2021

2022

2023

2023

RMB

RMB

RMB

U.S. Dollars

Cash flows from operating activities:

Net income (loss)

¥

(25,866,828)

¥

94,289,395

¥

(61,476,393)

$

(8,477,982)

Adjustments to reconcile net income (loss) to net cash used in operating activities:

Depreciation and amortization

3,150,789

3,339,868

3,683,586

507,990

Loss (gain) from disposal of equipment

19,590

48,628

(12,782)

(1,763)

Gain in fair value changes of warrants liability

(35,365,792)

(174,485,575)

(6,116,000)

(843,435)

Amortization of offering cost of warrants

12,584,024

1,483,306

204,557

Allowance for (net recovery of) credit losses

8,191,247

(658,823)

(9,038,985)

(1,246,533)

Allowance for slow moving inventories

654,673

266,285

484,644

66,835

Impairment loss of property and equipment and other long-lived assets

768,312

1,009,124

139,165

Impairment loss on goodwill and intangible assets

2,266,893

9,980,002

1,376,305

Amortization of right of use assets

1,866,803

3,138,518

3,252,066

448,480

Restricted shares issued for management and employees

6,140,037

39,263,485

26,191,707

3,612,002

Restricted shares issued for services

8,935,919

7,306,822

1,007,657

Remeasurement gain of previously held equity interests in connection with step acquisition

(979,254)

Loss (income) from investment in unconsolidated entity

266,707

(15,411)

Deferred tax benefit

(425,913)

(624,087)

Interest expenses related to convertible notes

430,416

Accrued interest income from loans to third parties

(270,563)

(7,997,961)

(1,102,969)

Accrued interest income from short-term investment

(2,901,955)

(400,198)

Changes in operating assets and liabilities:

Notes receivable

(2,124,748)

(4,522,674)

7,085,918

977,193

Accounts receivable

18,326,410

3,811,866

(495,784)

(68,372)

Accounts receivable-related party

3,409,912

Inventories

(2,502,263)

(689,291)

(2,373,013)

(327,253)

Other receivables

(338,468)

285,786

(1,307,694)

(180,339)

Other receivables-related parties

(64,122)

(8,843)

Purchase advances

(899,371)

865,430

(2,575,198)

(355,136)

Contract costs

(21,944,876)

15,422,513

(14,236,539)

(1,963,309)

Prepaid expense

143,354

(274,215)

70,164

9,676

Prepaid expense – related parties

(433,000)

158,000

275,000

37,924

Operating lease liabilities

(2,762,949)

(1,594,702)

(3,061,303)

(422,173)

Accounts payable

(2,109,944)

(5,523,938)

(1,710,898)

(235,944)

Other payables

5,685,188

(6,329,042)

2,270,104

313,062

Other payables-related parties

(2,577,610)

969,468

352,260

48,579

Contract liabilities

4,160,456

(5,578,999)

641,087

88,410

Accrued payroll and employees’ welfare

(1,593,822)

296,065

131,971

18,200

Taxes payable

76,452

961,964

(1,036,483)

(142,938)

Net cash used in operating activities

(34,050,468)

(26,247,237)

(51,688,331)

(7,128,147)

Cash flows from investing activities:

Purchases of property and equipment

(522,416)

(692,206)

(940,673)

(129,725)

Proceeds from disposal of equipment

31,950

4,406

Repayments of loans to third parties

5,150,377

171,435,032

40,113,311

5,531,879

Payments made for loans to third parties

(51,638,458)

(171,071,510)

(103,146,761)

(14,224,589)

Payments for short-term investments

(290,051,964)

(39,999,995)

Redemption of short-term investments

108,769,464

14,999,995

Step acquisition of FGS, net of cash

471,843

Net cash used in investing activities

(46,538,654)

(328,684)

(245,224,673)

(33,818,029)

Cash flows from financing activities:

Proceeds from short-term bank loans

16,020,000

10,000,000

13,491,481

1,860,560

Repayments of short-term bank loans

(10,540,000)

(15,000,000)

(11,040,000)

(1,522,486)

Proceeds from short-term borrowings

3,660,000

Repayments of short-term borrowings

(3,360,000)

(530,000)

Proceeds from short-term borrowings-related parties

18,400,000

11,100,000

15,013,115

2,070,403

Repayments of short-term borrowings-related parties

(15,950,000)

(14,770,000)

(9,000,000)

(1,241,157)

Proceeds from long-term borrowings-related party

Repayments of long-term borrowings-related party

(816,952)

(892,701)

(1,499,667)

(206,813)

Proceeds from warrants issued with common stock

212,051,414

17,493,069

2,412,405

Proceeds from sale of ordinary shares, net of issuance costs

81,091,141

28,174,993

3,885,509

Proceeds from sale of prefunded warrants, net of issuance costs

30,276,569

93,321

3,750,282

517,188

Proceeds from stock issuance for warrants exercised

21,130,035

Proceeds from issuance of convertible notes

42,014,616

Refund of capital contribution by a non-controlling shareholder

Capital contribution by non-controlling shareholders

50,000

Net cash provided by (used in) financing activities

394,026,823

(9,999,380)

56,383,273

7,775,609

Effect of exchange rate fluctuation on cash and restricted cash

224,365

10,275,148

27,688,659

3,818,441

Net increase (decrease) in cash and restricted cash

313,662,066

(26,300,153)

(212,841,072)

(29,352,126)

Cash and restricted cash at beginning of year

30,336,504

343,998,570

317,698,417

43,812,615

Cash and restricted cash at end of year

¥

343,998,570

¥

317,698,417

¥

104,857,345

$

14,460,489

Supplemental cash flow information

Cash paid during the year for interest

¥

1,682,863

¥

1,427,174

¥

1,200,699

$

165,584

Cash paid during the year for taxes

¥

(98,338)

¥

10,214

¥

18,339

$

2,529

Reconciliation of cash and restricted cash, beginning of year

Cash  

¥

30,336,504

¥

343,998,570

¥

316,974,857

¥

43,712,832

Restricted cash

723,560

99,783

Cash and restricted cash, beginning of year

¥

30,336,504

¥

343,998,570

¥

317,698,417

$

43,812,615

Reconciliation of cash and restricted cash, end of year

Cash  

¥

343,998,570

¥

316,974,857

¥

104,125,800

¥

14,359,604

Restricted cash

723,560

731,545

100,885

Cash and restricted cash, end of year

¥

343,998,570

¥

317,698,417

¥

104,857,345

$

14,460,489

Non-cash investing and financing activities

Issuance of common stock in exchange of shares of FGS, net of issuance costs

¥

1,689,807

¥

¥

$

Cancellation of common stock issued prior years in exchange of shares of FGS , net of issuance costs

¥

(1,689,807)

¥

¥

$

Issuance of common stock in exchange of shares of Starry, net of issuance costs

27,675,450

¥

¥

$

Cancellation of shares issued to Starry Lab

¥

¥

(27,675,450)

¥

$

Conversion of convertible notes to 9,225,338 shares of ordinary shares

¥

42,435,669

¥

¥

$

Right-of-use assets obtained in exchange for operating lease obligations

¥

7,242,819

¥

937,672

¥

75,182

$

10,368

Reduction of right-of-use assets and operating lease obligations due to early termination of lease agreement

¥

¥

¥

62,357

$

10,368

Inventories transferred to and used as fixed assets

¥

302,795

¥

¥

(65,456)

$

8,599

Receivable for disposal of property and equipment

¥

¥

3,000

¥

$

(9,027)

Capital contribution receivable due from non-controlling Interest

¥

50,000,000

¥

¥

$

Other payable due to non-controlling interest converted into capital contribution

¥

¥

1,130,000

¥

$

*The accompanying notes are an integral part of these consolidated financial statements.

BRI’s Ultra-Micro Holding Continues Sustainable Financing for 36 Million Customers

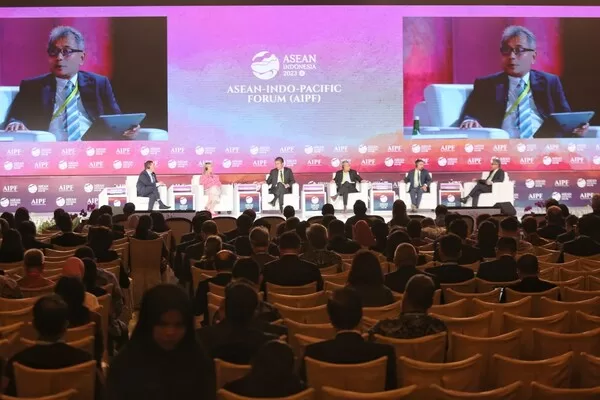
JAKARTA, Indonesia, Sept. 7, 2023 /PRNewswire/ — PT Bank Rakyat Indonesia (BRI) Persero Tbk. (IDX: BBRI), PT Pegadaian and PT Permodalan Nasional Madani (PNM) have been jointly advancing sustainable financing practices in Indonesia’s ultra-micro segment through the Ultra-Micro (UMi) Holding. This initiative aligns with the core themes of the ASEAN Indo-Pacific Forum (AIPF) on 5-6 September 2023, in Jakarta, Indonesia, with a focus on ESG (Environmental, Social and Governance) principles.

BRI's Ultra-Micro Holding Continues Sustainable Financing for 36 Million Customers
BRI’s Ultra-Micro Holding Continues Sustainable Financing for 36 Million Customers

Sunarso, BRI’s President Director, highlighted that Ultra Micro Holding (UMi) integrated over 36 million loan customers and 162 million micro-savings customers into its network, supported by 1,013 SENYUM (Ultra-Micro Service Centers) in Q2 2023. “BRI’s focus is to uplift business actors, embarking on a structured and systematic journey in a unified ecosystem.”

BRI’s approach to integrating the ultra-micro ecosystem involves three phases. First, they implement the “Empowering People” strategy led by PNM to educate ‘unbankable’ businesses. The “Integration” phase provides loan options to ultra-micro entrepreneurs through BRI and Pegadaian. Lastly, BRI concentrates on “Scaling-up Businesses,” enabling ultra-micro segments to transition to micro, micro to small, and small enterprises to medium size.

The UMi Holding has empowered 76 thousand financial advisors, comprising of agents from BRI and PNM Mekaar, and Pegadaian’s marketing personnel. BRI’s micro and ultra-micro credit have grown by 11.4%, reaching IDR 578 trillion. “We are employing a “Go Smaller” strategy to target even smaller segments with shorter and more digitally streamlined processes to meet their needs for a faster and cost-efficient approach,” added Sunarso.

To enhance financial inclusion, the UMi Holding introduces the SenyuM Mobile application to accelerate customer acquisition and serve as a unified digital hub for BRI, Pegadaian, and PNM.  The app has been adopted by over 69,000 individuals from the three entities and utilized by more than 300,000 BRILink and Pegadaian agents. To simplify operations and ensure security, the UMi Holding is spearheading a cashless ecosystem.

BRI also offers a digital banking super app, BRImo, enriched with over 100 features. BRImo’s user growth has exceeded 1 million users monthly. As of June 2023, the user base reached more than 27.8 million, marking a 50.6% Year-on-Year (YoY) increase. Additionally, the transaction value soared to IDR 1,377.6 trillion, reflecting an 89.6% YoY surge.

More information about BRI at www.bri.co.id.

ENTREPRENEUR UNIVERSE BRIGHT GROUP Announces 2023 Q2 Financial Results

XI’AN, China, Aug. 12, 2023 /PRNewswire/ — ENTREPRENEUR UNIVERSE BRIGHT GROUP (“EUBG” or the “Company”) (OTCQB: EUBG), a digital marketing consulting company, announced its unaudited financial results for the second quarter ended June 30, 2023.

Mr. Guolin Tao, CEO of Entrepreneur Universe Bright Group, commented, “Our business experienced a significant boost in revenue, with an increase of approximately 40.6% compared to the prior period. This phenomenal growth can be attributed to our top-notch consultation services which we provided to clients engaged in the live streaming business. Our team of experts offered invaluable insights and advice that helped our clients to improve their service delivery. We are proud to have played a significant role in this success story and look forward to continuing to provide exceptional services to our clients.”  

Second Quarter 2023 Unaudited Financial Results

Unaudited Condensed Consolidated Statement of Operations for the Three Months Ended June 30, 2023 And 2022

Three Months Ended June 30,

2023

2022

$

% of
Revenues

$

% of
Revenues

Revenues

$

1,705,942

100

%

$

840,868

100

%

Cost of revenues

(108,581)

(6)

%

(113,332)

(13)

%

Gross profit

1,597,361

94

%

727,536

87

%

Selling Expenses:

(5,279)

0

%

(8,319)

(1)

%

General and administrative expenses

(390,294)

(23)

%

(331,385)

(39)

%

Total other income (expenses), net

(55,476)

(3)

%

58,099

7

%

Income before income tax

1,146,312

67

%

445,931

53

%

Income tax expense

(455,865)

(27)

%

(180,081)

(21)

%

Net income

$

690,447

40

%

$

265,850

32

%

Revenue and cost of revenue: During the three months ended June 30, 2023, we generated revenue of $1,705,942, which represents an increase of $865,074 or 102.9% compared to the same period in the prior year. The increase was mainly contributed by our consultation services to a client engaged in live streaming business.

Cost of revenue for the three months ended June 30, 2023 was $108,581, which represented a slight decrease of $4,751 or 4.2% compared to the same period in the prior year.

As a result of the above, the gross profit was $1,597,361 for the three months ended June 30, 2023, which represented an increase of $869,825 or 119.6% as compared to the same period in the prior year. The increase in gross profit was primarily due to the increase in revenue as well as the decrease in cost of revenues, resulting in an increase in profit margin.

Selling expenses: During the three months ended June 30, 2023, we incurred $5,279 selling expenses, which represented a decrease of $3,040 or 36.5% as compared to the same period in the prior year. We maintained the selling expenses at a lower amount during the periods.

General and administrative expenses: During the three months ended June 30, 2023, we incurred $390,294 general and administrative expenses, which represented an increase of $58,909 or 17.8% as compared to the same period in the prior year. Our general and administrative expenses consisted mainly of audit fees, professional fees, payroll expenses and consultancy fees. The increase in general and administrative expenses was primarily due to an increase in audit fees related to the filing of a registration document during the period. Additionally, certain staff costs that were previously classified as selling expenses were reclassified as general and administrative expenses to better reflect their nature.

Total other income (expenses), net: During the three months ended June 30, 2023, we incurred net other expense of $55,476, which represented a difference of $113,575 or 195.5% as compared to the same period in the prior year. The difference was primarily attributable to exchange losses of US$74,178, which arose from the translation of certain foreign currency-denominated assets in our subsidiaries. Our net other income (expenses) mainly consisted of bank interest income, exchange rate differences and sundry income.

Income tax expense: During the three months ended June 30, 2023, we incurred income tax expense of $455,865, which represented an increase of $275,784 or 153.1% as compared to the same period in the prior year. The income tax expenses consisted of the Enterprise Income Tax charged in China and the withholding tax incurred in Hong Kong.

For the three months ended June 30, 2023, our income tax expenses comprised of current tax expenses and deferred tax expenses of $358,019 and $97,846, respectively, compared to current tax expenses and deferred tax expenses of $131,409 and $48,672 for the three months ended June 30, 2022.

Net income: As a result of the above, we generated a net income of $690,447 and $265,850 for the three months ended June 30, 2023 and 2022, respectively.

Cash and cash equivalents: As of June 30, 2023 and 2022, $8,059,731 and $7,193,591 of the Company’s cash and cash equivalents, respectively were held at financial institutions and online payment platforms located in the PRC and Hong Kong that management believes to be of high credit quality. 

Unaudited Condensed Consolidated Statement of Operations for the Six Months Ended June 30, 2023 And 2022 

Six Months Ended June 30,

2023

2022

$

% of
Revenues

$

% of
Revenues

Revenues

$

2,882,878

100

%

$

2,049,872

100

%

Cost of revenues

(223,135)

(8)

%

(425,811)

(21)

%

Gross profit

2,659,743

92

%

1,624,061

79

%

Selling Expenses:

(6,718)

0

%

(24,914)

(1)

%

General and administrative expenses

(813,796)

(28)

%

(642,673)

(31)

%

Total other income, net

30,813

1

%

159,921

8

%

Income before income tax

1,870,042

65

%

1,116,395

54

%

Income tax expense

(748,138)

(26)

%

(459,372)

(22)

%

Net income

$

1,121,904

39

%

$

657,023

32

%

Revenue and cost of revenue: During the six months ended June 30, 2023, we generated revenue of $2,882,878, which represents an increase of $833,006 or 40.6% compared to the same period in the prior year. The increase was mainly contributed by our consultation services to a client engaged in live streaming business.

Cost of revenue for the six months ended June 30, 2023 was $223,135, which represented a decrease of $202,676 or 47.6% compared to the same period in the prior year. The decrease in cost of revenue is mainly due to the absence of direct operating costs related to digital training services used in the current period. For the six months ended June 30, 2022, direct operating costs related to these services were $206,783.

As a result of the above, the gross profit was $2,659,743 for the six months ended June 30, 2023, which represented an increase of $1,035,682 or 63.8% as compared to the same period in the prior year. The increase in gross profit was primarily due to the increase in revenue, resulting in an increase in profit margin, and was further supported by the temporary suspension of digital training services that typically had lower profit margins. 

Selling expenses: During the six months ended June 30, 2023, we incurred $6,718 selling expenses, which represented a decrease of $18,196 or 73.0% as compared to the same period in the prior year. The decrease of selling expenses was mainly due to the tightening of entertainment policies and no staff costs incurred in selling activities during the current period.

General and administrative expenses: During the six months ended June 30, 2023, we incurred $813,796 general and administrative expenses, which represented an increase of $171,123 or 26.6% as compared to the same period in the prior year. Our general and administrative expenses consisted mainly of audit fees, professional fees, payroll expenses and consultancy fees. The increase in general and administrative expenses was primarily due to an increase in audit fees related to the filing of a registration document during the period. Additionally, certain staff costs that were previously classified as selling expenses were reclassified as general and administrative expenses to better reflect their nature.

Total other income, net: During the six months ended June 30, 2023, we recorded net other income of $30,813, which represented a decrease of $129,108 or 80.7% as compared to the same period in the prior year. The different was mainly due to certain sundry income generated in the prior year that did not recur in the current period, as well as exchange losses of US$53,630, which arose from the translation of certain foreign currency-denominated assets in our subsidiaries. Our net other income mainly consisted of bank interest income, exchange rate differences and sundry income.

Income tax expense: During the six months ended June 30, 2023, we incurred income tax expense of $748,138, which represented an increase of $288,766 or 62.9% as compared to the same period in the prior year. The income tax expenses consisted of the Enterprise Income Tax charged in China and the withholding tax incurred in Hong Kong.

For the six months ended June 30, 2023, our income tax expenses comprised of current tax expenses and deferred tax expenses of $573,420 and $174,718, respectively, compared to current tax expenses and deferred tax expenses of $335,479 and $123,893 for the six months ended June 30, 2022.

Net income: As a result of the above, we generated a net income of $1,121,904 and $657,023 for the six months ended June 30, 2023 and 2022, respectively.

About ENTREPRENEUR UNIVERSE BRIGHT GROUP

ENTREPRENEUR UNIVERSE BRIGHT GROUP is a digital marketing consultation company with its main operation in China, providing marketing consulting services to Chinese start-up companies. The company provides consulting services, sourcing and marketing services in China through its PRC subsidiary with support from its HK subsidiary. Its PRC subsidiary provides services aimed at connecting businesses with e-commerce platforms.  The integrated service platform focuses on strategic marketing and consulting. The company’s mission is to help start-up companies and small-size companies and guide these companies’ founders in utilizing the company’s digital marketing consulting plan to reach their business goals. For more information about the Company, please visit: http://www.eubggroup.com/

Safe Harbor Statement

This press release contains projections and “forward-looking statements” as defined by the Private Securities Litigation Reform Act of 1995 related to the Company’s business. Forward-looking statements include statements concerning plans, objectives, goals, strategies, future events or performance, and underlying assumptions and other statements that are other than statements of historical facts. When the Company uses words such as “may, “will, “intend,” “should,” “believe,” “expect,” “anticipate,” “project,” “estimate” or similar expressions that do not relate solely to historical matters, it is making forward-looking statements.  Forward-looking statements are not guarantees of future performance and involve risks and uncertainties that may cause the actual results to differ materially from the Company’s expectations discussed in the forward-looking statements. These statements are subject to uncertainties and risks including, but not limited to, the following:  the Company’s goals and strategies; the Company’s future business development; financial condition and results of operations; product and service demand and acceptance; reputation and brand; the impact of competition and pricing; changes in technology; government regulations; fluctuations in general economic and business conditions in China and assumptions underlying or related to any of the foregoing and other risks contained in reports filed by the Company with the SEC.  For these reasons, among others, investors are cautioned not to place undue reliance upon any forward-looking statements in this press release. Additional factors are discussed in the Company’s filings with the SEC, which are available for review at www.sec.gov. The Company undertakes no obligation to publicly revise these forward‐looking statements to reflect events or circumstances that arise after the date hereof.

For more information, please contact:

The Company:
Jianyong Li
Email: lijianyong@eubggroup.com
Phone: +86-(029) 86100263

Investor Relations:
Tina Li
EverGreen Consulting Inc.
Email: IR@changqingconsulting.com
Mobile: +86-13721971703 (from China)
+1-281-250-4349 (from U.S.)

ENTREPRENEUR UNIVERSE BRIGHT GROUP 

CONDENSED CONSOLIDATED BALANCE SHEETS

AS OF JUNE 30, 2023 AND DECEMBER 31, 2022

(UNAUDITED)

(In U.S. dollars except for number of shares)

June 30,
2023

December 31,
2022

ASSETS

CURRENT ASSETS

Cash and cash equivalents

$

8,059,731

$

7,193,591

Accounts receivable

421,736

234,978

Other receivables and prepayments

58,052

73,069

Total current assets

8,539,519

7,501,638

NON-CURRENT ASSETS

Plant and equipment, net

142,943

188,889

Operating lease right-of-use assets, net

53,310

83,077

Total non-current assets

196,253

271,966

TOTAL ASSETS

$

8,735,772

$

7,773,604

LIABILITIES AND STOCKHOLDERS’ EQUITY

CURRENT LIABILITIES

Other payables and accrued liabilities

$

197,457

$

369,727

Other payables and accrued liabilities – related party

3,902

Receipt in advance

1,710

Operating lease liabilities, current

53,310

54,705

Tax payables

363,685

94,758

Amount due to a director

3,496

167,936

Total current liabilities

621,850

688,836

NON-CURRENT LIABILITY

Deferred tax liabilities

200,639

172,196

Operating lease liabilities, non-current

28,372

Total non-current liabilities

200,639

200,568

TOTAL LIABILITIES

822,489

889,404

COMMITMENTS AND CONTINGENCIES

STOCKHOLDERS’ EQUITY

Preferred stock, par value $0.0001 per share, 1,100,000 shares authorized, Nil (December 31, 2022:
   Nil) shares issued and outstanding as of June 30, 2023

Common stock, par value $0.0001 per share; 1,800,000,000 shares authorized, 1,701,181,423
   (December 31, 2022: 1,701,181,423) shares issued and outstanding as of June 30, 2023

170,118

170,118

Additional paid-in capital

6,453,048

6,453,048

Statutory reserves

65,911

65,911

Retained earnings

1,169,119

47,215

Accumulated other comprehensive income

55,087

147,908

Total stockholders’ equity

7,913,283

6,884,200

TOTAL LIABILITIES AND STOCKHOLDERS’ EQUITY

$

8,735,772

$

7,773,604

ENTREPRENEUR UNIVERSE BRIGHT GROUP

CONDENSED CONSOLIDATED STATEMENTS OF OPERATIONS AND COMPREHENSIVE INCOME

FOR THE THREE AND SIX MONTHS ENDED JUNE 30, 2023 AND 2022

(UNAUDITED)

(In U.S. dollars except for number of shares)

For the three months ended
June 30,

For the six months ended
June 30,

2023

2022

2023

2022

Revenue

1,705,942

840,868

$

2,882,878

$

2,049,872

Cost of revenue

(108,581)

(113,332)

(223,135)

(425,811)

Gross profit

1,597,361

727,536

2,659,743

1,624,061

Selling expenses

(5,279)

(8,319)

(6,718)

(24,914)

General and administrative expenses

(390,294)

(331,385)

(813,796)

(642,673)

Profit from operations

1,201,788

387,832

1,839,229

956,474

Other income (expenses):

Interest income

10,764

12,637

18,500

22,967

Exchange gain (loss)

(74,178)

27,862

(53,630)

27,922

Sundry income

7,938

17,600

65,943

109,032

Total other income(expenses), net

(55,476)

58,099

30,813

159,921

Income before income tax

1,146,312

445,931

1,870,042

1,116,395

Income tax expense

(455,865)

(180,081)

(748,138)

(459,372)

Net income

$

690,447

265,850

$

1,121,904

$

657,023

Other comprehensive loss

Foreign currency translation adjustment

(77,327)

(231,781)

(92,821)

(236,916)

Total comprehensive income

$

613,120

34,069

$

1,029,083

$

420,107

Net income per share – Basic and diluted

$

0.00

*

0.00

*

$

0.00

*

$

0.00

*

Weighted average number of common shares outstanding

– Basic and Diluted

1,701,181,423

1,701,181,423

1,701,181,423

1,701,181,423

*

Less than $0.01 per share

ENTREPRENEUR UNIVERSE BRIGHT GROUP

CONDENSED CONSOLIDATED STATEMENT OF CASH FLOWS

FOR THE THREE AND SIX MONTHS ENDED JUNE 30, 2023 AND 2022

(UNAUDITED)

(In U.S. dollars)

For the six months ended
June 30,

2023

2022

Cash flows from operating activities

Net income

$

1,121,904

$

657,023

Adjustments to reconcile net income to cash used in operating activities:

Depreciation

40,298

42,322

Amortization of operating lease right-of-use assets

26,907

27,395

Deferred tax

28,230

123,894

Changes in operating assets and liabilities:

Other receivables and prepayments

12,259

19,049

Accounts receivable

(207,645)

(213,535)

Accounts payable

(113,645)

Other payables and accrued liabilities

(160,301)

(170,904)

Tax payables

286,498

125,057

Contract liabilities

(212,060)

Receipt in advance

(1,703)

(5,064)

Operating lease liabilities

(26,908)

(27,395)

Net cash generated from operating activities

1,119,539

252,137

Cash flows used in investing activities

Purchase of property, plant and equipment

(1,877)

(8,381)

Cash flows used in financing activities

Repayment to a director

(164,441)

Effect of exchange rates on cash

(87,081)

(255,625)

Net increase (decrease) in cash and cash equivalents

866,140

(11,869)

Cash and cash equivalents at beginning of period

7,193,591

7,649,129

Cash and cash equivalents at end of period

$

8,059,731

$

7,637,260

Supplemental cash flow information

Cash paid during the period for:

Income taxes

$

286,922

$

224,055

Boqii to Hold Extraordinary General Meeting on September 11, 2023

SHANGHAI, Aug. 5, 2023 /PRNewswire/ — Boqii Holding Limited (“Boqii” or the “Company“) (NYSE: BQ), a leading pet-focused platform in China, today announced that it will hold an extraordinary general meeting (the “EGM“) on Monday, September 11, 2023 at 3:00 p.m. (China Time) / 3:00 a.m. (Eastern Time) at the offices of Building 9, No. 388, Shengrong Road, Pudong New District, Shanghai, People’s Republic of China, 201210.

The board of directors of the Company has fixed the close of business on August 14, 2023 (Eastern Time), as the record date (the “Record Date“) for determining the shareholders entitled to receive notice and to attend and vote at the EGM or any adjourned or postponed meeting thereof pursuant to the memorandum and articles of association of the Company currently in effect. Holders of record of the Company’s Class A ordinary shares or Class B ordinary shares at the close of business on the Record Date are entitled to notice of, to attend and vote at, the EGM or any adjournment or postponement thereof. Holders of the Company’s American Depositary Shares (the “ADSs“) who wish to exercise their voting rights for the underlying Class A ordinary shares must act directly through the depositary of the Company’s ADS program, The Bank of New York Mellon (the “Depositary“), if the ADSs are held by holders on the books and records of the Depositary or indirectly through a bank, brokerage or other securities intermediary if the ADSs are held by any of them on behalf of holders. The resolutions put to the vote at the EGM will be decided by poll.

The notice of the EGM, which sets forth the resolutions to be submitted to shareholder approval at the meeting, is available on the Company’s website at http://ir.boqii.com.

The Company expects to continue implementing additional further funding options, including issuances of equity securities, in the foreseeable future, to optimize its business and seize opportunities to grow and to create greater value for shareholders.

About Boqii Holding Limited

Boqii Holding Limited (NYSE: BQ) is a leading pet-focused platform in China. We are the leading online destination for pet products and supplies in China with our broad selection of high-quality products including global leading brands, local emerging brands, and our own private label, Yoken, Mocare and D-cat, offered at competitive prices. Our online sales platforms, including Boqii Mall and our flagship stores on third-party e-commerce platforms, provide customers with convenient access to a wide selection of high-quality pet products and an engaging and personalized shopping experience. Our Boqii Community provides an informative and interactive content platform for users to share their knowledge and love for pets.

Safe Harbor Statement

This press release contains forward-looking statements. These statements are made under the “safe harbor” provisions of the U.S. Private Securities Litigation Reform Act of 1995. Statements that are not historical facts, including statements about the Company’s beliefs and expectations, are forward-looking statements. Forward-looking statements involve inherent risks and uncertainties, and a number of factors could cause actual results to differ materially from those contained in any forward-looking statement. In some cases, forward-looking statements can be identified by words or phrases such as “may,” “will,” “expect,” “anticipate,” “target,” “aim,” “estimate,” “intend,” “plan,” “believe,” “potential,” “continue,” “is/are likely to” or other similar expressions. The Company may also make written or oral forward-looking statements in its reports filed with, or furnished to, the U.S. Securities and Exchange Commission, in its annual reports to shareholders, in press releases and other written materials and in oral statements made by its officers, directors or employees to third parties. Further information regarding such risks, uncertainties or factors is included in the Company’s filings with the SEC. All information provided in this press release is as of the date of this press release, and the Company does not undertake any duty to update such information, except as required under applicable law. 

For investor and media inquiries, please contact: 

Boqii Holding Limited
Investor Relations
Tel: +86-21-6882-6051
Email: ir@boqii.com

DLK Advisory Limited
Tel: +852-2857-7101
Email: ir@dlkadvisory.com

WeTrade Group Inc. Reports Fiscal Year 2022 Financial Results

BEIJING, July 15, 2023 /PRNewswire/ — WeTrade Group Inc. (“WeTrade” or the “Company”) (NASDAQ: WETG), a global diversified “software as a service” (“SaaS”) technology service provider committed to providing technical support and digital transformation tools for enterprises across different industries, today reports its financial results for fiscal year 2022, ended December 31, 2022.

Mr. Hechun Wei, Chief Executive Officer of Wetrade, commented: “2022 is a year of rapid growth for us. The expansion of our diversified business and the steady growth of customer base are laying a strong foundation for our long-term development. We are confident in restoring the growth of our revenue and operating profits in the near future. In 2023, we will seize the cross-border business development opportunities after the reopening of the border and achieve further milestones.  WTPay will be the major drive of the Company’s growth and will help the Company expand its business. Meanwhile, as we are seeing the explosive growth of generative AI in 2023, we are convinced that this is a breakthrough innovation and technological revolution, which will attract new talents and like-minded organizations. In 2023, we will focus on AI intelligence, restoring growth, and maximizing the potential of AIGC .”

Ms. Annie Huang, Chief Financial Officer of Wetrade, commented: “In 2022, we mainly focused on the development of multi-sector businesses. We believe the temporary decline in our revenues is a tradeoff in building the foundation for a steady future. We will continue to optimize our strategic development plan in a timely and effective manner, focusing on developing the Company’s core businesses to ensure the Company’s financial resilience.”

Fiscal Year 2022 Financial Results

For the year
ended
December
31,

2022

For the year
ended
December
31,

2021

Revenue:

Service revenue, non-related party

$

10,803,232

$

9,734,966

Service revenue, related party

868,103

4,646,329

11,671,335

14,381,295

Cost of Revenue

(9,695,290)

(2,681,939)

Gross Profit

1,976,045

11,699,356

Operating Expenses:

General and Administrative

(11,843,048)

(5,705,063)

Operations Profit

(9,867,003)

5,994,293

Other income

636,934

303,665

Income before income tax

(9,230,069)

6,297,958

Income tax income/ (expenses)

82,654

(1,122,283)

Net (Loss)/ Income

$

(9,147,415)

$

5,175,675

Revenue from Operations

For the fiscal year ended December 31, 2022 and 2021, total revenue was $11,671,335 and $14,381,295, respectively. The decrease was mainly due to the decrease in Gross Merchandise Volume (“GMV”) in Ycloud system under the outbreak of the coronavirus disease during the year. Service revenue from third party were $10,803,232 (2021: $9,734,966) and service revenue from related party were $868,103 (2021: $4,646,329) for the year ended December 31, 2022. The system services fees are collected through from end users of YCloud system based on the GMV as follow:

Gross Merchandise Volume (“GMV”)

2022

2021

US$

 US$

Non-related party

327,183,593

292,177,817

Related party

26,291,122

139,359,179

Total:

353,474,715

431,536,996

Cost of revenue

Cost of revenue is mainly consists of staff payroll, PRC central provident fund (“CPF”) and other staff benefits, the increase is mainly due to more technical development service costs were incurred for the system development during the year. 

General and Administrative Expenses

For the fiscal year ended December 31, 2022 and 2021, general and administrative expenses were $11,843,048 and 5,705,063, respectively. The increase is mainly due to increase is mainly due to professional fee, fund raising costs, financial PR and underwriting fees were incurred for the Nasdaq up-listing during the year.

Net Income/ (loss)

As a result of the factors described above, there was a net loss of $9,147,415 and net income of $5,175,675 for the fiscal year ended December 31, 2022 and 2021, respectively, the increase in loss is mainly due to decrease in revenue and more expenses were incurred for system development and professional fee incurred for Nasdaq up-listing during the year.

2022

2021

Cash and Cash equivalents

$

20,025,495

$

616,593

Receivables

7,377,801

9,230,865

Loan receivable

1,614,841

3,798,130

Other receivables, deposit and prepayments

15,366,488

3,062,868

Property and equipment, net

992,445

395,353

Amortised expenses, net

828,983

Intangible asset

23,188

37,765

Right of use assets

2,328,950

Total assets

$

46,229,241

$

19,470,524

Account payable and accrued expenses

723,648

279,219

Tax payable

128,979

711,841

Lease liability

2,538,340

Amount due to related parties

1,291,296

1,105,532

Other liabilities

2,365,808

306,270

Total liabilities

$

4,509,731

$

4,941,202

Total stockholders’ equity

$

41,719,510

14,529,322

As of December 31, 2022, we had total assets of $46,229,241, which mainly consisted of $20,025,495 in cash, $8,992,642 in receivables and loan receivables, $1,821,428 in amortised expenses, property and equipment, and $15,366,488 in other receivables, deposit and prepayments; we had total liabilities of $4,509,731 which consisted of $723,648 in accounts payables & accrued expenses, $1,291,296 in amount due to related parties and $2,365,808 in other liabilities; we had total stockholders’ equity of $41,719,510.

Operating activities

Our continuing cash flow used in operating activities is $17,608,419 for the fiscal years ended December 31, 2022 as compare to the cash flow provided by operating activities of $3,753,384 in prior year, which was increased by approximately of $14.1 million. The increase were mainly due to prepayment of WT Pay System and payment of professional fees in relation to the Nasdaq up-listing.

Investing activities

Our continuing cash flow provided by investing activities is $493,954 for the fiscal years ended December 31, 2022 as compare to the cash flow used in investing activities of $1,028,322 in prior year. The increase was mainly due to loan repayment receipts of $2.1 million and which were partially offset by the addition of property and equipment of $1.5 million during the year.

Financing activities

Cash provided by our financing activities was $37,720,440 for the year ended December 31, 2022 as compare to the net cash provided by financing activities of $689,031, which was increased by approximately of $37.1 million. The increase is mainly due to 10,000,000 share issuance with the net proceeds from sales of common stock in the amount of $37,534,676 during the year.

About WeTrade Group Inc.

WeTrade Group Inc. is a global diversified “software as a service” (“SaaS”) technology service provider which is committed to providing technical support and digital transformation tools for enterprises across different industries. The four business segments of WeTrade Group are YCloud, WTPay,Y-Health and YG.

YCloud is a micro-business cloud intelligent system launched by WeTrade, serving global micro-business industry. YCloud strengthens users’ marketing relationship and CPS commission profit management through leading technology and big data analysis. It also helps increase the payment scenarios to increase customers’ revenue by multi-channel data statistics, AI fission and management as well as improved supply chain system.

Independently developed by the Company, WTPay supports multiple methods of online payment and eight mainstream digital wallets in over 100 countries to help customers quickly realize global collection and payment business.

Y-Health is the sector focusing on public health business, which engages in developing global business for biological health and medical enterprises. Currently, Y-Health mainly focuses on detection and prevention of epidemic, daily healthcare, traditional Chinese medicines, and others.

YG is the new energy business segment which mainly provides tools and technical support for the digital new energy industry in the Middle East and Central Asia.

For more information, please visit https://ir.wetg.group.

Forward-Looking Statements

This press release contains information about the Company’s view of its future expectations, plans and prospects that constitute forward-looking statements. Actual results may differ materially from historical results or those indicated by these forward-looking statements as a result of a variety of factors including, but not limited to, risks and uncertainties associated with its ability to raise additional funding, its ability to maintain and grow its business, variability of operating results, its ability to maintain and enhance its brand, its development and introduction of new products and services, the successful integration of acquired companies, technologies and assets into its portfolio of products and services, marketing and other business development initiatives, competition in the industry, general government regulation, economic conditions, dependence on key personnel, the ability to attract, hire and retain personnel who possess the technical skills and experience necessary to meet the requirements of its clients, and its ability to protect its intellectual property. The Company’s encourages you to review other factors that may affect its future results in the Company’s annual reports and in its other filings with the Securities and Exchange Commission.

MediaTek Diversifies Mobile Offerings with Dimensity 6000 Series for Mainstream 5G Devices

The new Dimensity 6100+ chipset makes advanced 5G connectivity more accessible while offering improved features

HSINCHU, July 11, 2023 /PRNewswire/ — MediaTek today officially launched its new Dimensity 6000 series along with a chipset designed to enhance the next generation of mainstream 5G devices. The Dimensity 6100+ SoC delivers premium features—including exceptional power efficiency, vivid displays, high frame rates, AI-powered camera technologies, leading low power consumption, and reliable Sub-6 5G connectivity—at an accessible price point.

“As developing markets continue rolling out 5G networks at a rapid pace and operators in developed markets work to finish transitioning consumers from 4G LTE to 5G, there has never been a more vital need for chipsets that cater to the growing number of mainstream mobile devices that feature next-generation connectivity,” said CH Chen, Deputy General Manager of MediaTek’s Wireless Communications Business Unit. “The MediaTek Dimensity 6000 series makes it possible for device makers to stay ahead of the curve with impressive upgrades that boost performance, increase power efficiency and reduce material costs.”

The Dimensity 6100+ integrates an enhanced 5G modem supporting 3GPP Release 16 standard with up to 140MHz 2CC 5G Carrier Aggregation, significantly reducing power consumption contributed by MediaTek UltraSave 3.0+ technology. This chip features two Arm Cortex-A76 big cores and six Arm Cortex-A55 efficiency cores, offering notable enhancements, including support for AI-powered cameras, 10-bit displays, outstanding UX and GPU performance, and rich peripheral features.

Other key features of the Dimensity 6100+ chipset include:

  • Up to 108MP Non-ZSL camera support.
  • Up to 2K 30fps video capture.
  • UltraSave 3.0+ technology offers 20% reduced 5G power consumption compared to competitive solutions.
  • Powerful camera features including AI-bokeh for stunning portraits and selfies; working with Arcsoft, MediaTek is also bringing AI-color technology to mainstream devices so users can showcase their creativity.
  • Premium 10-bit display support: Reproduces more than one billion colors for vibrant images and videos, along with support for 90Hz to 120Hz frame rates for a smooth user experience.

MediaTek’s broad 5G portfolio expands across different price tiers to make great mobile experiences more accessible. The Dimensity 9000 series is designed for flagship smartphones and tablets; the Dimensity 8000 family is geared for premium mobile devices; and the Dimensity 7000 lineup expands the company’s range of high-tech devices. The new Dimensity 6000 series will now democratize higher-end features to mainstream 5G devices.

The first smartphones featuring the Dimensity 6100+ chipset will be available in the third quarter of 2023.

To learn more about MediaTek’s mobile platform, please visit: https://i.mediatek.com/mediatek-5g.

About MediaTek Inc.

MediaTek Incorporated (TWSE: 2454) is a global fabless semiconductor company that enables nearly 2 billion connected devices a year. We are a market leader in developing innovative systems-on-chip (SoC) for mobile, home entertainment, connectivity and IoT products. Our dedication to innovation has positioned us as a driving market force in several key technology areas, including highly power-efficient mobile technologies, automotive solutions and a broad range of advanced multimedia products such as smartphones, tablets, digital televisions, 5G, Voice Assistant Devices (VAD) and wearables. MediaTek empowers and inspires people to expand their horizons and achieve their goals through smart technology, more easily and efficiently than ever before. We work with the brands you love to make great technology accessible to everyone, and it drives everything we do. Visit www.mediatek.com for more information. 

MediaTek Press Office:

PR@mediatek.com
Kevin Keating, MediaTek
+1- 206-321-7295
10188 Telesis Ct #500, San Diego, CA 92121, USA

Source: MediaTek Inc.

Conversion of shares in AB Electrolux

STOCKHOLM, April 28, 2023 /PRNewswire/ — According to AB Electrolux articles of association, owners of Series A shares are entitled to request that such shares are converted to Series B shares. Conversion reduces the total number of votes in the company.

During April 2023, 180 Series A shares were at the request of shareholders converted to Series B shares, following which the total number of votes amounts to 35,680,690.5.

The total number of registered shares in the company amounts to 283,077,393 shares, of which 8,192,168 are Series A shares and 274,885,225 are Series B shares.

CONTACT:

For further information, please contact Electrolux Group Press Hotline, +46 8 657 65 07.

The following files are available for download:

The INX Digital Company Reports Q4 2022 Update and Annual Financial Results

TORONTO, April 1, 2023 /PRNewswire/ — The INX Digital Company, Inc. (NEO: INXD, OTCQB: INXDF, INXATS: INX) (the “Company” or “INX”), the owner of INX.One, security token and digital asset trading platform, a U.S. broker-dealer and an inter-dealer broker (through its subsidiaries), announced annual financial results as of December 31, 2022.

Investment gains/losses for any particular period are not indicative of quarterly business performance. Earnings of The INX Digital Company, Inc. for the third quarter of 2022 are summarized below.

2022 Annual Financial Highlights:

  • Cash and cash equivalents of $20M plus an additional $9.7M invested in short and mid-term duration U.S. treasury securities and investment-grade corporate bonds.
  • Working capital of $26M.
  • Reserve Fund set aside for the protection of customer funds and maintained in addition to operating funds at $36.0M.
  • 2022 revenue at $4.3M year, primarily from transaction fees, an increase in total revenue of 77 percent compared to 2021.
  • 2022 net loss from operations of $16M.

INX reports an annual net income of $208M ($1.02 EPS), which includes an unrealized gain on the INX Tokens issued of $226M and INX Token warrants of $8.3M. Under relevant accounting standards, INX Token and token warrants issued are recognized as a liability on the company’s balance sheet. The company’s adjusted net loss for 2022, excluding INX Token and token warrant liability, is $26M. The adjusted net loss is a non-IFRS measure.

Noteworthy steps and milestones in 2022 are expected to lead the company forward

During 2022, the company has taken significant actions to put in place innovative technology that allow the pioneering of a new and responsible digital economy. Management focused on forging new and strategic global partnerships and advancing multiple initiatives to expand the company’s services, promote brand recognition and drive future revenues.

The company reached a major milestone when it launched INX.One, the world’s first fully regulated platform integrating cryptocurrency and SEC-registered security token trading, investment opportunities in primary security token offerings, and related capital raise services under a single platform available 24/7 to retail and institutional investors in the U.S. and globally. INX.One is integrated with multiple public blockchains through INX proprietary technology and is intended to be blockchain agnostic.

INX’s main focus remains on creating a go-to holistic solution for founders and corporate partners to raise capital utilizing SEC-regulated security tokens.

Taking advantage of the path created by the issuance of the INX Token, since the third quarter of 2022 and to date, INX has launched its capital raise services and brought four (4) primary offerings to market, which are available for investment exclusively on INX.One.

It includes Trucpal, a digital financial and tax software company for logistics-industry-based in China; Advent Entertainment, an entertainment, gaming, and virtual reality company based in Utah, US; Treasure Experience, a virtual marine exploration and treasure hunting company based in Florida, US; and TurnCoin, digital trading cards in talented individuals trading platform company, based in Gibraltar.  After the completion of the primary raises, security tokens in these entities and projects will be listed on INX.One for trading in the secondary market. 

In addition, during 2022, the Millennium Sapphire (“MSTO”) Token was also added for secondary market trading on INX.One. Token holders are entitled to receive dividends from Millennium’s NFT Studio.

Within the cryptocurrency offering, the company offers select digital assets and stablecoins for trading, investing, and funding of accounts. Moreover, the company continues to expand its money transmitter licenses and registrations, allowing the company to offer cryptocurrencies in 43 U.S. states and territories. INX.One also continues to expand its offering to over 160 countries globally.

The company continues to lead in providing solid, sustainable solutions for the future, a critical, much-required effort in today’s climate.

In December 2022, the company announced a strategic partnership with SICPA, a global leader in authentication, revenue realization, and secure traceability solutions, to help governments develop innovative and sovereign central bank digital currency ecosystems. The joint venture, incorporated in Switzerland, combines both blockchain-based infrastructure and digital cash technologies to address the key requirements for Central Bank Digital Currencies, including privacy, security, financial inclusion, resilience, and more – paving the way for the development and launch of a secure and scalable environment for all central banks to deploy digital currencies.

As INX predicted, security tokens are beginning to transform the ownership and trading of assets. The company is geared to provide a secure alternative in its multiple uses, such as recovery security tokens, digital bonds, and tokenized shares. As the market for security tokens continues to grow and rapidly expand across multiple blockchains, the company put efforts and resources into educating people worldwide to provide the required clarity of the new standard.

To execute the long-term vision, during 2022, the company strengthened its senior global leadership by filling a key role within the company, the Chief Financial Officer, who plays a strategic role in advancing the company’s vision and navigating the current market and regulatory environment. The company also expanded its Board of Directors to include two global financial leaders, who themselves made the transition from the traditional to the digital economy and will therefore guide and assist in promoting INX’s mission.

INX CEO Shy Datika: We invest in a solid and secure democratization of finance.
Five years ago, we chose what we knew was right for our future customers—the path that would keep them safe while providing them with a wealth of opportunities.
We knew it would be a bumpy ride and came prepared to realize our forward-looking vision.
The INX way, yet again, proved to be the right one. As industry giants are challenged by regulators, we have armed ourselves with regulations. As investors become more aware and more concerned with the pitfalls of unregulated trading platforms, we can provide a secure and safe harbor. INX puts customers first! We have a fully audited and segregated cash reserve fund as described in our INX Token F-1 prospectus. We maintain 1:1 balances for customers and do not use customer assets. We do not, in any way, shape, or form, leverage or re-invest customer assets. On our INX Securities ATS, customers get full transparency as they control their assets, their keys, and their wallets. We will continue developing new services and technologies to further expand opportunities while keeping our clients safe.

About INX:

INX provides a regulated trading platform for digital securities and cryptocurrencies.  With the combination of traditional markets expertise and a disruptive fintech approach, INX provides state-of-the-art solutions to modern financial problems. INX is led by an experienced and dedicated team of business, finance, and technology veterans with the shared vision of redefining the world of capital markets via blockchain technology and innovative regulatory approach.

About The INX Digital Company, Inc. INX is the holding company for the INX Group, which includes regulated trading platforms for digital securities and cryptocurrencies, combining traditional markets expertise and an innovative fintech approach. The INX Group’s vision is to be the preferred global regulated hub for digital assets on the blockchain. The INX Group’s overall mission is to bring communities together and empower them with financial innovation. Our journey started with our initial public token offering of the INX Token, in which we raised US$84 million.
The INX Group is shaping the blockchain asset industry through its willingness to work in a regulated environment with oversight from regulators like the SEC and FINRA.

In addition to operating a regulated trading platform for blockchain assets, INX’s interdealer broker, I.L.S. Brokers, plans to offer non-deliverable cryptocurrency forwards to Tier-1 banks in the future. For more information, please visit the INX Group website here.

Cautionary Note Regarding Forward-Looking Information and Other Disclosures

This press release contains statements that constitute “forward-looking information” (“forward-looking information”) within the meaning of the applicable Canadian securities legislation. All statements, other than statements of historical fact, are forward-looking information and are based on expectations, estimates, and projections as at the date of this news release. Any statement that discusses predictions, expectations, beliefs, plans, projections, objectives, assumptions, future events or performance (often but not always using phrases such as “expects”, or “does not expect”, “is expected”, “anticipates” or “does not anticipate”, “plans”, “budget”, “scheduled”, “forecasts”, “estimates”, “believes” or “intends” or variations of such words and phrases or stating that certain actions, events or results “may” or “could”, “would”, “might” or “will” be taken to occur or be achieved) are not statements of historical fact and may be forward-looking information. In disclosing the forward-looking information contained in this press release, INX has made certain assumptions, including with respect to, the continuous development of the INX trading platform, the offering of non-deliverable cryptocurrency forwards, and the development of the digital asset industry. Although INX believes that the expectations reflected in such forward-looking information are reasonable, it can give no assurance that the expectations of any forward-looking information will prove to be correct. Known and unknown risks, uncertainties, and other factors which may cause the actual results and future events to differ materially from those expressed or implied by such forward-looking information. Such factors include but are not limited to regulatory developments, the state of the digital securities and cryptocurrencies markets, and general economic conditions. Accordingly, readers should not place undue reliance on the forward-looking information contained in this press release. Except as required by law, INX disclaims any intention and assumes no obligation to update or revise any forward-looking information to reflect actual results, whether as a result of new information, future events, changes in assumptions, changes in factors affecting such forward-looking information, or otherwise.

The NEO Exchange is not responsible for the adequacy or accuracy of this press release.‍

This news release does not constitute an offer to sell or a solicitation of an offer to buy any of the securities in the United States. The securities have not been and will not be registered under the U.S. Securities Act or any state securities laws and may not be offered or sold within the United States or to U.S. Persons unless registered under the U.S. Securities Act and applicable state securities laws or an exemption from such registration is available.‍

For further information, contact:
The INX Digital Company, Inc.
Investor Relations
+1 855 657 2314
Email: investorrelations@inx.co

For more information, contact:
Liz Whelan
liz@lwprconsulting.com
(312) 315-0160

Source: The INX Digital Company, Inc.