Tag Archives: ITE

Huawei Cloud in Token2049: Fueling Web3 Advances with Key Breakthroughs

SINGAPORE, Sept. 13, 2023 /PRNewswire/ — From September 11 to 12, Huawei Cloud showcased staking node engine, confidential computing, and ZK rollup at Token2049 in Singapore. In this event, Huawei Cloud discussed the future of the Web3 industry with top vendors, builders, and developers, and stated its commitment to accelerating Web3 innovation with technical breakthroughs.

Node Creation in Seconds, 99% Staking Effectiveness: A New Engine for Web3

Web3 is in the early stage of development and faces many technical challenges regarding performance and security of transactions on chains. On September 12, in the MetaEra Summit, Zhang Ziyi, Chief Architect of Huawei Cloud Blockchain, introduced Huawei Cloud’s Ethereum staking node hosting service. With innovative algorithms, this service achieves up to 99% staking effectiveness and higher rewards. QingTian Enclave security framework supports environment and identity authentication and full-link data encryption and decryption. With this security framework, applications and data can run secured on Huawei Cloud Elastic Cloud Servers (ECSs). In addition, Huawei Cloud accelerates ZK rollup hardware innovation. With Huawei-developed XPU, architecture innovation, and algorithm optimization, the average confirmation time of ZK rollup transactions plummeted from hours to minutes.

Zhang Ziyi, Chief Architect of Huawei Cloud Blockchain

Huawei Cloud QingTian Enclave Safeguards Transactions

Security has been significant to Web3. Currently, Web3 wallet applications still face severe security challenges when it comes to the storage and attack defense of wallet private keys. Blockchain Security Alliance Meetup, initiated by the Blockchain Security Alliance, is one of the major activities of Token2049 and has become the focus of the global blockchain security and Web3 ecosystem. Jia Xiaoqiang, Director of Huawei Cloud Virtualization Products, introduced Huawei Cloud’s confidential computing solution and Web3 solution aiming to secure systems, applications, and sensitive data in wallet scenarios.

Jia Xiaoqiang said, “Huawei Cloud QingTian Enclave confidential computing solution is just like a safe for wallet private keys. It supports environment and identity authentication and full-link data encryption and decryption. Applications and data can be run with protection on Huawei Cloud Elastic Cloud Servers (ECSs). Unauthorized users and third parties are isolated to maintain transaction security of private keys and wallets.” Huawei Cloud is committed to building a highly secure and available solution for Web3, and all the efforts turned into QingTian Enclave, an end-to-end solution securing the execution environment for applications and sensitive data through software and hardware.

IPFS Cloud Data Ecosystem with Tenfold Rewards

Decentralized storage is another key infrastructure of Web3. However, the industry shares the same headaches in migrating data to the cloud, reducing costs, and improving effectiveness. At the Fil Dev Summit on September 12, Bai Tao, Chief Cloud Storage Solution Architect of Huawei Cloud, shared InterPlanetary File System (IPFS) data service and elastic cloud deployment solution jointly developed by Huawei Cloud and partners. Huawei Cloud’s cloud data entry simplifies the process of storing data on IPFS, resulting in a 10-fold increase in data rewards and reduced data storage overhead for enterprises. Additionally, Huawei Cloud’s large-ratio EC technologies enable 91% effective capacity usage of disks and scalable storage for data up to 10 EB-level. With the elastic cloud deployment solution, users can choose offline encapsulation, cloud verification, or end-to-end cloud deployment. Huawei Cloud, with over 18 years of experience in enterprise-level storage, aims to deliver cloud storage services that are not only cost-effective but also highly efficient.

Providing “Everything as a Service”, Huawei Cloud aims to offer robust infrastructure that enables advanced, distributed computing power for Web3. This commitment extends to building an open, efficient, and secure blockchain platform that can foster innovation in the Web3 ecosystem.

Easybom: Your Reliable Partner for Electronic Component Search and Procurement

SHENZHEN, China, Sept. 12, 2023 /PRNewswire/ — Easybom, as a leading global electronic component search platform, has successfully connected millions of terminal factories worldwide through its extensive business coverage and years of accumulated experience. Easybom is committed to meeting the procurement needs of customers and constantly providing the latest industry insights. The purpose of Easybom is to simplify the search and procurement process of electronic components, providing an efficient and convenient solution for manufacturers, distributors, and other companies related to the electronics industry.

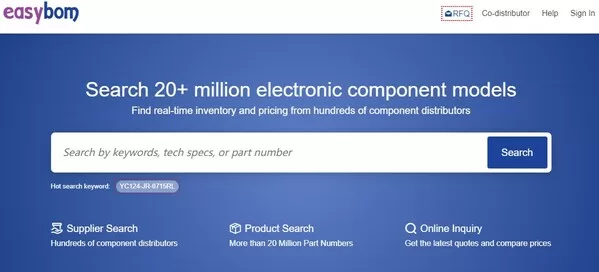
Easybom's homepage interface
Easybom’s homepage interface

Easybom is a feature-rich platform designed to support engineers and procurement specialists in their work. The numerous features of Easybom are as follows. Firstly, the interface design is simple and intuitive, which makes it easy for users to find the information and services they need. Secondly, the product range is wide, Easybom offers a comprehensive selection of electronic components, including integrated circuits, semiconductors, resistors, capacitors, sensors, transducers, discrete semiconductors, etc. Thirdly, users can easily search for specific parts, manufacturers, or specifications, and even compare different products based on criteria such as specifications, manufacturers, and prices. Fourthly, Easybom also provides a wide range of electronic component data sheets for user reference. Fifthly, we provide reliable global procurement services to ensure that customers can purchase the latest and most competitive electronic components. Sixthly, Easybom is committed to providing excellent customer service, with a professional team ready to answer any questions or doubts from users at any time. In short, whether in product selection, procurement process, or after-sales support, Easybom is your reliable partner.

Easybom always adheres to the spirit of unity, innovation, efficiency, and integrity, providing high-quality services. Whether you are a manufacturer of electronic components, a distributor, or a company seeking efficient and convenient solutions in the electronics industry, Easybom has the ability to provide the tools and resources you need. With its rich inventory, high-quality products, and excellent customer service, Easybom has established a good reputation in the industry.

VIRNECT and CelcomDigi sign MoU to develop experiential industrial Metaverse learning and education.

SEOUL, South Korea, Sept. 11, 2023 /PRNewswire/ — CelcomDigi Berhad (CelcomDigi) and VIRNECT (438700: KOSDAQ), a Korea-based technology company that specializes in the development and commercialization of industrial extended reality (XR) solutions, have sealed a Memorandum of Understanding (MoU) to explore the development of experiential learning and education using metaverse, for multiple Malaysian universities.

[from left] Tim Ha, CEO of VIRNECT, Minister of Communications and Digital of Malaysia, YB Fahmi Fadzil, and Datuk Idham Nawawi, CEO of CelcomDigi, sealed a Memorandum of Understanding (MoU) to explore the development of experiential learning and education using Metaverse, for multiple Malaysian universities.
[from left] Tim Ha, CEO of VIRNECT, Minister of Communications and Digital of Malaysia, YB Fahmi Fadzil, and Datuk Idham Nawawi, CEO of CelcomDigi, sealed a Memorandum of Understanding (MoU) to explore the development of experiential learning and education using Metaverse, for multiple Malaysian universities.

Under the MoU, both organizations will collaborate to co-create industrial virtual learning programs reimagined using metaverse and AI-based solutions. Utilizing the Metaverse platform across various learning segments, students will be trained with an immersive learning and education method that will potentially benefit enterprises such as cybersecurity, healthcare, robotics, and oil and gas engineering.

CelcomDigi, via its Innovation Center, aspires to build the nation’s most inspiring innovation ecosystem by teaming up with VIRNECT and XRA, VIRNECT’s local partner and support team in Malaysia, to deliver strategic initiatives leveraging the capabilities of cutting-edge metaverse and AI-based technology solutions into higher learning institutions in Malaysia.

The collaboration aims to produce industry-ready graduates skilled in metaverse applications, building Malaysia’s digitalized society through cutting-edge solutions and technology. Local graduates will be enabled with the opportunity to harness the capabilities of the metaverse and transform beyond traditional knowledge and learning programs, accelerating the development of Malaysia’s future talents with AI-based digital growth.

The Memorandum of Understanding (MoU) was signed at Westin Chosun Hotel on Sep 8, 2023, by Datuk Idham Nawawi, Chief Executive Officer of CelcomDigi Berhad, and Tim Ha, Chief Executive Officer of VIRNECT. The signing ceremony was witnessed by the Minister of Communications and Digital of Malaysia, YB Fahmi Fadzil.

Commenting on the collaboration, CelcomDigi CEO Datuk Idham Nawawi said, “We are committed to bringing the best innovation that will greatly benefit the development of Malaysian industries by utilizing the real values of 5G technology. We are excited to collaborate with VIRNECT, an leading industrial XR technology expert, for the development and co-creation of experiential learning and education using Metaverse solutions. This strategic collaboration underscores our position of leveraging metaverse, 5G, and AI technology to potentially establish innovative and productive digital solutions for Malaysian enterprises, spurring Malaysia’s digital ecosystem into a new era of digital leadership.”

VIRNECT’s Southeast Asian Distributor, XRA, has been key to localising cutting-edge technology in Malaysia, and within this alliance, the company will continue spreading access to technology. Havene Liew, President of XRA, was “excited to partner with VIRNECT and CelcomDigi to spread XR technology in Malaysia. Through this collaboration, we aim to socialise the power of XR across the nation, enabling them to enhance productivity, efficiency, and innovation.”

Tim Ha, CEO of VIRNECT, celebrated the collaboration: “We are immensely grateful to have partners like CelcomDigi and XRA who share our passion for advancing technology to enhance how organizations work, learn, and communicate,” he expressed. “South Korea’s leading industrial company has leveraged XR technology to enhance data understanding and collaboration. As a global trendsetter, their success sets the stage for similar advancements in Malaysia, promising increased productivity and innovation across industries.”

[From Left] Havene Liew, President of XRA, Tim Ha, Chief Executive Officer of VIRNECT, YB Fahmi Fadzil, Minister of Communications and Digital of Malaysia, Datuk Idham Nawawi, CEO of CelcomDigi, T. Kugan, Chief Innovation Officer of CelcomDigi and Joachim Rajaram, Chief Corporate Affairs Officer of CelcomDigi.
[From Left] Havene Liew, President of XRA, Tim Ha, Chief Executive Officer of VIRNECT, YB Fahmi Fadzil, Minister of Communications and Digital of Malaysia, Datuk Idham Nawawi, CEO of CelcomDigi, T. Kugan, Chief Innovation Officer of CelcomDigi and Joachim Rajaram, Chief Corporate Affairs Officer of CelcomDigi.

China International Intelligent Communication Forum 2023 Builds up International Consensus and Facilitates Media Innovation

WUXI, China, Sept. 9, 2023 /PRNewswire/ — The China International Intelligent Communication Forum 2023, hosted by China Media Group and the Jiangsu Provincial People’s Government, took place in Wuxi, Jiangsu on September 7 to 9.

China International Intelligent Communication Forum 2023

The forum has been held twice since 2021, building a high-end platform for international exchanges and cooperation in intelligent communication. Themed on “A New Journey towards Boundless Connectivity”, this year’s forum brought together former political dignitaries, representatives of international organizations, ambassadors to China, as well as Chinese and foreign media representatives, experts, scholars and entrepreneurs. They shared views and achievements on the development trend of intelligent communication, media responsibility in the era of intelligence, and so forth.

Participants of the forum included relevant leaders of China Media Group and the Jiangsu Provincial People’s Government, relevant officials of the Wuxi Municipal People’s Government, Lin Shangli, President of Renmin University of China, Matteo Renzi, Former Prime Minister of Italy, Erik Solheim, Former Under-Secretary-General of the United Nations and President of the EU-Asia Centre, Shahbaz Khan, Representative of UNESCO Multisectoral Regional Office for East Asia, and John Collins, Academician of Cambridge University. They attended the forum in person or via video link and delivered speeches. During the forum, China Media Group grandly released the “CMG Algorithm”.

Representatives of young people at home and abroad were invited for a round-table dialogue, to seek solutions from a multicultural perspective through discussions, which centered around new opportunities and challenges faced by the young generation in the era of intelligent media.

Three sub-forums on “Intelligent Technology” , “Intelligent Consumption” and “Intelligent Culture” were held, together with activities such as “‘Wuxi onto the World Stage’ Global Livestream”, “Internet Celebrity’s Journey to Wuxi ” , and “Ambassadors’ Wuxi Tour”.

Wuxi, the host city, has long been known as “A Shinning Pearl of Taihu Lake and A Prosperous Land of Jiangnan Region”. With over 3,000 years of written records, Wuxi was one of the birthplaces of Wu culture and became the cradle of Chinese national industry and commerce in the 20th century. In recent years, Wuxi has taken the forum as an opportunity to develop intelligent media industry and apply cooperation achievements.

Dow Jones and Cision Unveil Exclusive Global Content Partnership for the PR and Corporate Communications Market

 New Agreement Empowers Reputation Management and Strategic Communication Agendas Worldwide

CHICAGO and NEW YORK, Sept. 7, 2023 /PRNewswire/ — Cision, the leading provider of consumer and media intelligence and communications solutions, has entered into a long-term agreement to distribute Dow Jones content to Public Relations and Corporate Communications (PRCC) professionals. This new partnership, which is structured to become an exclusive agreement between Dow Jones and Cision, brings together the most trusted news and cutting-edge technology to help PRCC customers manage brand reputation, monitor business-critical topics and advance global communication strategies.

Dow Jones’s authoritative journalism, including The Wall Street Journal, Barron’s, MarketWatch, Investor’s Business Daily and Dow Jones Newswires, is now fully integrated into Cision’s media intelligence platforms, with rollouts to broader Cision and Brandwatch portfolios expected soon. Users of Cision’s premium platforms will also receive digital subscriptions to Dow Jones’s world-class publications.

Additionally, Cision will integrate select content from the Factiva business intelligence solution into its platforms, offering customers the ability to monitor and analyze content from thousands of licensed sources globally.

“Together with Dow Jones, we’re excited about the unlimited potential we have to innovate and support industry leaders in the fast-moving world of news and information,” said Cali Tran, Cision CEO. “The heart of our mission is to empower our customers with a better understanding of their position within the market and to give them the insight they need to shape effective strategies with confidence, ensuring relevance and visibility.”

“This partnership reinforces Dow Jones’s commitment to provide the most trusted news, data and analysis to help people make decisions,” said Almar Latour, CEO of Dow Jones and publisher of The Wall Street Journal. “By joining forces with Cision, we’re expanding the reach of our business news and information that meets our audiences where they are while also furthering our investment in unique, high-quality journalism.”

Cision’s commitment to data partnerships extends to the world’s largest and smallest publishers and social platforms, ensuring industry leaders get a full and accurate view of the news, trends and conversations impacting the valuations of the brands and organizations they lead. The addition of Dow Jones’s premium publications to its global content collection will provide customers with access to quality, trustworthy news to streamline media monitoring and inform decision making.

Under the agreement, Cision will also have the unique ability to partner directly with and sublicense Dow Jones content to other software providers and approved resellers in the PRCC market. Additionally, the two companies will work to align their complementary assets and capabilities to provide unique value for PRCC customers through a joint roadmap of product innovation and co-creation.

To learn more visit cision.com/dowjones.

About Cision
Cision is the leading provider of consumer and media intelligence and communications solutions, enabling public relations, marketing, social media, and communications professionals around the world to understand their consumers, influence outcomes and amplify their stories. As the market leader, Cision’s award-winning brands and technology enable Marketing and Communications leaders to manage and shape their brands in today’s rapidly evolving world. Cision has offices in 24 countries through the Americas, EMEA and APAC, and offers a suite of best-in-class solutions, including PR Newswire, Brandwatch Consumer Research, and CisionOne. To learn more visit www.cision.comwww.brandwatch.com and www.prnewswire.com.

About Dow Jones
Dow Jones is a global provider of news and business information, delivering content to consumers and organizations around the world across multiple formats, including print, digital, mobile and live events. Dow Jones has produced unrivaled quality content for more than 130 years and today has one of the world’s largest news-gathering operations globally. It is home to leading publications and products including the flagship Wall Street Journal, America’s largest newspaper by paid circulation; Barron’s, MarketWatch, Mansion Global, Financial News, Investor’s Business Daily, Factiva, Dow Jones Risk & Compliance, Dow Jones Newswires, OPIS and Chemical Market Analytics. Dow Jones is a division of News Corp (Nasdaq: NWS, NWSA; ASX: NWS, NWSLV).

Contact Information:
For media inquiries, please contact:
Cision Public Relations
cision@kcsa.com

Louise Goodenday
louise.goodenday@dowjones.com 

Logo – https://techent.tv/wp-content/uploads/2023/09/dow-jones-and-cision-unveil-exclusive-global-content-partnership-for-the-pr-and-corporate-communications-market.jpg

Source: Cision Ltd.

Trip.com Group Limited Reports Unaudited Second Quarter and First Half of 2023 Financial Results

SHANGHAI, Sept. 5, 2023 /PRNewswire/ — Trip.com Group Limited (Nasdaq: TCOM; HKEX: 9961) (“Trip.com Group” or the “Company”), a leading one-stop travel service provider of accommodation reservation, transportation ticketing, packaged tours, and corporate travel management, today announced its unaudited financial results for the second quarter and first half of 2023.

Key Highlights for the Second Quarter of 2023

  • Domestic and international business continued to show robust recovery in the second quarter of 2023

– Domestic hotel bookings grew by 170% year over year and by over 60% compared to the pre-COVID level for the same period in 2019.
– Outbound hotel and air reservations recovered to over 60% of the pre-COVID level for the same period in 2019, surpassing the industry-wide recovery rate of 37% in terms of international air passenger volume for the same period.
– Air ticket bookings on the Company’s global OTA platform grew by over 120% year over year and nearly doubled compared to the pre-COVID level for the same period in 2019.

  • The Company delivered strong results in the second quarter of 2023 

– Total net revenue increased by 180% year over year and exceeded the pre-COVID level for the same period in 2019 by 29%.
– Net income for the second quarter was RMB648 million (US$91 million), which improved from RMB43 million for the same period in 2022.
– Adjusted EBITDA for the second quarter was RMB3.7 billion (US$507 million). Adjusted EBITDA margin was 33%, compared to 9% for the same period in 2022 and 31% for the previous quarter.

“During the second quarter of 2023, the demand for both domestic and international travel remained resilient.” said James Liang, Executive Chairman. “Despite limited air capacity recovery, the robust rebound of travel activities reflects travelers’ strong desire to explore the world. We remain optimistic about the enduring demand for travel and the long-term market outlook.”

“We are encouraged by our solid results in the second quarter,” said Jane Sun, Chief Executive Officer. “With the thriving market demand and our outstanding performance, we are poised to take the lead in driving the industry’s recovery and actively creating an abundance of job opportunities alongside our esteemed business partners.”

Second Quarter of 2023 Financial Results and Business Updates

The Company’s business continued to recover significantly since the pent-up demand for travel remains strong, which led to an increasing volume of travel bookings.

For the second quarter of 2023, Trip.com Group reported net revenue of RMB11.2 billion (US$1.6 billion), representing a 180% increase from the same period in 2022 and a 22% increase from the previous quarter, primarily due to the substantial recovery of travel market.

Accommodation reservation revenue for the second quarter of 2023 was RMB4.3 billion (US$591 million), representing a 216% increase from the same period in 2022 and a 23% increase from the previous quarter, primarily due to the substantial recovery of travel market.

Transportation ticketing revenue for the second quarter of 2023 was RMB4.8 billion (US$664 million), representing a 173% increase from the same period in 2022 and a 16% increase from the previous quarter, primarily due to the substantial recovery of travel market.

Packaged-tour revenue for the second quarter of 2023 was RMB722 million (US$100 million), representing a 492% increase from the same period in 2022 and an 87% increase from the previous quarter, primarily due to the substantial recovery of travel market.

Corporate travel revenue for the second quarter of 2023 was RMB584 million (US$81 million), representing a 178% increase from the same period in 2022 and a 31% increase from the previous quarter, primarily due to the substantial recovery of travel market.

Cost of revenue for the second quarter of 2023 increased by 106% to RMB2.0 billion (US$277 million) from the same period in 2022 and increased by 23% from the previous quarter, primarily due to the substantial recovery of travel market. Cost of revenue as a percentage of net revenue was 18% for the second quarter of 2023.

Product development expenses for the second quarter of 2023 increased by 67% to RMB3.0 billion (US$407 million) from the same period in 2022 and increased by 10% from the previous quarter, primarily due to an increase in product development personnel related expenses. Product development expenses as a percentage of net revenue was 26% for the second quarter of 2023.

Sales and marketing expenses for the second quarter of 2023 increased by 185% to RMB2.4 billion (US$325 million) from the same period in 2022 and increased by 34% from the previous quarter, primarily due to an increase in expenses relating to sales and marketing promotion activities. Sales and marketing expenses as a percentage of net revenue was 21% for the second quarter of 2023.

General and administrative expenses for the second quarter of 2023 increased by 58% to RMB955 million (US$132 million) from the same period in 2022 primarily due to an increase in general and administrative personnel related expenses and increased by 7% from the previous quarter. General and administrative expenses as a percentage of net revenue was 8% for the second quarter of 2023.

Income tax expense for the second quarter of 2023 was RMB562 million (US$77 million), compared to RMB173 million for the same period in 2022 and RMB341 million for the previous quarter. The change in Trip.com Group’s effective tax rate was primarily due to the combined impacts of changes in respective profitability of its subsidiaries with different tax rates, certain non-taxable income or loss resulting from the fair value changes in equity securities investments and exchangeable senior notes, and changes in valuation allowance provided for deferred tax assets.

Net income for the second quarter of 2023 was RMB648 million (US$91 million), compared to RMB43 million for the same period in 2022 and RMB3.4 billion for the previous quarter. Adjusted EBITDA for the second quarter of 2023 was RMB3.7 billion (US$507 million), compared to RMB355 million for the same period in 2022 and RMB2.8 billion for the previous quarter. Adjusted EBITDA margin was 33% for the second quarter of 2023, compared to 9% for the same period in 2022 and 31% for the previous quarter.

Net income attributable to Trip.com Group’s shareholders for the second quarter of 2023 was RMB631 million (US$89 million), compared to RMB69 million for the same period in 2022 and RMB3.4 billion for the previous quarter. Excluding share-based compensation charges, fair value changes of equity securities investments and exchangeable senior notes recorded in other income/(expense) and their tax effects, non-GAAP net income attributable to Trip.com Group’s shareholders for the second quarter of 2023 was RMB3.4 billion (US$475 million), compared to non-GAAP net loss attributable to Trip.com Group’s shareholders of RMB203 million for the same period in 2022 and non-GAAP net income attributable to Trip.com Group’s shareholders of RMB2.1 billion for the previous quarter.

Diluted earnings per ordinary share and per ADS was RMB0.94 (US$0.13) for the second quarter of 2023. Excluding share-based compensation charges, fair value changes of equity securities investments and exchangeable senior notes and their tax effects, non-GAAP diluted earnings per ordinary share and per ADS was RMB5.11 (US$0.70) for the second quarter of 2023. Each ADS currently represents one ordinary share of the Company.

As of June 30, 2023, the balance of cash and cash equivalents, restricted cash, short-term investment, held to maturity time deposit and financial products was RMB75.0 billion (US$10.3 billion).

Conference Call

Trip.com Group’s management team will host a conference call at 8:00 PM EST on September 4, 2023 (or 8:00 AM CST on September 5, 2023) following this announcement.

The conference call will be available live on Webcast and for replay at: https://investors.trip.com. The call will be archived for twelve months on our website.

All participants must pre-register to join this conference call using the Participant Registration link below:
https://register.vevent.com/register/BI90bc7b46919e4b55a896bf30b59d4a4a 

Upon registration, each participant will receive details for this conference call, including dial-in numbers and a unique access PIN. To join the conference, please dial the number provided, enter your PIN, and you will join the conference instantly.

Safe Harbor Statement

This announcement contains forward-looking statements. These statements are made under the “safe harbor” provisions of the U.S. Private Securities Litigation Reform Act of 1995. These forward-looking statements can be identified by terminology such as “may,” “will,” “expect,” “anticipate,” “future,” “intend,” “plan,” “believe,” “estimate,” “is/are likely to,” “confident” or other similar statements. Among other things, quotations from management in this press release, as well as Trip.com Group’s strategic and operational plans, contain forward-looking statements. Forward-looking statements involve inherent risks and uncertainties. A number of important factors could cause actual results to differ materially from those contained in any forward-looking statement. Potential risks and uncertainties include, but are not limited to, severe or prolonged downturn in the global or Chinese economy, general declines or disruptions in the travel industry, volatility in the trading price of Trip.com Group’s ADSs or shares, Trip.com Group’s reliance on its relationships and contractual arrangements with travel suppliers and strategic alliances, failure to compete against new and existing competitors, failure to successfully manage current growth and potential future growth, risks associated with any strategic investments or acquisitions, seasonality in the travel industry in the relevant jurisdictions where Trip.com Group operates, failure to successfully develop Trip.com Group’s existing or future business lines, damage to or failure of Trip.com Group’s infrastructure and technology, loss of services of Trip.com Group’s key executives, the impact of COVID-19 to Trip.com Group’s business operations, adverse changes in economic and political policies of the PRC government, inflation in China, risks and uncertainties associated with PRC laws and regulations with respect to the ownership structure of the variable interest entities and the contractual arrangements among Trip.com Group, the variable interest entities and their shareholders, and other risks outlined in Trip.com Group’s filings with the U.S. Securities and Exchange Commission or the Stock Exchange of Hong Kong Limited. All information provided in this press release and in the attachments is as of the date of the issuance, and Trip.com Group does not undertake any obligation to update any forward-looking statement, except as required under applicable law.

About Non-GAAP Financial Measures

To supplement Trip.com Group’s consolidated financial statements, which are prepared and presented in accordance with United States Generally Accepted Accounting Principles (“GAAP”), Trip.com Group uses non-GAAP financial information related to adjusted net income attributable to Trip.com Group Limited, adjusted EBITDA, adjusted EBITDA margin, and adjusted diluted earnings per ordinary share and per ADS, each of which is adjusted from the most comparable GAAP result to exclude the share-based compensation charges that are not tax deductible, fair value changes of equity securities investments and exchangeable senior notes, net of tax, and other applicable items. Trip.com Group’s management believes the non-GAAP financial measures facilitate better understanding of operating results from quarter to quarter and provide management with a better capability to plan and forecast future periods.

Non-GAAP information is not prepared in accordance with GAAP, does not have a standardized meaning under GAAP, and may be different from non-GAAP methods of accounting and reporting used by other companies. The presentation of this additional information should not be considered a substitute for GAAP results. A limitation of using non-GAAP financial measures is that non-GAAP measures exclude share-based compensation charges, fair value changes of equity securities investments and exchangeable senior notes and their tax effects that have been and will continue to be significant recurring expenses in Trip.com Group’s business for the foreseeable future.

Reconciliations of Trip.com Group’s non-GAAP financial data to the most comparable GAAP data included in the consolidated statement of operations are included at the end of this press release.

About Trip.com Group Limited

Trip.com Group Limited (Nasdaq: TCOM; HKEX: 9961) is a leading global one-stop travel platform, integrating a comprehensive suite of travel products and services and differentiated travel content. It is the go-to destination for travelers in China, and increasingly for travelers around the world, to explore travel, get inspired, make informed and cost-effective travel bookings, enjoy hassle-free on-the-go support, and share travel experience. Founded in 1999 and listed on Nasdaq in 2003 and HKEX in 2021, the Company currently operates under a portfolio of brands, including Ctrip, Qunar, Trip.com, and Skyscanner, with the mission “to pursue the perfect trip for a better world.”

For further information, please contact:

Investor Relations

Trip.com Group Limited
Tel: +86 (21) 3406-4880 X 12229
Email: iremail@trip.com

Trip.com Group Limited

Unaudited Consolidated Balance Sheets

(In millions, except share and per share data)

December 31, 2022

June 30, 2023

June 30, 2023

RMB (million)

RMB (million)

USD (million)

ASSETS

Current assets:

Cash, cash equivalents and restricted cash

18,487

36,843

5,080

Short-term investments

25,545

18,532

2,556

Accounts receivable, net 

5,486

10,689

1,474

Prepayments and other current assets 

11,917

17,028

2,348

Total current assets

61,435

83,092

11,458

Property, equipment and software

5,204

5,192

716

Intangible assets and land use rights

12,825

12,738

1,757

Right-of-use asset

819

715

99

Investments (Includes held to maturity time deposit and
financial products of RMB15,527 million and RMB19,581
million as of December 31,2022 and June 30, 2023,
respectively)

50,177

54,757

7,551

Goodwill

59,337

59,382

8,189

Other long-term assets

570

624

86

Deferred tax asset

1,324

1,716

237

Total assets

191,691

218,216

30,093

LIABILITIES

Current liabilities:

Short-term debt and current portion of long-term debt

32,674

32,414

4,470

Accounts payable

7,569

14,729

2,031

Advances from customers

8,278

13,505

1,862

Other current liabilities

12,718

15,029

2,073

Total current liabilities

61,239

75,677

10,436

Deferred tax liability

3,487

3,647

503

Long-term debt

13,177

19,697

2,716

Long-term lease liability

534

484

67

Other long-term liabilities

235

310

43

Total liabilities

78,672

99,815

13,765

SHAREHOLDERS’ EQUITY

Total Trip.com Group Limited shareholders’ equity

112,283

117,649

16,224

Non-controlling interests

736

752

104

Total shareholders’ equity

113,019

118,401

16,328

Total liabilities and shareholders’ equity

191,691

218,216

30,093

Trip.com Group Limited

Unaudited Consolidated Statements of Income/(Loss)

(In millions, except share and per share data)

Three Months Ended

Six Months Ended

June 30, 2022

March 31, 2023

June 30, 2023

June 30, 2023

June 30, 2022

June 30, 2023

June 30, 2023

RMB (million)

RMB (million)

RMB (million)

USD (million)

RMB (million)

RMB (million)

USD (million)

Revenue:

Accommodation reservation 

1,357

3,480

4,285

591

2,807

7,765

1,071

Transportation ticketing 

1,763

4,156

4,814

664

3,426

8,970

1,237

Packaged-tour 

122

386

722

100

246

1,108

153

Corporate travel

210

445

584

81

432

1,029

142

Others

564

744

857

118

1,216

1,601

221

Total revenue

4,016

9,211

11,262

1,554

8,127

20,473

2,824

Less: Sales tax and surcharges

(5)

(13)

(15)

(2)

(7)

(28)

(4)

Net revenue

4,011

9,198

11,247

1,552

8,120

20,445

2,820

Cost of revenue

(976)

(1,637)

(2,007)

(277)

(2,043)

(3,644)

(502)

Gross profit

3,035

7,561

9,240

1,275

6,077

16,801

2,318

Operating expenses:

Product development *

(1,772)

(2,674)

(2,953)

(407)

(3,746)

(5,627)

(776)

Sales and marketing *

(826)

(1,755)

(2,355)

(325)

(1,669)

(4,110)

(567)

General and administrative *

(604)

(891)

(955)

(132)

(1,188)

(1,846)

(255)

Total operating expenses

(3,202)

(5,320)

(6,263)

(864)

(6,603)

(11,583)

(1,598)

(Loss)/income from operations

(167)

2,241

2,977

411

(526)

5,218

720

Interest income 

544

441

513

71

1,135

954

132

Interest expense

(351)

(486)

(555)

(77)

(692)

(1,041)

(144)

Other income/(expense)

469

1,652

(1,961)

(270)

(238)

(309)

(43)

Income/(loss) before income
tax expense and equity in
income of affiliates

495

3,848

974

135

(321)

4,822

665

Income tax expense

(173)

(341)

(562)

(77)

(159)

(903)

(124)

Equity in (loss)/gain of affiliates

(279)

(133)

236

33

(478)

103

14

Net income/(loss)

43

3,374

648

91

(958)

4,022

555

Net loss/(income) attributable to non-
controlling interests

26

1

(17)

(2)

38

(16)

(2)

Net income/(loss) attributable
to Trip.com Group Limited

69

3,375

631

89

(920)

4,006

553

Earnings/(losses) per ordinary share 

– Basic

0.10

5.18

0.97

0.13

(1.42)

6.14

0.85

– Diluted

0.10

5.02

0.94

0.13

(1.42)

5.98

0.82

Earnings/(losses) per ADS 

– Basic

0.10

5.18

0.97

0.13

(1.42)

6.14

0.85

– Diluted

0.10

5.02

0.94

0.13

(1.42)

5.98

0.82

Weighted average ordinary shares outstanding 

– Basic

647,866,001

651,849,468

653,392,956

653,392,956

647,843,829

652,625,256

652,625,256

– Diluted

650,906,465

672,743,729

671,942,381

671,942,381

647,843,829

670,838,392

670,838,392

* Share-based compensation included in Operating expenses above is as follows:

  Product development 

146

179

234

32

253

413

57

  Sales and marketing 

28

31

44

6

46

75

10

  General and administrative 

130

168

219

30

228

387

53

Trip.com Group Limited

Unaudited Reconciliation of  GAAP and Non-GAAP Results

(In millions, except %, share and per share data)

Three Months Ended

Six Months Ended

June 30, 2022

March 31, 2023

June 30, 2023

June 30, 2023

June 30, 2022

June 30, 2023

June 30, 2023

RMB (million)

RMB (million)

RMB (million)

USD (million)

RMB (million)

RMB (million)

USD (million)

Net income/(loss)

43

3,374

648

91

(958)

4,022

555

Less: Interest income

(544)

(441)

(513)

(71)

(1,135)

(954)

(132)

Add: Interest expense

351

486

555

77

692

1,041

144

Add: Other (income)/expense

(469)

(1,652)

1,961

270

238

309

43

Add: Income tax expense

173

341

562

77

159

903

124

Add: Equity in loss/(income) of affiliates

279

133

(236)

(33)

478

(103)

(14)

(Loss)/income from operations

(167)

2,241

2,977

411

(526)

5,218

720

Add: Share-based compensation

304

378

497

68

527

875

120

Add: Depreciation and amortization

218

201

204

28

445

405

56

Adjusted EBITDA

355

2,820

3,678

507

446

6,498

896

Adjusted EBITDA margin

9 %

31 %

33 %

33 %

5 %

32 %

32 %

Net income/(loss) attributable to Trip.com Group Limited

69

3,375

631

89

(920)

4,006

553

Add: Share-based compensation

304

378

497

68

527

875

120

Add: (Gain)/loss from fair value changes of equity securities
investments and exchangeable senior notes

(668)

(1,648)

2,351

324

117

703

97

Add: Tax effects on fair value changes of equity securities
investments and exchangeable senior notes

92

(40)

(45)

(6)

37

(85)

(12)

Non-GAAP net (loss)/income attributable to Trip.com Group
Limited

(203)

2,065

3,434

475

(239)

5,499

758

Weighted average ordinary shares outstanding-
 Diluted-non GAAP 

647,866,001

672,743,729

672,031,445

672,031,445

647,843,829

670,838,392

670,838,392

Non-GAAP Diluted (losses)/income per share 

(0.31)

3.07

5.11

0.70

(0.37)

8.20

1.13

Non-GAAP Diluted (losses)/income per ADS 

(0.31)

3.07

5.11

0.70

(0.37)

8.20

1.13

Notes for all the condensed consolidated financial schedules presented:

Note 1: The conversion of Renminbi (RMB) into U.S. dollars (USD) is based on the certified exchange rate of USD1.00=RMB7.2513 on June 30, 2023 published by the Federal Reserve Board.

“With Saudi, Go Global” Huawei Cloud Launches Services in Saudi Arabia

RIYADH, Saudi Arabia, Sept. 4, 2023 /PRNewswire/ — Huawei Cloud announced the launch of the Huawei Cloud Riyadh Region today at the Huawei Cloud Summit Saudi Arabia 2023. This Region will help promote digital-led economic growth in the country.

The launch of the Huawei Cloud Riyadh Region announced that the Saudi Arabia Region will be Huawei Cloud’s focus in serving the Middle East, Central Asia and Africa, providing innovative, reliable, secure, and sustainable cloud services. This achievement underscores Huawei CLOUD’s unwavering dedication to supporting Saudi Arabia’s Vision 2030, aligned with the nation’s ambitious technological advancement, leadership, and innovation goals.

H.E. Eng. Haitham bin Abdul Rahman Al-Ohali, Vice Minister at the Ministry of Communications and Information Technology (MCIT) in Saudi Arabia, shared his perspective on this monumental achievement: “Huawei is a proud partner in our country’s technological progress having worked with the Ministry, service providers, enterprises and universities in various collective efforts towards digital transformation. We look forward to the transformative impact the Huawei Cloud Riyadh Region will have on our digital ecosystem, creating new avenues for innovation and growth.

The Riyadh Region provides several benefits to customers. First, this region translates Huawei’s global expertise on digital transformation into industries’ excellence, making innovation easier and faster. Huawei Cloud Saudi Region is located in Riyadh and through a 3AZ (availability zone) architecture, it will provide highly available and secure cloud services, ensuring the stable operations of various services. In addition, the Region can provide full-stack cloud services, including infrastructure, databases, containers, big data, and AI services to meet the requirements of various industries.

Based on the 3AZ high-reliability architecture, the Riyadh Region provides low latency, covering all existing carriers’ networks powered by STC, Zain, and Mobily. The local data center will store data locally in line with local data regulations. The company will also launch 68 cloud services in three categories – data, AI, and cloud native.

Steven Yi, Senior Vice President of Huawei and President of Huawei Middle East and Central Asia Region, said: “I’ve cherished numerous unforgettable moments in this extraordinary country. Just yesterday, walking through the newly renovated Diriyah evoked my deep emotions. It brought to mind an old Chinese saying: ‘Build the right nest, and a Phoenix will come.’ The essence is clear: create an inviting environment, and you’ll attract the best. This is undeniably true for Saudi, a nation that consistently attracts top investors.”

The company revealed that Huawei Cloud will utilize a number of industry-leading technologies to advance intelligence for Saudi Arabia, including the Pangu Models 3.0, which address AI adoption challenges, leveraging industry insights to enhance AI capabilities across sectors like finance, government, manufacturing, and more. Pangu Models 3.0 will usher in a new era of innovation in the Kingdom while accelerating economic diversification.

At the Huawei Cloud Summit Saudi Arabia 2023, the company also released the “Saudi Arabia Go Cloud Go Global” program to connect Chinese and Saudi enterprises, fostering growth and innovation. The company will leverage its strong experience of working in more than 170 countries and regions, various industries, advanced technologies, and solutions to help Chinese enterprises enter Saudi Arabia and enhance partnerships with local stakeholders.

Jacqueline Shi, President of Huawei Cloud Global Marketing and Sales Service, said, “Huawei Cloud aims high, aims global, and aims here in Saudi Arabia. Saudi Arabia Region will be our focus in serving the Middle East, Central Asia and Africa, providing innovative, reliable, secure, and sustainable cloud services. We hope to create a better choice for advancing intelligence. This cloud gives you more choices to stay innovative, inclusive, and open.  This cloud will help you succeed in the digital and intelligent era. This cloud is for everyone.”

At the event, the company also announced that Huawei Cloud will train 200,000 developers in Saudi Arabia in the next five years. It will also build joint solutions with 1,000 local partners and launch the Huawei Cloud Startup Program to help 2,000 startups grow.

Eric Yang, CEO of Huawei Saudi Arabia, said: “We are proudly launching Huawei Cloud Riyadh Region today. It has been a great journey for us in Saudi Arabia for the last 20 years. Huawei is a constructor for an intelligent society, contributor to a thriving economy, and cultivator for a prosperous talent ecosystem. Towards 2030, we will stay dedicated to continuously providing ubiquitous connectivity, green energy, pervasive cloud computing and AI capabilities for Saudi Arabia to unlock unlimited opportunities of the new digital era.”

Huawei Saudi Arabia was founded in 2002 and has played a pivotal role in the digital transformation in Saudi Arabia. Over the course of 19 years, Huawei has collaborated with regional communication service providers (CSPs) to provide reliable network assurance for the Hajj pilgrimage in Saudi Arabia without incidents. The company also supported the roll-out of 5G in the Kingdom, enabling the country to become one of the world’s pioneer 5G markets. Huawei has helped connect 3.5 million people in rural areas, created 20,000 local jobs, and cultivated 10,000 ICT talents for Saudi Arabia.

Under its “Everything as a Service” strategy, Huawei Cloud is focused on becoming the cloud foundation and enabler of industry digitalization, providing services for customers in more than 170 countries and regions worldwide.

Cervoz NVMe PCIe Gen3x4 SSDs: Blazing-Speed with Advanced Power Loss Protection

TAIPEI, Sept. 1, 2023 /PRNewswire/ — Leading industrial storage and memory provider, Cervoz Technology, introduces the T436 Family: state-of-the-art Industrial PCIe NVMe Gen3x4 SSDs. Compatible with the PCIe Gen3x4 interface, NVMe protocol, and M.2 2280 form factor, the series is a perfect fit for both booting and storage in PCs and motherboards. What sets the T436 SSDs apart is Cervoz’s proprietary Power Loss Protection technology.

Cervoz pushes the boundaries of SSD performance and reliability with the introduction of the T436 NVMe PCIe Gen3x4 SSDs, epitomizing high-speed operations combined with comprehensive Power Loss Protection technology.

In an era dominated by rapid IoT and AI advancements, our dependency on data is paramount. With global energy fluctuations driven by soaring computing needs, there’s more than just a call for swifter data management. It’s crucial to protect our data from potential power inconsistencies.

Guarding Data Against Power Instability

The standout feature of the T436 is its advanced PLP (Power Loss Protection) technology. Power disruptions have long been a challenge for SSDs, making valuable data vulnerable to corruption or loss, threatening both data integrity and operational continuity. The T436 SSDs integrate the Powerguard technology to combat these challenges. Upon an unexpected power dip, Powerguard activates instantly, drawing additional power from tantalum capacitors, ensuring that any data within the DRAM buffer is written back to the NAND Flash. Typically, average SSDs require around 40ms of backup power discharge to complete the data write-in task, influenced by the data’s complexity or size. With Cervoz’s Powerguard, the buffer time from a power dip to potential failure extends impressively to 88ms, ensuring that all data has ample time to be written fully.

All of the above is just a part of Cervoz’s comprehensive PLP technology. When combined with Safeguard’s VDT (Voltage Detector) mechanism, Voltguard’s voltage stabilization, and Circuitguard’s defense against abnormal currents, Cervoz’s PLP offers unrivaled protection against data loss due to power disturbances, ensuring the integrity and security of your essential data.

Uncompromised Speed and Reliability

The T436 family of SSDs is not just about speed; it’s also about reliability. With features that range from compliance with NVMe 1.3/PCI Express Base 3.1 standards to the incorporation of industry-leading SSD-grade-quality TLC flash memory from Kioxia, the T436 is designed for efficiency. Moreover, the Cervoz firmware features a robust ECC algorithm—Low-Density Parity Check (LDPC) decoding—together with the End-to-End Data Protection method, ensuring data reliability and integrity.

Recognizing the heat generated by high performance, the T436 is available in a wide-temperature version that can reliably operate from -40°C to 85°C. Additionally, the integrated SW-HW overheating protection mechanism, complemented by an optimized heatsink, ensures effective heat dissipation, guaranteeing optimum performance at all times.

Why Cervoz T436 SSDs?

With capacities ranging from 240GB to 1920GB, a broad operating temperature range of -40°C to 85°C, dynamic thermal throttling, DRAM Buffer, AES 256-bit encryption, and more, the T436 family offers a comprehensive solution tailored for businesses seeking both performance and unwavering reliability. Whether the need is for rapid data access or consistent operations in power-critical situations, the T436 ensures that businesses stay at the forefront of efficiency and reliability.

Join the revolution of high-speed storage, bolstered by unparalleled reliability by visiting www.cervoz.com or contact info@cervoz.com. With Cervoz, the compromise between speed and reliability becomes a thing of the past.

About Cervoz

Headquartered in Taiwan, Cervoz Technology supplies embedded components for the industrial PC market. The company has nearly two decades of experience designing and developing high-performing memory and storage solutions for industrial applications.

Contacts
Media: marketing@cervoz.com
Sales: sales@cervoz.com

Source: Cervoz Technology Co., Ltd.

Yonyou Releases White Paper on Globalization of Digital Operations for Chinese Enterprises, Empowering Global Expansion and Digital Transformation

HONG KONG, Aug. 31, 2023 /PRNewswire/ — On August 19, 2023, Yonyou Network Technology unveiled the White Paper on Globalization of Digital Operations for Chinese Enterprises at the forum entitled ‘Chinese Enterprises Going Global’ in Shanghai National Exhibition and Convention Center, aiming to support Chinese enterprises in global expansion and digital transformation.

Holistic Development: New Patterns, New Challenges, Accelerated Globalization

In response to the evolving global dynamics and challenges, an increasing number of Chinese companies are embracing digital economic opportunities to facilitate international growth. Dr. Bowen Guo, General Manager of Yonyou Overseas Business Unit, introduced the global 2.0 strategy during the Chinese Enterprise Globalization Forum.

The White Paper delves into the evolving landscape and challenges faced by Chinese enterprises global operations under the Belt and Road initiative and dual circulation policies. It outlines four global operational models: export, overseas marketing, overseas operations, and global integration.

Digital Intelligence Foundation: Solutions for Chinese Enterprise Global Operations

Then, Mr. Liu Meixiang, General Manager of Yonyou North America, further introduced the Yonyou BIP globalization solution released in the White Paper. Yonyou BIP is a new-generation digital intelligence product developed after seven years of research and development. It supports various capabilities such as multi-language, multi-time zone, multi-format, multi-currency, multi-standard, and localized access. Yonyou BIP also enables regional and localized applications based on customers’ business scenarios, with the scope of applications expanding through the globalized data model.

Mr. Liu also highlighted the topic of global compliance and data security and privacy protection, introducing the business scenarios and solutions for Chinese enterprises going overseas under the GDPR, including finance, tax, HR, recruitment, procurement and OA, and proposing targeted development strategies for planning and building enterprises’ global competitiveness.

World-Class: Case Studies of Chinese Enterprise Global Operations

The White Paper features compelling case studies showcasing the success of Chinese enterprises’ global operations. Notably, China Mobile International collaborated with Yonyou to establish an integrated global HR platform, effectively managing staff performance across 35 countries and integrating 25 sub-processes. Yonyou’s support enabled Wolong Electric Group’s digital procurement platform, leading to a cost reduction of over 10%. Additionally, Yonyou’s efforts transformed Walsin Lihwa into a digital intelligent factory spanning Taiwan and Mainland China.

Founded in 2003 in Hong Kong, Yonyou’s Overseas Business Unit boasts 20 years of expertise. Yonyou has provided best practices for thousands of mid-size and large enterprises, spanning finance, retail, real estate, construction, and trading. Yonyou continues to drive cross-border management and business innovation for enterprises.

From Asia-Pacific to Global: Yonyou Embarks on the Era of Globalization 2.0

The White Paper release marks a new phase for Yonyou Overseas in Globalization 2.0 era. Dr. Bowen Guo highlighted this year’s initiatives of entering Europe, North America, Japan, and the Middle East, covering over a hundred countries in three years. This strategy aligns with the White Paper’s concepts, supporting Chinese enterprises digital transformation for global expansion.

Co-Creation and Mutual Benefit: A New Ecosystem for Global Expansion

Amidst globalization, how Chinese enterprises achieve global operations through digital transformation is vital. The White Paper serves as a comprehensive guide, offering strategies, solutions, and best practices to guide Chinese companies in their global digital transformation journey.

【About Yonyou Network Technology】

Founded in 1988, Yonyou Network Technology is the world’s leading enterprise management software and cloud services provider, offering industry-wide ERP software and SaaS solutions. Yonyou has been recognized by Gartner as global top 10 ERP providers, and ranked by IDC as the largest enterprise management software provider in China.

Yonyou Hong Kong Website: https://www.yonyou.com.hk
Facebook: https://www.facebook.com/YonyouHongKong
LinkedIn: https://www.linkedin.com/company/yonyouhongkong
Twitter: https://twitter.com/YonyouOverseas
#YonyouHongKong

Starbox Group Holdings Ltd. Announces First Half of Fiscal Year 2023 Financial Results

Revenue and Net Profit Increased to $4.0 Million and $1.4 Million Respectively (Basic Earnings of $0.03 Per Share) with Technology-Driven Services Revenue Accounting for Approximately 43.8% of its Revenue

KUALA LUMPUR, Malaysia, Aug. 29, 2023 /PRNewswire/ — Starbox Group Holdings Ltd. (Nasdaq: STBX) (“Starbox” or the “Company”), a service provider of cash rebates, digital advertising, and payment solutions with a goal of becoming a comprehensive AI solutions provider within Southeast Asia, today announced its unaudited financial results for the six months ended March 31, 2023.

Mr. Lee Choon Wooi, Chairman and Chief Executive Officer of Starbox, commented, “We are excited about the results we have accomplished for the first half of fiscal year 2023, where we saw robust growth across almost every key financial metric. Our revenue and net income grew for the first half of fiscal year 2023, demonstrating the fruition of our earlier investments in technology and successful execution of our strategic initiatives, namely new technology-driven services revenue via licensing and/or sale of our technologies. Moving forward, we expect to channel our efforts into continuous technological innovation as we believe technology such as artificial intelligence will be one of our key drivers for revenue growth for the foreseeable future. We plan to keep investing in our artificial intelligence-generated content (AIGC) engine, which we believe will revolutionize how people visualize ideas and provide invaluable tools for businesses across industries. We aim to disrupt the industry with our applications of AI technologies, thereby solidifying our market position, and generating long-term value for our shareholders.”

First Half of Fiscal Year 2023 Financial Highlights

  • Total revenue was $4.0 million for the six months ended March 31, 2023, an increase of 36.1% from $2.9 million for the same period of last year.
  • Income from operations was $2.0 million for the six months ended March 31, 2023, an increase of 3.1% from $1.9 million for the same period of last year.
  • Net income was $1.4 million for the six months ended March 31, 2023, an increase of 8.6% from $1.3 million for the same period of last year.

First Half of Fiscal Year 2023 Operational Highlights

  • Number of advertisers was 22 during the six months ended March 31, 2023, compared to 42 during the six months ended March 31, 2022.
  • Number of members on the GETBATS website and mobile app was 2,518,023 as of March 31, 2023, compared to 2,513,658 as of September 30, 2022.
  • Number of merchants on the GETBATS website and mobile app was 832 as of March 31, 2023, compared to 820 as of September 30, 2022.
  • Number of transactions facilitated through GETBATS website and mobile app was 161,306 during the six months ended March 31, 2023, compared to 188,718 during the six months ended March 31, 2022.

First Half 2023 Financial Results

Revenue

Total revenue was $4.0 million for the six months ended March 31, 2023, an increase of 36.1% from $2.9 million for the same period of last year. The increase in revenue was primarily due to increases in the revenue from our newly established software licensing service segment.

  • Revenue from digital advertising service was $2.2 million for the six months ended March 31, 2023, which decreased by 23.7% from $2.9 million for the same period of last year. The decrease was due to decreases in the number of advertisers for our services in the six months ended March 31, 2023.
  • Revenue from software licensing was $1.7 million for the six months ended March 31, 2023. The Company did not have revenue from software licensing for the same period of last year. On March 24, 2023, the Company’s wholly owned subsidiary, Starbox Technologies Sdn. Bhd., entered into a software licensing agreement with Brandavision Sdn Bhd, a Malaysia company (“Brandavision”). The Company will develop a comprehensive data management system for Brandavision, grant them the access to its vast database, help train the staff of Brandavision with respect to its use and provide continuous technical support.
  • Revenue from cash rebate services was $10,621 for the six months ended March 31, 2023, which increased by 91.3% from $5,552 for the same period of last year. The increase was primarily due to an increase in the average cash rebate commission rate earned by the Company for the six months ended March 31, 2023 as compared to the six months ended March 31, 2022.
  • Revenue from payment solution services was $4,303 for the six months ended March 31, 2023, which decreased by 20.0% from $5,379 for the same period of last year.

Operating Cost

Operating costs were $2.0 million for the six months ended March 31, 2023, which increased by 99.0% from $1.0 million for the same period of last year. The increase was primarily due to the following reasons:

  • Salary and employee benefit expenses were $318,750 for the six months ended March 31, 2023, which increased by $122,846 from $195,904 for the same period of last year, primarily due to an increase in the number of employees from 17 for the six months ended March 31, 2022 to 25 for the six months ended March 31, 2023, in order to handle the increase in business activities associated with the Company’s digital advertising services, cash rebate services, and the newly expanded business in software licensing services.
  • Marketing and promotional expenses were $209,564 for the six months ended March 31, 2023, which increased by $104,756 from $104,808 for the same period of last year, as a result of our increased marketing efforts to develop new merchants and advertisers for our services.
  • License costs were $30,000 for the six months ended March 31, 2023, which increased by $4,941 from $25,059 for the same period of last year.
  • Website and facility maintenance expenses were $147,345 for the six months ended March 31, 2023, which increased by $97,620 from $49,725 for the same period of last year, primarily because the Company incurred more costs to optimize and upgrade its IT system related to rebate calculation and AI calculation engine.
  • Utility and office expenses were $251,563 million for the six months ended March 31, 2023, which increased by $194,784 from $56,779 for the same period of last year, primarily due to increased office insurance expenses and increased office supply expenses resulting from an increased number of staff.
  • Depreciation and amortization expenses were $193,662 for the six months ended March 31, 2023, which increased by $149,515, from $44,147 for the same period of last year, mainly due to increased amortization of intangible assets.
  • Business travel and entertainment expenses were $71,479 for the six months ended March 31, 2023, which increased by $53,957 from $17,522 for the same period of last year, due to the Company’s increased efforts to expand its business operations into local and neighboring countries.
  • Others were $344,633 for the six months ended March 31, 2023, which increased by $304,175 from $40,458 for the same period of last year, primally due to (i) increased trademark expenses by $69,990 and (ii) increased bonus by $176,635.

Provision for Income Taxes

Provision for income taxes was $0.6 million for the six months ended March 31, 2023, which decreased by 5.4% from $0.7 million for the same period of last year.

Net Income

Net income was $1.4 million for the six months ended March 31, 2023, which increased by $0.1 million from $1.3 million for the same period of last year.

Basic Earnings per Share

Basic earnings per share was $0.03 for the six months ended March 31, 2023, compared to basic and diluted earnings per share of $0.03 for the same period of last year.

Balance Sheet

As of March 31, 2023, the Company had cash of $0.9 million, compared to $17.8 million as of September 30, 2022.

Cash Flow

Net cash used in operating activities was $12.1 million for the six months ended March 31, 2023, compared to net cash provided by operating activities of $1.5 million for the same period of last year.

Net cash used in investing activities was $17.9 million for the six months ended March 31, 2023, compared to $0.6 million for the same period of last year.

Net cash provided by financing activities was $11.8 million for the six months ended March 31, 2023, compared to net cash used in financing activities of $0.8 million for the same period of last year.

About Starbox Group Holdings Ltd.

Headquartered in Malaysia, Starbox Group Holdings Ltd. is a technology-driven, rapidly growing company with innovation as its focus. Starbox is aiming to be a comprehensive AI solutions provider within Southeast Asia and also engages in building a cash rebate, digital advertising, and payment solution business ecosystem targeting micro, small, and medium enterprises that lack the bandwidth to develop an in-house data management system for effective marketing. The Company connects retail merchants with retail shoppers to facilitate transactions through cash rebates offered by retail merchants on its GETBATS website and mobile app. The Company provides digital advertising services to advertisers through its SEEBATS website and mobile app, GETBATS website and mobile app and social media. The Company also provides payment solution services to merchants. For more information, please visit the Company’s website: https://ir.starboxholdings.com.

Forward-Looking Statements

Certain statements in this announcement are forward-looking statements. These forward-looking statements involve known and unknown risks and uncertainties and are based on the Company’s current expectations and projections about future events that the Company believes may affect its financial condition, results of operations, business strategy and financial needs. Investors can identify these forward-looking statements by words or phrases such as “approximates,” “assesses,” “believes,” “hopes,” “expects,” “anticipates,” “estimates,” “projects,” “intends,” “plans,” “will,” “would,” “should,” “could,” “may” or similar expressions. The Company undertakes no obligation to update or revise publicly any forward-looking statements to reflect subsequent occurring events or circumstances, or changes in its expectations, except as may be required by law. Although the Company believes that the expectations expressed in these forward-looking statements are reasonable, it cannot assure you that such expectations will turn out to be correct, and the Company cautions investors that actual results may differ materially from the anticipated results and encourages investors to review other factors that may affect its future results in the Company’s registration statement and other filings with the U.S. Securities and Exchange Commission.

For more information, please contact:

Starbox Group Holdings Ltd.

Investor Relations
Department Email:
ir@starboxholdings.com

Ascent Investors Relations LLC

Tina Xiao
Phone: +1 917-609-0333
Email: tina.xiao@ascent-ir.com

STARBOX GROUP HOLDINGS LTD AND SUBSIDIARIES

CONDENSED CONSOLIDATED BALANCE SHEETS

As of

March 31, 2023

As of

September 30,
2022

(Unaudited)

ASSETS

CURRENT ASSETS

Cash and equivalents

$

864,392

$

17,778,895

Accounts receivable, net

4,986,688

2,032,717

Prepaid income tax

552,094

Prepayments

14,448,012

4,269,611

Due from related parties

1,682

1,473

Total current assets

20,852,868

24,082,696

NON-CURRENT ASSETS

Property and equipment, net

21,941

13,380

Intangible assets, net

18,824,416

903,768

Right-of-use assets, net

36,511

42,574

Total non-current assets

18,882,868

959,722

TOTAL ASSETS

$

39,735,736

$

25,042,418

LIABILITIES AND SHAREHOLDERS’ EQUITY

CURRENT LIABILITIES

Taxes payable

$

395,772

$

1,404,128

Deferred revenue

368,066

Accrued liabilities and other current liabilities

348,627

541,050

Operating lease liabilities, current

17,052

15,833

Due to related parties

1,409

7,361

Total current liabilities

1,130,926

1,968,372

NON-CURRENT LIABILITIES

Deferred tax liabilities, net

318,603

Operating lease liabilities, non-current

19,459

26,741

Total non-current liabilities

338,062

26,741

TOTAL LIABILITIES

1,468,988

1,995,113

COMMITMENT AND CONTINGENCY

SHAREHOLDERS’ EQUITY

Preferred shares, par value $0.001125, 5,000,000 shares
authorized, no shares issued and outstanding

Ordinary shares, par value $0.001125, 883,000,000 shares
authorized, 54,375,000 shares and 45,375,000 shares issued and
outstanding as of March 31, 2023 and September 30, 2022,
respectively

61,172

51,047

Additional paid in capital

30,674,988

18,918,303

Accumulated other comprehensive income (loss)

1,481,084

(607,052)

Retained earnings

6,049,504

4,685,007

Total shareholders’ equity

38,266,748

23,047,305

TOTAL LIABILITIES AND SHAREHOLDERS’ EQUITY

$

39,735,736

$

25,042,418

STARBOX GROUP HOLDINGS LTD AND SUBSIDIARIES

UNAUDITED CONDENSED CONSOLIDATED STATEMENTS OF OPERATIONS AND

COMPREHENSIVE INCOME

SIX MONTHS ENDED MARCH 31,

2023

2022

Operating revenue

Revenue from cash rebate services

$

10,621

$

5,552

Revenue from digital advertising services

2,220,794

2,911,482

Revenue from payment solution services

4,303

5,379

Revenue from software licensing

1,740,472

Total operating revenue

3,976,190

2,922,413

Operating expenses

Selling, general, and administrative expenses

1,996,892

1,003,373

Total operating expenses

1,996,892

1,003,373

Income from operations

1,979,298

1,919,040

Other income, net

Interest income

7,757

Other income, net

5,163

203

Total other income, net

12,920

203

Income before income tax

1,992,218

1,919,243

Income tax expenses

627,721

663,224

Net income

$

1,364,497

$

1,256,019

Other Comprehensive income

Foreign currency translation gain (loss)

2,088,136

(9,188)

Total Comprehensive income

$

3,452,633

$

1,246,831

Net income per share – basic

$

0.03

$

0.03

Weighted average number of common shares outstanding – basic

53,089,286

40,000,000

STARBOX GROUP HOLDINGS LTD AND SUBSIDIARIES

UNAUDITED CONDENSED CONSOLIDATED STATEMENTS OF CASH FLOWS

FOR SIX MONTHS ENDED MARCH
31,

2023

2022

CASH FLOWS FROM OPERATING ACTIVITIES:

Net income

$

1,364,497

$

1,256,019

Adjustments to reconcile net income to cash provided by (used in)
operating activities:

Disposal of fixed assets

2,928

Depreciation and amortization

253,662

69,147

Amortization of right-of-use operating lease assets

9,111

42,974

Change in deferred tax

313,963

Changes in operating assets / liabilities:

Accounts receivable

(2,809,804)

(1,326,333)

Prepaid income tax

(544,054)

Prepaid expenses and other current assets

(9,621,687)

(63,935)

Deferred revenue

362,706

579,355

Taxes payable

(1,063,540)

834,895

Operating lease liabilities

(9,111)

(42,974)

Accrued expenses and other current liabilities

(407,590)

177,101

Net cash provided by (used in) operating activities

(12,148,919)

1,526,249

CASH FLOWS FROM INVESTING ACTIVITIES:

Purchase of fixed assets

(13,183)

(5,011)

Purchase of intangible assets

(17,864,000)

(626,420)

Net cash used in investing activities

(17,877,183)

(631,431)

CASH FLOWS FROM FINANCING ACTIVITIES:

Deferred initial public offering costs

(423,994)

Proceeds from equity financing

11,766,810

Increase in due from related party

(134)

Repayment of related party borrowings

(6,232)

(398,422)

Net cash provided by (used in) financing activities

11,760,444

(822,416)

EFFECT OF EXCHANGE RATE CHANGES ON CASH

1,351,155

(8,955)

NET INCREASE (DECREASE) IN CASH & EQUIVALENTS

(16,914,503)

63,447

CASH & EQUIVALENTS, BEGINNING OF PERIOD

17,778,895

2,295,277

CASH & EQUIVALENTS, END OF PERIOD

864,392

2,358,724

Supplemental Cash Flow Data:

Income tax paid

$

2,011,188

$

Interest paid

$

$

Source: Starbox Group Holdings Ltd.