Tag Archives: FNT

FinVolution Group Chairman Continues to Purchase Company Shares

SHANGHAI, Oct. 30, 2020 — FinVolution Group ("FinVolution", or the "Company") (NYSE: FINV), a leading fintech platform in China, today announced that Mr. Shaofeng Gu, Chairman and Chief Innovation Officer of the Company, has informed the Company that he purchased approximately in his personal capacity 0.4 million of the Company’s American Depositary Shares ("ADSs") in the third quarter of 2020. The ADSs purchased are in addition to those Mr. Gu purchased in the first and second quarters of 2020, as previously disclosed, and are independent of the Company’s share repurchase programs. All the ADSs purchased were made during an open window period and in full compliance with all Company and legal guidelines.

Mr. Gu commented, "Our strategy of acquiring better quality borrowers driven by our proprietary AI technologies has led to significant improvement in credit risk performance on the Company’s platform. Our continued investment in technologies has also enabled us to tap into new opportunities by empowering financial institutions to digitally transform their consumer finance business operations. I believe the current share price deeply undervalues the potential of the Company and serves as a highly attractive investment opportunity".

As of September 30, 2020, Mr. Shaofeng Gu beneficially owned 414,256,580 ordinary shares, representing approximately 28.9% of ownership in the Company.

Safe Harbor Statement

This press release contains forward-looking statements. These statements constitute "forward-looking" statements within the meaning of Section 21E of the Securities Exchange Act of 1934, as amended, and as defined in the U.S. Private Securities Litigation Reform Act of 1995. These forward-looking statements can be identified by terminology such as "will," "expects," "anticipates," "future," "intends," "plans," "believes," "estimates," "target," "confident" and similar statements. Such statements are based upon management’s current expectations and current market and operating conditions and relate to events that involve known or unknown risks, uncertainties and other factors, all of which are difficult to predict and many of which are beyond the Company’s control. Forward-looking statements involve risks, uncertainties and other factors that could cause actual results to differ materially from those contained in any such statements. Potential risks and uncertainties include, but are not limited to, uncertainties as to the Company’s ability to attract and retain borrowers and investors on its marketplace, its ability to increase volume of loans facilitated through the Company’s marketplace, its ability to introduce new loan products and platform enhancements, its ability to compete effectively, laws, regulations and governmental policies relating to the online consumer finance industry in China, general economic conditions in China, and the Company’s ability to meet the standards necessary to maintain listing of its ADSs on the NYSE, including its ability to cure any non-compliance with the NYSE’s continued listing criteria. Further information regarding these and other risks, uncertainties or factors is included in the Company’s filings with the U.S. Securities and Exchange Commission. All information provided in this press release is as of the date of this press release, and FinVolution does not undertake any obligation to update any forward-looking statement as a result of new information, future events or otherwise, except as required under applicable law.

About FinVolution Group

FinVolution Group is a leading fintech platform in China connecting underserved individual borrowers with financial institutions. Established in 2007, the Company is a pioneer in China’s online consumer finance industry and has developed innovative technologies and has accumulated in-depth experience in the core areas of credit risk assessment, fraud detection, big data and artificial intelligence. The Company’s platform, empowered by proprietary cutting-edge technologies, features a highly automated loan transaction process, which enables a superior user experience. As of June 30, 2020, the Company had over 110.4 million cumulative registered users.

For more information, please visit http://ir.finvgroup.com

For investor and media inquiries, please contact:

In China:
FinVolution Group
Head of Investor Relations
Jimmy Tan
Tel: +86 (21) 8030 3200- Ext 8601
E-mail: ir@xinye.com

The Piacente Group, Inc.
Jenny Cai
Tel: +86 (10) 6508-0677
E-mail: finv@tpg-ir.com

In the United States:
The Piacente Group, Inc.  
Brandi Piacente
Tel: +1-212-481-2050
E-mail: finv@tpg-ir.com

Related Links :

http://ir.finvgroup.com

PINTEC Announces RMB400 Million Financing under Equity Transfer Agreements

BEIJING, Oct. 27, 2020 — Pintec Technology Holdings Limited (Nasdaq: PT) ("PINTEC" or the "Company"), a leading independent technology provider enabling financial services in China, today announced that Pintec (Yinchuan) Technology Co., Ltd. (the "Transferee"), a wholly-owned subsidiary of the Company, entered into certain equity transfer agreements (the "Agreements"), pursuant to which Ningxia Fengyin Enterprise Management Consulting LLP (the "Transferor") agreed to transfer all the outstanding equity interests in Yinchuan Chuanxi Technology Co., Ltd. ("Chuanxi Technology"), to the Transferee, in exchange for a total consideration of RMB400,000,000 (the "Consideration").  The parties agreed that Chuanxi Technology shall have an aggregate of no less than RMB400,000,000 in its bank account which is available for use at a specific date to be agreed by the parties. The transactions under the Agreements were closed on October 22, 2020.

The terms of the Consideration include the following features:

  • The full Consideration must be repaid by the Transferee within 20 days after the third anniversary of the closing date as defined under the Agreements (the "Closing Date").
  • To satisfy the payment obligation for the Consideration, the Company shall issue a warrant (the "Warrant") to an entity designated by the Transferor to subscribe in a private placement, for 320,036,576 class A ordinary shares of the Company, par value US$0.000125 per share (the "Warrant Shares").
  • The number of Warrant Shares is calculated by the U.S. dollar equivalent of the Consideration divided by US$0.1857 per share, which is equivalent to US$1.30 per American depositary share (each an "ADS"), representing approximately a 25.0% premium to the 45-day volume weighted average price of the ADSs.
  • The Warrant is exercisable immediately at the par value per Warrant Share and will expire on the third anniversary of the issuance date.
  • If the Warrant is fully exercised before its expiration date, the Transferee will be released from the obligation to pay the Consideration.
  • If the Warrant is not fully exercised before its expiration date, the Transferee will be required to pay the portion of the Consideration not reflected by the Warrant Shares (to the extent exercised) within 20 days after the expiration date of the Warrant. The Transferee is also obligated to pay an annual interest of 8.75% for any unpaid portion of the Consideration on a quarterly basis.
  • In connection with this transaction, the Transferee will cause its affiliates to pledge all equity interests of a subsidiary of the Company to the Transferor or a party designated by the Transferor within 20 days of the Closing Date.

Mr. Steven Sim, Chief Financial Officer of PINTEC, stated, "We are pleased to have successfully completed this financing even under the current challenging environment, and we appreciate the investors’ confidence in our business innovation. This transaction supports our strategic transformation, and the funds are intended for investment and acquisition in digital technology services, as well as general corporate purposes. We will continue to optimize our industry-leading tools and provide best-of-class solutions to digitally empower the way our partners conduct business in the financial markets. Finally, the cash injection from this transaction will further solidify our liquidity position, strengthen our balance sheet, and enhance our financial flexibility."

About PINTEC

PINTEC is a leading independent technology platform enabling financial services in China. By connecting business and financial partners, PINTEC enables them to provide financial services to end users efficiently and effectively. The Company offers its partners a full suite of customized solutions, ranging from digital retail lending, digital business lending, robotic process automation, to wealth management and insurance products. Leveraging its scalable and reliable technology infrastructure, PINTEC serves a wide range of industry verticals covering online travel, e-commerce, telecommunications, online education, SaaS platforms, financial technology, internet search, and online classifieds and listings, as well as various types of financial partners including banks, brokers, insurance companies, investment funds and trusts, consumer finance companies and other similar institutions. For more information, please visit ir.pintec.com.

About Chuanxi Technology

Chuanxi Technology is a limited liability company incorporated under the laws of the People’s Republic of China on September 27, 2020, and a wholly-owned subsidiary of Ningxia Fengyin Enterprise Management Consulting LLP. Although Chuanxi Technology does not currently engage in any business activities, it is registered to engage in consulting services for various sectors including information technology, education, etc.

Safe Harbor Statement

This press release contains forward-looking statements. These statements constitute "forward-looking" statements within the meaning of Section 21E of the Securities Exchange Act of 1934, as amended, and as defined in the U.S. Private Securities Litigation Reform Act of 1995. These forward-looking statements can be identified by terminology such as "will," "expects," "anticipates," "future," "intends," "plans," "believes," "estimates," "target," "confident" and similar statements. Among other things, the quotations from management in this announcement, as well as PINTEC’s strategic and operational plans, contain forward-looking statements. PINTEC may also make written or oral forward-looking statements in its periodic reports to the U.S. Securities and Exchange Commission, in its annual report to shareholders, in press releases and other written materials and in oral statements made by its officers, directors or employees to third parties. Such statements are based upon management’s current expectations and current market and operating conditions, and relate to events that involve known or unknown risks, uncertainties and other factors, all of which are difficult to predict and many of which are beyond the Company’s control. Forward-looking statements involve inherent risks, uncertainties and other factors that could cause actual results to differ materially from those contained in any such statements. Potential risks and uncertainties include, but are not limited to, the Company’s limited operating history, regulatory uncertainties relating to online consumer finance in China, the Company’s reliance on Jimu Group for a significant portion of its funding and the need to further diversify its financial partners, the Company’s reliance on a limited number of business partners, the impact of current or future PRC laws or regulations on wealth management financial products, publicity regarding the consumer finance industry and the evolving regulatory environment governing this industry in China, and the Company’s ability to meet the standards necessary to maintain the listing of its ADSs on the Nasdaq Global Market, including its ability to cure any non-compliance with Nasdaq’s continued listing criteria. Further information regarding these and other risks, uncertainties or factors is included in the Company’s filings with the U.S. Securities and Exchange Commission. All information provided in this press release is as of the date of this press release, and the Company does not undertake any obligation to update any forward-looking statement as a result of new information, future events or otherwise, except as required under applicable law.

For investor and media inquiries, please contact:
Joyce Tang
Pintec Technology Holdings Ltd.
Phone: +86 (10)  8564-3600
E-mail:
ir@pintec.com

Related Links :

https://ir.pintec.com/

VeChain, Renji Hospital and DNV GL Held Strategic Partnership Signing Ceremony To Launch World’s First Blockchain Intelligent Tumor Treatment Center


SHANGHAI, Oct. 27, 2020 — In partnership with VeChain and DNV GL, Renji Hospital, a top-ranked hospital in China affiliated with the Shanghai Jiaotong University School of Medicine, has announced the launch of the world’s first blockchain-enabled Intelligent Tumor Treatment Center on October 20, 2020. The Intelligent Tumor Treatment Center is a transparent, efficient, and traceable medical management solution powered by VeChain ToolChainTM.

Sunny Lu, Co-founder and CEO of VeChain & Jidong Zhang, Vice President of Renji Hospital & George Kang, Senior Vice President of DNV GL Group

As strategic partners of this new initiative, VeChain and DNV GL will jointly support the hospital in the quest to improve global public health through state-of-the-art blockchain technology and professional advisory.

VeChain ToolChainTM Powers The World’s First Intelligent Tumor Treatment Center 

The Intelligent Tumor Treatment Center combines the advantages of VeChain blockchain technology with DNV GL’s professional services. It enables full patient ownership of personal medical records, allowing patients to take control of the authorization and medical records data management. Research institutions inside and outside the hospital can use authorized data to improve the efficiency of clinical research, and regulatory agencies can use authorized data to conduct business compliance checks on medical institutions and establish a credit evaluation system.

Zhang Jidong, Vice President of Renji Hospital, said, "The launch of the Intelligent Tumor Treatment Centre intends to enhance high-quality integrated development of Renji Hospital. Moving forward, Renji intends to boost our healthcare facilities with more blockchain-powered use cases and projects, which will be gradually disclosed together with our partners when the time is right."

George Kang, Senior Vice President of DNV GL Group, said, "Through independent and objective medical evaluation methods, DNV GL intends to provide more services for Renji Hospital to improve its service quality and medical experience, moving to a new stage of higher standards, higher requirements and higher quality."

Sunny Lu, co-founder and CEO of VeChain, said, "As digital transformation accelerates in the healthcare sector, VeChain will continue to demonstrate its advantages and flexibility as a superior blockchain platform that is suitable for all types of use cases and industries. We are very proud and excited to be contributing to the public health industry by providing the technology for Renji Hospital’s Intelligent Tumor Treatment Centre."

VeChain Facilitating Digital Transformation To Improve Public Health

In line with the Chinese Government’s 14th Five-Year (2021-2025) Plan for Economic and Social Development, the National Health Commission formulated an official guideline and re-emphasized blockchain technology as an essential innovation and integration of the medical and health industry. VeChain is committed to solving the pain points of digital medical reform through blockchain technology and balancing personal privacy and public interests.

By using the self-developed one-stop data BaaS platform VeChain ToolChainTM , we have many proven cases in the medical sector, including a blockchain powered Clinical Trial Traceability Platform for Bayer China, and a blockchain-enabled medical data management platform named The E-NewHealthLife for Mediterranean Hospital of Cyprus. Facing new demands for digital transformation brought by COVID-19, VeChain, together with DNV GL, will be seeking for more opportunities to create more high-efficiency and low-cost digital solutions for the medical industry.

About VeChain
Launched in 2015, VeChain connects blockchain technology to the real world by providing a comprehensive governance structure, a robust economic model, and IoT integration. VeChain is the pioneer of real-world applications using public blockchain technology, with international operations in Singapore, Luxembourg, Tokyo, Shanghai, Paris, Hong Kong, and San Francisco. Together with our strategic partners PwC and DNV GL, we have established cooperative relations with many leading enterprises in different industries, including Walmart China, BMW, BYD Auto, Haier, H&M, LVMH, D.I.G, ENN, Shanghai Gas, AWS, PICC, ASI etc. Website: www.vechain.com

About Renji Hospital
Built in 1844, Renji Hospital has a history of over 170 years. It has been the first western medicine hospital since the opening of Shanghai. With an integration of medical treatment, teaching and scientific research, it is a comprehensive 3A hospital (the top level of hospital ranking in China) with a complete range of disciplines. Up to now, Renji Hospital consists of five  areas in total. Below is the timeline of the development process of Renji Hospital.

About DNV GL
DNV GL is a leading provider of risk management and quality assurance services. The company is also a global leader in certifying management systems of companies across all types of industries, including F&B. Since 1864, its purpose has been to safeguard life, property and the environment. Passionate about safety, quality and integrity, companies turn to DNV GL to make complex decisions with confidence. DNV GL helps them manage their most critical risks and demonstrate compliance with regulations and standards.

Photo – https://techent.tv/wp-content/uploads/2020/10/vechain-renji-hospital-and-dnv-gl-held-strategic-partnership-signing-ceremony-to-launch-worlds-first-blockchain-intelligent-tumor-treatment-center.jpg
Logo – https://techent.tv/wp-content/uploads/2020/10/vechain-renji-hospital-and-dnv-gl-held-strategic-partnership-signing-ceremony-to-launch-worlds-first-blockchain-intelligent-tumor-treatment-center-2.jpg


Related Links :

http://www.vechain.com

TerraPay strengthens its entry in North America with FINTRAC Canada MSB License


TORONTO and HAGUE, Netherlands, Oct. 26, 2020Canada’s growth lends itself to an increasing population of immigrants boosting the economy. Fuelling its aim to attract migrants to the nation in the next few years calls for a seamless and secure framework to facilitate the money transfer requirements of all participants in the payments ecosystem.

As per the World Bank data estimated in 2018*, the outward remittance value of US$ 27B from Canada, with a growing share of digital remittances, reflect a global move towards cashless economies.

With an aim to further strengthen this drive to cater efficiently to the dynamic money transfer needs of the industry, TerraPay, a leading global payments infrastructure company, has recently announced its MSB registration with the Financial Transactions and Reports Analysis Centre of Canada (FINTRAC).

This license will facilitate the Company’s unparalleled and robust cross-border payments infrastructure to mobilize international remittances from the region in real-time, at low costs, and help offer diverse value added financial payment services to TerraPay’s partners and their customers.

The FINTRAC license adds to TerraPay’s 45+ regulatory approvals and local licences, now connecting Canadian immigrants to our global partner networks – 2B Bank Accounts, 500+M mobile wallets- across 100 countries, and 58+ settlement currencies.

Ambar Sur, Founder and CEO, TerraPay speaks on this proud moment, "The FINTRAC licence is a strategic boost to our commitment in driving digital interoperability across countries. We are well equipped to service the payment requirements of our partners and their customers in Canada. We work towards ensuring global access to all participants and innovation in the payments ecosystem."

*World Bank 2018 data

About TerraPay

TerraPay is a licenced digital payments infrastructure and solutions provider, paving the global payments highway. The company’s robust foundation and new-age platform technology serves as the digital interoperability engine enabling customers and businesses globally to send and receive payments in a secure, transparent, efficient and real-time basis. The agile network supports diverse payment instruments and types of payments, while adhering to complex regulations and compliance standards in different markets.

Media Contact:
Anwesha Mukherjee
+91 9717241606


Future Fintech and Spondula Terminated the Negotiation of Potential Acquisition

BEIJING, Oct. 24, 2020 — Future FinTech Group Inc. (NASDAQ: FTFT) (hereinafter referred to as "Future Fintech", "FTFT" or "Company" ") a leading blockchain e-commerce company and a service provider for financial technology, today announced the parties have mutually agreed to terminate the negotiation of the potential acquisition of Spondula, previously announced by the Company on September 22, 2020. The parties have not been able to agree on the final business terms for the potential acquisition and have mutually agreed to terminate the potential transaction contemplated in the non-binding letter of intent entered by the Company, Spondula and its shareholder on September 19, 2020.

The Company strategy remains to focus on development of business of global challenger banking and payment system through acquisitions.

About Future FinTech Group Inc.

Future FinTech Group Inc. ("Future FinTech", "FTFT" or the "Company") is a leading blockchain e-commerce company and a service provider for financial technology incorporated in Florida. The Company’s operations include a blockchain-based online shopping mall platform, Chain Cloud Mall ("CCM"), a cross-border e-commerce platform (NONOGIRL), an incubator for blockchain based application projects. The Company is also engaged in the development of blockchain based e-Commerce technology as well as financial technology. For more information, please visit http://www.ftftex.com/.

Safe Harbor Statement

Certain of the statements made in this press release are "forward-looking statements" within the meaning and protections of Section 27A of the Securities Act of 1933, as amended and Section 21E of the Securities Exchange Act of 1934, as amended, or the Exchange Act. Forward-looking statements include statements with respect to our beliefs, plans, objectives, goals, expectations, anticipations, assumptions, estimates, intentions, and future performance, and involve known and unknown risks, uncertainties and other factors, which may be beyond our control, and which may cause the actual results, performance, capital, ownership or achievements of the Company to be materially different from future results, performance or achievements expressed or implied by such forward-looking statements. All statements other than statements of historical fact are statements that could be forward-looking statements. You can identify these forward-looking statements through our use of words such as "may," "will," "anticipate," "assume," "should," "indicate," "would," "believe," "contemplate," "expect," "estimate," "continue," "plan," "point to," "project," "could," "intend," "target" and other similar words and expressions of the future.

All written or oral forward-looking statements attributable to us are expressly qualified in their entirety by this cautionary notice, including, without limitation, those risks and uncertainties described in our annual report on Form 10-K for the year ended December 31, 2019 and our other reports and filings with SEC. Such reports are available upon request from the Company, or from the Securities and Exchange Commission, including through the SEC’s Internet website at http://www.sec.gov. We have no obligation and do not undertake to update, revise or correct any of the forward-looking statements after the date hereof, or after the respective dates on which any such statements otherwise are made.

Xinhua Silk Road: Annual Conference of Financial Street Forum 2020 held to craft four platform functions to sharpen global influence

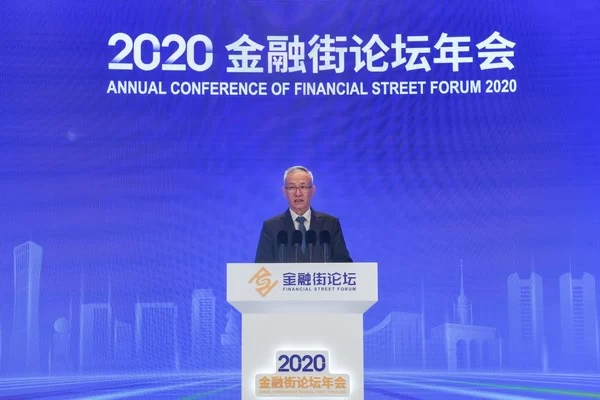
BEIJING, Oct. 23, 2020 — The Annual Conference of Financial Street Forum 2020, which opened on Wednesday and lasts till Friday, is crafted as a flagship international event characterized by four platform functions to sharpen its global influence.

Chinese Vice Premier Liu He, also a member of the Political Bureau of the Communist Party of China Central Committee, attended the opening ceremony of the Annual Conference of Financial Street Forum 2020 in Beijing, capital of China, Oct. 21, 2020.

Themed on "Financial Cooperation and Reform under Global Changes", the annual conference aims to form itself as platforms for China’s participation in global financial governance, global financial industry communications and cooperation, interaction between financial sector and the real economy and national financial policies releasing.

This year, parallel forums are divided into four sections including financial cooperation and reform, financial services and development, financial opening and financial market, financial technology and innovation, centering upon 25 sessions.

The annual conference is jointly organized by the People’s Government of Beijing Municipality, the People’s Bank of China (PBOC), Xinhua News Agency, China Banking and Insurance Regulatory Commission (CBIRC), China Securities Regulatory Commission (CSRC) and the State Administration of Foreign Exchange (SAFE).

PBOC hosts two keynote sub-forums under the annual conference and will release financial technology (fintech) development indicators to shape a set of scientific, quantifiable and comprehensive sector development appraisal standards applicable in China or even in the world.

Xu Yuchang, chairman and president of China Economic Information Service (CEIS) of Xinhua News Agency said the parallel forum themed on "Belt and Road Cooperation in the New Financial Landscape" is organized by Xinhua News Agency and implemented by CEIS. The Belt and Road Initiative is an important move of China to widen opening-up and share fruits of development with the world and has aroused wide attention from the international community. The parallel forum has attracted representatives from financial institutions, enterprises and research institutes to register for participation.

CSRC organizes two parallel forums of the annual conference and four sessions including capital market basic rules and ecology construction, building world class investment banks and wealth management institutions, small- and medium-sized enterprises development and high efficiency in direct financing, and deepening reform on the "new third board" to better serve the real economy.

SAFE undertakes hosting work of keynote sub-forums on cross-border capital flow and opening of RMB capital account of higher level and discussions over capital account convertibility, cross-border capital flow and financial risk prevention are carried out on the sub-forums.

https://en.imsilkroad.com/p/316982.html

Related Links :

https://en.imsilkroad.com

CLPS Incorporation Reports Financial Results for the Second Half and Full Year of Fiscal 2020

HONG KONG, Oct. 23, 2020 — CLPS Incorporation (the "Company" or "CLPS") (Nasdaq: CLPS), today announced its financial results for the six months ended June 30, 2020 and full year of fiscal year 2020.

Second Half of Fiscal 2020 Highlights (all results compared to the six months ended June 30, 2019) 

  • Revenues increased by 37.2% to $46.8 million from $34.1 million.
  • Gross profit increased by 25.1% to $15.7 million from $12.6 million.
  • Net income attributable to CLPS Incorporation’s shareholders was $0.6 million, or $0.04 basic and diluted earnings per share, compared to net loss attributable to CLPS Incorporation’s shareholders of $1.8 million, or $0.13 basic and diluted losses per share.
  • Non-GAAP net income attributable to CLPS Incorporation’s shareholders1 increased by 200.9% to $3.5 million, or $0.23 basic and diluted earnings per share, compared to $1.2 million, or $0.08 basic and diluted earnings per share (See Use of Non-GAAP Financial Measures below for a discussion of such measures as used in this press release).

Fiscal Year 2020 Highlights (all results compared to the twelve months ended June 30, 2019) 

  • Revenues increased by 37.7% to $89.4 million from $64.9 million.
  • Gross profit increased by 31.0% to $31.1 million from $23.8 million.
  • Net income attributable to CLPS Incorporation’s shareholders was $2.9 million, or $0.20 basic and diluted earnings per share, compared to net loss attributable to CLPS Incorporation’s shareholders of $3.3 million, or $0.24 basic and diluted losses per share.
  • Non-GAAP net income attributable to CLPS Incorporation’s shareholders1 increased by 85.3% to $6.9 million, or $0.47 basic and diluted earnings per share, compared to $3.7 million, or $0.27 basic and diluted earnings per share (See Use of Non-GAAP Financial Measures below for a discussion of such measures as used in this press release).

Mr. Raymond Lin, Co-Founder and Chief Executive Officer of CLPS, commented, "As the disruption from the COVID-19 pandemic persists, the health and safety of our employees and their families, as well as our customers and business partners, have been and will continue to be our top priority. Despite the current circumstances, we are pleased to see stable growth in the second half and full year of fiscal 2020 in both our international and local markets. This year, we acquired Ridik to further expand our business in the Southeast Asia; in addition, we opened CLPS California, which will support our U.S. market. Locally, we have invested in Shenzhen Huaqin Robotics and Guangdong Zhichuang Software Technology to further enrich our business services and to provide better service to our clients."

"Cultivating young talent has always been important to us. We are currently cooperating with Technological and Higher Education Institute of Hong Kong and its information technology program to maintain a robust applicant pool and recruit young talent to join our company." 

"Going forward, we will continue to expand our business and grow our market share, both internationally and locally. We hope to achieve sustainable, high-quality growth for CLPS as we create long-term value for our shareholders."

Ms. Rui Yang, acting Chief Financial Officer of CLPS, commented, "During the second half and full year of fiscal 2020, we are pleased to announce that our revenue increased by double digits year-over-year, by 37.2% and 37.7%, respectively. Net income attributable to CLPS Incorporation’s shareholders was $0.6 million in the second half and $2.9 million in the full year of fiscal 2020. Our basic and diluted earnings per share in the second half of fiscal 2020 was $0.04, and $0.20 for the full-year fiscal 2020. Our non-GAAP basic and diluted earnings per share in the second half of fiscal year 2020 was $0.23, and $0.47 for the full year of fiscal 2020. With our strong balance sheet and outstanding services, we are fully confident in our ability to deliver sustainable value for our shareholders."

Second Half and Fiscal Year 2020 Financial Results

Revenues

In the second half of fiscal 2020, revenues increased by $12.7 million, or 37.2%, to $46.8 million from $34.1 million in the prior year period. For the year ended June 30, 2020, revenues increased by $24.5 million, or 37.7%, to $89.4 million from $64.9 million in the prior year period. This increase in revenue was mainly due to an increase in revenue from IT consulting services.

The number of clients increased by 53, or 30.5%, to 227 for the year ended June 30, 2020 from 174 in the prior year period.  Revenues from top five clients accounted for 47.3% and 50.7% of the Company’s total revenues for fiscal 2020 and 2019, respectively, which reflects decreased in revenue dependence from major clients.

Revenues by Service

  • Revenue from IT consulting services increased by $13.5 million, or 42.3%, to $45.5 million and accounted for 97.2% of total revenue in the second half of fiscal 2020, up from $32.0 million, or 93.7% of total revenue, in the prior year period. For the year ended June 30, 2020, revenue from IT consulting services increased by $25.3 million, or 41.1%, to $87.1 million and accounted for 97.5% of total revenue, up from $61.8 million, or 95.1% of total revenue, in the prior year period. The increase was due to increased demand for the Company’s IT consulting service from banks and other financial institutions, primarily from existing clients. For the twelve months ended June 30, 2020 and 2019, 40.0% and 47.5% of IT consulting services revenue were from international banks, respectively.
  • Revenue from customized IT solution services decreased by $1.0 million, or 45.4%, to $1.1 million in the second half of fiscal 2020 from $2.1 million. Revenue from customized IT solution services decreased by $1.2 million, or 39.3%, to $1.8 million for the year ended June 30, 2020, from $3.0 million in the same period of the previous year. The decrease was primarily due to decreasing demand from existing clients.
  • Revenue from other services increased to $0.2 million in the second half of fiscal year 2020 from $0.04 million in the prior year period. Revenue from other services increased by $0.3 million, or 219.0%, to $0.4 million for the year ended June 30, 2020, from $0.1 million in the prior year period.

Revenues by Operational Areas

  • Revenue from banking area increased by $11.4 million, or 34.3% to $44.5 million for the year ended June 30, 2020, from $33.1 million in the prior year period. Revenue from banking area accounted for 49.8% and 51.2% of total revenues in fiscal 2020 and fiscal 2019, respectively.
  • Revenue from wealth management area increased by $4.7 million, or 32.6% to $19.2 million for the year ended June 30, 2020, from $14.5 million in the prior year period. Revenue from wealth management area accounted for 21.5% and 22.4% of total revenues in fiscal 2020 and fiscal 2019, respectively.
  • Revenue from e-Commerce area increased by $2.4 million, or 27.8% to $11.1 million for the year ended June 30, 2020, from $8.7 million in the prior year period. Revenue from e-Commerce area accounted for 12.4% and 13.4% of total revenues in fiscal 2020 and fiscal 2019, respectively.
  • Revenue from automotive area increased by $1.6 million, or 77.3% to $3.6 million for the year ended June 30, 2020, from $2.0 million in the prior year period. Revenue from automotive area accounted for 4.1% and 3.2% of total revenues in fiscal 2020 and fiscal 2019, respectively.

Revenues by Geography

Revenue generated outside of mainland China increased by 110.0% to $6.3 million in the second half of fiscal year 2020 from $3.0 million in the prior year period. Revenue generated outside of mainland China increased by 133.2% to $10.6 million for the year ended June 30, 2020 from $4.5 million in the prior year period, accounted for 11.8% of total revenue compared to 7.0% in the prior year period. The increase in revenue generated outside mainland China reflects the Company’s successful and continuous global expansion strategy.

Gross Profit and Gross Margin

Gross profit increased by $3.2 million, or 25.1%, to $15.7 million in the second half of fiscal 2020 from $12.6 million in the prior year period. Gross margin in the second half of fiscal 2020 decreased to 33.6% compared to 36.9% in the prior year period. The decrease in gross margin was primarily due to the increase in epidemic prevention cost during the COVID-19 outbreak.

Gross profit increased by $7.3 million, or 31.0%, to $31.1 million for the year ended June 30, 2020, from $23.8 million in the prior year period. Gross margin decreased to 34.8% for the year ended June 30, 2020, compared to 36.6% in the prior year period. The decrease in gross margin was primarily due to the increase in epidemic prevention cost during the COVID-19 outbreak.

Operating Expenses

Selling and marketing expenses increased by $0.5 million, or 37.3%, to $1.7 million in the second half of fiscal 2020 from $1.2 million in the prior year period. Selling and marketing expenses increased by $0.9 million, or 40.4%, to $3.1 million for the year ended June 30, 2020, from $2.2 million in the prior year. The increase was due to the increase of salary expenses as new staffs were hired, enabling the implementation of the Company’s global expansion strategy.

Research and development expenses increased by $0.5 million, or 9.7%, to $5.4 million in the second half of fiscal 2020 from $4.9 million in the prior year period. Research and development expenses increased by $2.4 million, or 30.8%, to $10.4 million for the year ended June 30, 2020 from $8.0 million in the prior year period. The increase primarily resulted from the establishment of four new research projects and the Company’s continued R&D efforts in big data, blockchain, and artificial intelligence (AI).

General and administrative expenses increased by $0.2 million, or 2.7%, to $8.4 million in the second half of fiscal 2020 from $8.2 million in the prior year period. After excluding the impact of non-cash share-based compensation expenses, non-GAAP general and administrative expenses2 increased by $0.4 million, or 8.0%, to $5.7 million in the second half of fiscal 2020 from $5.3 million in the same period of the previous year. The increase in non-GAAP administrative expenses was primarily due to an increase in administrative personnel and M&A related expenses as a result of business expansion.

General and administrative expenses decreased by $1.1 million, or 6.0%, to $16.3 million for the year ended June 30, 2020, from $17.4 million in the prior year period. The decrease was primarily due to the decrease of $3.2 million non-cash share-based compensation expenses. After the deduction of non-cash share-based compensation expenses, non-GAAP general and administrative expenses2 increased by $2.1 million, or 20.5%, to $12.6 million for the year ended June 30, 2020, from $10.4 million in the same period of the previous year. The increase in non-GAAP administrative expenses was primarily due to an increase in administrative personnel and M&A related expenses as a result of business expansion.

Operating Income/Loss

Operating income increased by $1.82 million to $0.04 million in the second half of fiscal 2020 from a loss of $1.78 million in the same period of the previous year. Operating margin was 0.1% in the second half of fiscal 2020, compared to -5.2% in the prior year period.

Operating income increased by $5.1 million to $1.3 million for the year ended June 30, 2020 from a loss of $3.8 million in the same period of the previous year. Operating margin was 1.4% for the year ended June 30, 2020, compared to -5.8% in the prior year period.

Other Income and Expenses

Total other income, net of other expenses increased to $1.1 million in the second half of fiscal 2020 from $0.1 million in the prior year period.

Total other income, net of other expenses increased to $2.4 million for the year ended June 30, 2020, from $0.7 million in the prior year period.

Provision (Benefits) for Income Taxes

Provision for income taxes increased by $0.5 million to $0.4 million in the second half of fiscal 2020 from $0.1 million income tax benefits in the same period of the previous year, mainly due to the reduction in recoverable losses for some of the Company’s subsidiaries.

Provision for income taxes was $0.8 million for the year ended June 30, 2020, compared to $0.2 million in fiscal 2019, mainly due to the reduction in recoverable losses for some of the Company’s subsidiaries.

Net Income/Loss and EPS

Net income for the second half of fiscal 2020 increased by $2.5 million to $0.8 million from a net loss of $1.7 million in the prior year period. After excluding the impact of non-cash share-based compensation expenses, non-GAAP net income3 increased by $2.4 million, or 196.7%, to $3.7 million in the second half of fiscal 2020 from $1.3 million in the same period of the previous year. After excluding the impact of non-controlling interests, net income attributable to CLPS Incorporation’s shareholders in the second half of fiscal 2020 was $0.6 million, or $0.04 basic and diluted earnings per share. After excluding the impact of non-cash share-based compensation expenses, non-GAAP net income attributable to CLPS Incorporation’s shareholders1 in the second half of fiscal 2020 was $3.5 million, or $0.23 basic and diluted earnings per share. This is compared to non-GAAP net income attributable to CLPS Incorporation’s shareholders of $1.2 million, or $0.08 basic and diluted earnings per share, in the second half of fiscal 2019.

Net income for the year ended June 30, 2020 increased by $6.5 million to $3.1 million from a net loss of $3.4 million in the prior year period. The increase in net income was due to the decrease in non-cash share-based compensation expenses. After the deduction of non-cash share-based compensation expenses, non-GAAP net income3 increased by $3.5 million, or 97.7%, to $7.1 million for the year ended June 30, 2020, from $3.6 million in the same period of the previous year. After the deduction of non-controlling interests, net income attributable to CLPS Incorporation’s shareholders for the year ended June 30, 2020, was $2.9 million, or $0.20 basic and diluted earnings per share. After excluding the impact of non-cash share-based compensation expenses, non-GAAP net income attributable to CLPS Incorporation’s shareholders1 for the year ended June 30, 2020, was $6.9 million, or $0.47 basic and diluted earnings per share. This is compared to non-GAAP net income attributable to CLPS Incorporation’s shareholders of $3.7 million, or $0.27 basic and diluted earnings per share, in the prior year period.

Cash Flow

As of June 30, 2020, the Company had cash and cash equivalents of $12.7 million compared to $6.6 million as of June 30, 2019.

Net cash provided by operating activities was approximately $5.9 million for the twelve months ended June 30, 2020. Net cash provided by investing activities was approximately $0.2 million. Net cash provided by financing activities was approximately $0.1 million. The effect of exchange rate change on cash was approximately negative $0.2. The Company believes that its current cash position and cash flow from operations are sufficient to meet its anticipated cash needs for at least the next 12 months.

Financial Outlook

For fiscal year 2021, the Company expects, absent material acquisitions or non-recurring transactions, total sales growth in the range of approximately 30% to 35%, non-GAAP net income growth in the range of approximately 32% to 37% compared to fiscal year 2020 financial results.

This forecast reflects the Company’s current and preliminary views, which are subject to change and are subject to risks and uncertainties, including, but not limited to, potential accounting adjustments attributable to Ridik Pte. Ltd. acquisition as well as various risks and uncertainties facing the Company’s business and operations as identified in its public filings.

Exchange Rate

The balance sheet amounts with the exception of equity as of June 30, 2020, were translated at 7.0651 RMB to 1.00 USD compared to 6.8650 RMB to 1.00 USD as of June 30, 2019. The equity accounts were stated at their historical rate. The average translation rates applied to the income statements accounts for the periods ended June 30, 2020 and 2019 were 7.0309 RMB to 1.00 USD and 6.8211 RMB to 1.00 USD, respectively. The change in the value of the RMB relative to the U.S. dollar may affect our financial results reported in the U.S, dollar terms without giving effect to any underlying change in our business or results of operation.

Conference Call Information

The Company will hold a conference call at 8:30 am ET on October 23, 2020 to discuss second half and full year of fiscal 2020 results. Listeners may access the call by dialing:

U.S. Toll-Free:

+1-888-394-8218

U.S. Local /International:

+1-323-794-2588

Mainland China:

400 120 8590

Hong Kong:

800 961 384

To access the live webcast of the conference call, please visit this link. The live and archived webcast will also be available through the Company’s investor relations website at http://ir.clpsglobal.com.

A replay of the call will be available through November 6, 2020 by dialing:

U.S. Toll-Free:

+1-844-512-2921

U.S. Local/International:

+1-412-317-6671

Passcode:

1612001

About CLPS Incorporation

Headquartered in Hong Kong, CLPS Incorporation (the "Company") (Nasdaq: CLPS) is a global leading information technology ("IT"), consulting and solutions service provider focusing on the banking, insurance and financial sectors. The Company serves as an IT solutions provider to a growing network of clients in the global financial industry, including large financial institutions in the US, Europe, Australia, Southeast Asia and Hong Kong, and their PRC-based IT centers. The Company maintains 18 delivery and/or research & development centers to serve different customers in various geographic locations. Mainland China centers are located in Shanghai, Beijing, Dalian, Tianjin, Baoding, Chengdu, Guangzhou, Shenzhen, Hangzhou, and Suzhou. The remaining eight global centers are located in Hong Kong SAR, USA, UK, Japan, Singapore, Malaysia, Australia, and India. For further information regarding the Company, please visit: http://ir.clpsglobal.com/, or follow CLPS on Facebook, LinkedIn, and Twitter.

Forward-Looking Statements

Certain of the statements made in this press release are "forward-looking statements" within the meaning and protections of Section 27A of the Securities Act of 1933, as amended, and Section 21E of the Securities Exchange Act of 1934, as amended. Forward-looking statements include statements with respect to the Company’s beliefs, plans, objectives, goals, expectations, anticipations, assumptions, estimates, intentions, and future performance, and involve known and unknown risks, uncertainties and other factors, which may be beyond the Company’s control, and which may cause the actual results, performance, capital, ownership or achievements of the Company to be materially different from future results, performance or achievements expressed or implied by such forward-looking statements. All such statements attributable to us are expressly qualified in their entirety by this cautionary notice, including, without limitation, those risks and uncertainties related to the Company’s financial and operational performance in the second half and full year of fiscal 2020, its expectations of the Company’s future performance, its preliminary outlook and guidance offered in this presentation, as well as the risks and uncertainties described in the Company’s most recently filed SEC reports and filings. Such reports are available upon request from the Company, or from the Securities and Exchange Commission, including through the SEC’s Internet website at http://www.sec.gov. We have no obligation and do not undertake to update, revise or correct any of the forward-looking statements after the date hereof, or after the respective dates on which any such statements otherwise are made.

Use of Non-GAAP Financial Measures

The unaudited condensed consolidated financial information is prepared in conformity with accounting principles generally accepted in the United States of America ("U.S. GAAP"), except that the consolidated statement of changes in shareholders’ equity, consolidated statements of cash flows, and the detailed notes have not been presented. The Company uses non-GAAP operating income, non-GAAP operating margin, non-GAAP net income attributable to CLPS Incorporation’s shareholders, and basic and diluted non-GAAP net income per share, which are non-GAAP financial measures. Non-GAAP operating income is operating income excluding share-based compensation expenses. Non-GAAP operating margin is non-GAAP operating income as a percentage of revenues. Non-GAAP net income attributable to CLPS Incorporation’s shareholders is net income attributable to CLPS Incorporation’s shareholders excluding share-based compensation expenses. Basic and diluted non-GAAP net income per share is non-GAAP net income attributable to common shareholders divided by weighted average number of shares used in the calculation of basic and diluted net income per share. The Company believes that separate analysis and exclusion of the non-cash impact of share-based compensation expenses clarity to the constituent parts of its performance. The Company reviews these non-GAAP financial measures together with GAAP financial measures to obtain a better understanding of its operating performance. It uses the non-GAAP financial measure for planning, forecasting and measuring results against the forecast. The Company believes that non-GAAP financial measure is useful supplemental information for investors and analysts to assess its operating performance without the effect of non-cash share-based compensation expenses, which have been and will continue to be significant recurring expenses in its business. However, the use of non-GAAP financial measures has material limitations as an analytical tool. One of the limitations of using non-GAAP financial measures is that they do not include all items that impact the Company’s net income for the period. In addition, because non-GAAP financial measures are not measured in the same manner by all companies, they may not be comparable to other similar titled measures used by other companies. In light of the foregoing limitations, you should not consider non-GAAP financial measure in isolation from or as an alternative to the financial measure prepared in accordance with U.S. GAAP.

The presentation of these non-GAAP financial measures is not intended to be considered in isolation from, or as a substitute for, the financial information prepared and presented in accordance with U.S. GAAP. The Company encourages investors to carefully consider its results under GAAP, as well as its supplemental non-GAAP information and the reconciliation between these presentations, to more fully understand its business. For more information on these non-GAAP financial measures, please see the table captioned "Reconciliations of Non-GAAP and GAAP Results" near the end of this release.

Contact:    

CLPS Incorporation
Rhon Galicha
Investor Relations Office 
Phone: +86-182-2192-5378
Email: ir@clpsglobal.com

1 Non-GAAP net income attributable to CLPS Incorporation’s shareholders is a non-GAAP financial measure, which is defined as net income attributable to the Company excluding share-based compensation expenses. Please refer to the section titled "Reconciliation of GAAP and Non-GAAP Results" for details.

2 Non-GAAP general and administrative expenses is a non-GAAP financial measure, which is defined as general and administrative expenses excluding share-based compensation expenses. Please refer to the section titled "Reconciliation of GAAP and Non-GAAP Results" for details.

3 Non-GAAP net income is a non-GAAP financial measure, which is defined as net income excluding share-based compensation expenses. Please refer to the section titled "Reconciliation of GAAP and Non-GAAP Results" for details.


CLPS INCORPORATION

CONSOLIDATED BALANCE SHEETS

(Amounts in U.S. dollars ("$"), except for number of shares)

As of June 30,

 As of December 31,

2020

(Audited)

2019

(Unaudited)

ASSETS

Current assets

Cash and cash equivalents

$

12,652,120

$

11,234,260

Short-term investments

636,934

Accounts receivable, net

25,753,856

20,857,441

Escrow receivable

200,000

Prepayments, deposits and other assets, net

1,280,967

1,998,499

Prepaid income tax

15,780

524,352

Amounts due from related parties

169,185

252,706

Total Current Assets

40,508,842

35,067,258

Property and equipment, net

452,472

471,886

Intangible assets, net

1,144,579

1,240,490

Goodwill

2,118,700

2,184,001

Long-term investments

680,131

1,102,691

Prepayments, deposits and other assets, net

244,387

220,661

Deferred tax assets, net

203,247

251,912

Total Assets

$

45,352,358

$

40,538,899

LIABILITIES AND SHAREHOLDERS’ EQUITY

Current liabilities

Short-term bank loans

$

2,161,239

$

802,514

Accounts payable and other current liabilities

489,043

1,006,896

Tax payables

1,426,614

1,178,472

Contract liabilities

755,178

1,241,706

Salaries and benefits payable

11,522,268

10,789,713

Total Current Liabilities

16,354,342

15,019,301

Long-term bank loans

22,554

Deferred tax liabilities

163,163

192,127

Unrecognized tax benefits

194,939

 TOTAL LIABILITIES

16,734,998

15,211,428

Commitments and Contingencies

Shareholders’ Equity

Common stock, $0.0001 par value, 100,000,000 shares authorized; 15,930,330
       shares issued and outstanding as of June 30, 2020; 13,913,201 shares
       issued and outstanding as of June 30, 2019. *

1,593

1,425

Additional paid-in capital

28,586,048

25,648,785

Statutory reserves

2,803,811

2,331,138

Retained earnings

(2,680,143)

(2,776,767)

Accumulated other comprehensive loss

(1,362,665)

(960,744)

Total CLPS Incorporation’s Shareholders’ Equity

27,348,644

24,243,837

Non-controlling Interests

1,268,716

1,083,634

Total Shareholders’ Equity

28,617,360

25,327,471

Total Liabilities and Shareholders’ Equity

$

45,352,358

$

40,538,899

* The shares and per share data are presented on a retroactive basis to reflect the nominal share issuance.


CLPS INCORPORATION

UNAUDITED CONSOLIDATED STATEMENTS OF INCOME AND COMPREHENSIVE INCOME

(Amounts in U.S. dollars ("$"), except for number of shares)

For the six months ended

June 30,

2020

2019

Revenues

$

46,847,534

$

34,137,189

Less: Cost of revenues (note 1)

(31,104,457)

(21,552,693)

Gross profit

15,743,077

12,584,496

Operating expenses:

Selling and marketing expenses (note 1)

1,655,650

1,206,153

Research and development expenses

5,416,455

4,939,522

General and administrative expenses (note 1)

8,446,840

8,223,126

Other operating expense

187,496

Total operating expenses

15,706,441

14,368,801

Income (loss) from operations

36,636

(1,784,305)

Subsidies and other income, net

1,163,956

156,352

Other expenses

(77,229)

(30,712)

Income (loss) before income tax and share of loss in equity
    investees

1,123,363

(1,658,665)

Provision (benefits) for income taxes

446,601

(56,283)

Income (loss) before share of income in equity investees

676,762

(1,602,382)

Share of income in equity investees, net of tax

107,895

(145,329)

Net income (loss)

784,657

(1,747,711)

Less: Net income attributable to non-controlling interests

215,359

89,434

Net income (loss) attributable to CLPS Incorporation’s
    shareholders

$

569,298

$

(1,837,145)

Other comprehensive loss (income)

Foreign currency translation loss

$

(432,198)

$

(58,964)

Less: foreign currency translation (loss) gain attributable to non-
    controlling interest

(30,277)

2,052

Other comprehensive loss attributable to CLPS
    Incorporation’s shareholders

$


(401,921)

$


(61,016)

Comprehensive income (loss) attributable to

CLPS Incorporation shareholders

$

167,377

$

(1,898,161)

Non-controlling interests

184,562

1

91,486

$

351,939

$

(1,806,675)

Basic earnings  (loss) per common share*

$

0.04

$

(0.13)

Weighted average number of share outstanding – basic

15,169,655

13,889,460

Diluted  earnings (loss) per common share*

$

0.04

$

(0.13)

Weighted average number of share outstanding – diluted (note 2)

15,212,010

13,889,460

Note:

(1)    Includes share-based compensation expenses as follows:
        
Cost of revenues

9,042

9,472

Selling and marketing expenses

181,257

46,100

General and administrative expenses

2,747,132

2,946,803

(2)  All dilutive potential common shares had anti-dilutive impact and were excluded in computation of diluted
earnings per share in the period when loss was reported.

* The shares and per share data are presented on a retroactive basis to reflect the nominal share issuance.


CLPS INCORPORATION

RECONCILIATION OF NON-GAAP AND GAAP RESULTS

(Amounts in U.S. dollars ("$"), except for number of shares)

For the six months ended 

June 30,

2020

2019

Cost of revenues

$

(31,104,457)

$

(21,552,693)

Less: share-based compensation expenses

9,042

9,472

Non-GAAP cost of revenues

$

(31,095,415)

$

(21,543,221)

Selling and marketing expenses

$

1,655,650

$

1,206,153

Less: share-based compensation expenses

181,257

46,100

Non-GAAP selling and marketing expenses

$

1,474,393

$

1,160,053

General and administrative expenses

$

8,446,840

$

8,223,126

Less: share-based compensation expenses

2,747,132

2,946,803

Non-GAAP general and administrative expenses

$

5,699,708

$

5,276,323

Operating income (loss)

$

36,636

$

(1,784,305)

Add: share-based compensation expenses

2,937,431

3,002,375

Non-GAAP operating income

$

2,974,067

$

1,218,070

Operating margin

0.1%

(5.2%)

Add: share-based compensation expenses

6.2%

8.8%

Non-GAAP operating margin

6.3%

3.6%

Net income (loss)

$

784,657

$

(1,747,711)

Add: share-based compensation expenses

2,937,431

3,002,375

Non-GAAP net income

$

3,722,088

$

1,254,664

Net income (loss) attributable to CLPS Incorporation’s
shareholders

$

569,298

$

(1,837,145)

Add: share-based compensation expenses

2,937,431

3,002,375

Non-GAAP net income attributable to CLPS
Incorporation’s shareholders

3,506,729

1,165,230

$

$

Weighted average number of share outstanding used
in computing GAAP and non-GAAP basic earnings

15,169,655

13,889,460

GAAP basic earnings (loss) per common share

$

0.04

$

(0.13)

Add: share-based compensation expenses

0.19

0.21

Non-GAAP basic earnings per common share

$

0.23

$

0.08

Weighted average number of share outstanding used
in computing GAAP diluted earnings

15,212,010

13,889,460

Add: effect of dilutive securities (note 1)

184,316

Weighted average number of share outstanding used
in computing non-GAAP diluted earnings

15,212,010

14,073,776

GAAP diluted earnings (loss) per common share

$

0.04

$

(0.13)

Add: share-based compensation expenses

0.19

0.21

Non-GAAP diluted earnings per common share

$

0.23

$

0.08

Note:

(1)   All dilutive potential common shares had anti-dilutive impact and were excluded in computation of 

GAAP diluted earnings per share in the period when loss was reported.


CLPS INCORPORATION

AUDITED CONSOLIDATED BALANCE SHEETS

(Amounts in U.S. dollars ("$"), except for number of shares)

As of June 30,

2020

2019

ASSETS

Current assets

Cash and cash equivalents

$

12,652,120

$

6,601,335

Short-term investments

636,934

1,791,697

Accounts receivable, net

25,753,856

19,263,584

Escrow receivable

200,000

Prepayments, deposits and other assets, net

1,280,967

1,028,154

Prepaid income tax

15,780

630,790

Amounts due from related parties

169,185

230,540

Total Current Assets

40,508,842

29,746,100

Property and equipment, net

452,472

566,591

Intangible assets, net

1,144,579

427,769

Goodwill

2,118,700

447,790

Long-term investments

680,131

914,006

Prepayments, deposits and other assets, net

244,387

222,507

Deferred tax assets, net

203,247

338,221

Total Assets

$

45,352,358

$

32,662,984

LIABILITIES AND SHAREHOLDERS’ EQUITY

Current liabilities

Short-term bank loans

$

2,161,239

$

2,184,996

Accounts payable and other current liabilities

489,043

196,832

Tax payables

1,426,614

915,629

Deferred subsidies

109,250

Deferred revenues

124,192

Contract liabilities

755,178

Salaries and benefits payable

11,522,268

7,735,487

Total Current Liabilities

16,354,342

11,266,386

Long-term bank loans

22,554

Deferred tax liabilities

163,163

Unrecognized tax benefits

194,939

 TOTAL LIABILITIES

16,734,998

11,266,386

Commitments and Contingencies

Shareholders’ Equity

Common stock, $0.0001 par value, 100,000,000 shares authorized;
15,930,330 shares issued and outstanding as of June 30, 2020;
13,913,201 shares issued and outstanding as of June 30, 2019. *

1,593

1,391

Additional paid-in capital

28,586,048

24,276,622

Statutory reserves

2,803,811

1,833,802

Retained earnings

(2,680,143)

(4,509,729)

Accumulated other comprehensive loss

(1,362,665)

(813,650)

Total CLPS Incorporation’s Shareholders’ Equity

27,348,644

20,788,436

Non-controlling Interests

1,268,716

608,162

Total Shareholders’ Equity

28,617,360

21,396,598

Total Liabilities and Shareholders’ Equity

$

45,352,358

$

32,662,984

* The shares and per share data are presented on a retroactive basis to reflect the nominal share issuance.


CLPS INCORPORATION

AUDITED CONSOLIDATED STATEMENTS OF INCOME AND COMPREHENSIVE INCOME

(Amounts in U.S. dollars ("$"), except for number of shares)

For the years ended

June 30,

2020

2019

Revenues

$

89,415,798

$

64,932,937

Less: Cost of revenues (note 1)

(58,296,097)

(41,178,356)

Gross profit

31,119,701

23,754,581

Operating expenses:

Selling and marketing expenses (note 1)

3,059,877

2,179,029

Research and development expenses

10,436,975

7,978,883

General and administrative expenses (note 1)

16,343,936

17,384,393

Total operating expenses

29,840,788

27,542,305

Income (loss) from operations

1,278,913

(3,787,724)

Subsidies and other income, net

2,535,868

779,508

Other expenses

(107,322)

(92,429)

Income (loss) before income tax and share of income (loss) in
   equity investees

3,707,459

(3,100,645)

Provision for income taxes

835,444

186,615

Income (loss) before share of income (loss) in equity investees

2,872,015

(3,287,260)

Share of income (loss) in equity investees, net of tax

207,363

(145,329)

Net income (loss)

3,079,378

(3,432,589)

Less: Net income (loss) attributable to non-controlling interests

141,139

(162,813)

Net income (loss) attributable to CLPS Incorporation’s
   shareholders

$

2,938,239

$

(3,269,776)

Other comprehensive loss

Foreign currency translation loss

$

(571,943)

$

(429,348)

Less: foreign currency translation loss attributable to non-
   controlling interests

(22,928)

(17,375)

Other comprehensive loss attributable to CLPS
   Incorporation’s shareholders

$

(549,015)

$

(411,973)

Comprehensive income (loss) attributable to

CLPS Incorporation shareholders

$

2,389,224

$

(3,681,749)

Non-controlling interests

118,211

(180,188)

$

2,507,435

$

(3,861,937)

Basic earnings (loss) per common share*

$

0.20

$

(0.24)

Weighted average number of share outstanding – basic

14,689,224

13,843,764

Diluted earnings (loss) per common share*

$

0.20

$

(0.24)

Weighted average number of share outstanding – diluted (note 2)

14,692,299

13,843,764

Note:

(1)   Includes share-based compensation expenses as follows: 
       
Cost of revenues

14,110


9,472

Selling and marketing expenses

211,573

46,100

General and administrative expenses

3,778,397

6,960,517

(2)  All dilutive potential common shares had anti-dilutive impact and were excluded in computation of diluted 
earnings per share in the period when loss was reported.

* The shares and per share data are presented on a retroactive basis to reflect the nominal share issuance.


CLPS INCORPORATION

RECONCILIATION OF NON-GAAP AND GAAP RESULTS

(Amounts in U.S. dollars ("$"), except for number of shares)

For the years ended 

June 30,

2020

2019

Cost of revenues

$

(58,296,097)

$

(41,178,356)

Less: share-based compensation expenses

14,110

9,472

Non-GAAP cost of revenues

$

(58,281,987)

$

(41,168,884)

Selling and marketing expenses

$

3,059,877

$

2,179,029

Less: share-based compensation expenses

211,573

46,100

Non-GAAP selling and marketing expenses

$

2,848,304

$

2,132,929

General and administrative expenses

$

16,343,936

$

17,384,393

Less: share-based compensation expenses

3,778,397

6,960,517

Non-GAAP general and administrative expenses

$

12,565,539

$

10,423,876

Operating  income (loss)

$

1,278,913

$

(3,787,724)

Add: share-based compensation expenses

4,004,080

7,016,089

Non-GAAP operating income

$

5,282,993

$

3,228,365

Operating Margin

1.4%

(5.8%)

Add: share-based compensation expenses

4.5%

10.8%

Non-GAAP operating margin

5.9%

5.0%

Net income (loss)

$

3,079,378

$

(3,432,589)

Add: share-based compensation expenses

4,004,080

7,016,089

Non-GAAP net income

$

7,083,458

$

3,583,500

Net income (loss) attributable to CLPS Incorporation’s
shareholders

$

2,938,239

$

(3,269,776)

Add: share-based compensation expenses

4,004,080

7,016,089

Non-GAAP net income attributable to CLPS
Incorporation’s shareholders

$

6,942,319

$

3,746,313

Weighted average number of share outstanding used in
computing GAAP and non-GAAP basic earnings

14,689,224

13,843,764

GAAP basic earnings (loss) per common share

$

0.20

$

(0.24)

Add: share-based compensation expenses

0.27

0.51

Non-GAAP basic earnings per common share

$

0.47

$

0.27

Weighted average number of share outstanding used in
computing GAAP diluted earnings

14,692,299

13,843,764

Add: effect of dilutive securities (note 1)

194,824

Weighted average number of share outstanding used in
computing non-GAAP diluted earnings

14,692,299

14,038,588

GAAP diluted earnings (loss) per common share

$

0.20

$

(0.24)

Add: share-based compensation expenses

0.27

0.51

Non-GAAP diluted earnings per common share

$

0.47

$

0.27

Note:

(1)   All dilutive potential common shares had anti-dilutive impact and were excluded in computation of 

GAAP diluted earnings per share in the period when loss was reported.


Related Links :

http://www.clps.com.cn

Entrust Launches Next Generation Secure Cloud-Based Direct to Card ID Desktop Issuance Solution

The next generation Entrust Sigma instant ID solution is built for today’s cloud environments, leveraging encryption, trusted HSM technology and secure boot to issue highly secure physical and mobile identities

SINGAPORE, Oct. 21, 2020 Entrust, a leading provider of trusted identities, payments and data protection, today announced Sigma Instant Desktop Issuance solution, an innovative direct-to-card issuance solution for instant physical and mobile ID issuance. Designed for both cloud and on-premise deployment, the Sigma solution sets the standard for simple, secure and smart instant ID solutions across enterprise, healthcare, government, higher education and financial institutions.

Entrust Launches Next Generation Secure Cloud-Based Direct to Card ID Desktop Issuance Solution


Today’s enterprises face a myriad of security challenges: From transitioning to digital operations during the pandemic, to managing the global rise in cyber-attacks, they must maintain a safe and secure flow of data − including the data stored on physical credentials. Within these organizations, Identity and Access Management professionals require a printing solution that is not only easy to integrate into their operations, but one that evolves to meet the growing needs of their company while assuring the highest level of data security. Sigma systems deliver a seamless user experience across the issuance process for desktop and mobile printing needs. It eliminates the frustrations of printer set-up with a modular design and an out-of-the-box implementation that takes less than 30 minutes for users to begin issuing identities.

Equipped with cloud-based APIs, Sigma systems bring issuance to the cloud without additional hardware — enabling instant printing for both physical IDs, badges and payment cards. Sigma systems are trusted IoT devices that help ensure organizations and their data are safe with an intelligent network and building connectivity for ultimate enterprise protection. With capabilities like tactile impressions, holographic and luster panel printing, Sigma printers make it highly difficult for counterfeiters to alter or recreate cards. Additionally, features like an inline magnetic stripe and smart card encoding secure your cards during the card printing process.

"With our Sigma platform, we’re proud to deliver a best-in-class desktop credential issuance solution that’s designed to work completely and securely within a cloud environment, allowing financial, enterprise, government, higher education and healthcare organizations to meet high-volume issuance demands without sacrificing security or ease of use. The Sigma system is ready to meet the issuance needs of today, and equally important, will evolve to meet tomorrow’s security and technology challenges with unlimited printing applications," said Tony Ball, Senior Vice President and General Manager of Instant Issuance at Entrust. "Entrust has been a pioneer in direct to card identity issuance technology for decades, and our Sigma system takes it to a whole new level."

Sigma systems offer the most advanced security architecture that keeps data protected at each step of the issuance process:

  • Encrypted connections: The connection and data sent between software and the printer are secure and encrypted. Sigma printers do not store customer data after successful printing is complete.
  • Secure boot: This feature prevents Sigma systems from booting up malware or other compromises are detected.
  • Trusted platform module (TPM): Organizations can store and manage user certificates and keys in the printer, allowing the printer to become a trusted internet of things (IoT) endpoint.

As large segments of the workforce continue operating remotely, Sigma systems are poised to meet the demands of a hybrid workforce with its physical and digital issuance platform. The Sigma system’s "Printer Dashboard" is available on mobile devices, allowing organizations to manage the printer from anywhere, without being tied to a desktop. Sigma systems also enable companies to pivot and move to a contactless ID Issuance experience, from online photo submission to validating the photo, printing the card, and ultimately delivering the card to the employee. Furthermore, the on-premises instant ID solution features a mobile enrollment functionality for added flexibility to issue IDs at various locations within a facility. Sigma systems use intelligent instant ID technology to streamline printing and eliminate manual workflows — bringing simplicity, security and flexibility to the issuance process.

"Whether your requirements demand an integrated, secure on-premises solution or a system that can grow with a distributed workforce via a secure cloud-hosted Identity Management offering, the Entrust Sigma solutions can meet your needs," said Joe Franco, Director of Sales at Capture Technologies, an Entrust channel partner. "They are browser based and mobile ready and able to be deployed without the need for a heavy client to be installed. The certificate based integrated security features should put to rest any concerns about using the cloud for identity issuance or your printing solution being vulnerable to network attack."

For more information about Sigma visit: https://www.entrust.com/c/meet-sigma.

About Entrust

Entrust keeps the world moving safely by enabling trusted identities, payments and data protection. Today more than ever, people demand seamless, secure experiences, whether they’re crossing borders, making a purchase, accessing e-government services or logging into corporate networks. Entrust offers an unmatched breadth of digital security and credential issuance solutions at the very heart of all these interactions. With more than 2,500 colleagues, a network of global partners, and customers in over 150 countries, it’s no wonder the world’s most entrusted organizations trust us. To learn more, visit www.entrust.com.

Media Contact

Ken Kadet
Vice President, Public Relations
+1-952.988.1154
ken.kadet@entrustdatacard.com

Entrust APAC
entrustdatacardapac@finnpartners.com
+65-9732-5164

Related Links :

https://www.entrust.com

‘AIZEN’ AI banking-as-a-Service, Empowering data platform to launch lending services

SINGAPORE, Oct. 20, 2020 — The financial services industry has seen drastic technology-led changes over the past few years. While some of the big tech giants have launched their own Fintech verticals, there are many brands that are also increasingly looking to offer financial services to their customers. These companies tend to partner with existing financial institutions and resell their financial products, but many fails to offer a seamless onboarding experience mainly due to partner banks’ legacy processes. 

Embedded Finance, as opposed to reselling financial products, is becoming more attractive to brands. It enables any non-financial companies to integrate innovative financial services into their offerings. This creates new revenue opportunities at low marginal costs for the brands that already have a large customer base and enables new customer experiences that drive loyalty and purchases.

Embedded finance- AIZEN's AI banking-as-a-Service
Embedded finance- AIZEN’s AI banking-as-a-Service

AIZEN, a leading provider of banking-as-a-service platform, has partnered with companies in Southeast Asia including leading e-commerce in Indonesia and e-wallet platform in Vietnam to provide an Automated Banking Operating System (ABOS) focusing on lending. The company is working with Balance Sheet providers (both banks and non-banking entities) and will act as an intermediary for all other processes related to the end-to-end credit lifecycle. ABOS is built on a robust risk management framework that automates the core operations from product design, credit acquisition, portfolio management and collection, and allows banks and brands to take proactive measures on the economic downside risks amid COVID-19.

According to the latest report by Google, Temasek and Bain & Company, digital financial services in Southeast Asia is expected to generate revenues of about USD 38 billion by 2025. Digital lending has also gained momentum as we enter the "contactless economy" after COVID crisis, and it will offer the majority of revenue opportunities. 

AIZEN has recently raised from a government-led fintech innovation fund (KGIC, also known as K-Growth) led by major banks including KB, Shinhan, Woori and NH, which brings the company’s total funding to USD 10 million including USD 3.5 million in R&D grants. The company plans to roll out Banking-as-a-Service (BaaS) primarily targeting the underserved markets in Vietnam, Indonesia, Singapore, and Taiwan.

For traditional lenders, the absence of credit history has meant a limited risk appetite for lending to this segment. Using proprietary AI technologies, AIZEN is able to better underwrite customers by converting non-traditional sources of data into credit-related data in Finance. This is powered by ABACUS, an AutoML platform in finance that is specifically designed to accommodate the fast-changing customer dynamics in real-time. 

Founded in 2016, AIZEN has been working on digital transformation projects with financial institutions including loan underwriting, transaction fraud detection, and insurance claim analysis. The company has joined Plug and Play APAC Fintech Batch in Singapore and has been named by Gartner as a Cool Vendor in AI for Fintech for high scalability and easiness of adoption. AIZEN is also a member of Intel’s AI Builders Program and is optimizing the solution with access to Intel’s latest technology and engineering expertise. "We will strategically expand our banking service with our AI operating model and will service our new AI-powered banking model in Vietnam, Indonesia, Singapore, and Taiwan," said Jung Seok Kang, CEO at AIZEN.

OneConnect Shares Fintech Insights with Chinese Banks and Fintech Companies

HONG KONG, Oct. 20, 2020 — OneConnect Financial Technology Co., Ltd. (OneConnect, NYSE: OCFT), a leading technology-as-a-service platform for financial institutions, shared its vision of innovation with the Fintech Association of Hong Kong of the Chinese Banking Association of Hong Kong at a recent video conference.

Carol Chen, CEO of OneConnect (Hong Kong), and Daniel Ling, General Manager, discussed the company’s technical solutions for popular banking fields, such as remote customer service solutions and customer due diligence with more than 100 executives and industry experts.

As of June 30, 2020, OneConnect, an associate company of the Ping An Group, had served all state-owned banks and joint-stock banks in China, 99% of commercial banks, and 53% of insurance companies.

Ms. Chen and Mr. Ling presented end-to-end fintech solutions for banks, securities, asset management companies and other fintech institutions in mainland China and Hong Kong. These include localized fintech technology services such as smart marketing, smart risk controls, smart operations and fintech centers.

They also covered solutions implemented at Ping An OneConnect Bank, OneConnect’s virtual banking subsidiary: the process for opening a bank account online, opening an online small and medium enterprises (SME) account and loan solutions, and cloud-based core banking, which improves sales, risk management and customer service quality.

Jessica Tan, Co-CEO of Ping An Group has said that Ping An will continue to increase its investments in technology to bolster its main businesses. "Particularly in terms of fintech, OneConnect will continue to develop and invest in innovative products," she said.

Ping An uses technology to empower its main financial businesses. In the first half of 2020, Ping An achieved artificial intelligence (AI)-driven product sales of RMB176.3 billion. Its online and technology-powered offline services across the Ping An Group supported 560 million online users.

OneConnect has branches in Hong Kong, Singapore, and Indonesia and provides services to major banks in Thailand, Indonesia, Malaysia and the Philippines. As of June 30, 2020, OneConnect had provided services to or signed cooperation agreements with more than 50 overseas institutions in more than 15 countries and regions.