Tag Archives: FIN

Future Fintech and Spondula Terminated the Negotiation of Potential Acquisition

BEIJING, Oct. 24, 2020 — Future FinTech Group Inc. (NASDAQ: FTFT) (hereinafter referred to as "Future Fintech", "FTFT" or "Company" ") a leading blockchain e-commerce company and a service provider for financial technology, today announced the parties have mutually agreed to terminate the negotiation of the potential acquisition of Spondula, previously announced by the Company on September 22, 2020. The parties have not been able to agree on the final business terms for the potential acquisition and have mutually agreed to terminate the potential transaction contemplated in the non-binding letter of intent entered by the Company, Spondula and its shareholder on September 19, 2020.

The Company strategy remains to focus on development of business of global challenger banking and payment system through acquisitions.

About Future FinTech Group Inc.

Future FinTech Group Inc. ("Future FinTech", "FTFT" or the "Company") is a leading blockchain e-commerce company and a service provider for financial technology incorporated in Florida. The Company’s operations include a blockchain-based online shopping mall platform, Chain Cloud Mall ("CCM"), a cross-border e-commerce platform (NONOGIRL), an incubator for blockchain based application projects. The Company is also engaged in the development of blockchain based e-Commerce technology as well as financial technology. For more information, please visit http://www.ftftex.com/.

Safe Harbor Statement

Certain of the statements made in this press release are "forward-looking statements" within the meaning and protections of Section 27A of the Securities Act of 1933, as amended and Section 21E of the Securities Exchange Act of 1934, as amended, or the Exchange Act. Forward-looking statements include statements with respect to our beliefs, plans, objectives, goals, expectations, anticipations, assumptions, estimates, intentions, and future performance, and involve known and unknown risks, uncertainties and other factors, which may be beyond our control, and which may cause the actual results, performance, capital, ownership or achievements of the Company to be materially different from future results, performance or achievements expressed or implied by such forward-looking statements. All statements other than statements of historical fact are statements that could be forward-looking statements. You can identify these forward-looking statements through our use of words such as "may," "will," "anticipate," "assume," "should," "indicate," "would," "believe," "contemplate," "expect," "estimate," "continue," "plan," "point to," "project," "could," "intend," "target" and other similar words and expressions of the future.

All written or oral forward-looking statements attributable to us are expressly qualified in their entirety by this cautionary notice, including, without limitation, those risks and uncertainties described in our annual report on Form 10-K for the year ended December 31, 2019 and our other reports and filings with SEC. Such reports are available upon request from the Company, or from the Securities and Exchange Commission, including through the SEC’s Internet website at http://www.sec.gov. We have no obligation and do not undertake to update, revise or correct any of the forward-looking statements after the date hereof, or after the respective dates on which any such statements otherwise are made.

WiMi Partners With ICR to Enhance Investor Relations

BEIJING, Oct. 23, 2020 — WiMi Hologram Cloud, Inc. ("WiMi" or the "Company") (NASDAQ: WIMI),  a leading augmented reality service provider in China, today announced that that it has retained ICR, LLC, a leading strategic communications advisory firm, to manage its investor relations program.

Mr. Shuo Shi, Chief Executive Officer of WiMi, commented, "We are pleased to announce our cooperation with ICR. Working together, we seek to increase our disclosure transparency and enhance our investor relations. As a leader in corporate strategic communications, ICR is well positioned to help improve our current investor communications program and ensure that our new and existing shareholders stay abreast of our corporate developments. With its in-depth knowledge of the U.S. capital markets and extensive experience working with technology companies, ICR should be able to help us clearly articulate our vision, explain our business model, raise our corporate profile, and forge a closer relationship with our investor base."

About WIMI Hologram Cloud Inc.

WiMi Hologram Cloud, Inc.(NASDAQ: WIMI), whose commercial operations began in 2015, operates an integrated holographic AR application platform in China and has built a comprehensive and diversified holographic AR content library among all holographic AR solution providers in China. Its extensive portfolio includes 4,654 AR holographic contents. The company has also achieved a speed of image processing that is 80 percent faster than the industry average. While most peer companies may identify and capture 40 to 50 blocks of image data within a specific space unit, WiMi collects 500 to 550 data blocks.

About ICR

Established in 1998, ICR partners with its clients to execute strategic communications and advisory programs that achieve business goals, build awareness and credibility, and enhance long-term enterprise value. The firm’s highly-differentiated service model, which pairs capital markets veterans with senior communications professionals, brings deep sector knowledge and relationships to more than 750 clients in approximately 20 industries. ICR’s healthcare practice operates under the Westwicke brand (www.westwicke.com). Today, ICR is one of the largest and most experienced independent communications and advisory firms in North America, maintaining offices in New York, Norwalk, Boston, Baltimore, San Francisco, San Diego and Beijing. Learn more at www.icrinc.com. Follow us on Twitter at @ICRPR.

Safe Harbor / Forward-Looking Statements

This press release contains "forward-looking statements" within the meaning of the Private Securities Litigation Reform Act of 1995. These forward-looking statements can be identified by terminology such as "will," "expects," "anticipates," "future," "intends," "plans," "believes," "estimates" and similar statements. Statements that are not historical facts, including statements about the Company’s beliefs and expectations, are forward-looking statements. Among other things, the business outlook and quotations from management in this press release, as well as the Company’s strategic and operational plans, contain forward−looking statements. The Company may also make written or oral forward−looking statements in its periodic reports to the U.S. Securities and Exchange Commission ("SEC") on Forms 20−F and 6−K, in its annual report to shareholders, in press releases and other written materials and in oral statements made by its officers, directors or employees to third parties. Forward-looking statements involve inherent risks and uncertainties. A number of factors could cause actual results to differ materially from those contained in any forward−looking statement, including but not limited to the following: the Company’s goals and strategies; the Company’s future business development, financial condition and results of operations; the expected growth of the AR holographic industry; and the Company’s expectations regarding demand for and market acceptance of its products and services. Further information regarding these and other risks is included in the Company’s annual report on Form 20-F and current report on Form 6-K and other documents filed with the SEC. All information provided in this press release is as of the date of this press release, and the Company does not undertake any obligation to update any forward-looking statement, except as required under applicable laws. 

Contacts

WIMI Hologram Cloud Inc.
Email: pr@wimiar.com

ICR, LLC
Sharon Zhou
Tel: +1 (646) 975-9495
Email: wimi@icrinc.com

Scienjoy Demonstrates Corporate Social Responsibility With COVID-19 Public Health Event

BEIJING, Oct. 23, 2020 — Scienjoy (Nasdaq: SJ), a leading provider of show livestreaming social platforms in China, last week demonstrated its Corporate Social Responsibility (CSR) by supporting the COVID-19 pandemic effort via streaming the "Fighting the epidemic together for a better life," COVID-19 public health event.

Streaming the event was the most recent CSR initiative as part of the Company’s larger campaign to share public health information on its platforms. Held in Beijing, the COVID-19 public health event gathered experts from local universities and invited five speakers to share their stories of outstanding contributions to the COVID-19 cause. This event is one small part of Scienjoy’s effort to contribute to the fight against the pandemic, which has also included direct donations, partnerships to share public health information, and exploring new forms of online entertainment and community for its more than 200 million users.

Its strong sense of Corporate Social Responsibility made Scienjoy an early supporter of COVID-19 affected areas. This support began almost nine months ago. On January 31, the company donated RMB 1 million to purchase personal protective gear and other urgently needed medical supplies for frontline medical staff in Wuhan. At the same time, Scienjoy helped establish and donated RMB100,000 to the Beijing University of Posts and Telecommunications fund to support students from Hubei province, who were impacted by the virus. The fund was established to support students from Hubei who were struggling with tuition payments. The fund raised over 700,000 RMB, with Scienjoy employees also individually donating RMB101,010.

Beyond donations, Scienjoy added banners, livestreams, and resources to share authoritative public health information with its more than 200 million users. Scienjoy leveraged its livestreaming platforms, including Showself, Lehai TV and Haixiu TV, plus other strategic cooperation livestreaming platforms, to support the public health efforts against COVID-19. With its campaign "Together, we will fight the pandemic," it promoted a special section of COVID-19 information to users through banners on homepages. In these sections, the platforms published official announcements, posted public health campaigns calling on people to work together to combat COVID-19, and shared protective measures users could take to reduce the spread of the pandemic. Platforms also set up message boards for areas heavily impacted by the pandemic.

In addition to spreading the public health message, Scienjoy also used its own and other collaborative platforms to provide entertainment and social options in an era of social distancing to support users in high-risk areas and frontline workers who had to vigilantly practice social distancing. Since the start of the pandemic, people have increasingly turned to Scienjoy to connect over livestream from home. To support this, Scienjoy actively initiated a new "Home Entertainment" category, teaming up with high-quality partners to add new categories of entertainment and livestreaming events. Scienjoy livestreamed fitness courses, discos, online theater experiences and other innovative events. The company continued supporting its active online communities, enabling hosts and fans to maintain a connection virtually as they all practiced social distancing.

"Our COVID-19 efforts have further enriched our platforms’ content, helped support our users get through this difficult time, and supported our public partners to find new online models to combat the crisis. Our new features and adaptations to the COVID-19 era also helped us achieve solid financial results in the second quarter of 2020. We grew our net income by 282.2% year over year in Q2, all while keeping an eye on our mission in CSR," said Mr. Denny Tang, CFO of Scienjoy.

Since its founding, CSR has always been a focus for Scienjoy. It continues to provide high-value services to users with cutting-edge technologies while making every effort to promote public welfare. During this uniquely difficult time, Scienjoy learned how livestream can adapt and support users in even more areas of life. Backed by its advanced technologies including artificial intelligence, augmented reality, and virtual reality, the company continues to develop diverse content and expand the reach of livestreaming. Scienjoy is looking to the future to see how we can learn from the pandemic and transform crisis into opportunity.

About Scienjoy

Founded in 2011, Scienjoy is a leading provider of show livestreaming social platforms in China. With more than 200 million registered users, Scienjoy currently operates five primary online livestreaming brands: Showself, Lehai TV, Haixiu TV, BeeLive International, and domestic counterpart BeeLive Chinese, each on stand-alone mobile applications. These mobile livestreaming platforms connect professional "broadcasters" and end-users, creating vibrant, interactive and close-knit communities. Using Scienjoy’s mobile applications, users can select broadcasters and interact with them in real-time video rooms. Users can view photos posted by broadcasters on their personal pages, leave comments, and chat directly with broadcasters. Users can also play simple games in video rooms using virtual currency while watching a broadcaster’s livestream.

Media Relations Contact
Greta Bradford
ICR Inc.
Greta.bradford@icrinc.com
Mobile: +86 178-8882-8731


maaiiconnect Unveils New Affiliate Programme Following Successful Customer Feedback

Gain an additional revenue stream by successfully referring new customers to maaiiconnect for their business engagement solution

HONG KONG, Oct. 23, 2020 — maaiiconnect launches its Affiliate Programme to reward and empower its passionate user-base after the successful launch of the all-in-one business engagement solution in January. With 92% of users stating they would highly recommend maaiiconnect, the Affiliate Programme will reward affiliates with up to 25% commission for each referral.

In only 10 months since launching, maaiiconnect has quickly built a loyal user-base of organisations using maaiiconnect as an all-in-one solution that combines telecom and digital channels for customer engagement and collaboration. maaiiconnect has positioned itself as one of the top solutions, with an NPS score in the top 10 of all live chat software on a peer review platform. With monthly releases of new features and capabilities, current users have been passionately engaged in helping shape and grow the solution with their suggestions and active participation.

"maaiiconnect’s dashboard is so easy to use, we customised and setup the web widget within 30 minutes. The first customer enquiry came through within 10 minutes of deployment!" Robert G., Marketing Manager at Upmood.

maaiiconnect is on a mission to help organisations transform their customer’s experiences across every touchpoint. The platform solves today’s toughest business communication challenges with the right mix of omnichannel solutions, intelligent CRM, and transparent data and reports to grow conversions in a secure and innovative way. The Affiliate Programme is an opportunity for current users, individual affiliate marketers, and professional affiliate networks to earn up to 25% commission from the sale of the paid subscriptions using their designated referral codes.

Jason Lee, Head of International Carrier Business addressed, "We want to grow with our partners. The affiliate program is an important step in answering the requests that we have been getting from partners and potential resellers wishing to be more actively engaged in the exciting maaiiconnect journey and to continue to build our great synergy together. Our team of experts will provide comprehensive trainings, sales kits, and 24/7 customer service to accelerate the subscription growth in a win-win situation."

maaiiconnect’s affiliate program covers all maaiiconnect subscription purchases on its website, which includes LITE, PRO, and BUSINESS plans. The team at maaiiconnect welcomes new partners to join now. For more information, please contact our experts here or send email to ib@m800.com.

maaiiconnect is an all-in-one solution for engaging customers and staff across different touchpoints anytime, anywhere and from any device. Curate seamless and streamlined customer experiences that modern consumers and clients crave, and securely and safely engage colleagues in a remote work environment.

  • Web communications widget
  • Integrated telecom
  • Omnichannel messaging
  • Insights & reporting
  • Industry compliance, security, and encryption

The capabilities of maaiiconnect are underpinned by M800’s robust proprietary infrastructure and partner network of over 160 global carriers. With 200+ staff across the headquarters in Hong Kong, and a Taiwan R&D office, maaiiconnect was developed by a strong team of researchers and engineers with deep knowledge and expertise in telecommunications, mobile, and software development on a mission to change the way the world communicates. 

Interested to try maaiiconnect for free? Subscribe to the free ESSENTIALS PLAN now to experience the core web-based call and chat features.

About maaiiconnect

maaiiconnect provides businesses with an all-in-one solution for customer engagement and internal collaboration. Leveraging an innovative multi-dimensional convergence model, maaiiconnect seamlessly unifies telecom and digital communication channels, such as PSTN, VoIP, websites, apps, and social networks. It is device agnostic, empowering employees to be more productive, as well as providing companies a platform to deliver a suite of multimedia experience to their customers anytime, anywhere, on any device. Learn more at www.maaiiconnect.com.

Related Links :

http://www.maaiiconnect.com

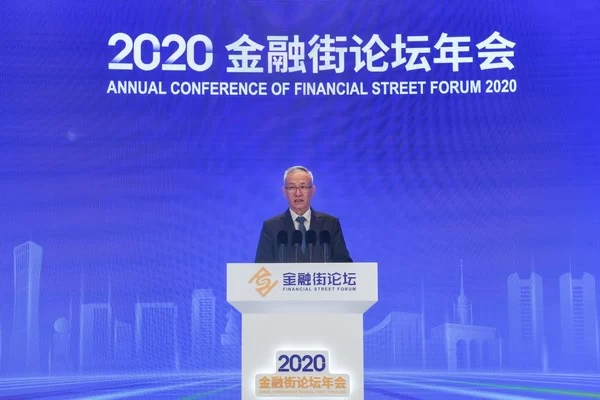
Xinhua Silk Road: Annual Conference of Financial Street Forum 2020 held to craft four platform functions to sharpen global influence

BEIJING, Oct. 23, 2020 — The Annual Conference of Financial Street Forum 2020, which opened on Wednesday and lasts till Friday, is crafted as a flagship international event characterized by four platform functions to sharpen its global influence.

Chinese Vice Premier Liu He, also a member of the Political Bureau of the Communist Party of China Central Committee, attended the opening ceremony of the Annual Conference of Financial Street Forum 2020 in Beijing, capital of China, Oct. 21, 2020.

Themed on "Financial Cooperation and Reform under Global Changes", the annual conference aims to form itself as platforms for China’s participation in global financial governance, global financial industry communications and cooperation, interaction between financial sector and the real economy and national financial policies releasing.

This year, parallel forums are divided into four sections including financial cooperation and reform, financial services and development, financial opening and financial market, financial technology and innovation, centering upon 25 sessions.

The annual conference is jointly organized by the People’s Government of Beijing Municipality, the People’s Bank of China (PBOC), Xinhua News Agency, China Banking and Insurance Regulatory Commission (CBIRC), China Securities Regulatory Commission (CSRC) and the State Administration of Foreign Exchange (SAFE).

PBOC hosts two keynote sub-forums under the annual conference and will release financial technology (fintech) development indicators to shape a set of scientific, quantifiable and comprehensive sector development appraisal standards applicable in China or even in the world.

Xu Yuchang, chairman and president of China Economic Information Service (CEIS) of Xinhua News Agency said the parallel forum themed on "Belt and Road Cooperation in the New Financial Landscape" is organized by Xinhua News Agency and implemented by CEIS. The Belt and Road Initiative is an important move of China to widen opening-up and share fruits of development with the world and has aroused wide attention from the international community. The parallel forum has attracted representatives from financial institutions, enterprises and research institutes to register for participation.

CSRC organizes two parallel forums of the annual conference and four sessions including capital market basic rules and ecology construction, building world class investment banks and wealth management institutions, small- and medium-sized enterprises development and high efficiency in direct financing, and deepening reform on the "new third board" to better serve the real economy.

SAFE undertakes hosting work of keynote sub-forums on cross-border capital flow and opening of RMB capital account of higher level and discussions over capital account convertibility, cross-border capital flow and financial risk prevention are carried out on the sub-forums.

https://en.imsilkroad.com/p/316982.html

Related Links :

https://en.imsilkroad.com

Deep Longevity and Longenesis to Partner on Consent Management Integration and Federated Learning Method Development

HONG KONG, Oct. 23, 2020 — Regent Pacific Group Limited ("Regent Pacific" or the "Company" and together with its subsidiaries, the "Group"; SEHK:0575.HK) today announced that Deep Longevity, Inc,, a company recently acquired by the Group which mainly engaged in the development of explainable artificial intelligence systems to track the rate of aging at the molecular, cellular, tissue, organ, system, physiological, and psychological levels, has entered into a partnership with Longenesis, a leader in consent-enabled safe data curation for research. Two companies will partner on the integration of the consent management system developed by Longenesis into the Deep Longevity digital platform including Young.AI, a web-based tracker of aging and wellness, and the development of a federated learning framework.

Deep Longevity scientists are the original inventors of the "deep aging clocks", multimodal biomarkers of aging developed using deep learning techniques with multiple granted patents. They recently published deep hematological aging clocks, deep transcriptomic and proteomic aging clocks, deep microbiomic aging clocks, and contributed to the development of the photographic aging clocks.

Longenesis has created an end-to-end environment for biomedical institutions, patient organizations and research partners and sponsors – to communicate directly, enabling both safe data curation and compliant, consent-enabled biomedical data utilization for research.

"At Deep Longevity we are working on creating a network of hospitals and clinics that will have access to our aging clocks. To enable this network, we are aiming to create a federated learning pipeline, that will allow us to train multiple new aging clocks without the need to transfer user data", explains Polina Mamoshina, Ph.D., Chief Scientific Officer of Deep Longevity, a Regent Pacific company.

"Longenesis is a company invested by LongeVC, a venture fund, and accelerator dedicated to growing the longevity ecosystem in the European Union. Over the past few years, Longenesis developed a range of technologies to help protect user privacy and manage consent to help companies provide the individuals with more tools to take control over their data", said Garry Zmudze, founding partner of LongeVC, an investor in both Longenesis and Deep Longevity.

"At Longenesis we believe that the need for centralized, compliant and seamless biomedical data asset identification is crucial for collaborative research initiation, faster patient recruitment and timely response to global healthcare challenges. We are looking forward to this collaboration, creating a federated learning pipeline and embracing the "data stays local" principle at the same time", says Sergejs Jakimovs, a CEO of Longenesis.

– Ends –

This press release is distributed by LBS Communications Consulting Limited.

About Deep Longevity

Deep Longevity has been acquired by Regent Pacific (SEHK:0575.HK), a publicly-traded company. Deep Longevity is developing explainable artificial intelligence systems to track the rate of aging at the molecular, cellular, tissue, organ, system, physiological, and psychological levels. It is also developing systems for the emerging field of longevity medicine, enabling physicians to make better decisions on the interventions that may slow down, or reverse the aging processes. Deep Longevity developed Longevity as a Service (LaaS)© solution to integrate multiple deep biomarkers of aging dubbed "deep aging clocks" to provide a universal multifactorial measure of human biological age. Originally incubated by Insilico Medicine, Deep Longevity started its independent journey in 2020 after securing a round of funding from the most credible venture capitalists specializing in biotechnology, longevity, and artificial intelligence. ETP Ventures, Human Longevity and Performance Impact Venture Fund, BOLD Capital Partners, Longevity Vision Fund, LongeVC, co-founder of Oculus, Michael Antonov, and other experts AI and biotechnology investors supported the company. Deep Longevity established a research partnership with one of the most prominent longevity organizations, Human Longevity, Inc. to provide a range of aging clocks to the network of advanced physicians and researchers.

http://longevity.ai/

About Regent Pacific (SEHK:0575.HK)

Regent Pacific is a diversified investment group based in Hong Kong currently holding various corporate and strategic investments focusing on the healthcare, wellness and life sciences sectors. The Group has a strong track record of investments and has returned approximately US$298 million to shareholders in the 21 years of financial reporting since its initial public offering.

http://www.regentpac.com/

About Longenesis

Longenesis Ltd. is a software technology company, that is focused on developing legitimate ways to promote collaboration between biomedical institutions, patient organizations and research partners by identifying biomedical data from metadata files, by onboarding population cohorts and by engaging new patients in the research.

https://longenesis.com/

About LongeVC

LongeVC is an investment group, specialising in curating, facilitating and executing early stage venture investments in the fields of biotech and longevity. Current investment portfolio of LongeVC includes Insilico Medicine, a global leader in AI-driven drug discovery, Longenesis, an end-to-end collaborative biotech research enabler, Basepaws, the first comprehensive DNA sequencing solution for pets, as well as other biotech industry-specific companies. With its latest exit, LongeVC has announced the creation of its first official early-stage investment fund, focused on biotech and longevity opportunities, with backing from the most prominent advisory board in the longevity industry.


CLPS Incorporation Reports Financial Results for the Second Half and Full Year of Fiscal 2020

HONG KONG, Oct. 23, 2020 — CLPS Incorporation (the "Company" or "CLPS") (Nasdaq: CLPS), today announced its financial results for the six months ended June 30, 2020 and full year of fiscal year 2020.

Second Half of Fiscal 2020 Highlights (all results compared to the six months ended June 30, 2019) 

  • Revenues increased by 37.2% to $46.8 million from $34.1 million.
  • Gross profit increased by 25.1% to $15.7 million from $12.6 million.
  • Net income attributable to CLPS Incorporation’s shareholders was $0.6 million, or $0.04 basic and diluted earnings per share, compared to net loss attributable to CLPS Incorporation’s shareholders of $1.8 million, or $0.13 basic and diluted losses per share.
  • Non-GAAP net income attributable to CLPS Incorporation’s shareholders1 increased by 200.9% to $3.5 million, or $0.23 basic and diluted earnings per share, compared to $1.2 million, or $0.08 basic and diluted earnings per share (See Use of Non-GAAP Financial Measures below for a discussion of such measures as used in this press release).

Fiscal Year 2020 Highlights (all results compared to the twelve months ended June 30, 2019) 

  • Revenues increased by 37.7% to $89.4 million from $64.9 million.
  • Gross profit increased by 31.0% to $31.1 million from $23.8 million.
  • Net income attributable to CLPS Incorporation’s shareholders was $2.9 million, or $0.20 basic and diluted earnings per share, compared to net loss attributable to CLPS Incorporation’s shareholders of $3.3 million, or $0.24 basic and diluted losses per share.
  • Non-GAAP net income attributable to CLPS Incorporation’s shareholders1 increased by 85.3% to $6.9 million, or $0.47 basic and diluted earnings per share, compared to $3.7 million, or $0.27 basic and diluted earnings per share (See Use of Non-GAAP Financial Measures below for a discussion of such measures as used in this press release).

Mr. Raymond Lin, Co-Founder and Chief Executive Officer of CLPS, commented, "As the disruption from the COVID-19 pandemic persists, the health and safety of our employees and their families, as well as our customers and business partners, have been and will continue to be our top priority. Despite the current circumstances, we are pleased to see stable growth in the second half and full year of fiscal 2020 in both our international and local markets. This year, we acquired Ridik to further expand our business in the Southeast Asia; in addition, we opened CLPS California, which will support our U.S. market. Locally, we have invested in Shenzhen Huaqin Robotics and Guangdong Zhichuang Software Technology to further enrich our business services and to provide better service to our clients."

"Cultivating young talent has always been important to us. We are currently cooperating with Technological and Higher Education Institute of Hong Kong and its information technology program to maintain a robust applicant pool and recruit young talent to join our company." 

"Going forward, we will continue to expand our business and grow our market share, both internationally and locally. We hope to achieve sustainable, high-quality growth for CLPS as we create long-term value for our shareholders."

Ms. Rui Yang, acting Chief Financial Officer of CLPS, commented, "During the second half and full year of fiscal 2020, we are pleased to announce that our revenue increased by double digits year-over-year, by 37.2% and 37.7%, respectively. Net income attributable to CLPS Incorporation’s shareholders was $0.6 million in the second half and $2.9 million in the full year of fiscal 2020. Our basic and diluted earnings per share in the second half of fiscal 2020 was $0.04, and $0.20 for the full-year fiscal 2020. Our non-GAAP basic and diluted earnings per share in the second half of fiscal year 2020 was $0.23, and $0.47 for the full year of fiscal 2020. With our strong balance sheet and outstanding services, we are fully confident in our ability to deliver sustainable value for our shareholders."

Second Half and Fiscal Year 2020 Financial Results

Revenues

In the second half of fiscal 2020, revenues increased by $12.7 million, or 37.2%, to $46.8 million from $34.1 million in the prior year period. For the year ended June 30, 2020, revenues increased by $24.5 million, or 37.7%, to $89.4 million from $64.9 million in the prior year period. This increase in revenue was mainly due to an increase in revenue from IT consulting services.

The number of clients increased by 53, or 30.5%, to 227 for the year ended June 30, 2020 from 174 in the prior year period.  Revenues from top five clients accounted for 47.3% and 50.7% of the Company’s total revenues for fiscal 2020 and 2019, respectively, which reflects decreased in revenue dependence from major clients.

Revenues by Service

  • Revenue from IT consulting services increased by $13.5 million, or 42.3%, to $45.5 million and accounted for 97.2% of total revenue in the second half of fiscal 2020, up from $32.0 million, or 93.7% of total revenue, in the prior year period. For the year ended June 30, 2020, revenue from IT consulting services increased by $25.3 million, or 41.1%, to $87.1 million and accounted for 97.5% of total revenue, up from $61.8 million, or 95.1% of total revenue, in the prior year period. The increase was due to increased demand for the Company’s IT consulting service from banks and other financial institutions, primarily from existing clients. For the twelve months ended June 30, 2020 and 2019, 40.0% and 47.5% of IT consulting services revenue were from international banks, respectively.
  • Revenue from customized IT solution services decreased by $1.0 million, or 45.4%, to $1.1 million in the second half of fiscal 2020 from $2.1 million. Revenue from customized IT solution services decreased by $1.2 million, or 39.3%, to $1.8 million for the year ended June 30, 2020, from $3.0 million in the same period of the previous year. The decrease was primarily due to decreasing demand from existing clients.
  • Revenue from other services increased to $0.2 million in the second half of fiscal year 2020 from $0.04 million in the prior year period. Revenue from other services increased by $0.3 million, or 219.0%, to $0.4 million for the year ended June 30, 2020, from $0.1 million in the prior year period.

Revenues by Operational Areas

  • Revenue from banking area increased by $11.4 million, or 34.3% to $44.5 million for the year ended June 30, 2020, from $33.1 million in the prior year period. Revenue from banking area accounted for 49.8% and 51.2% of total revenues in fiscal 2020 and fiscal 2019, respectively.
  • Revenue from wealth management area increased by $4.7 million, or 32.6% to $19.2 million for the year ended June 30, 2020, from $14.5 million in the prior year period. Revenue from wealth management area accounted for 21.5% and 22.4% of total revenues in fiscal 2020 and fiscal 2019, respectively.
  • Revenue from e-Commerce area increased by $2.4 million, or 27.8% to $11.1 million for the year ended June 30, 2020, from $8.7 million in the prior year period. Revenue from e-Commerce area accounted for 12.4% and 13.4% of total revenues in fiscal 2020 and fiscal 2019, respectively.
  • Revenue from automotive area increased by $1.6 million, or 77.3% to $3.6 million for the year ended June 30, 2020, from $2.0 million in the prior year period. Revenue from automotive area accounted for 4.1% and 3.2% of total revenues in fiscal 2020 and fiscal 2019, respectively.

Revenues by Geography

Revenue generated outside of mainland China increased by 110.0% to $6.3 million in the second half of fiscal year 2020 from $3.0 million in the prior year period. Revenue generated outside of mainland China increased by 133.2% to $10.6 million for the year ended June 30, 2020 from $4.5 million in the prior year period, accounted for 11.8% of total revenue compared to 7.0% in the prior year period. The increase in revenue generated outside mainland China reflects the Company’s successful and continuous global expansion strategy.

Gross Profit and Gross Margin

Gross profit increased by $3.2 million, or 25.1%, to $15.7 million in the second half of fiscal 2020 from $12.6 million in the prior year period. Gross margin in the second half of fiscal 2020 decreased to 33.6% compared to 36.9% in the prior year period. The decrease in gross margin was primarily due to the increase in epidemic prevention cost during the COVID-19 outbreak.

Gross profit increased by $7.3 million, or 31.0%, to $31.1 million for the year ended June 30, 2020, from $23.8 million in the prior year period. Gross margin decreased to 34.8% for the year ended June 30, 2020, compared to 36.6% in the prior year period. The decrease in gross margin was primarily due to the increase in epidemic prevention cost during the COVID-19 outbreak.

Operating Expenses

Selling and marketing expenses increased by $0.5 million, or 37.3%, to $1.7 million in the second half of fiscal 2020 from $1.2 million in the prior year period. Selling and marketing expenses increased by $0.9 million, or 40.4%, to $3.1 million for the year ended June 30, 2020, from $2.2 million in the prior year. The increase was due to the increase of salary expenses as new staffs were hired, enabling the implementation of the Company’s global expansion strategy.

Research and development expenses increased by $0.5 million, or 9.7%, to $5.4 million in the second half of fiscal 2020 from $4.9 million in the prior year period. Research and development expenses increased by $2.4 million, or 30.8%, to $10.4 million for the year ended June 30, 2020 from $8.0 million in the prior year period. The increase primarily resulted from the establishment of four new research projects and the Company’s continued R&D efforts in big data, blockchain, and artificial intelligence (AI).

General and administrative expenses increased by $0.2 million, or 2.7%, to $8.4 million in the second half of fiscal 2020 from $8.2 million in the prior year period. After excluding the impact of non-cash share-based compensation expenses, non-GAAP general and administrative expenses2 increased by $0.4 million, or 8.0%, to $5.7 million in the second half of fiscal 2020 from $5.3 million in the same period of the previous year. The increase in non-GAAP administrative expenses was primarily due to an increase in administrative personnel and M&A related expenses as a result of business expansion.

General and administrative expenses decreased by $1.1 million, or 6.0%, to $16.3 million for the year ended June 30, 2020, from $17.4 million in the prior year period. The decrease was primarily due to the decrease of $3.2 million non-cash share-based compensation expenses. After the deduction of non-cash share-based compensation expenses, non-GAAP general and administrative expenses2 increased by $2.1 million, or 20.5%, to $12.6 million for the year ended June 30, 2020, from $10.4 million in the same period of the previous year. The increase in non-GAAP administrative expenses was primarily due to an increase in administrative personnel and M&A related expenses as a result of business expansion.

Operating Income/Loss

Operating income increased by $1.82 million to $0.04 million in the second half of fiscal 2020 from a loss of $1.78 million in the same period of the previous year. Operating margin was 0.1% in the second half of fiscal 2020, compared to -5.2% in the prior year period.

Operating income increased by $5.1 million to $1.3 million for the year ended June 30, 2020 from a loss of $3.8 million in the same period of the previous year. Operating margin was 1.4% for the year ended June 30, 2020, compared to -5.8% in the prior year period.

Other Income and Expenses

Total other income, net of other expenses increased to $1.1 million in the second half of fiscal 2020 from $0.1 million in the prior year period.

Total other income, net of other expenses increased to $2.4 million for the year ended June 30, 2020, from $0.7 million in the prior year period.

Provision (Benefits) for Income Taxes

Provision for income taxes increased by $0.5 million to $0.4 million in the second half of fiscal 2020 from $0.1 million income tax benefits in the same period of the previous year, mainly due to the reduction in recoverable losses for some of the Company’s subsidiaries.

Provision for income taxes was $0.8 million for the year ended June 30, 2020, compared to $0.2 million in fiscal 2019, mainly due to the reduction in recoverable losses for some of the Company’s subsidiaries.

Net Income/Loss and EPS

Net income for the second half of fiscal 2020 increased by $2.5 million to $0.8 million from a net loss of $1.7 million in the prior year period. After excluding the impact of non-cash share-based compensation expenses, non-GAAP net income3 increased by $2.4 million, or 196.7%, to $3.7 million in the second half of fiscal 2020 from $1.3 million in the same period of the previous year. After excluding the impact of non-controlling interests, net income attributable to CLPS Incorporation’s shareholders in the second half of fiscal 2020 was $0.6 million, or $0.04 basic and diluted earnings per share. After excluding the impact of non-cash share-based compensation expenses, non-GAAP net income attributable to CLPS Incorporation’s shareholders1 in the second half of fiscal 2020 was $3.5 million, or $0.23 basic and diluted earnings per share. This is compared to non-GAAP net income attributable to CLPS Incorporation’s shareholders of $1.2 million, or $0.08 basic and diluted earnings per share, in the second half of fiscal 2019.

Net income for the year ended June 30, 2020 increased by $6.5 million to $3.1 million from a net loss of $3.4 million in the prior year period. The increase in net income was due to the decrease in non-cash share-based compensation expenses. After the deduction of non-cash share-based compensation expenses, non-GAAP net income3 increased by $3.5 million, or 97.7%, to $7.1 million for the year ended June 30, 2020, from $3.6 million in the same period of the previous year. After the deduction of non-controlling interests, net income attributable to CLPS Incorporation’s shareholders for the year ended June 30, 2020, was $2.9 million, or $0.20 basic and diluted earnings per share. After excluding the impact of non-cash share-based compensation expenses, non-GAAP net income attributable to CLPS Incorporation’s shareholders1 for the year ended June 30, 2020, was $6.9 million, or $0.47 basic and diluted earnings per share. This is compared to non-GAAP net income attributable to CLPS Incorporation’s shareholders of $3.7 million, or $0.27 basic and diluted earnings per share, in the prior year period.

Cash Flow

As of June 30, 2020, the Company had cash and cash equivalents of $12.7 million compared to $6.6 million as of June 30, 2019.

Net cash provided by operating activities was approximately $5.9 million for the twelve months ended June 30, 2020. Net cash provided by investing activities was approximately $0.2 million. Net cash provided by financing activities was approximately $0.1 million. The effect of exchange rate change on cash was approximately negative $0.2. The Company believes that its current cash position and cash flow from operations are sufficient to meet its anticipated cash needs for at least the next 12 months.

Financial Outlook

For fiscal year 2021, the Company expects, absent material acquisitions or non-recurring transactions, total sales growth in the range of approximately 30% to 35%, non-GAAP net income growth in the range of approximately 32% to 37% compared to fiscal year 2020 financial results.

This forecast reflects the Company’s current and preliminary views, which are subject to change and are subject to risks and uncertainties, including, but not limited to, potential accounting adjustments attributable to Ridik Pte. Ltd. acquisition as well as various risks and uncertainties facing the Company’s business and operations as identified in its public filings.

Exchange Rate

The balance sheet amounts with the exception of equity as of June 30, 2020, were translated at 7.0651 RMB to 1.00 USD compared to 6.8650 RMB to 1.00 USD as of June 30, 2019. The equity accounts were stated at their historical rate. The average translation rates applied to the income statements accounts for the periods ended June 30, 2020 and 2019 were 7.0309 RMB to 1.00 USD and 6.8211 RMB to 1.00 USD, respectively. The change in the value of the RMB relative to the U.S. dollar may affect our financial results reported in the U.S, dollar terms without giving effect to any underlying change in our business or results of operation.

Conference Call Information

The Company will hold a conference call at 8:30 am ET on October 23, 2020 to discuss second half and full year of fiscal 2020 results. Listeners may access the call by dialing:

U.S. Toll-Free:

+1-888-394-8218

U.S. Local /International:

+1-323-794-2588

Mainland China:

400 120 8590

Hong Kong:

800 961 384

To access the live webcast of the conference call, please visit this link. The live and archived webcast will also be available through the Company’s investor relations website at http://ir.clpsglobal.com.

A replay of the call will be available through November 6, 2020 by dialing:

U.S. Toll-Free:

+1-844-512-2921

U.S. Local/International:

+1-412-317-6671

Passcode:

1612001

About CLPS Incorporation

Headquartered in Hong Kong, CLPS Incorporation (the "Company") (Nasdaq: CLPS) is a global leading information technology ("IT"), consulting and solutions service provider focusing on the banking, insurance and financial sectors. The Company serves as an IT solutions provider to a growing network of clients in the global financial industry, including large financial institutions in the US, Europe, Australia, Southeast Asia and Hong Kong, and their PRC-based IT centers. The Company maintains 18 delivery and/or research & development centers to serve different customers in various geographic locations. Mainland China centers are located in Shanghai, Beijing, Dalian, Tianjin, Baoding, Chengdu, Guangzhou, Shenzhen, Hangzhou, and Suzhou. The remaining eight global centers are located in Hong Kong SAR, USA, UK, Japan, Singapore, Malaysia, Australia, and India. For further information regarding the Company, please visit: http://ir.clpsglobal.com/, or follow CLPS on Facebook, LinkedIn, and Twitter.

Forward-Looking Statements

Certain of the statements made in this press release are "forward-looking statements" within the meaning and protections of Section 27A of the Securities Act of 1933, as amended, and Section 21E of the Securities Exchange Act of 1934, as amended. Forward-looking statements include statements with respect to the Company’s beliefs, plans, objectives, goals, expectations, anticipations, assumptions, estimates, intentions, and future performance, and involve known and unknown risks, uncertainties and other factors, which may be beyond the Company’s control, and which may cause the actual results, performance, capital, ownership or achievements of the Company to be materially different from future results, performance or achievements expressed or implied by such forward-looking statements. All such statements attributable to us are expressly qualified in their entirety by this cautionary notice, including, without limitation, those risks and uncertainties related to the Company’s financial and operational performance in the second half and full year of fiscal 2020, its expectations of the Company’s future performance, its preliminary outlook and guidance offered in this presentation, as well as the risks and uncertainties described in the Company’s most recently filed SEC reports and filings. Such reports are available upon request from the Company, or from the Securities and Exchange Commission, including through the SEC’s Internet website at http://www.sec.gov. We have no obligation and do not undertake to update, revise or correct any of the forward-looking statements after the date hereof, or after the respective dates on which any such statements otherwise are made.

Use of Non-GAAP Financial Measures

The unaudited condensed consolidated financial information is prepared in conformity with accounting principles generally accepted in the United States of America ("U.S. GAAP"), except that the consolidated statement of changes in shareholders’ equity, consolidated statements of cash flows, and the detailed notes have not been presented. The Company uses non-GAAP operating income, non-GAAP operating margin, non-GAAP net income attributable to CLPS Incorporation’s shareholders, and basic and diluted non-GAAP net income per share, which are non-GAAP financial measures. Non-GAAP operating income is operating income excluding share-based compensation expenses. Non-GAAP operating margin is non-GAAP operating income as a percentage of revenues. Non-GAAP net income attributable to CLPS Incorporation’s shareholders is net income attributable to CLPS Incorporation’s shareholders excluding share-based compensation expenses. Basic and diluted non-GAAP net income per share is non-GAAP net income attributable to common shareholders divided by weighted average number of shares used in the calculation of basic and diluted net income per share. The Company believes that separate analysis and exclusion of the non-cash impact of share-based compensation expenses clarity to the constituent parts of its performance. The Company reviews these non-GAAP financial measures together with GAAP financial measures to obtain a better understanding of its operating performance. It uses the non-GAAP financial measure for planning, forecasting and measuring results against the forecast. The Company believes that non-GAAP financial measure is useful supplemental information for investors and analysts to assess its operating performance without the effect of non-cash share-based compensation expenses, which have been and will continue to be significant recurring expenses in its business. However, the use of non-GAAP financial measures has material limitations as an analytical tool. One of the limitations of using non-GAAP financial measures is that they do not include all items that impact the Company’s net income for the period. In addition, because non-GAAP financial measures are not measured in the same manner by all companies, they may not be comparable to other similar titled measures used by other companies. In light of the foregoing limitations, you should not consider non-GAAP financial measure in isolation from or as an alternative to the financial measure prepared in accordance with U.S. GAAP.

The presentation of these non-GAAP financial measures is not intended to be considered in isolation from, or as a substitute for, the financial information prepared and presented in accordance with U.S. GAAP. The Company encourages investors to carefully consider its results under GAAP, as well as its supplemental non-GAAP information and the reconciliation between these presentations, to more fully understand its business. For more information on these non-GAAP financial measures, please see the table captioned "Reconciliations of Non-GAAP and GAAP Results" near the end of this release.

Contact:    

CLPS Incorporation
Rhon Galicha
Investor Relations Office 
Phone: +86-182-2192-5378
Email: ir@clpsglobal.com

1 Non-GAAP net income attributable to CLPS Incorporation’s shareholders is a non-GAAP financial measure, which is defined as net income attributable to the Company excluding share-based compensation expenses. Please refer to the section titled "Reconciliation of GAAP and Non-GAAP Results" for details.

2 Non-GAAP general and administrative expenses is a non-GAAP financial measure, which is defined as general and administrative expenses excluding share-based compensation expenses. Please refer to the section titled "Reconciliation of GAAP and Non-GAAP Results" for details.

3 Non-GAAP net income is a non-GAAP financial measure, which is defined as net income excluding share-based compensation expenses. Please refer to the section titled "Reconciliation of GAAP and Non-GAAP Results" for details.


CLPS INCORPORATION

CONSOLIDATED BALANCE SHEETS

(Amounts in U.S. dollars ("$"), except for number of shares)

As of June 30,

 As of December 31,

2020

(Audited)

2019

(Unaudited)

ASSETS

Current assets

Cash and cash equivalents

$

12,652,120

$

11,234,260

Short-term investments

636,934

Accounts receivable, net

25,753,856

20,857,441

Escrow receivable

200,000

Prepayments, deposits and other assets, net

1,280,967

1,998,499

Prepaid income tax

15,780

524,352

Amounts due from related parties

169,185

252,706

Total Current Assets

40,508,842

35,067,258

Property and equipment, net

452,472

471,886

Intangible assets, net

1,144,579

1,240,490

Goodwill

2,118,700

2,184,001

Long-term investments

680,131

1,102,691

Prepayments, deposits and other assets, net

244,387

220,661

Deferred tax assets, net

203,247

251,912

Total Assets

$

45,352,358

$

40,538,899

LIABILITIES AND SHAREHOLDERS’ EQUITY

Current liabilities

Short-term bank loans

$

2,161,239

$

802,514

Accounts payable and other current liabilities

489,043

1,006,896

Tax payables

1,426,614

1,178,472

Contract liabilities

755,178

1,241,706

Salaries and benefits payable

11,522,268

10,789,713

Total Current Liabilities

16,354,342

15,019,301

Long-term bank loans

22,554

Deferred tax liabilities

163,163

192,127

Unrecognized tax benefits

194,939

 TOTAL LIABILITIES

16,734,998

15,211,428

Commitments and Contingencies

Shareholders’ Equity

Common stock, $0.0001 par value, 100,000,000 shares authorized; 15,930,330
       shares issued and outstanding as of June 30, 2020; 13,913,201 shares
       issued and outstanding as of June 30, 2019. *

1,593

1,425

Additional paid-in capital

28,586,048

25,648,785

Statutory reserves

2,803,811

2,331,138

Retained earnings

(2,680,143)

(2,776,767)

Accumulated other comprehensive loss

(1,362,665)

(960,744)

Total CLPS Incorporation’s Shareholders’ Equity

27,348,644

24,243,837

Non-controlling Interests

1,268,716

1,083,634

Total Shareholders’ Equity

28,617,360

25,327,471

Total Liabilities and Shareholders’ Equity

$

45,352,358

$

40,538,899

* The shares and per share data are presented on a retroactive basis to reflect the nominal share issuance.


CLPS INCORPORATION

UNAUDITED CONSOLIDATED STATEMENTS OF INCOME AND COMPREHENSIVE INCOME

(Amounts in U.S. dollars ("$"), except for number of shares)

For the six months ended

June 30,

2020

2019

Revenues

$

46,847,534

$

34,137,189

Less: Cost of revenues (note 1)

(31,104,457)

(21,552,693)

Gross profit

15,743,077

12,584,496

Operating expenses:

Selling and marketing expenses (note 1)

1,655,650

1,206,153

Research and development expenses

5,416,455

4,939,522

General and administrative expenses (note 1)

8,446,840

8,223,126

Other operating expense

187,496

Total operating expenses

15,706,441

14,368,801

Income (loss) from operations

36,636

(1,784,305)

Subsidies and other income, net

1,163,956

156,352

Other expenses

(77,229)

(30,712)

Income (loss) before income tax and share of loss in equity
    investees

1,123,363

(1,658,665)

Provision (benefits) for income taxes

446,601

(56,283)

Income (loss) before share of income in equity investees

676,762

(1,602,382)

Share of income in equity investees, net of tax

107,895

(145,329)

Net income (loss)

784,657

(1,747,711)

Less: Net income attributable to non-controlling interests

215,359

89,434

Net income (loss) attributable to CLPS Incorporation’s
    shareholders

$

569,298

$

(1,837,145)

Other comprehensive loss (income)

Foreign currency translation loss

$

(432,198)

$

(58,964)

Less: foreign currency translation (loss) gain attributable to non-
    controlling interest

(30,277)

2,052

Other comprehensive loss attributable to CLPS
    Incorporation’s shareholders

$


(401,921)

$


(61,016)

Comprehensive income (loss) attributable to

CLPS Incorporation shareholders

$

167,377

$

(1,898,161)

Non-controlling interests

184,562

1

91,486

$

351,939

$

(1,806,675)

Basic earnings  (loss) per common share*

$

0.04

$

(0.13)

Weighted average number of share outstanding – basic

15,169,655

13,889,460

Diluted  earnings (loss) per common share*

$

0.04

$

(0.13)

Weighted average number of share outstanding – diluted (note 2)

15,212,010

13,889,460

Note:

(1)    Includes share-based compensation expenses as follows:
        
Cost of revenues

9,042

9,472

Selling and marketing expenses

181,257

46,100

General and administrative expenses

2,747,132

2,946,803

(2)  All dilutive potential common shares had anti-dilutive impact and were excluded in computation of diluted
earnings per share in the period when loss was reported.

* The shares and per share data are presented on a retroactive basis to reflect the nominal share issuance.


CLPS INCORPORATION

RECONCILIATION OF NON-GAAP AND GAAP RESULTS

(Amounts in U.S. dollars ("$"), except for number of shares)

For the six months ended 

June 30,

2020

2019

Cost of revenues

$

(31,104,457)

$

(21,552,693)

Less: share-based compensation expenses

9,042

9,472

Non-GAAP cost of revenues

$

(31,095,415)

$

(21,543,221)

Selling and marketing expenses

$

1,655,650

$

1,206,153

Less: share-based compensation expenses

181,257

46,100

Non-GAAP selling and marketing expenses

$

1,474,393

$

1,160,053

General and administrative expenses

$

8,446,840

$

8,223,126

Less: share-based compensation expenses

2,747,132

2,946,803

Non-GAAP general and administrative expenses

$

5,699,708

$

5,276,323

Operating income (loss)

$

36,636

$

(1,784,305)

Add: share-based compensation expenses

2,937,431

3,002,375

Non-GAAP operating income

$

2,974,067

$

1,218,070

Operating margin

0.1%

(5.2%)

Add: share-based compensation expenses

6.2%

8.8%

Non-GAAP operating margin

6.3%

3.6%

Net income (loss)

$

784,657

$

(1,747,711)

Add: share-based compensation expenses

2,937,431

3,002,375

Non-GAAP net income

$

3,722,088

$

1,254,664

Net income (loss) attributable to CLPS Incorporation’s
shareholders

$

569,298

$

(1,837,145)

Add: share-based compensation expenses

2,937,431

3,002,375

Non-GAAP net income attributable to CLPS
Incorporation’s shareholders

3,506,729

1,165,230

$

$

Weighted average number of share outstanding used
in computing GAAP and non-GAAP basic earnings

15,169,655

13,889,460

GAAP basic earnings (loss) per common share

$

0.04

$

(0.13)

Add: share-based compensation expenses

0.19

0.21

Non-GAAP basic earnings per common share

$

0.23

$

0.08

Weighted average number of share outstanding used
in computing GAAP diluted earnings

15,212,010

13,889,460

Add: effect of dilutive securities (note 1)

184,316

Weighted average number of share outstanding used
in computing non-GAAP diluted earnings

15,212,010

14,073,776

GAAP diluted earnings (loss) per common share

$

0.04

$

(0.13)

Add: share-based compensation expenses

0.19

0.21

Non-GAAP diluted earnings per common share

$

0.23

$

0.08

Note:

(1)   All dilutive potential common shares had anti-dilutive impact and were excluded in computation of 

GAAP diluted earnings per share in the period when loss was reported.


CLPS INCORPORATION

AUDITED CONSOLIDATED BALANCE SHEETS

(Amounts in U.S. dollars ("$"), except for number of shares)

As of June 30,

2020

2019

ASSETS

Current assets

Cash and cash equivalents

$

12,652,120

$

6,601,335

Short-term investments

636,934

1,791,697

Accounts receivable, net

25,753,856

19,263,584

Escrow receivable

200,000

Prepayments, deposits and other assets, net

1,280,967

1,028,154

Prepaid income tax

15,780

630,790

Amounts due from related parties

169,185

230,540

Total Current Assets

40,508,842

29,746,100

Property and equipment, net

452,472

566,591

Intangible assets, net

1,144,579

427,769

Goodwill

2,118,700

447,790

Long-term investments

680,131

914,006

Prepayments, deposits and other assets, net

244,387

222,507

Deferred tax assets, net

203,247

338,221

Total Assets

$

45,352,358

$

32,662,984

LIABILITIES AND SHAREHOLDERS’ EQUITY

Current liabilities

Short-term bank loans

$

2,161,239

$

2,184,996

Accounts payable and other current liabilities

489,043

196,832

Tax payables

1,426,614

915,629

Deferred subsidies

109,250

Deferred revenues

124,192

Contract liabilities

755,178

Salaries and benefits payable

11,522,268

7,735,487

Total Current Liabilities

16,354,342

11,266,386

Long-term bank loans

22,554

Deferred tax liabilities

163,163

Unrecognized tax benefits

194,939

 TOTAL LIABILITIES

16,734,998

11,266,386

Commitments and Contingencies

Shareholders’ Equity

Common stock, $0.0001 par value, 100,000,000 shares authorized;
15,930,330 shares issued and outstanding as of June 30, 2020;
13,913,201 shares issued and outstanding as of June 30, 2019. *

1,593

1,391

Additional paid-in capital

28,586,048

24,276,622

Statutory reserves

2,803,811

1,833,802

Retained earnings

(2,680,143)

(4,509,729)

Accumulated other comprehensive loss

(1,362,665)

(813,650)

Total CLPS Incorporation’s Shareholders’ Equity

27,348,644

20,788,436

Non-controlling Interests

1,268,716

608,162

Total Shareholders’ Equity

28,617,360

21,396,598

Total Liabilities and Shareholders’ Equity

$

45,352,358

$

32,662,984

* The shares and per share data are presented on a retroactive basis to reflect the nominal share issuance.


CLPS INCORPORATION

AUDITED CONSOLIDATED STATEMENTS OF INCOME AND COMPREHENSIVE INCOME

(Amounts in U.S. dollars ("$"), except for number of shares)

For the years ended

June 30,

2020

2019

Revenues

$

89,415,798

$

64,932,937

Less: Cost of revenues (note 1)

(58,296,097)

(41,178,356)

Gross profit

31,119,701

23,754,581

Operating expenses:

Selling and marketing expenses (note 1)

3,059,877

2,179,029

Research and development expenses

10,436,975

7,978,883

General and administrative expenses (note 1)

16,343,936

17,384,393

Total operating expenses

29,840,788

27,542,305

Income (loss) from operations

1,278,913

(3,787,724)

Subsidies and other income, net

2,535,868

779,508

Other expenses

(107,322)

(92,429)

Income (loss) before income tax and share of income (loss) in
   equity investees

3,707,459

(3,100,645)

Provision for income taxes

835,444

186,615

Income (loss) before share of income (loss) in equity investees

2,872,015

(3,287,260)

Share of income (loss) in equity investees, net of tax

207,363

(145,329)

Net income (loss)

3,079,378

(3,432,589)

Less: Net income (loss) attributable to non-controlling interests

141,139

(162,813)

Net income (loss) attributable to CLPS Incorporation’s
   shareholders

$

2,938,239

$

(3,269,776)

Other comprehensive loss

Foreign currency translation loss

$

(571,943)

$

(429,348)

Less: foreign currency translation loss attributable to non-
   controlling interests

(22,928)

(17,375)

Other comprehensive loss attributable to CLPS
   Incorporation’s shareholders

$

(549,015)

$

(411,973)

Comprehensive income (loss) attributable to

CLPS Incorporation shareholders

$

2,389,224

$

(3,681,749)

Non-controlling interests

118,211

(180,188)

$

2,507,435

$

(3,861,937)

Basic earnings (loss) per common share*

$

0.20

$

(0.24)

Weighted average number of share outstanding – basic

14,689,224

13,843,764

Diluted earnings (loss) per common share*

$

0.20

$

(0.24)

Weighted average number of share outstanding – diluted (note 2)

14,692,299

13,843,764

Note:

(1)   Includes share-based compensation expenses as follows: 
       
Cost of revenues

14,110


9,472

Selling and marketing expenses

211,573

46,100

General and administrative expenses

3,778,397

6,960,517

(2)  All dilutive potential common shares had anti-dilutive impact and were excluded in computation of diluted 
earnings per share in the period when loss was reported.

* The shares and per share data are presented on a retroactive basis to reflect the nominal share issuance.


CLPS INCORPORATION

RECONCILIATION OF NON-GAAP AND GAAP RESULTS

(Amounts in U.S. dollars ("$"), except for number of shares)

For the years ended 

June 30,

2020

2019

Cost of revenues

$

(58,296,097)

$

(41,178,356)

Less: share-based compensation expenses

14,110

9,472

Non-GAAP cost of revenues

$

(58,281,987)

$

(41,168,884)

Selling and marketing expenses

$

3,059,877

$

2,179,029

Less: share-based compensation expenses

211,573

46,100

Non-GAAP selling and marketing expenses

$

2,848,304

$

2,132,929

General and administrative expenses

$

16,343,936

$

17,384,393

Less: share-based compensation expenses

3,778,397

6,960,517

Non-GAAP general and administrative expenses

$

12,565,539

$

10,423,876

Operating  income (loss)

$

1,278,913

$

(3,787,724)

Add: share-based compensation expenses

4,004,080

7,016,089

Non-GAAP operating income

$

5,282,993

$

3,228,365

Operating Margin

1.4%

(5.8%)

Add: share-based compensation expenses

4.5%

10.8%

Non-GAAP operating margin

5.9%

5.0%

Net income (loss)

$

3,079,378

$

(3,432,589)

Add: share-based compensation expenses

4,004,080

7,016,089

Non-GAAP net income

$

7,083,458

$

3,583,500

Net income (loss) attributable to CLPS Incorporation’s
shareholders

$

2,938,239

$

(3,269,776)

Add: share-based compensation expenses

4,004,080

7,016,089

Non-GAAP net income attributable to CLPS
Incorporation’s shareholders

$

6,942,319

$

3,746,313

Weighted average number of share outstanding used in
computing GAAP and non-GAAP basic earnings

14,689,224

13,843,764

GAAP basic earnings (loss) per common share

$

0.20

$

(0.24)

Add: share-based compensation expenses

0.27

0.51

Non-GAAP basic earnings per common share

$

0.47

$

0.27

Weighted average number of share outstanding used in
computing GAAP diluted earnings

14,692,299

13,843,764

Add: effect of dilutive securities (note 1)

194,824

Weighted average number of share outstanding used in
computing non-GAAP diluted earnings

14,692,299

14,038,588

GAAP diluted earnings (loss) per common share

$

0.20

$

(0.24)

Add: share-based compensation expenses

0.27

0.51

Non-GAAP diluted earnings per common share

$

0.47

$

0.27

Note:

(1)   All dilutive potential common shares had anti-dilutive impact and were excluded in computation of 

GAAP diluted earnings per share in the period when loss was reported.


Related Links :

http://www.clps.com.cn

Color Star Technology Announces Receipt of Nasdaq Continued Listing Deficiency Notice

NEW YORK, Oct. 23, 2020 — Color Star Technology Co., Ltd. (Nasdaq CM: CSCW) (the "Company", or "Color Star"), a company engaged in the businesses of providing online and offline paid knowledge services for the media, entertainment and culture industries globally, today announced on October 16, 2020, the Company received a notification letter (the "Notification") from Nasdaq Listing Qualifications advising the Company that based upon the closing bid price for the Company’s ordinary shares for the past 30 consecutive business days, the Company no longer met the minimum $1.00 per share Nasdaq continued listing requirement set forth in Nasdaq Listing Rule 5550(a)(2). The Notification also stated that Under Rule 5810(c)(3)(A), the Company would be provided 180 calendar days, or until April 14, 2021, to regain compliance with the foregoing listing requirement. To do so, the bid price of the Company’s ordinary shares must close at or above $1.00 per share for a minimum of 10 consecutive business days prior to that date.

In the event the Company does not regain compliance by the first compliance deadline, the Company may be eligible for additional time to regain compliance. To qualify, the Company will be required to meet the continued listing requirement for market value of publicly held shares and all other initial listing standards for The Nasdaq Capital Market, with the exception of the bid price requirement, and will need to provide written notice of its intention to cure the deficiency during the second compliance period, by effecting a reverse stock split, if necessary. If the Company meets these requirements, the Nasdaq staff will inform the Company that it has been granted an additional 180 calendar days. However, if it appears to the Nasdaq staff that the Company will not be able to cure the deficiency, or if the Company is otherwise not eligible, the staff will provide notice that its securities will be subject to delisting.

The Company provides no assurance that its ordinary shares will trade at levels necessary to regain and maintain compliance with the above-referenced bid price rule before the compliance deadline. The Company intends to continue to monitor the bid price for its ordinary shares. If the Company’s ordinary shares do not trade at a level that is likely to regain compliance with the Nasdaq requirements, the Company’s Board of Directors will consider other options that may be available to achieve compliance.

About Color Star Technology

Color Star Technology Co, Ltd. (Nasdaq CM: CSCW) offers online and offline paid knowledge services for media, entertainment and culture industries globally. Its business operations are conducted through its wholly-owned subsidiaries Color China Entertainment Ltd. and CACM Group NY, Inc. The Company’s online education is provided through its Color World music and entertainment education platform. The Company also offers after-school entertainment tutoring in New York via its joint venture entity Baytao LLC. More information about the Company can be found at www.colorstarinternational.com.

Forward-Looking Statement

This press release contains forward-looking statements as defined by the Private Securities Litigation Reform Act of 1995. Forward-looking statements include statements concerning plans, objectives, goals, strategies, future events or performance, and underlying assumptions and other statements that are other than statements of historical facts. When the Company uses words such as "may," "will," "intend," "should," "believe," "expect," "anticipate," "project," "estimate" or similar expressions that do not relate solely to historical matters, it is making forward-looking statements. Specifically, the Company’s statements regarding its intention to cure the Nasdaq continued listing deficiency are forward-looking statement. Forward-looking statements are not guarantee of future performance and involve risks and uncertainties that may cause the actual results to differ materially from the Company’s expectations discussed in the forward-looking statements. These statements are subject to uncertainties and risks including, but not limited to, the following:  the Company’s goals and strategies; the Company’s future business development; product and service demand and acceptance; changes in technology; economic conditions; the growth of the educational and training services market in China and other countries where CSCW conducts its business; reputation and brand; the impact of competition and pricing; government regulations; fluctuations in general economic and business conditions and assumptions underlying or related to any of the foregoing and other risks contained in reports filed by the Company with the Securities and Exchange Commission.  For these reasons, among others, investors are cautioned not to place undue reliance upon any forward-looking statements in this press release. Additional factors are discussed in the Company’s filings with the U.S. Securities and Exchange Commission, which are available for review at www.sec.gov. The Company undertakes no obligation to publicly revise these forward–looking statements to reflect events or circumstances that arise after the date hereof.

For more information, please contact:

Tony Tian, CFA 
Email: ttian@weitianco.com
Phone: +1-732-910-9692


Media Invitation to HKBN FY2020 Annual Results Live Webcast


To: Business Editor / Assignment Editor

HKBN FY2020 Annual Results Live Webcast

Due to the current circumstances, HKBN Ltd. (SEHK Stock Code: 1310) will hold its annual results media presentation via webcast this year. In the webcast, the company will share with media members its key annual financial results for the 12 months ended 31 August 2020, as well as its business outlook.

We cordially invite your presence to cover the event. Details of the live webcast are as follows:

Date:

29 October 2020 (Thursday)

Time:

4:30pm

Link:

https://webcasts.asia.eqs.com/register/hkbn20ar/en (You are advised to join 15 minutes earlier for registration)

Presenting Executive:

Mr. William Yeung
HKBN Co-Owner and Executive Vice-chairman

Language:

Cantonese

* If you cannot view this webcast via Microsoft Internet Explorer Browser, we recommend using the latest version of Google Chrome or Mozilla Firefox for viewing this webcast.

Please fill in and send the attached Media Reply Slip to media@hkbn.com.hk or fax to +852 3999 7349 by 27 October.

Media Reply Slip

HKBN FY2020 Annual Results Live Webcast

To: HKBN Ltd.


Email : media@hkbn.com.hk
Fax  : 3999 7349

□     Our representative(s) will attend HKBN FY2020 Annual Results Live Webcast

□     Our representative(s) will not attend and would like to receive related press material


Media name:                                                                                                                         


Reporter name:                                                                                                                             

Title:                                                       

Mobile:                                                 

Email:______________________________


/PRNewswire — Oct. 22, 2020/

Entrust Launches Next Generation Secure Cloud-Based Direct to Card ID Desktop Issuance Solution

The next generation Entrust Sigma instant ID solution is built for today’s cloud environments, leveraging encryption, trusted HSM technology and secure boot to issue highly secure physical and mobile identities

SINGAPORE, Oct. 21, 2020 Entrust, a leading provider of trusted identities, payments and data protection, today announced Sigma Instant Desktop Issuance solution, an innovative direct-to-card issuance solution for instant physical and mobile ID issuance. Designed for both cloud and on-premise deployment, the Sigma solution sets the standard for simple, secure and smart instant ID solutions across enterprise, healthcare, government, higher education and financial institutions.

Entrust Launches Next Generation Secure Cloud-Based Direct to Card ID Desktop Issuance Solution


Today’s enterprises face a myriad of security challenges: From transitioning to digital operations during the pandemic, to managing the global rise in cyber-attacks, they must maintain a safe and secure flow of data − including the data stored on physical credentials. Within these organizations, Identity and Access Management professionals require a printing solution that is not only easy to integrate into their operations, but one that evolves to meet the growing needs of their company while assuring the highest level of data security. Sigma systems deliver a seamless user experience across the issuance process for desktop and mobile printing needs. It eliminates the frustrations of printer set-up with a modular design and an out-of-the-box implementation that takes less than 30 minutes for users to begin issuing identities.

Equipped with cloud-based APIs, Sigma systems bring issuance to the cloud without additional hardware — enabling instant printing for both physical IDs, badges and payment cards. Sigma systems are trusted IoT devices that help ensure organizations and their data are safe with an intelligent network and building connectivity for ultimate enterprise protection. With capabilities like tactile impressions, holographic and luster panel printing, Sigma printers make it highly difficult for counterfeiters to alter or recreate cards. Additionally, features like an inline magnetic stripe and smart card encoding secure your cards during the card printing process.

"With our Sigma platform, we’re proud to deliver a best-in-class desktop credential issuance solution that’s designed to work completely and securely within a cloud environment, allowing financial, enterprise, government, higher education and healthcare organizations to meet high-volume issuance demands without sacrificing security or ease of use. The Sigma system is ready to meet the issuance needs of today, and equally important, will evolve to meet tomorrow’s security and technology challenges with unlimited printing applications," said Tony Ball, Senior Vice President and General Manager of Instant Issuance at Entrust. "Entrust has been a pioneer in direct to card identity issuance technology for decades, and our Sigma system takes it to a whole new level."

Sigma systems offer the most advanced security architecture that keeps data protected at each step of the issuance process:

  • Encrypted connections: The connection and data sent between software and the printer are secure and encrypted. Sigma printers do not store customer data after successful printing is complete.
  • Secure boot: This feature prevents Sigma systems from booting up malware or other compromises are detected.
  • Trusted platform module (TPM): Organizations can store and manage user certificates and keys in the printer, allowing the printer to become a trusted internet of things (IoT) endpoint.

As large segments of the workforce continue operating remotely, Sigma systems are poised to meet the demands of a hybrid workforce with its physical and digital issuance platform. The Sigma system’s "Printer Dashboard" is available on mobile devices, allowing organizations to manage the printer from anywhere, without being tied to a desktop. Sigma systems also enable companies to pivot and move to a contactless ID Issuance experience, from online photo submission to validating the photo, printing the card, and ultimately delivering the card to the employee. Furthermore, the on-premises instant ID solution features a mobile enrollment functionality for added flexibility to issue IDs at various locations within a facility. Sigma systems use intelligent instant ID technology to streamline printing and eliminate manual workflows — bringing simplicity, security and flexibility to the issuance process.

"Whether your requirements demand an integrated, secure on-premises solution or a system that can grow with a distributed workforce via a secure cloud-hosted Identity Management offering, the Entrust Sigma solutions can meet your needs," said Joe Franco, Director of Sales at Capture Technologies, an Entrust channel partner. "They are browser based and mobile ready and able to be deployed without the need for a heavy client to be installed. The certificate based integrated security features should put to rest any concerns about using the cloud for identity issuance or your printing solution being vulnerable to network attack."

For more information about Sigma visit: https://www.entrust.com/c/meet-sigma.

About Entrust

Entrust keeps the world moving safely by enabling trusted identities, payments and data protection. Today more than ever, people demand seamless, secure experiences, whether they’re crossing borders, making a purchase, accessing e-government services or logging into corporate networks. Entrust offers an unmatched breadth of digital security and credential issuance solutions at the very heart of all these interactions. With more than 2,500 colleagues, a network of global partners, and customers in over 150 countries, it’s no wonder the world’s most entrusted organizations trust us. To learn more, visit www.entrust.com.

Media Contact

Ken Kadet
Vice President, Public Relations
+1-952.988.1154
ken.kadet@entrustdatacard.com

Entrust APAC
entrustdatacardapac@finnpartners.com
+65-9732-5164

Related Links :

https://www.entrust.com