Tag Archives: FIN

Australian Crypto Exchange CEO Argues to Move All Long-Term Digital Asset Storage Offline

Alex Harper, the founder of Australia’s fastest-growing online cryptocurrency exchange, Swyftx, recently reminded his community that offline storage is the superior option for long-term crypto holding as soon as crypto is purchased on an exchange.

SYDNEY, Nov. 16, 2020 — The CEO of Swyftx, Australia’s fastest-growing online crypto exchange is suggesting that all crypto holders should immediately purchase an offline wallet like Ledger Nano S as soon as they buy crypto because offline storage is superior.

The CEO argues that other exchanges need to step up to educate users on the importance of crypto security. He argues that other exchanges and executives need to say this message themselves just like he and his team are doing. They have also dedicated blog posts and potions of their website to educating users on cryptocurrency storage.

"Other exchanges are not stressing cold storage options hard enough. Don’t get me wrong, the technology of exchanges has advanced lightyears since the Mt. Gox era, or even where we were when we first started almost 3 years ago. However, it’s still hard if not impossible to beat offline crypto storage. Crypto exchanges need to come out and talk to their communities about this… big time."

Swyftx’s Community-Centered Approach to Crypto

Since they started in 2017, Swyftx has:

  • Country’s Largest Selection: They offer 189 cryptocurrencies which is more than any other exchange in Australia. They have an iOS and Android application as well as over 30,000 users.
  • 1,100% Growth: From 2018 to 2019, grew from doing over $10 million in monthly trading volume to $120M in monthly trading volume, a volume they’ve kept up during the COVID pandemic. Grew from a two-person founding team who were science camp buddies into Australia’s fastest-growing startup.
  • Country’s Highest-Rated Exchange: The exchange currently has a 4.9 out of 5-star rating on TrustPilot with over 600 5-star reviews. Meanwhile, competitors hover around a rating that is roughly 20% less favourable.

Harper said that Swyftx is more concerned about creating a great product that people love over anything else. He said Swyftx is more concerned about loyalty than profitability because he believes that by differentiating yourself as a trustworthy brand in this space, you’re already leagues over other brands with a clouded or lukewarm reputation.

"Swyftx is concerned about creating a company that is profitable, but one that does the right thing. Other exchanges have been silent on cold storage and using Ledger. They want all of the funds to stay deposited on the exchange. However, we know that by doing the right thing and making our users more aware of Ledger, we will be building loyalty instead of orchestrating a quick cash grab. This will be apparent to our users because they know we have their best interest in mind. This is a long-term strategy to build trust with our users."

Swyftx has even created a guide to help users understand the risks with online storage and the benefits of hardware wallets.

About Swyftx

Swyftx is Australia’s most trusted and progressive cryptocurrency trading platform. It implements layered security, instant verification, best prices and live chat support. In 2019, Swyftx has grown 1100% to over $120M in monthly trading volume. Since then, Swyftx has grown to over 30,000 users and is planning to go international by 2021. Here is a link to the exchange’s website: https://swyftx.com.au.

Contact Details:

Press@swyftx.com.au

Related Links :

https://swyftx.com.au

Netmarble Issues Fiscal and Earnings Results for the Third Quarter of 2020

Q3 Performance Remains Steady Thanks to Strong Interest from Overseas Players

LOS ANGELES, Nov. 14, 2020Netmarble Corp., a global mobile game company focused on creating entertaining gaming experiences for players of all ages, revealed their financial results for the third quarter of 2020.

"We continue to see strong results at the end of our third quarter with significant overseas sales coming from our line-up of existing games," said Seungwon Lee, Co-CEO of Netmarble. "We have positive expectations for the recent global launch of A3: STILL ALIVE, our upcoming regional launch of Seven Knights 2, and Kabam’s upcoming release of MARVEL Realm of Champions."

"We’re looking forward to what 2021 will bring as we continue to deliver an exciting slate of new games next year, including Ni No Kuni: Cross Worlds, Seven Knights Revolution, and MARVEL Future Revolution," said Lee. "Thanks to our new partnership with the NBA and NBPA, we are committed to the continued growth of our portfolio through genre expansion".

Selected highlights from Netmarble’s third quarter include:

  • $535 million in total sales, $73 million in operating profit, and a net profit of $77 million from July through September. Cumulative sales for 2020 are estimated at $1.55 billion, with an operating profit of $158 million.
  • Total sales increased by 3.6% year-over-year and decreased by 6.3% quarter-on-quarter. Operating profit increased 3.6% year-over-year and 7% quarter-on-quarter.
  • Net profit increased by 9.2% year-over-year and 8.6% quarter-on-quarter.
  • Overseas sales accounted for 75% ($399 million) of overall sales in the third quarter. This follows Netmarble’s second quarter which offered the highest figure of overseas sales, and continues to follow an increasing trend in global sales thanks to the worldwide success of titles such The Seven Deadly Sins: Grand Cross (17% of revenue earned), MARVEL Contest of Champions (15% of revenue earned) (Kabam), Lineage 2: Revolution (9% of revenue earned) and Blade&Soul Revolution (8% of revenue earned).
  • Genre portfolio showed diversification across RPG (40%), Casual (25%), MMORPG (23%), and others (12%).

A breakdown of the total financial earnings is below:

7/1/20-9/30/20 actuals

YoY Changes

QoQ Changes

Total Sales

$535 million

+3.6%

-6.3%

Operating Profit

$73 million

+3.6%

+7.0%

Net Profit

$77 million

+9.2%

+8.6%

For details on Netmarble’s quarterly performance, and to listen to the earnings call, please visit the company’s Investor Relations page to learn more.

About Netmarble Corporation

Established in Korea in 2000, Netmarble Corporation is a top developer and publisher pushing the boundaries of the mobile gaming experience with highly innovative games including Lineage 2: Revolution, The Seven Deadly Sins: Grand Cross, Blade&Soul Revolution and MARVEL Future Fight. As a parent company of Kabam, and a major shareholder of Jam City and Big Hit Entertainment, Netmarble strives to entertain audiences around the world with a variety of mobile games based on its powerful franchises and collaborations with IP holders worldwide. More information can be found at http://company.netmarble.com

North America

Netmarble US
Chastity Irizarry
chastity.irizarry@netmarble.com

Rogers & Cowan PMK (for Netmarble in US)
Steven Kunz
netmarble@rogersandcowanpmk.com

Korea (Seoul)

HQ PR Team
Yonsol Chung
globalpr-g@netmarble.com  

Related Links :

http://company.netmarble.com

FinVolution Group to Report Third Quarter 2020 Financial Results on Tuesday, November 17, 2020

-Earnings Call Scheduled for 7:00 a.m. ET on November 17, 2020-

SHANGHAI, Nov. 13, 2020 — FinVolution Group ("FinVolution", or the "Company") (NYSE: FINV), a leading fintech platform in China, today announced that it will report its third quarter 2020 unaudited financial results, on Tuesday, November 17, 2020, before the open of U.S. markets.

The Company’s management will host an earnings conference call at 7:00 AM U.S. Eastern Time on November 17, 2020 (8:00 PM Beijing/Hong Kong time on November 17, 2020).

Dial-in details for the earnings conference call are as follows:

United States (toll free):

1-888-346-8982

International:

1-412-902-4272

Hong Kong, China (toll free):

800-905-945

Hong Kong, China:

852-3018-4992

Mainland China:

400-120-1203

Participants should dial-in at least 5 minutes before the scheduled start time and ask to be connected to the call for "FinVolution Group."

Additionally, a live and archived webcast of the conference call will be available on the Company’s investor relations website at  https://ir.finvgroup.com.

A replay of the conference call will be accessible approximately one hour after the conclusion of the live call until November 24, 2020, by dialing the following telephone numbers:

United States (toll free):

1-877-344-7529

International:

1-412-317-0088

Replay Access Code:

10149966

About FinVolution Group

FinVolution Group is a leading fintech platform in China connecting underserved individual borrowers with financial institutions. Established in 2007, the Company is a pioneer in China’s online consumer finance industry and has developed innovative technologies and has accumulated in-depth experience in the core areas of credit risk assessment, fraud detection, big data and artificial intelligence. The Company’s platform, empowered by proprietary cutting-edge technologies, features a highly automated loan transaction process, which enables a superior user experience. As of June 30, 2020, the Company had over 110.4 million cumulative registered users.

For more information, please visit https://ir.finvgroup.com.

For investor and media inquiries, please contact:

In China:
FinVolution Group
Head of Investor Relations
Jimmy Tan
Tel: +86 (21) 8030 3200-8601
E-mail: ir@xinye.com

The Piacente Group, Inc. Jenny Cai
Tel: +86 (10) 6508-0677
E-mail: finv@tpg-ir.com

In the United States:
The Piacente Group, Inc. Brandi Piacente
Tel: +1-212-481-2050
E-mail: finv@tpg-ir.com


Related Links :

https://ir.finvgroup.com

Fang Announces Third Quarter 2020 Unaudited Financial Results

BEIJING, Nov. 13, 2020 — Fang Holdings Limited (NYSE: SFUN) ("Fang" or the "Company"), a leading real estate Internet portal in China, today announced its unaudited financial results for the third quarter ended September 30, 2020.

Third Quarter 2020 Highlights

  • Total revenues were $56.7 million, a decrease of 16.1% from $67.6 million in the corresponding period of 2019.
  • Operating income from continuing operations was $17.7 million, a decrease of 33.7% from $26.7 million in the corresponding period of 2019.
  • Net income was $10.9 million, an increase of 1,393.3% from $0.7 million in the corresponding period of 2019.

Third Quarter 2020 Financial Results

Revenues

Fang reported total revenues of $56.7 million in the third quarter of 2020, a decrease of 16.1% from $67.6 million in the corresponding period of 2019, mainly due to the decrease in revenues from listing services.   

  • Revenue from marketing services was $30.3 million in the third quarter of 2020, which remained relatively stable with $30.0 million in the corresponding period of 2019.
  • Revenue from listing services was $10.1 million in the third quarter of 2020, a decrease of 48.2% from $19.4 million in the corresponding period of 2019, mainly due to the decrease in the number of paying customer.
  • Revenue from leads generation services was $12.9 million in the third quarter of 2020, a decrease of 8.2% from $14.1 million in the corresponding period of 2019.
  • Revenue from financial services was $1.9 million in the third quarter of 2020, an increase of 9.0% from $1.7 million in the corresponding period of 2019, mainly due to an increase in average loan receivable balances.

Cost of Revenue

Cost of revenue was $5.1 million in the third quarter of 2020, a decrease of 11.0% from $5.7 million in the corresponding period of 2019, primarily due to optimization in cost structure.

Operating Expenses

Operating expenses were $35.1 million in the third quarter of 2020, a decrease of 3.9% from 36.5 million in the corresponding period of 2019, mainly due to the decrease in staff related costs.

  • Selling expenses were $15.1 million in the third quarter of 2020, which remained relatively stable with $14.8 million in the corresponding period of 2019.
  • General and administrative expenses were $20.0 million in the third quarter of 2020, a decrease of 7.8% from $21.7 million in the corresponding period of 2019, mainly due to the decrease in staff related costs.

Operating Income from Continuing Operations

Operating income from continuing operations was $17.7 million in the third quarter of 2020, a decrease of 33.7% from $26.7 million in the corresponding period of 2019, mainly due to the decrease in total revenue.

Change in Fair Value of Securities

Change in fair value of securities for the third quarter of 2020 was a gain of $19.4 million, compared to a loss of $26.1 million in the corresponding period of 2019, mainly due to the fluctuation in market price of investments in equity securities.

Income Tax Expenses

Income tax expenses were $19.2 million in the third quarter of 2020, compared to income tax benefits of $0.1 million in the corresponding period of 2019, mainly due to the effect of change in fair value of equity securities.

Net Income

Net income was $10.9 million in the third quarter of 2020, an increase of 1,393.3% from net income of $0.7 million in the corresponding period of 2019.

Business Outlook

Based on current operations and market conditions, Fang’s management predicts a positive net income for the year of 2020, which represents management’s current and preliminary view and is subject to change.

Conference Call Information

Fang’s management team will host a conference call on the same day at 7:00 AM U.S. EST (8:00 PM Beijing/Hong Kong time). The dial-in details for the live conference call are:

International Toll:

+65 67135600

Toll-Free/Local Toll:

United States

+1 877-440-9253 / +1 631-460-7472

Hong Kong

+852 800-906-603 / +852 3018-6773

Mainland China

+86 800-870-0075 / +86 400-120-0948

Direct Event Passcode

1383200#

Please register in advance of the conference using the link provided below. Upon registering, you will be provided with participant dial-in numbers, Direct Event passcode (1383200#) and unique registrant ID. Get prompted 10 min prior to the start of the conference. Enter the Direct Event Passcode above (1383200#), and your unique Registrant ID, followed by the pound or hash (#) sign to get into the call.

Direct Event online registration: http://apac.directeventreg.com/registration/event/2585897

A telephone replay of the call will be available after the conclusion of the conference call from 10:00 AM ET on November 13, 2020 through 7:59 AM ET November 21, 2020. The dial-in details for the telephone replay are:

International Toll:

+61 2-8199-0299

Toll-Free/Local Toll:

United States

+1 855-452-5696 / +1 646-254-3697

Hong Kong

+852 800-963-117 / +852 3051-2780

Mainland China

+86 400-602-2065 / +86 800-870-0206

Conference ID:

2585897

A live and archived webcast of the conference call will be available on Fang’s website at http://ir.fang.com.

About Fang

Fang operates a leading real estate Internet portal in China in terms of the number of page views and visitors to its websites. Through its websites, Fang provides primarily marketing, listing, leads generation and financial services for China’s fast-growing real estate and home furnishing and improvement sectors. Its user-friendly websites support active online communities and networks of users seeking information on, and other value-added services for, the real estate and home furnishing and improvement sectors in China. Fang currently maintains approximately 74 offices to focus on local market needs and its website and database contains real estate related content covering 665 cities in China. For more information about Fang, please visit http://ir.fang.com.

Safe Harbor Statements

This press release contains forward-looking statements within the meaning of Section 27A of the Securities Act of 1933, as amended, and Section 21E of the Securities Exchange Act of 1934, as amended. Such forward-looking statements are made under the "safe harbor" provisions of the U.S. Private Securities Litigation Reform Act of 1995.

These forward-looking statements can be identified by terminology such as "will," "expects," "is expected to," "anticipates," "aim," "future," "intends," "plans," "believes," "are likely to," "estimates," "may," "should" and similar expressions, and include, without limitation, statements regarding Fang’s future financial performance, revenue guidance, growth and growth rates, market position and continued business transformation. Such statements are based upon management’s current expectations and current market and operating conditions, and relate to events that involve known or unknown risks, uncertainties and other factors, all of which are difficult to predict and many of which are beyond Fang’s control, which may cause its actual results, performance or achievements to differ materially from those in the forward-looking statements. Potential risks and uncertainties include, without limitation, the impact of Fang’s business development strategies, the impact of the COVID-19 pandemic, and the impact of current and future government policies affecting China’s real estate market. Further information regarding these and other risks, uncertainties or factors is included in Fang’s filings with the U.S. Securities and Exchange Commission. Fang does not undertake any obligation to update any forward-looking statement as a result of new information, future events or otherwise, except as required under law.


Fang Holdings Limited

Unaudited Condensed Consolidated Balance Sheets

(in thousands of U.S. dollars, except share data and per share data)

ASSETS

September 30,

December 31,

2020

2019

Current assets:

Cash and cash equivalents

111,848

105,282

Restricted cash, current

229,168

219,096

Short-term investments

253,135

194,720

Accounts receivable, net

98,999

66,379

Funds receivable

4,514

8,372

Prepayment and other current assets

32,494

31,509

Commitment deposits

193

188

Loans receivable, current

73,899

60,490

Amounts due from related parties

744

644

Total current assets 

804,994

686,680

Non-current assets:

Property and equipment, net

693,219

695,457

Deferred tax assets

3,145

6,570

Deposits for non-current assets

499

618

Restricted cash, non-current portion

44,086

42,452

Long-term investments

246,462

341,946

Other non-current assets

38,496

39,179

Total non-current assets

1,025,907

1,126,222

Total assets

1,830,901

1,812,902

LIABILITIES AND SHAREHOLDERS’ EQUITY

Current liabilities:

Short-term loans

300,301

264,624

Short-term bond payable

106,209

102,779

Deferred revenue

132,895

134,143

Accrued expenses and other liabilities

112,971

120,244

Customers’ refundable fees

3,915

4,981

Income tax payable

14,733

4,207

Amounts due to related parties

12,472

9,227

Total current liabilities

683,496

640,205

Non-current liabilities:

Long-term loans

150,299

184,158

Convertible senior notes

168,452

168,929

Deferred tax liabilities

95,985

90,723

Other non-current liabilities

114,049

138,435

Total non-current liabilities

528,785

582,245

Total Liabilities  

1,212,281

1,222,450

Equity:

Class A ordinary shares, par value Hong Kong Dollar ("HK$") 1 per share,
600,000,000 shares authorized for Class A and Class B in aggregate, issued
shares as of December 31, 2019 and September 30, 2020: 71,775,686 and   

71,775,686; outstanding shares as of December 31, 2019 and September
30, 2020: 65,403,527 and 65,715,527

9,244

9,244

Class B ordinary shares, par value HK$1 per share, 600,000,000 shares
authorized for Class A and Class B in aggregate, and 24,336,650 shares
and 24,336,650 shares issued and outstanding as at December 31, 2019
and September 30, 2020, respectively

3,124

3,124

Treasury stock

(117,183)

(123,216)

Additional paid-in capital

540,049

528,620

Accumulated other comprehensive loss

(75,247)

(98,371)

Retained earnings

257,939

270,358

Total Fang Holdings Limited shareholders’ equity

617,926

589,759

Non controlling interests

694

693

Total equity

618,620

590,452

TOTAL LIABILITIES AND EQUITY

1,830,901

1,812,902


Unaudited Condensed Consolidated Statements of Comprehensive Income[i]

(in thousands of U.S. dollars, except share data and per share data)

Three months ended

September 30,

September 30,

2020

2019

Revenues:

Marketing services

30,273

29,993

Listing services

10,061

19,438

Leads generation services

12,948

14,099

Financial services

1,864

1,710

Value-added services

1,382

1,514

E-commerce services

149

796

Total revenues

56,677

67,550

Cost of revenues:

Cost of services

(5,066)

(5,694)

Total cost of revenues

(5,066)

(5,694)

Gross profit

51,611

61,856

Operating expenses and income:

Selling expenses

(15,077)

(14,822)

General and administrative expenses

(20,005)

(21,688)

Other income

1,191

1,385

Operating income

17,720

26,731

Foreign exchange (loss)/income

(5,138)

832

Interest income

3,192

1,562

Interest expense

(5,527)

(5,185)

Investment income

460

2,068

Realized gain on sale of available-for-sale
securities

711

Change in fair value of securities

19,393

(26,148)

Government grants

72

44

Income before income taxes and noncontrolling
interests


30,172


615

Income tax expense

Income tax (expense)/benefit

(19,241)

117

Net income

10,931

732

Net income attributable to noncontrolling
interests

Net income attributable to Fang Holdings Limited
shareholders


10,931


732

Earnings per share for Class A and Class B ordinary shares:

Basic

0.12

0.01

Diluted

0.12

0.01

[i] On June 19, 2020, a ratio change that had the same effect as a 1-for-10 reverse ADS split took effect, and
as a result, one ADS currently represents ten Class A ordinary shares.


Related Links :

http://www.fang.com

CooTek to Participate in November Investor Conferences

SHANGHAI, Nov. 13, 2020 — CooTek (Cayman) Inc. (NYSE: CTK) ("CooTek" or the "Company"), a fast-growing global mobile internet company, today announced that the Company will present and meet with institutional investors at the following virtual investor conferences. For more information on CooTek presentations, please visit investor relations website https://ir.cootek.com.

  • BofA Securities 2020 China Conference
    Panel or one-on-one Discussion on November 2 – November 13, 2020;
  • dbVIC – Deutsche Bank American Depositary Receipt (ADR) Virtual Investor Conference
    Presentation on Wednesday, November 18, 2020 at 09:30 a.m. ET

The Company’s management will participate in virtual meetings with institutional investors throughout these events. For additional information, please contact your respective institutional sales representative at each sponsoring bank.

About CooTek (Cayman) Inc.

CooTek is a fast-growing mobile internet company with a global vision, offering mobile applications. Our mission is to empower everyone to enjoy relevant content seamlessly. The Company’s user-centric and data-driven approach has enabled it to release appealing products to capture mobile internet users’ ever-evolving content needs and helps it rapidly attract targeted users. CooTek has developed and brought to market content-rich mobile applications, focusing on three categories: online literature, scenario-based content apps and casual games.

For more information on CooTek, please visit https://ir.cootek.com.  

For more information, please contact:

CooTek (Cayman) Inc.

Mr. Robert Cui
ir@cootek.com  

Christensen

In China
Mr. Rene Vanguestaine
Phone: +86-10-5900-1548
E-mail: rvanguestaine@ChristensenIR.com   
In U.S.
Ms. Linda Bergkamp
Phone: +1-480-614-3004
Email: lbergkamp@ChristensenIR.com

Joining Forces with the Largest Startup Festival in Taiwan, #AsiaRocks Returns With More Contents for Startups to Softland in the APAC Region

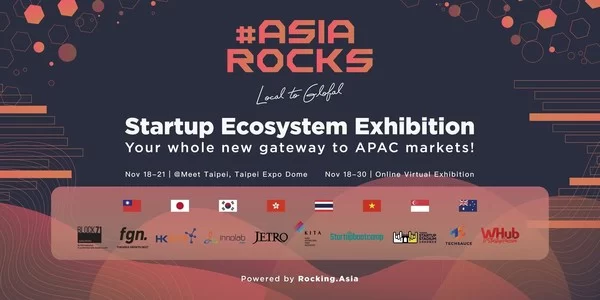
Taipei, Nov. 13, 2020 — Last year, Taiwan Startup Stadium launched its first-ever #AsiaRocks event in Taiwan. #AsiaRocks aims to bring together prominent ecosystem builders across APAC to provide startups a whole new gateway to Asian markets. Through exhibition, keynote speeches, panel discussions, and networking opportunities, #AsiaRocks offers unique "cross-border, market-entry" content for the attendees. It also provides access to key players and resources from Asian markets, opportunities to deep dive into the different startup ecosystems, a closer look into investment trends, government subsidy programs, and soft-landing services of these regions. The event attracted hundreds of attendees from across different industries.

This year, #AsiaRocks returns in a different format with even more content! #AsiaRocks is joining forces with the largest startup festival in Taiwan – Meet Taipei, from November 18th through 21st. Attendees from overseas can join virtually from November 18th through 30th.

#AsiaRocks - Your Whole New Gateway to APAC Markets!
#AsiaRocks – Your Whole New Gateway to APAC Markets!

This year, #AsiaRocks exhibitors include:

  • Hong Kong: Hong Kong Science and Technology Parks Corporation (HKSTP), WHub
  • Japan: Fukuoka Growth Next (FGN), The Japan External Trade Organization (JETRO)
  • Taiwan: Taiwan Startup Stadium (TSS)
  • Korea: Korea International Trade Association (KITA)
  • Thailand: Techsauce
  • Vietnam: InnoLab Asia
  • Australia: Startupbootcamp Australia
  • Singapore: BLOCK71

Representatives from each of these organizations will be available to speak to you at the #AsiaRocks booth throughout the exhibition. Additionally, in the afternoon of November 20th, #AsiaRocks will take over the Global Stage at Meet Taipei with a variety of exciting activities, including an ecosystem pitch by all the country partners on soft-landing into their markets, an interactive game on Asia’s startup ecosystems, and two fireside chats on trending topics for startups.

In one fireside chat, some of the most prominent VCs, such as Hive Ventures, SOSV MOX and Chinaccelerator, and Infinity Venture Partners will share their thoughts on the impact of COVID-19 on startup funding. In the other fireside chat, the Senior HR Director of PAP Region at Acer and the Regional Head at Adecco Group Taiwan and Korea will discuss global talent sourcing and planning.

For more information and to sign-up, please refer to this page.

Look for #AsiaRocks at booth AC-01!

About Taiwan Startup Stadium
Taiwan Startup Stadium is Taiwan’s leading ecosystem builder that cultivates global-minded entrepreneurs and showcases innovative Taiwanese startups to the world!

Hollysys Automation Technologies Reports Unaudited Financial Results for the First Quarter Ended September 30, 2020

First Quarter of Fiscal Year 2021 Financial Highlights

  • Non-GAAP net income attributable to Hollysys was $20.8 million, a decrease of 30.2% compared to the comparable prior year period.
  • Total revenues were $129.5 million, an increase of 5.1% compared to the comparable prior year period.
  • Non-GAAP gross margin was at 33.7%, compared to 37.7% for the comparable prior year period.
  • Non-GAAP diluted EPS was $0.34, a decrease of 30.6% compared to the comparable prior year period.
  • Net cash provided by operating activities was $21.6 million for the current quarter.
  • DSO of 185 days, compared to 204 days for the comparable prior year period.
  • Inventory turnover days of 58 days, compared to 56 days for the comparable prior year period.

BEIJING, Nov. 13, 2020 — Hollysys Automation Technologies Ltd. (NASDAQ: HOLI) ("Hollysys" or the "Company"), a leading provider of automation and control technologies and applications in China, today announced its unaudited financial results for the first quarter of fiscal year 2021 ended September 30, 2020 (see attached tables). The management of Hollysys, stated:

Industrial Automation ("IA") business finished the quarter with revenue and contract at $81.9 million and $107.8 million, representing 26.8% and 28.4% YOY growth, respectively.

  • In power sector, we continued our effort in strengthening our market position in high-end coal fire market (600MW and plus power unit). Meanwhile, with respect to our current client base in this sector, we are actively responding to various regular and value-added service demand covering old system replacement, system upgrade, part component sales and annual maintenance, etc.
  • In chemical and petro-chemical sector, contract growth remains healthy. We continued our effort in key projects winning, key client cooperation, key marketing events and development and demonstration of solution capability to penetrate the market and build our reputation.

    Sector highlights of the past quarter include:

–  Winning the bidding of DCS+ESD (emergency shutdown device) + AMS (asset management system) +F&G (fire and gas) integrated solution for two offshore oil platforms. It is the 8th oil platform solution that the Company has won since the beginning of the calendar year, marking a remarkable progress for our exploration in the oil and gas industry.

–  Signing a CCS (Coordination Control System) contract with a client on its 400,000 tons/year tert-butyl alcohol and 200,000 tons/year MMA (methyl methacrylate) projects, marking a breakthrough as it is the Company’s first contract in MMA.

–  Signing a DCS + SIS + GDS + MES + OTS + AMS + information security integrated solution contract with a client on its 100,000 tons polycarbonate project. The DCS control points for the project amount to approximately 20,000, making it the largest project ever for the Company in similar craft.

  • In food & beverage and pharmaceutical sector, we continue to see healthy growth in contract. With our core control solution capability and inclusion of engineering design capability, we are building our EPC (engineering design + procurement + construction) capability so as to provide more comprehensive solution to our clients. Periodic progress was made in such model as we signed our first workshop-level EPC contract with a client for its 7-ACA (7-aminocephalosporanic acid) refining project, which is expected to lay foundation for our further pursuit of larger scale EPC project in the future.
  • In smart factory business, we continue to actively engage the potential clients through various marketing events, to stay close for in-depth grasp of market demand, and to develop and improve our solution for real value creation in economic benefit and operation safety. Highlights of the past quarter include:

–  Signing a contract with a new client from the thermal-power sector to provide a total solution with control-level and management-level data integration that covers comprehensive function modules including   control optimization, smart diagnosis, equipment management, decision making and operation management, etc. We expect such project to become a key demonstration of solution for the thermal-power sector.

–  Signing a contract with a client from the coal-fire sector for its new 2*660MW power plant. Contract covers a similar total solution at control and management level, and marks a significant breakthrough in our smart factory solution for high-end coal-fire market.

–  Signing a contract with an existing client from the petro-chemical sector to provide management-level solution based on our industrial internet platform.

  • Aftersales business of IA is keeping the healthy pace. We continued to engage our valuable client base and respond with both regular and value-adding initiatives covering old system upgrade and replacement, part component sales, annual maintenance, control optimization, data integration and energy management, etc.
  • Under our big automation initiatives, we continued to improve our capability for wider range of solution covering entire life cycle. By end of September, we have put into operation our in-house instrument production line, with which we will be capable of manufacturing certain types of instruments contained in our total control solution. Such is expected to be a valuable addition to our project delivery, market opportunities and operation.

Rail business finished the quarter with revenue and contract at $28.7 million and $24.2 million, recording 35.6% YOY decrease and 15.0% YOY growth, respectively.

  • In high-speed rail ("HSR") sector, we continued our delivery of on-ground solution along with the rail-road construction progress. Periodic progress was achieved for the smart solution initiatives for the sector, and we have completed our top-level design of the smart maintenance solution. Meanwhile, bidding from the client was seeing its gradual recovery in the post-pandemic period, both for on-ground and on-board equipment. Highlights of the quarter include:

–  Winning the bidding of 140 sets (out of the total package of 274 sets) of ATP for C2 (250km) China Standard High-speed train in August.

  • In subway sector, our cloud-based SCADA project for Shenzhen Subway Line 6 was fully delivered, which was the second cloud-based SCADA project of the Company and represents our constant effort in innovation for continued value creation for our clients. In delivery, our enhancement in supply chain management and engineering standardization has contributed to improved quality and efficiency of project execution.
  • In aftersales business, we continued to strengthen local service network, to expand service solution and to develop technology-and-service-centered service for better differentiation. In HSR sector, we continued to respond to regular services including advanced maintenance, system and software upgrade and part component sales, as well as total replacement. We continued to act as the service provider to Hong KongShenzhen high-speed rail, with our service quality being highly recognized. In subway sector, we continued to explore potentials from the current client base and signed contracts covering system upgrade, maintenance and product sales.
  • Under our big transportation initiatives, the Company has established the smart highway solution and was actively involved in marketing events for new contracts breakthrough in new business. Highlight for the quarter includes:

–  Signing a breakthrough contract of smart traffic meteorology solution for a section of the highway connecting Sichuan and Yunnan province. The data-driven solution targets highway administration as the intended clients and through collection and processing of meteorological, geographical and traffic data, advices the highway administration on more effective decision making in highway management, in particular under extreme weather condition.

Mechanical and Electrical Solutions ("M&E") business finished the quarter with revenue and contract at $18.8 million and $12.3 million, recording 34.4% increase and 63.4% YOY decrease respectively.

COVID-19 remains a challenge to M&E and overseas business. We will keep monitoring the impact on this sector and risk control remains to be the key focus.

Fiscal Quarter Ended September 30, 2020 Unaudited Financial Results Summary

 (In USD thousands, except for number of shares and per share data)

Three months ended

Sep 30, 2020

 Sep 30, 2019

%
Change

Revenues

$

129,468

123,230

5.1%

    Integrated solutions contracts revenue

$

105,706

104,466

1.2%

    Products sales

$

6,569

6,123

7.3%

    Service rendered

$

17,193

12,641

36.0%

Cost of revenues

$

85,891

76,771

11.9%

Gross profit

$

43,577

46,459

(6.2)%

Total operating expenses

$

22,558

23,291

(3.1)%

    Selling

$

8,176

7,277

12.4%

    General and administrative

$

10,179

10,592

(3.9)%

    Research and development

$

9,981

8,942

11.6%

    VAT refunds and government subsidies

$

(5,778)

(3,520)

64.1%

Income from operations

$

21,019

23,168

(9.3)%

Other income, net

$

1,229

2,025

(39.3)%

Foreign exchange (loss) gain

$

(2,323)

604

(484.6)%

Gains on disposal of an investment in an equity investee

$

5,763

(100.0)%

Share of net income of equity investees

$

1,891

1,541

22.7%

Interest income

$

3,798

3,029

25.4%

Interest expenses

$

(137)

(113)

21.2%

Income tax expenses

$

4,760

6,209

(23.3)%

Net (losses) income attributable to non-controlling interests

$

(80)

26

(407.7)%

Non-GAAP net income attributable to Hollysys Automation 
    Technologies Ltd.

$

20,797

29,782

(30.2)%

Non-GAAP basic EPS

$

0.34

0.49

(30.6)%

Non-GAAP diluted EPS

$

0.34

0.49

(30.6)%

$

Share-based compensation expenses

175

26

573.1%

Amortization of acquired intangible assets

$

76

75

1.3%

GAAP Net income attributable to Hollysys Automation Technologies
    Ltd.

$

20,546

29,681

(30.8)%

GAAP basic EPS

$

0.34

0.49

(30.6)%

GAAP diluted EPS

$

0.34

0.49

(30.6)%

Basic weighted average common shares outstanding

60,552,099

60,470,611

0.1%

Diluted weighted average common shares outstanding

60,552,099

60,483,884

0.1%

Operational Results Analysis for the First Quarter Ended September 30, 2020

Comparing to the first quarter of the prior fiscal year, the total revenues for the three months ended September 30, 2020 increased from $123.2 million to $129.5 million, representing an increase of 5.1%. Broken down by the revenue types, integrated contracts revenue increased by 1.2% to $105.7 million, products sales revenue increased by 7.3% to $6.6 million, and services revenue increased by 36.0% to $17.2 million.

The Company’s total revenues can also be presented in segments as shown in the following chart:

(In USD thousands)

Three months ended Sep 30,

2020

2019

$

% to Total
Revenue

$

% to Total
Revenue

Industrial Automation

81,931

63.2%

64,637

52.4%

Rail Transportation Automation

28,696

22.2%

44,576

36.2%

Mechanical and Electrical Solution

18,841

14.6%

14,017

11.4%

Total

129,468

100.0%

123,230

100.0%

Overall gross margin excluding non-cash amortization of acquired intangibles (non-GAAP gross margin) was 33.7% for the three months ended September 30, 2020, as compared to 37.7% for the same period of the prior year. The non-GAAP gross margin for integrated contracts, product sales, and services rendered were 25.3%, 73.7% and 70.0% for the three months ended September 30, 2020, as compared to 32.6%, 79.9% and 59.5% for the same period of the prior year, respectively. The gross margin fluctuation was mainly due to the different revenue mix with different margins. The GAAP overall gross margin which includes non-cash amortization of acquired intangibles was 33.6% for the three months ended September 30, 2020, as compared to 37.6% for the same period of the prior year. The GAAP gross margin for integrated contracts, product sales, and service rendered was 25.2%, 73.7% and 70.0% for the three months ended September 30, 2020, as compared to 32.5%, 79.9% and 59.5% for the same period of the prior year, respectively.

Selling expenses were $8.2 million for the three months ended September 30, 2020, representing an increase of $0.9 million or 12.4% compared to $7.3 million for the same quarter of the prior year. Presented as a percentage of total revenues, selling expenses were 6.3% and 5.9% for the three months ended September 30, 2020, and 2019, respectively.

General and administrative expenses, excluding non-cash share-based compensation expenses (non-GAAP G&A expenses), were $10.2 million for the quarter ended September 30, 2020, representing a decrease of $0.4 million or 3.9% compared to $10.6 million for the same quarter of the prior year. Presented as a percentage of total revenues, non-GAAP G&A expenses were 7.9% and 8.6% for quarters ended September 30, 2020 and 2019, respectively. The GAAP G&A expenses which include the non-cash share-based compensation expenses were $10.4 million and $10.6 million for the three months ended September 30, 2020 and 2019, respectively.

Research and development expenses were $10.0 million for the three months ended September 30, 2020, representing an increase of $1.0 million or 11.6% compared to $8.9 million for the same quarter of the prior year. Presented as a percentage of total revenues, R&D expenses were 7.7% and 7.3% for the quarter ended September 30, 2020 and 2019, respectively.

The VAT refunds and government subsidies were $5.8 million for three months ended September 30, 2020, as compared to $3.5 million for the same period in the prior year, representing a $2.3 million or 64.1% increase, which was primarily due to increase of the VAT refunds.

The income tax expenses and the effective tax rate were $4.8 million and 18.9% for the three months ended September 30, 2020, as compared to $6.2 million and 17.3% for comparable prior year period. The effective tax rate fluctuation was mainly due to the different pre-tax income mix with different tax rates, as the Company’s subsidiaries are subject to different tax rates in various jurisdictions.

The non-GAAP net income attributable to Hollysys, which excludes the non-cash share-based compensation expenses calculated based on the grant-date fair value of shares or options granted, amortization of acquired intangible assets, and fair value adjustments of a bifurcated derivative, was $20.8 million or $0.34 per diluted share based on 60.6 million diluted weighted average ordinary shares outstanding for the three months ended September 30, 2020. This represents a 30.2% decrease over $29.8 million or $0.49 per share based on 60.5 million diluted weighted average ordinary shares outstanding reported in the comparable prior year period. On a GAAP basis, net income attributable to Hollysys was $20.5 million or $0.34 per diluted share representing a decrease of 30.8% over $29.7 million or $0.49 per diluted share reported in the comparable prior year period.

Contracts and Backlog Highlights

Hollysys achieved $144.3 million of new contracts for the three months ended September 30, 2020. The backlog as of September 30, 2020 was $596.1 million. The detailed breakdown of new contracts and backlog by segments is shown below:

(In USD thousands)

New contracts achieved

Backlog

for the three months

 ended Sep 30, 2020

as of Sep 30, 2020

$

% to Total
Contract

$

% to Total
Backlog

Industrial Automation

107,806

74.7%

252,299

42.3%

Rail Transportation

24,167

16.8%

254,833

42.7%

Mechanical and Electrical Solutions

12,304

8.5%

89,005

14.9%

Total

144,277

100.0%

596,137

100.0%

Cash Flow Highlights

For the three months ended September 30, 2020, the total net cash inflow was $34.9 million. The net cash provided by operating activities was $21.6 million. The net cash provided by investing activities was $2.6 million and mainly consisted of $114.6 million of matured time deposits, which were partially offset by $108.8 million of time deposits placed with banks. The net cash used in financing activities was $0.2 million.

Balance Sheet Highlights

The total amount of cash and cash equivalents were $321.6 million, $288.8 million, and $340.0 million as of September 30, 2020, June 30, 2020 and September 30, 2019, respectively.

For the three months ended September 30, 2020, DSO was 185 days, as compared to 204 days for the comparable prior year period and 167 days for the last quarter; and inventory turnover was 58 days, as compared to 56 days for the comparable prior year period and 66 days for the last quarter.

Conference Call

The Company will host a conference call at 8:00 pm November 12, 2020 U.S. Eastern Time / 9:00 am November 13, 2020 Beijing Time, to discuss the financial results for fiscal year 2021 first quarter ended September 30, 2020 and business outlook.

Joining the Conference Call:

  1. Please register in advance of the conference using the link provided below. Upon registering, you will be provided with participant dial-in numbers, Direct Event passcode and unique registrant ID.
  2. In the 10 minutes prior to the call start time, you will need to use the conference access information provided in the email received at the point of registering.

Note: Due to regional restrictions some participants may receive operator assistance when joining this conference call and will not be automatically connected.

Helpful keypad commands:
*0 – Operator assistance
*6 – Self mute/unmute

Direct Event online registration: http://apac.directeventreg.com/registration/event/3446698. Please use Conference ID 3446698 for entry if the link fails to lead directly to the registration page.

SAFE HARBOUR:

This release contains forward-looking statements within the meaning of the Private Securities Litigation Reform Act of 1995. All statements, other than statements of historical fact included herein are "forward-looking statements," including statements regarding: the ability of the Company to achieve its commercial objectives; the business strategy, plans and objectives of the Company and its subsidiaries; and any other statements of non-historical information. These forward-looking statements are often identified by the use of forward-looking terminology such as "believes," "expects" or similar expressions, involve known and unknown risks and uncertainties. Such forward-looking statements, based upon the current beliefs and expectations of Hollysys’ management, are subject to risks and uncertainties, which could cause actual results to differ from the forward looking statements. Although the Company believes that the expectations reflected in these forward-looking statements are reasonable, they do involve assumptions, risks and uncertainties, and these expectations may prove to be incorrect. Investors should not place undue reliance on these forward-looking statements, which speak only as of the date of this press release. The Company’s actual results could differ materially from those anticipated in these forward-looking statements as a result of a variety of factors, including those discussed in the Company’s reports that are filed with the Securities and Exchange Commission and available on its website (http://www.sec.gov). All forward-looking statements attributable to the Company or persons acting on its behalf are expressly qualified in their entirety by these factors. Other than as required under the securities laws, the Company does not assume a duty to update these forward-looking statements.

For further information, please contact:

Hollysys Automation Technologies Ltd.
www.hollysys.com
+8610-58981386
investors@hollysys.com


HOLLYSYS AUTOMATION TECHNOLOGIES LTD.

CONSOLIDATED STATEMENTS OF INCOME AND COMPREHENSIVE INCOME

(In USD thousands except for number of shares and per share data)

Three months ended

Sep 30,

2020

2019

(Unaudited)

(Unaudited)

Net revenues

Integrated solutions contracts revenue

$

105,706

$

104,466

Products sales

6,569

6,123

Revenue from services

17,193

12,641

Total net revenues

129,468

123,230

Costs of integrated solutions contracts

79,081

70,500

Cost of products sold

1,729

1,231

Costs of services rendered

5,157

5,115

Gross profit

43,501

46,384

Operating expenses

Selling

8,176

7,277

General and administrative

10,354

10,618

Research and development

9,981

8,942

VAT refunds and government subsidies

(5,778)

(3,520)

Total operating expenses

22,733

23,317

Income from operations

20,768

23,067

Other income, net

1,229

2,025

Foreign exchange (loss) gain

(2,323)

604

Gains on disposal of investments in an equity investee

5,763

Share of net income of equity investees

1,891

1,541

Interest income

3,798

3,029

Interest expenses

(137)

(113)

Income before income taxes

25,226

35,916

Income taxes expenses

4,760

6,209

Net income

20,466

29,707

Less: Net (losses) income attributable to non-controlling interests

(80)

26

Net income attributable to Hollysys Automation Technologies Ltd.

$

20,546

$

29,681

Other comprehensive income, net of tax of nil

Translation adjustments

38,950

(34,174)

Comprehensive income (loss)

59,416

(4,467)

Less: Comprehensive income (loss) attributable to non-controlling interests

80

(25)

Comprehensive income (loss) attributable to Hollysys Automation
Technologies Ltd.

$

59,336

$

(4,442)

Net income per share:

Basic

0.34

0.49

Diluted

0.34

0.49

Shares used in income per share computation:

Basic

60,552,099

60,470,611

Diluted

60,552,099

60,483,884


HOLLYSYS AUTOMATION TECHNOLOGIES LTD.

CONSOLIDATED BALANCE SHEETS

(In USD thousands except for number of shares and per share data)

Sep 30,

Jun 30,

2020

2020

(Unaudited)

(audited)

ASSETS

Current assets

Cash and cash equivalents

$

321,641

$

288,782

Time deposits with maturities over three months

330,432

324,949

Restricted cash

11,827

8,663

Accounts receivable, net of allowance for doubtful accounts of $54,069 and
    $41,618 as of September 30, 2020 and June 30, 2020, respectively

268,270

242,449

Costs and estimated earnings in excess of billings, net of allowance for doubtful 
     accounts of $8,185 and $6,150 as of September 30, 2020 and June 30, 2020,
     respectively

189,834

186,879

Accounts receivable retention

5,227

6,088

Other receivables, net of allowance for doubtful accounts of $6,382 and $6,224 as
     of September 30, 2020 and June 30, 2020, respectively

28,408

28,257

Advances to suppliers

18,614

17,255

Amounts due from related parties

22,222

21,444

Inventories

56,805

48,210

Prepaid expenses

654

648

Income tax recoverable

87

870

Total current assets

1,254,021

1,174,494

Non-current assets

Restricted cash

20,558

21,652

Costs and estimated earnings in excess of billings

1,771

2,309

Accounts receivable retention

5,559

4,717

Prepaid expenses

8

6

Property, plant and equipment, net

84,261

78,050

Prepaid land leases

16,168

15,742

Intangible assets, net

1,665

1,713

Investments in equity investees

45,814

41,133

Investments securities

4,816

4,640

Goodwill

1,516

1,460

Deferred tax assets

10,738

8,909

Operating lease right-of-use assets

6,496

6,010

Total non-current assets

199,370

186,341

Total assets

1,453,391

1,360,835

LIABILITIES AND STOCKHOLDERS’ EQUITY

Current liabilities

Current portion of long-term loans

334

320

Accounts payable

129,336

117,460

Construction cost payable

1,762

2,350.00

Deferred revenue

161,692

139,242

Accrued payroll and related expenses

21,766

17,245

Income tax payable

7,021

3,142

Warranty liabilities

6,074

6,604

Other tax payables

4,129

3,279

Accrued liabilities

36,738

31,595

Amounts due to related parties

3,394

3,576

Operating lease liabilities

2,211

2,489

Total current liabilities

374,457

327,302

Non-current liabilities

Accrued liabilities

3,000

5,635

Long-term loans

15,885

15,780

Accounts payable

3,221

2,530

Deferred tax liabilities

14,307

13,940

Warranty liabilities

1,847

3,460

Operating lease liabilities

3,901

3,302

Total non-current liabilities

42,161

44,647

Total liabilities

416,618

371,949

Commitments and contingencies

Stockholders’ equity:

Ordinary shares, par value $0.001 per share, 100,000,000 shares authorized;
    60,537,099 shares issued and outstanding as of September 30, 2020 and June
    30, 2020

61

61

Additional paid-in capital

224,218

224,043

Statutory reserves

49,423

49,423

Retained earnings*

783,315

774,473

Accumulated other comprehensive income

(24,728)

(63,517)

Total Hollysys Automation Technologies Ltd. stockholder’s equity

1,032,289

984,483

Non-controlling interests

4,484

4,403

Total equity

1,036,773

988,886

Total liabilities and equity

$

1,453,391

$

1,360,835

* The adoption of ASC 326 started in July 1st had a one-off effect on the beginning of balance sheet accounts.


HOLLYSYS AUTOMATION TECHNOLOGIES LTD

CONSOLIDATED STATEMENTS OF CASH FLOWS

(In USD thousands).

Three months ended 

Sep 30, 2020

(Unaudited)

Cash flows from operating activities:

Net income

$

20,466

Adjustments to reconcile net income to net cash provided by operating activities:

Depreciation of property, plant and equipment

2,548

Amortization of prepaid land leases

101

Amortization of intangible assets

76

Allowance for doubtful accounts

952

Gains on disposal of long-lived assets

(11)

Share of net income of equity investees

(1,891)

Share-based compensation expenses

175

Deferred income tax benefit

(1,363)

Changes in operating assets and liabilities:

Accounts receivable and retention

(25,949)

Costs and estimated earnings in excess of billings

4,397

Inventories 

(6,640)

Advances to suppliers

(702)

Other receivables 

621

Due from related parties

(1,148)

Accounts payable

7,901

Deferred revenue

16,963

Accruals and other payables

154

Due to related parties

(182)

Income tax payable

4,499

Other tax payables

713

Operating lease right-of-use assets

(305)

Operating lease liabilities

222

Net cash provided by operating activities

21,597

Cash flows from investing activities:

Time deposits placed with banks

(108,757)

Purchases of property, plant and equipment

(3,354)

Proceeds from disposal of property, plant and equipment

65

Maturity of time deposits

114,597

Net cash provided by investing activities

2,551

Cash flows from financing activities:

Proceeds from long-term bank loans

37

Repayments of long-term bank loans

(194)

Net cash used in financing activities

(157)

Effect of foreign exchange rate changes

10,938

Net increase in cash, cash equivalents and restricted cash

$

34,929

Cash, cash equivalents and restricted cash, beginning of period

$

319,097

Cash, cash equivalents and restricted cash, end of period

354,026


Non-GAAP Measures

In evaluating our results, the non-GAAP measures of "Non-GAAP cost of integrated contracts", "Non-GAAP general and administrative expenses", "Non-GAAP other income (expenses), net", "Non-GAAP net income attributable to Hollysys Automation Technologies Ltd. stockholders", "Non-GAAP basic earnings per share", and "Non-GAAP diluted earnings per share" serve as additional indicators of our operating performance and not as a replacement for other measures in accordance with U.S. GAAP. We believe these non-GAAP measures are useful to investors, as they exclude the non-cash share-based compensation expenses, which is calculated based on the number of shares or options granted and the fair value as of the grant date, amortization of acquired intangible assets, and fair value adjustments of a bifurcated derivative. They will not result in any cash inflows or outflows. We believe that using non-GAAP measures help our shareholders to have a better understanding of our operating results and growth prospects. In addition, given the business nature of the Company, it has been a common practice for investors to use such non-GAAP measures to evaluate the Company.

The following table provides a reconciliation of the non-GAAP measures with the most directly comparable U.S. GAAP measures for the periods indicated:

(In USD thousands, except for number of shares and per share data)

Three months ended

Sep 30,

2020

2019

(Unaudited)

(Unaudited)

Cost of integrated solutions contracts

$

79,081

$

70,500

Less: Amortization of intangible assets

76

75

Non-GAAP cost of integrated solutions contracts

$

79,005

$

70,425

General and administrative expenses

$

10,354

$

10,618

Less: Share-based compensation expenses

175

26

Non-GAAP general and administrative expenses

$

10,179

$

10,592

Net income attributable to Hollysys Automation Technologies Ltd.

$

20,546

$

29,681

Add:

      Share-based compensation expenses

175

26

      Amortization of intangible assets

76

75

Non-GAAP net income attributable to Hollysys Automation
Technologies Ltd.

$

20,797

$

29,782

      Weighted average number of basic ordinary shares

60,552,099

60,470,611

      Weighted average number of diluted ordinary shares

60,552,099

60,483,884

Non-GAAP basic earnings per share

$

0.34

$

0.49

Non-GAAP diluted earnings per share

$

0.34

$

0.49


Related Links :

http://www.hollysys.com

Blis Prospect Targeting helps drive new and lapsed audiences into store and online at scale


SYDNEY, Nov. 11, 2020 — Continuing its product momentum, Blis, the trusted leader in location-powered advertising and analytics, has today announced the launch of Prospect Targeting, an innovative addition to its product suite. The new product combines Blis’ valuable and accurate location data with customer characteristics and online behaviours. It gives the world’s biggest brands a powerful tool to find, target and reach more customers like their current ones and drive them in store or online this holiday season.

Prospect Targeting works by combining the accurate real-world behaviours that only movement data can provide, with consumer data such as car and home ownership, household income and lifestyles, as well as demographic and socio-economic factors. Additionally, it incorporates online behaviours, including what apps consumers use, what websites they browse, what games they play and what times of day and days of week they use their devices, resulting in deep insights into a brand’s customers.

Using intelligent affinity and index modelling, this new product enables brands to expand their customer base by finding and targeting new and lapsed customers at scale without reliance on personal data. Built with consumer privacy at the forefront, Prospect Targeting future proofs Blis’ offering by using only aggregated and anonymised data throughout.

Speaking on the announcement Aaron McKee, CTO at Blis said, "With the holidays just around the corner, brands are trying to re-engage with their customers and prospect new audiences after a year of dramatic change that has been difficult for retailers, and indeed all verticals. With Prospect Targeting, we’re giving companies an edge by enabling them to reach a whole new customer base with the precision of location-based retargeting and the scale of TV audience targeting. Connecting customer characteristics with online activity and Blis’ accurate real-world behavioural intelligence will help brands find more customers like the ones already buying and drive sales – both in store and online."

In April, Blis responded to the growing crisis quickly by releasing Habits to Home Targeting to address the challenges faced by brands reaching a ‘stay at home’ COVID world. With the addition of this latest product, Blis is now helping brands rebuild and expand their audience to drive more customers in store or online at a time when boosting sales matters most.

About Blis

Blis is the trusted leader in location-powered advertising and analytics, helping brands understand, reach and engage consumers globally to deliver measurable results. Because location data is the most accurate indicator of ‘real’ behaviour and intent at scale vs any other type of data, Blis uses this data to map real-world consumer behaviours based on where people are and where they’ve been, uncovering the truth about what people actually do.

Blis’ Smart Platform provides unmatched transparency, accuracy and scale. Its four tried and tested proprietary technologies – Smart Pin, Smart Scale, Smart Places and Smart Households – allow for more effective planning, activation and measurement for marketers and business decision makers alike.

Established in the UK in 2004, Blis now operates in more than 40 offices across five continents. Working with the world’s largest and most customer-driven companies across all verticals including Unilever, Samsung, McDonald’s, HSBC, Mercedes Benz and Peugeot, as well as every major media agency, Blis reaches over a billion mobile devices a year.

To learn more, visit blis.com.

Logo – https://techent.tv/wp-content/uploads/2020/11/blis-prospect-targeting-helps-drive-new-and-lapsed-audiences-into-store-and-online-at-scale.jpg

Related Links :

http://blismobile.com/what_we_do.html

http://blis.com/

MediaTek Unveils Its Newest 5G Chipset, Dimensity 700, For Mass Market 5G Smartphones

Dimensity 700 caters to growing consumer demand for 5G devices

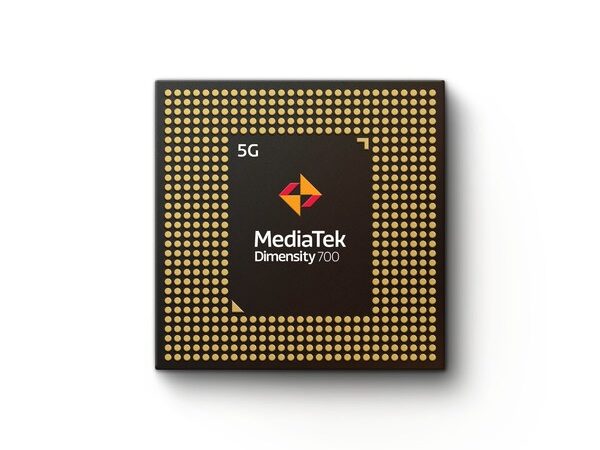
HSINCHU, Taiwan, Nov. 11, 2020 — MediaTek today unveiled its new Dimensity 700 5G smartphone chipset, a 7nm SoC designed to bring advanced 5G capabilities and experiences to the mass market. The addition of the Dimensity 700 to MediaTek’s Dimensity family of 5G chips gives device makers a full suite of options for 5G smartphone models – from flagship and premium to mid-range and mass market devices – making 5G more accessible for consumers everywhere.

Dimensity 700
Dimensity 700

"With our expanded Dimensity portfolio we’re bringing the latest 5G capabilities to every smartphone tier so more people can enjoy 5G experiences," said Dr. JC Hsu, Corporate VP and GM of MediaTek’s Wireless Communications Business Unit. "The Dimensity 700 has an impressive mix of 5G connectivity features, advanced camera capabilities like night shot enhancements and multiple voice assistant support, all in a super power-efficient design."

The Dimensity 700 packs advanced connectivity features including 5G Carrier Aggregation (2CC 5G-CA) and 5G dual SIM dual standby (DSDS), giving users access to the fastest speeds and 5G-exclusive Voice over New Radio (VoNR) services from either connection. On the processing power side, the chip integrates two Arm Cortex-A76 big cores in its octa-core CPU and operates at up to 2.2GHz.

Key features of Dimensity 700 include:

  • MediaTek 5G UltraSave: Delivers advanced power-saving technologies to improve battery life. It includes UltraSave Network Environment Detection, MediaTek 5G UltraSave OTA Content Awareness, Dynamic BWP and Connected Mode DRX. The built-in technology intelligently manages a device’s 5G connection so you can do more and charge your device less often.
  • Premium 90Hz Display: Brands can design smartphones with crisp, high resolution FullHD+ displays and ultra-fast refresh rates to reduce blur in animations, scrolling and games for the best user experience.
  • Up to 64MP Cameras & Night Shot Enhancements: Supports 48MP or 64MP main camera sensors with AI-bokeh, AI-color and AI-beauty features. Plus, the integrated hardware-based imaging accelerators enable multi-frame noise reduction so users can capture high quality shots with low noise, even at night.  
  • Multiple Voice Assistant Support: Supports voice assistants from global brands such as Alibaba, Amazon, Baidu, Google and Tencent to give device makers more configuration options.

Dimensity 700 Infographic

The Dimensity 700 continues MediaTek’s legacy of bringing advanced connectivity, multimedia and imaging features to consumers everywhere. MediaTek’s Dimensity 5G family of chips bring smart and fast together to power 5G devices across all tiers, and with the Dimensity 700 5G devices will now be accessible to even more consumers.

For full specifications and further details on MediaTek’s Dimensity 700 series and 5G portfolio visit: https://i.mediatek.com/mediatek-5g

About MediaTek Inc.

MediaTek Incorporated (TWSE: 2454) is a global fabless semiconductor company that enables 1.5 billion connected devices a year. We are a market leader in developing innovative systems-on-chip (SoC) for mobile device, home entertainment, connectivity and IoT products. Our dedication to innovation has positioned us as a driving market force in several key technology areas, including highly power-efficient mobile technologies, automotive solutions and a broad range of advanced multimedia products such as smartphones, tablets, digital televisions, 5G, Voice Assistant Devices (VAD) and wearables. MediaTek empowers and inspires people to expand their horizons and achieve their goals through smart technology, more easily and efficiently than ever before. We work with the brands you love to make great technology accessible to everyone, and it drives everything we do. Visit www.mediatek.com for more information.

MediaTek Press Office:

PR@mediatek.com
Kevin Keating, MediaTek
+1- 206-321-7295
10188 Telesis Ct #500, San Diego, CA 92121, USA

Related Links :

http://www.mediatek.com

Adyen to expand into the Middle East, opens Dubai office


AMSTERDAM, Nov. 10, 2020 — Adyen (AMS: ADYEN), the global payments platform of choice for many of the world’s leading companies, announced today that it will expand its offering to the Middle East. Supporting the momentum of innovation and diversification of the business landscape in the Middle East, the company has opened an office in Dubai. This will enable Adyen’s existing merchant base to easily move into the region and provide merchants from the region with access to the full strength of the Adyen platform.

"We’re very excited to open our Dubai office, this is an incredibly dynamic market," said Sander Maertens, Head of Middle East for Adyen. "For us, it’s important to be able to offer local expertise to our merchants — that’s why opening a local office is essential."

Offering a broad range of local payment methods, so shoppers can pay using their preferred payment methods, is vital to online success. To enable its merchants in best servicing their shoppers in the Middle East region, Adyen integrated with a host of key local payment methods – amongst which Fawry, Mada, Meeza, KNET, NAPS, BENEFIT, and OmanNet.

"Investing in our global reach to support our merchants is something we’re constantly working on — and this is a very interesting region for them," said Pieter van der Does, co-founder and CEO of Adyen. "There’s a lot happening in the Middle Eastern market, and we’re excited to be a part of it."

About Adyen
Adyen (AMS: ADYEN) is the payments platform of choice for many of the world’s leading companies, providing a modern end-to-end infrastructure connecting directly to Visa, Mastercard, and consumers’ globally preferred payment methods. Adyen delivers frictionless payments across online, mobile, and in-store channels. With offices across the world, Adyen serves customers including Facebook, Uber, Spotify, Casper, Bonobos and L’Oréal. The opening of new offices as described in this press release underlines Adyen’s continuous growth across geographies over the years.

Logo – https://mma.prnasia.com/media2/432569/Adyen_Logo.jpg?p=medium600