


SINGAPORE, Nov. 23, 2020 — Sleek, a fintech startup that is disrupting the traditional corporate services industry, has raised US $4M in a new funding round. Led by SEEDS Capital, the investment arm of Enterprise Singapore, the funding was also joined by MI8 Limited, a Hong-Kong multi-family office, and investor Pierre…

Celebrating 2020 She Loves Tech’s Global Startup Competition, Conference and the 25th Anniversary of World Women Conference
SINGAPORE, Nov. 23, 2020 — The 6th annual She Loves Tech Global Startup Competition and Conference successfully concluded this November 21st & 22nd. As the world’s largest startup competition for women and technology, this year, She Loves Tech held competitions in 30+ countries and 6 continents around the world, and completely…
Brilliance Financial Technology Launches DPX
Next Generation Real Time Digital Pricing and Profitability Management for Banks NEW YORK, Nov. 23, 2020 — Brilliance Financial Technology (bxfin.com), the world’s leading digital pricing and profitability system provider for banks, has announced the release of DPX, an integrated solution that uniquely combines Pricing, Rates & Product, and Profitability Management….
Former Texas Instruments Executive, Bing Xie Joins Huami’s Board as Independent Director
BEIJING and CUPERTINO, Calif., Nov. 23, 2020 — Huami Corp. (NYSE: HMI) today announced that it appointed Mr. Bing Xie, former Texas Instruments (TI) executive officer and senior vice president of worldwide sales and applications, as an independent director on Huami’s board. Mr. Xie will serve on the board’s Audit, Compensation,…
500.com Limited Announces Unaudited Financial Results For the Third Quarter ended September 30, 2020
SHENZHEN, China, Nov. 21, 2020 — 500.com Limited (NYSE: WBAI) ("500.com," "the Company," "we," "us," "our company," or "our"), an online sports lottery service provider in China, today reported its unaudited financial results for the third quarter ended September 30, 2020. Resumption of Operations in Sweden The Multi Group ("TMG"), a…
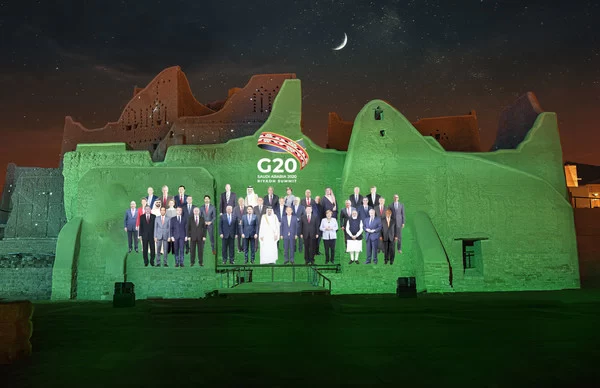
Official G20 2020 Family Photo Released
RIYADH, Saudi Arabia, Nov. 21, 2020 — The Saudi G20 Presidency is pleased to share a family photo of the G20 leaders projected this evening on the walls of the UNESCO World Heritage Site At-Turaif District in Ad-Diriyah outside Riyadh. Official G20 2020 Family Photo Released …
G20 Riyadh Summit: Post-Presidency Press Conference
RIYADH, Saudi Arabia, Nov. 21, 2020 — The G20 Riyadh Summit will be held virtually from November 21 – 22, 2020. The G20 Presidency Press Conference will be conducted after the conclusion of the second and last day of the Leaders’ Summit by Saudi Finance Minister His Excellency Mr. Mohammed…
Senmiao Technology Reports Fiscal 2021 Second Quarter Financial Results
CHENGDU, China, Nov. 20, 2020 — Senmiao Technology Limited ("Senmiao") (Nasdaq: AIHS), a provider of automobile transaction and related services targeting the online ride-hailing industry in China as well as its own online ride-hailing platform, today announced financial results for the fiscal 2021 second quarter ended September 30, 2020. Xi…
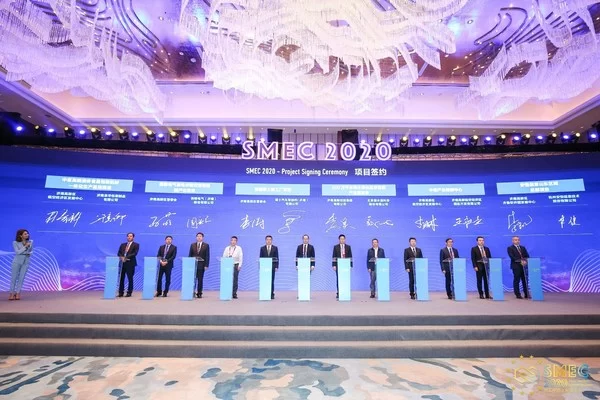
German companies bullish on Chinese market
JINAN, China, Nov. 20, 2020 — Many German companies have expressed confidence in the Chinese market at a conference in east China’s Shandong Province, according to Jinan High-tech Industrial Development Zone Management Committee. Project Signing Ceremony "Feel free to try out our application. Chinese…
China Telecom Honored with “The Best of Asia – Icon on Corporate Governance”
Asia’s Best Awards in CEO, CFO and CSR HONG KONG, Nov. 20, 2020 — China Telecom Corporation Limited ("China Telecom" or "the Company"; HKEx: 00728; NYSE: CHA) was awarded "The Best of Asia – Icon on Corporate Governance" in the "Corporate Governance Asia Recognition Awards 2019", organized by Corporate Governance Asia,…