Tag Archives: FIN

Biomedical industry bears fruit again in National Nanning Economic & Technological Development Area

NANNING, China, Aug. 31, 2022 /PRNewswire/ — Recently, the lung CT image-aided diagnosis software developed by Guangxi Yizhun Intelligent Technology Co., Ltd. (“Yizhun”) in National Nanning Economic & Technological Development Area (“Area”) has been granted the registration certificate of class III medical devices (GXZZ20223210687).

Production workshop of Nanning Neptunus Health Industrial Park

Nanning’s investment promotion departments at all levels aim at creating biomedical industry clusters through high starting point planning and attraction of targeted investments, according to National Nanning Economic & Technological Development Area Management Committee. In the Area, the biomedical industry, involving the fields of production, inspection & testing, sales and distribution, continually expands in industrial scale and gradually improves in industrial chain. The approved “lung CT image-aided diagnosis software” is the first software in Guangxi province and the country’s eighth one with the registration certificate of class III AI medical devices and software, and the sixth in Guangxi province and the second in Nanning city to have received the certificate. This is another achievement of the city’s continuous optimization of services for moved-in enterprises and solid efforts in building up the biopharmaceutical industry.

In terms of precise investments, the Area has compiled a panorama of biopharmaceutical industry chain, positively brought in investments in the industry chain and industry clusters and introduced a batch of key projects such as Hainan Huluwa Pharmaceutical, Guangdong Yili Pharmaceutical, Yida Xiansheng, Sinopharm Group and Guangxi LiuYao Group, forming an industrial development pattern with biopharmaceuticals, traditional Chinese medicine, health care products, medical devices and modern pharmaceutical logistics as main fields. According to information, the Area is the major ground to develop the biopharmaceutical industry in the city, and there are currently 625 biopharmaceutical enterprises in the Area.

Image Attachments Links:

   Link: http://asianetnews.net/view-attachment?attach-id=428269
   Caption: Production workshop of Nanning Neptunus Health Industrial Park

Source: National Nanning Economic & Technological Development Area Management Committee

LightInTheBox to Report Second Quarter 2022 Financial Results on Tuesday, September 6, 2022

SHANGHAI, Aug. 30, 2022 /PRNewswire/ — LightInTheBox Holding Co., Ltd. (NYSE: LITB) (“LightInTheBox” or the “Company”), a cross-border e-commerce company that delivers products directly to consumers around the world, today announced that it will release its unaudited financial results for the second quarter ended June 30, 2022 before the open of U.S. markets on Tuesday, September 6, 2022.

LightInTheBox’s management will hold a conference call to discuss the results at 8:00 a.m. Eastern Time on September 6, 2022 (8:00 p.m. Beijing Time on the same day).

Preregistration Information

Participants can register for the conference call by navigating to https://s1.c-conf.com/diamondpass/10024891-4mlfy6f.html. Once preregistration has been complete, participants will receive dial-in numbers, an event passcode, and a unique access PIN.

To join the conference, simply dial the number in the calendar invite you receive after preregistering, enter the event passcode followed by your unique access PIN, and you will be joined to the conference instantly.

A telephone replay will be available two hours after the conclusion of the conference call through September 14, 2022. The dial-in details are:

US/Canada:

+1-855-883-1031

Hong Kong:

800-930-639

Replay PIN:

10024891

Additionally, a live and archived webcast of the conference call will be available on the Company’s Investor Relations website at http://ir.lightinthebox.com.

About LightInTheBox Holding Co., Ltd.

LightInTheBox is a cross-border e-commerce platform that delivers products directly to consumers around the world. The Company offers customers a convenient way to shop for a wide selection of products at attractive prices through its www.lightinthebox.com, www.miniinthebox.com, www.ezbuy.sg and other websites and mobile applications, which are available in 25 major languages and cover more than 140 countries.

For more information, please visit www.lightinthebox.com.

Investor Relations Contact

Christensen
Ms. Xiaoyan Su
Tel: +86 (10) 5900 1548
Email: ir@lightinthebox.com

OR

Christensen
Ms. Linda Bergkamp
Phone: +1-480-614-3004
Email: lbergkamp@ChristensenIR.com

Cision View original content:https://www.prnewswire.com/news-releases/lightinthebox-to-report-second-quarter-2022-financial-results-on-tuesday-september-6-2022-301614243.html

Source: LightInTheBox Holding Co., Ltd.

Waterdrop Releases User Family Insurance Report

BEIJING, Aug. 26, 2022 /PRNewswire/ — Waterdrop Inc. (“Waterdrop”, the “Company” or “we”) (NYSE: WDH), a leading technology platform dedicated to insurance and healthcare service with a positive social impact, recently released the User Family Security Report. According to the survey of the users of Waterdrop Insurance Marketplace, the report shows that users’ insurance purchase behaviors are highly associated with families.

Users aged below 30 prefer to purchase insurance for parents

The Report shows that insurance purchasers aged below 30 pay more attention to their parent’s insurance, 49% of whom choose to purchase insurance for parent first.

Mr. Hui Teng, the chief actuary of Waterdrop, commented, “Most of the users aged below 30 were born in the 1990s and are only children. Many families have one child and four parents to support. They urgently need to plan pension and insurance services for themselves and their parents as early as possible.”

Users aged 31-40 prefer to purchase insurance for children

According to the Report, among users of all ages, those aged 31-40 saw the highest proportion, or 17%, when it comes to insurance purchases for children. Most of these users are the backbone of their families. Some of them just become parents, and some have had multiple children, paying more attention to children’s insurance.

But this doesn’t mean they ignore the insurance for themselves. The survey also shows, that 47% of the users aged 30-40 choose to purchase insurance for themselves first, 23% for parents, 17% for children, and 13% for spouses.

Users aged above 40 prefer to purchase insurance for “themselves or spouses” first. On a specific term, 61% of them choose to purchase insurance for themselves, 16% for spouses,14% for parents, and 9% for children.

According to the Report, the biggest number of users who purchase their first commercial insurance for themselves or family members are those aged 25-34, who represent over 31% of the total.

In the mind of users, the top 3 essential insurance coverage for families is “Medical insurance, Critical illness insurance, and Casualty insurance”. Medical insurance and critical illness insurance are the most basic insurance policies. Casualty insurance is also among the most popular entry-level insurance types.

The report also shows that more than 81% of users have three or more family insurance policies.

About Waterdrop Inc.

Waterdrop Inc. (NYSE: WDH) is a leading technology platform dedicated to insurance and healthcare service with a positive social impact. Founded in 2016, with the comprehensive coverage of Waterdrop Insurance Marketplace and Waterdrop Medical Crowdfunding, Waterdrop aims to bring insurance and healthcare service to billions through technology. For more information, please visit www.waterdrop-inc.com.

Safe Harbor Statement

This press release contains statements that may constitute “forward-looking” statements pursuant to the “safe harbor” provisions of the U.S. Private Securities Litigation Reform Act of 1995. These forward-looking statements can be identified by terminology such as “will,” “expects,” “anticipates,” “aims,” “future,” “intends,” “plans,” “believes,” “estimates,” “likely to,” and similar statements. Statements that are not historical facts, including statements about Waterdrop’s beliefs, plans, and expectations, are forward-looking statements. Forward-looking statements involve inherent risks and uncertainties. Further information regarding these and other risks is included in Waterdrop’s filings with the SEC. All information provided in this press release is as of the date of this press release, and Waterdrop does not undertake any obligation to update any forward-looking statement, except as required under applicable law.

Cision View original content:https://www.prnewswire.com/news-releases/waterdrop-releases-user-family-insurance-report-301612959.html

Source: Waterdrop Inc.

Equipped with Huawei’s Tech, Bank of Communications Wins The Asian Banker’s Award of Best Big Data Implementation in China

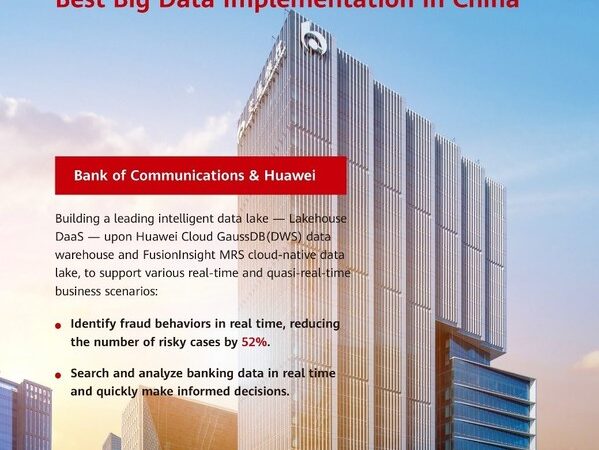
BEIJING, Aug. 26, 2022 /PRNewswire/ — The Asian Banker, an authoritative global platform for insights about the finance industry, has unveiled the winner list for its 2022 Financial Technology Awards at Finance China 2022. Bank of Communications (BOC) won the Best Big Data Implementation award for its Lakehouse DaaS built using Huawei Cloud FusionInsight intelligent data lake.


BOC’s business has grown rapidly over the past few years. The bank has expanded the number of business lines and has rendered its business processes more diversified, convenient, and intelligent. As a result, it’s generating an unprecedented amount of data and using it for complex applications. To cope with all this data, BOC has built an intelligent data lake — Lakehouse DaaS — upon Huawei Cloud FusionInsight MRS cloud-native data lake and Huawei Cloud GaussDB(DWS) data warehouse.

Powered by the GaussDB(DWS) distributed data warehouse, BOC has enhanced its access to data, reducing the cost of using data while improving efficiency and quality. BOC has also built a high-quality and centralized dashboard for comprehensive data analysis, which supports the bank’s operational decision-making and helps maximize the value of data.

The FusionInsight MRS real-time data lake has helped BOC develop new technical capabilities, such as real-time collection and computing, and batch-stream convergence. The bank has also deployed real-time collection, computing, analysis, and consumption data flows, supporting various real-time and quasi-real-time business scenarios.

Since launching the intelligent data lake, BOC has made big leaps in several fields.

  • Marketing: Create user personas based on user transactions and interaction behaviors, improving the customer conversion rate by 164%.
  • Risk control: Analyze user behavior features and identify fraud behaviors in real time, reducing the number of risky cases by 52%.
  • Operations: Search and analyze banking data in real time and quickly make informed decisions.
  • Customer relationship management: Establish a customer churn warning model to track customers who are about to churn and retain them.

BOC has worked with Huawei to reconstruct its big data platform. The bank aims to speed up services related to big data and provide timely input for marketing, risk control, supervision, and operations. It also looks to centralize monitoring, enable process-based management, and visualize its data assets for data governance. Ultimately, BOC wants to make sure that its data is working for its business, helping it become a fully digital bank.

To date, Huawei has served over 2000 financial customers from more than 60 countries and regions, including 49 of the world’s top 100 banks. Huawei Cloud FusionInsight is often used in core data analysis platforms by banks, securities, insurance, and other types of financial customers. The solution helps them build a platform where data and AI converge.

Looking ahead, Huawei will continue offering customers high-value analytical capabilities to maximize the value of their data through FinTech innovation.

Huawei and Bank of China Jointly Win The Asian Banker’s Award of Best Bank Infrastructure Technology Implementation in China

BEIJING, Aug. 26, 2022 /PRNewswire/ — The “Finance China 2022” event organized by the prestigious international finance magazine The Asian Banker successfully commenced in Beijing on the 25th of August. Huawei and the Bank of China jointly won the Best Bank Infrastructure Technology Implementation in China in the category of Financial Technology Awards.

Huawei has shaped many innovative technological solutions by using its innovative ICT technologies and capacities and orchestrated cross-domain collaboration among technologies, helping financial institutions enhance their operational resilience and provide optimal user experience.

  • NoF+ is an Ethernet-enabled lossless storage network solution that applies NVMe, a high-speed read/write protocol dedicated to flash memory and IP networks. Customers can use this technology to build intelligent and lossless networks that sense network faults and facilitate cross-domain coordination. This solution will significantly increase the IOPS throughput performance compared to Fibre Channel (FC) networks.
  • Replacing FC with NoF+ significantly reduces data read and write latency within data centers. In addition, data can be transmitted without loss across data centers and over long distances thanks to the iLossless algorithm.
  • This solution can help networks proactively sense link status and fast switch storage algorithms in order to reduce the impact of network jitter on financial transactions, and reduce link switching time from minutes to seconds in case of failed transmissions.

Dr. Margaret Hu, President of Marketing and Solution Sales, Huawei Global Digital Finance said, “We thank The Asian Banker for honoring us this significant award. Huawei will continue working with financial institutions and partners to conduct joint innovation and open collaboration. We will build innovative digital infrastructure that helps financial services grow and innovate. Our joint efforts will accelerate the financial industry’s digital transformation.”

To date, Huawei has served more than 2,000 financial customers in more than 60 countries and regions around the world, including 49 of the world’s Top 100 banks. Learn more about Huawei’s digital finance solutions:

https://e.huawei.com/en/solutions/industries/smart-finance

MultiBank Group announces Record-Breaking Financial Figures for 2021

With a Daily Turnover of over US$ 12.1 Billion and annual revenue of US$ 189 million

DUBAI, UAE, Aug. 25, 2022 /PRNewswire/ — MultiBank Group, the largest and most regulated financial derivatives broker worldwide, reveals record financial figures for 2021.

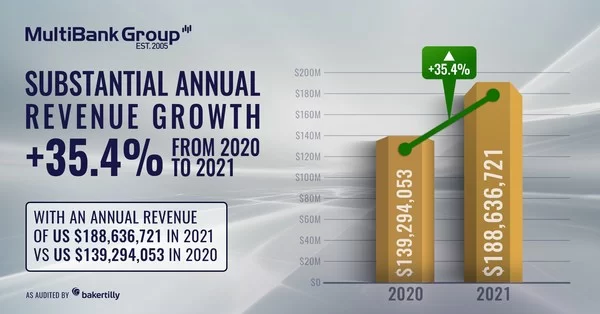
MultiBank Group Annual Revenue Growth

The award-winning financial services group announced a record daily turnover of over US$ 12.1 Billion, with a record annual revenue of approximately USD $ 189 million in FY 2021. This was an impressive 35.4% increase from 2020’s results, marking a record-breaking year for the global giant.

MultiBank Group, established in 2005, has an unblemished regulatory record, with over 11 financial regulators and over 25 branches worldwide.

Moreover, the Group continued its strategic focus on developing and investing in advanced trading technologies. MultiBank Group is now in the advanced stages of launching a digital assets exchange fully regulated in Australia, which aims to be the world’s first cross-asset ecosystem aiming to bridge the gap between traditional and alternative finance.

MultiBank Founder and Chairman Naser Taher, who in 2022 was awarded as one of the most 50 Influential Financial Figures in Global Financial Markets, further stated:

“2021 was a monumental year for MultiBank Group, and I am proud of these record-breaking financial figures. Moreover, I am proud to announce that the number of users on our platforms has surpassed over 1 million by the end of the second quarter of 2022. These results are a testament to our commitment to providing our valued customers with advanced, reliable platforms and first-class customer service provided by our over 600 staff globally. These achievements give us continued motivation to increase our investment in our technology and regulatory infrastructure for the benefit of traders worldwide in general and our valued clients in particular. We have high hopes for the second half of 2022 and plan to launch further projects which will fortify our position as a global leader in the market”.

About MultiBank Group:

MultiBank Group was established in California, USA, in 2005. It boasts a daily trading volume of over US $12.1 billion and services an extensive client base of over 1,000,000 customers across 100 countries. The Group has evolved into one of the largest online financial derivatives providers worldwide, offering its valued customers award-winning trading platforms, with up to a 500:1 leverage on products including Shares, Commodities, Indices, Digital Assets, Metals, and Foreign Exchange.

For more information about MultiBank Group, visit https://multibankfx.com/

MultiBank Group Map
MultiBank Group Map

Building a Magnetic Field Attracting Global Resources, Jing’an Leads the Race for Accelerated Open Economy

SHANGHAI, Aug. 24, 2022 /PRNewswire/ — Recently, Jing’an District has initiated the “Aiding Foreign Investment, Forging Partnership” plan and signed cooperation contracts with Shanghai-based chambers of commerce from the US, the UK, Germany, Italy, Spain, Japan, Australia, etc. The plan is expected to bring more production factors to Jing’an, including people, capital, information, according to Commerce Commission of Jing’an District. Jing’an converses with the world and polishes its brand of investment as those factors gather and interlink in Jing’an.

Since the beginning of this year, Jing’an has strengthened the high-quality development of economy and made an effort to bring in foreign enterprises with a focus on agglomeration and influence. Lately, four cutting-edge designer brands — Maison Margiela, MARNI, JIL SANDER and AMIRI, belonging to the Italian luxury conglomerate OTB, have set up office in Jincang Wenhua Plaza. The acceleration of foreign investment shows the resilience, vitality and potential of the open economy of Jing’an.

Jing’an continues to improve its business environment and pushes forward the comprehensive renewal of the city. Lately, a group of newly-built commercial buildings have made their first public appearance together. They are located in the Suhewan Business Belt and Middle-ring Winger District, providing nearly 1,000,000 square meters of office space. The project is considered a fine complement to West Nanjing Road, which is also known as “the No.1 commercial street in China“. The project will further broaden the horizon of the “Jing’an new-buildings economy development” plan. Foreign enterprises will benefit from the plan in terms of function and energy level. The plan will also fill with power the fast-concentrated development of the “six industries of Jing’an”, which are commercial services, financial services, professional services, data intelligence, cultural innovation, life and health, so that enterprises will achieve significant development.

Cision View original content:https://www.prnewswire.com/news-releases/building-a-magnetic-field-attracting-global-resources-jingan-leads-the-race-for-accelerated-open-economy-301611494.html

ENTREPRENEUR UNIVERSE BRIGHT GROUP Announces 2022 Q2 Financial Results

XI’AN, China, Aug. 16, 2022 /PRNewswire/ — ENTREPRENEUR UNIVERSE BRIGHT GROUP (“EUBG” or the “Company”) (OTCBB: EUBG), a digital marketing consulting company, announced its unaudited financial results for the second quarter ended June 30, 2022.

Mr. Guolin Tao, CEO of Entrepreneur Universe Bright Group commented, “Due to the government measures taken to contain COVID-19, the offline activities of the Company’s PRC subsidiary were restricted from late January to May 2020, resulting in cancellations or postponements of the marketing efforts of our customers. Specifically, as a result of government mandated closures of non-essential business in China, many of the Company’s customers’ business were suspended while others permanently closed their businesses. From December 22, 2021 to January 24, 2022, Xi’an city, the PRC, went into lockdown following a coronavirus outbreak that officials attributed to the delta variant. From April 16, 2022 to April 19, 2022, the city was under temporary controls of social activities after reporting more than 40 infections in half month. This affected both the Company’s digital marketing consulting services and our KOL Training Related Services.”

Second Quarter 2022 Unaudited Financial Results

Three months ended
June 30,

2022

2021

Revenue

$

840,868

$

873,084

Cost of revenue

(113,332)

(199,451)

Gross profit

727,536

673,633

Selling expenses

(8,319)

(85,760)

General and administrative expenses

(331,385)

(351,935)

Total other income, net

58,099

32,392

Income before income tax

445,931

268,330

Income tax expense

(180,081)

(146,289)

Net income

$

265,850

$

122,041

  • Revenue decreased by 3.7% to $840,868
  • Gross profit increased by 8.0% to $727,536
  • Net income increased by 117.8% to $265,850

Revenue and cost of revenue: During the three months ended June 30, 2022, we generated revenue of $840,868 compared to $873,084 for the three months ended June 30, 2021, representing a decrease of $32,216 or 3.7% as compared with the prior period. For the three months ended June 30, 2022, our revenue from consultancy services and sourcing and marketing services were $680,606 and $160,262, respectively; while revenue for the three months ended June 30, 2021 was wholly generated from our consultancy services. Cost of revenue was $113,332 for the three months ended June 30, 2022 compared to $199,451 for the three months ended June 30, 2021. The decrease of cost of revenue for the three months ended June 30, 2022 was mainly due to our senior management no longer directly involved in performing the services but focused on management work. Therefore, less direct senior management costs were incurred in the consultancy services and souring and marketing service.

Selling expenses: During the three months ended June 30, 2022, we incurred $8,319 selling expenses compared to $85,760 for the three months ended June 30, 2021, representing a decrease of $77,441 or 90.3% as compared with the prior period. The decrease of selling expenses was mainly due to the tightening of entertainment policies during the period and the staff costs incurred in selling activities were dropped by $42,974 or 90.5% for the three months ended June 30, 2022.

General and administrative expenses: During the three months ended June 30, 2022, we incurred $331,385 general and administrative expenses compared to $351,935 for the three months ended June 30, 2021, representing a decrease of $20,550 or 5.8% as compared with the prior period. The slight decrease for the three months ended June 30, 2022 was mainly due to less audit fees and professional fees charged by the professional parties. Our general and administrative expenses consisted mainly of audit fees, professional fees, payroll expenses and consultancy fees.

Total other income, net: During the three months ended June 30, 2022, we generated net other income of $58,099 compared to $32,392 for the three months ended June 30, 2021, representing an increase of $25,707 or 79.4% as compared with the prior period. Our other income mainly consisted of bank interest income, exchange rate differences and certain sundry incomes.

Income tax expense: During the three months ended June 30, 2022, we incurred income tax expense of $180,081 compared to $146,289 for the three months ended June 30, 2021, representing an increase of $33,792 or 23.1% as compared with the prior period. The income tax expenses were charged in China.

For the three months ended June 30, 2022, our income tax expenses comprised of current tax and deferred tax expenses of $131,409 and $48,672, respectively, compared to $122,745 and $23,544 for the three months ended June 30, 2021.

Net income: As a result of the above, we generated a net income of $265,850 and $122,041 for the three months ended June 30, 2022 and 2021, respectively, representing an increase of $ 143,809 or 117.8% as compared with the prior period.

Cash and cash equivalents. As of June 30, 2022 and December 31, 2021, $7.64 million and $7.65 million of the Company’s cash and cash equivalents, respectively were held at financial institutions located in the PRC and Hong Kong that management believes to be of high credit quality. 

Six Months Ended June 30, 2022 Unaudited Financial Results

Six months ended
June 30,

2022

2021

Revenue

$

2,049,872

$

2,856,944

Cost of revenue

(425,811)

(418,772)

Gross profit

1,624,061

2,438,172

Selling expenses

(24,914)

(170,014)

General and administrative expenses

(642,673)

(579,301)

Total other income, net

159,921

70,094

Income before income tax

1,116,395

1,758,951

Income tax expense

(459,372)

(670,274)

Net income

$

657,023

$

1,088,677

  • Revenue decreased by 28.2% to $2,049,872
  • Gross profit decreased by 33.4% to $1,624,061
  • Net income decreased by 39.7% to $657,023

Revenue and cost of revenue: During the six months ended June 30, 2022, we generated revenue of $2,049,872 compared to $2,856,944 for the six months ended June 30, 2021, representing a decrease of $807,072 or 28.2% as compared with the prior period. The decrease was mainly due to our consultancy services income, generated from clients who engaged in online courses business, dropped by $1,950,347 as compared with last period. This was because the end customers became more patient and cautious in choosing online courses. We continued to seek for different business opportunities to stabilize our income streams. During the six months ended June 30, 2022, we generated $272,962 from our new digital training related services and $576,582 from our consultancy services to a customer who engaged in live streaming business. However, these new income streams only compensated a part of the revenue reduction in current period. As of the date of this filing, the digital training related services with Jade Bird remain suspended. Therefore, we expected the new revenue will not be available to compensate the revenue reduction until further notice. Cost of revenue was $425,811 for the six months ended June 30, 2022 compared to $418,772 for the six months ended June 30, 2021. For the six months ended June 30, 2022, the cost of revenue mainly represented the staff costs for our consulting services and the agency fees for our digital training related services.

Selling expenses: During the six months ended June 30, 2022, we incurred $24,914 selling expenses compared to $170,014 for the six months ended June 30, 2021, representing a decrease of $145,100 or 85.3% as compared with the prior period. The decrease of selling expenses was mainly due to the tightening of entertainment policies during the period and the staff costs incurred in selling activities were dropped by $70,200 or 80.0% for the six months ended June 30, 2022.

General and administrative expenses: During the six months ended June 30, 2022, we incurred $642,673 general and administrative expenses compared to $579,301 for the six months ended June 30, 2021, representing an increase of $63,372 or 10.9% as compared with the prior period. The increase for the six months ended June 30, 2022 was mainly due certain senior management no longer directly involved in performing the services but focused on management work. Therefore, more senior management costs were incurred during the period. Our general and administrative expenses consisted mainly of audit fees, professional fees, payroll expenses and consultancy fees.

Total other income, net: During the six months ended June 30, 2022, we generated net other income of $159,921 compared to $70,094 for the six months ended June 30, 2021, representing an increase of $89,827 or 128.2% as compared with the prior period. Our other income mainly consisted of bank interest income, exchange rate differences and certain sundry incomes.

Income tax expense: During the six months ended June 30, 2022, we incurred income tax expense of $459,372 compared to $670,274 for the six months ended June 30, 2021, representing a decrease of $210,902 or 31.5% as compared with the prior period. The income tax expenses were charged in China.

For the six months ended June 30, 2022, our income tax expenses comprised of current tax and deferred tax expenses of $335,479 and $123,893, respectively, compared to $521,510 and $148,764 for the six months ended June 30, 2021. The decrease of the current tax and deferred tax was mainly aligned with the reduction of revenue and gross profit during the period.

Net income: As a result of the above, we generated a net income of $657,023 and $1,088,677 for the six months ended June 30, 2022 and 2021, respectively.

About ENTREPRENEUR UNIVERSE BRIGHT GROUP

ENTREPRENEUR UNIVERSE BRIGHT GROUP is a digital marketing consultation company with its main operation in China, providing marketing consulting services to Chinese start-up companies. The company provides consulting services, sourcing and marketing services in China through its PRC subsidiary with support from its HK subsidiary. Its PRC subsidiary provides services aimed at connecting businesses with e-commerce platforms.  The integrated service platform focuses on strategic marketing and consulting. The company’s mission is to help start-up companies and small-size companies and guide these companies’ founders in utilizing the company’s digital marketing consulting plan to reach their business goals. For more information about the Company, please visit: http://www.eubggroup.com/

Safe Harbor Statement

This press release contains forward-looking statements as defined by the Private Securities Litigation Reform Act of 1995. Forward-looking statements include statements concerning plans, objectives, goals, strategies, future events or performance, and underlying assumptions and other statements that are other than statements of historical facts. When the Company uses words such as “may, “will, “intend,” “should,” “believe,” “expect,” “anticipate,” “project,” “estimate” or similar expressions that do not relate solely to historical matters, it is making forward-looking statements.  Specifically, the Company’s statements regarding trading on the OTCBB market and closing the initial public offering are forward-looking statements.  Forward-looking statements are not guarantees of future performance and involve risks and uncertainties that may cause the actual results to differ materially from the Company’s expectations discussed in the forward-looking statements. These statements are subject to uncertainties and risks including, but not limited to, the following:  the Company’s goals and strategies; the Company’s future business development; financial condition and results of operations; product and service demand and acceptance; reputation and brand; the impact of competition and pricing; changes in technology; government regulations; fluctuations in general economic and business conditions in China and assumptions underlying or related to any of the foregoing and other risks contained in reports filed by the Company with the SEC.  For these reasons, among others, investors are cautioned not to place undue reliance upon any forward-looking statements in this press release. Additional factors are discussed in the Company’s filings with the SEC, which are available for review at www.sec.gov. The Company undertakes no obligation to publicly revise these forward–looking statements to reflect events or circumstances that arise after the date hereof.

For more information, please contact:

The Company:
Jianyong Li
Email: lijianyong@eubggroup.com
Phone: +86-(029) 86100263

Investor Relations:
Janice Wang 
EverGreen Consulting Inc.
Email: IR@changqingconsulting.com
Phone: +1-908-510-2351 (from U.S.)                                                                                                 
+86 13811768559 (from China)

ENTREPRENEUR UNIVERSE BRIGHT GROUP

CONDENSED CONSOLIDATED BALANCE SHEETS

AS OF JUNE 30, 2022 AND DECEMBER 31, 2021

(In U.S. dollars except for number of shares)

June 30,
2022

December 31,
2021

(unaudited)

ASSETS

CURRENT ASSETS

Cash and cash equivalents

$

7,637,260

$

7,649,129

Accounts receivable

270,939

67,940

Other receivables and prepayments

35,369

55,925

Total current assets

7,943,568

7,772,994

NON-CURRENT ASSETS

Plant and equipment, net

234,194

281,448

Operating lease right-of-use assets, net

112,683

146,698

Total non-current assets

346,877

428,146

TOTAL ASSETS

$

8,290,445

$

8,201,140

LIABILITIES AND STOCKHOLDERS’ EQUITY

CURRENT LIABILITIES

Accounts payable

$

$

115,833

Other payables and accrued liabilities

222,279

402,158

Contract liabilities

216,142

Receipt in advance

5,161

Operating lease liabilities, current

54,964

59,370

Tax payables

158,269

39,545

Amount due to a director

170,713

171,443

Total current liabilities

606,225

1,009,652

NON-CURRENT LIABILITY

Deferred tax liabilities

444,780

342,546

Operating lease liabilities, non-current

57,719

87,328

Total non-current liabilities

502,499

429,874

TOTAL LIABILITIES

1,108,724

1,439,526

COMMITMENTS AND CONTINGENCIES

STOCKHOLDERS’ EQUITY

Preferred stock, par value $0.0001 per share, 1,100,000 shares authorized, Nil (December 31, 2021:
     Nil) shares issued and outstanding as of June 30, 2022

Common stock, par value $0.0001 per share; 1,800,000,000 shares authorized, 1,701,181,423
     (December 31, 2021: 1,701,181,423) shares issued and outstanding as of June 30, 2022

170,118

170,118

Additional paid-in capital

6,453,048

6,453,048

Statutory reserves

65,911

65,911

Retained earnings (accumulated deficit)

299,620

(357,403)

Accumulated other comprehensive income

193,024

429,940

Total stockholders’ equity

7,181,721

6,761,614

TOTAL LIABILITIES AND STOCKHOLDERS’ EQUITY

$

8,290,445

$

8,201,140

ENTREPRENEUR UNIVERSE BRIGHT GROUP

CONDENSED CONSOLIDATED STATEMENTS OF OPERATIONS AND COMPREHENSIVE INCOME

FOR THE THREE AND SIX MONTHS ENDED JUNE 30, 2022 AND 2021 (UNAUDITED)

(In U.S. dollars except for number of shares)

For the three months ended
June 30,

For the six months ended
June 30,

2022

2021

2022

2021

Revenue

840,868

873,084

$

2,049,872

$

2,856,944

Cost of revenue

(113,332)

(199,451)

(425,811)

(418,772)

Gross profit

727,536

673,633

1,624,061

2,438,172

Selling expenses

(8,319)

(85,760)

(24,914)

(170,014)

General and administrative expenses

(331,385)

(351,935)

(642,673)

(579,301)

Profit from operations

387,832

235,938

956,474

1,688,857

Other income (expenses):

Interest income

12,637

34,039

22,967

50,279

Exchange gain (loss)

27,862

(7,432)

27,922

(12,045)

Sundry income

17,600

5,785

109,032

31,860

Total other income, net

58,099

32,392

159,921

70,094

Income before income tax

445,931

268,330

1,116,395

1,758,951

Income tax expense

(180,081)

(146,289)

(459,372)

(670,274)

Net income

$

265,850

122,041

$

657,023

$

1,088,677

Other comprehensive income (loss)

Foreign currency translation adjustment

(231,781)

41,517

(236,916)

65,982

Total comprehensive income

$

34,069

163,558

$

420,107

$

1,154,659

Net income per share – Basic and diluted

$

0.00

*

0.00

*

$

0.00

*

$

0.00

*

Weighted average number of common shares outstanding

– Basic and Diluted

1,701,181,423

1,701,181,423

1,701,181,423

1,701,181,423

*

Less than $0.01 per share

ENTREPRENEUR UNIVERSE BRIGHT GROUP

CONDENSED CONSOLIDATED STATEMENT OF CASH FLOWS

FOR THE SIX MONTHS ENDED JUNE 30, 2022 AND 2021(UNAUDITED)

(In U.S. dollars)

Six months ended
June 30,

2022

2021

Cash flows from operating activities

Net income

$

657,023

$

1,088,677

Adjustments to reconcile net income to cash used in operating activities:

Depreciation

42,322

41,479

Amortization of operating lease right-of-use assets

27,395

25,886

Deferred tax

123,894

(367,854)

Changes in operating assets and liabilities:

Other receivables and prepayments

19,049

(82,283)

Accounts receivable

(213,535)

118,772

Accounts payable

(113,645)

Other payables and accrued liabilities

(170,904)

(303,307)

Tax payables

125,057

(460,122)

Contract liabilities

(212,060)

Receipt in advance

(5,064)

(8,289)

Operating lease liabilities

(27,395)

(45,555)

Net cash generated from operating activities

252,137

7,404

Cash flows from investing activities

Purchase of property, plant and equipment

(8,381)

Acquisition of debt products

(2,781,346)

Redemption of debt products

5,717,211

Loan receivables to a unrelated third party

(499,908)

Loan to a related company

(123,615)

Repayment from a related company

312,386

Net cash (used in) generated from investing activities

(8,381)

2,624,728

Cash flows from financing activities

Repayment of borrowings

(128,842)

Advance from a director

69,532

Net cash used in financing activities

(59,310)

Effect of exchange rates on cash

(255,625)

38,660

Net (decrease) increase in cash and cash equivalents

(11,869)

2,611,482

Cash and cash equivalents at beginning of period

7,649,129

3,846,470

Cash and cash equivalents at end of period

$

7,637,260

$

6,457,952

Supplemental cash flow information

Cash paid during the period for:

Income taxes

$

224,055

$

981,886

Withholding tax paid

$

$

517,120

Cision View original content:https://www.prnewswire.com/news-releases/entrepreneur-universe-bright-group-announces-2022-q2-financial-results-301605866.html

Visionary Education Technology Holdings Group Inc. Reports Fiscal Year 2022 Financial Results

MARKHAM, Canada, Aug. 13, 2022 /PRNewswire/ — Visionary Education Technology Holdings Group Inc. (the “Company”) (Nasdaq: VEDU), a private education provider located in Canada that offers high-quality education resources to students around the globe, today announced its financial results for the fiscal year ended March 31, 2022.

Fiscal Year 2022 Financial Highlights

  • Revenues was $5.2 million in fiscal year 2022, compared to $7.7 million in fiscal year 2021.
  • Gross profit margin was 49.8% in fiscal year 2022, compared to 55.2% in fiscal year 2021.
  • Income from operations was $1.0 million in fiscal year 2022, compared to $3.7 million in fiscal year 2021.
  • Net loss was $56,474 in fiscal year 2022, compared to net income of $2,913,646 in fiscal year 2021.

Mr. David Xu, Chief Executive Officer and Chief Operating Officer of the Company, commented, “In fiscal year 2022, we have invested and consolidated our education resources and built a solid foundation for our future development. On May 17, 2022, we completed our initial public offering, which was an important milestone in the history of the Company. Becoming a publicly traded company provides us with more opportunities to continue developing our education resources. We plan to invest in more profitable and higher growth business areas such as high school education for international students, integrated platform of technology and education, online standardized artificial intelligence driven central platforms and offline personalized education services which are expected to drive exponential tuition revenue growth in the near future. In addition, we intend to close the purchase of the properties at 95-105 Moatfield Drive, Toronto this month. This education facility is expected to generate about $10 million annual rent revenue. Looking forward, we will continue to provide high-quality education to students, execute our strategic initiatives and expand our market share. We believe our organic growth and strategic development will position us well for the future and we are confident in creating long-term values and returns for our shareholders.”

Fiscal Year 2022 Financial Results

Revenues

Revenues decreased by $2.5 million, or 32.1%, to approximately $5.2 million in fiscal year 2022 from approximately $7.7 million in fiscal year 2021. The decrease in revenue was principally  because the Company’s sales of vacant land decreased $4.3 million, partially offset by  increased rent revenue of $1.6 million in fiscal year 2022.

For the Year Ended March 31,

2022

2021

($)

Revenue

Cost of Revenue

Gross Margin

Revenue

Cost of Revenue

Gross Margin

Rent

2,298,198

1,322,188

42.5 %

674,898

256,981

61.9 %

Tuition

669,442

319,913

52.2 %

358,241

124,762

65.2 %

Construction

8,117

4,663

42.6 %

78,219

19,529

75.0 %

Vacant land

2,272,704

990,261

56.4 %

6,613,863

3,058,175

53.8 %

Total

5,248,461

2,637,025

49.8 %

7,725,221

3,459,447

55.2 %

Revenue from rent increased by $1.6 million, or 240.5%, to $2.3 in fiscal year 2022 from $0.7 million in fiscal year 2021. The increase in rent revenue was mainly due to the revenue generated from two office buildings purchased by the Company on April 15, 2021. These two office buildings are located in Downtown Markham, Ontario, Canada. In addition, rent revenue from the Company’s facility located in 41 Metropolitan Road, Toronto, Ontario also increased due to an increase in the number of tenants as compared to fiscal year 2021.

Revenue from tuition income increased by $0.3 million, or 86.9%, to $0.7 million in fiscal year 2022 from $0.4 million in fiscal year 2021. The increase in revenue was mainly from newly acquired Max the Mutt College of Animation, a private career college that offers diplomas in Classical & Computer Animation & Production, Illustration & Storytelling for Sequential Arts, and Concept Art for Animation & Video Games, and Lowell Academy, a private high school that offers high school education. Revenue from the Company’s online learning platform, Toronto ESchool remained stable.

Revenue from the decoration and construction business decreased by $70,102, or 89.6%, to $8,117 in fiscal year 2022 from $78,219 in fiscal year 2021. The decrease was mainly due to the negative impact caused by the COVID-19 pandemic and less focus on this business segment. The Company had no significant income from its construction business in fiscal year 2022.

The Company sold 8 lots of vacant land in fiscal year 2022 and generated revenue of approximately $2.3 million. The Company sold 19 lots of vacant land in fiscal year 2021 and generated revenue of approximately $6.6 million. As of March 31, 2022, the Company had no vacant land for future sales.

Gross Profit and Gross Margin

Total cost of revenue decreased by $0.8 million to $2.6 million in fiscal year 2022, from $3.4 million in fiscal year 2021.

Gross profit decreased by $1.7 million, or 5.5%, to $2.6 million in fiscal year 2022, from $4.3 million in fiscal year 2021. Overall gross margin was 49.8% in fiscal year 2022, compared to  55.2% in fiscal year 2021.

Gross margins for rent business, education business, construction business and sales of vacant land were 42.5%, 52.2%, 42.6% and 56.4%, respectively, for fiscal year 2022, compared to 61.9%, 65.2%, 75.0% and 53.8%, respectively, for fiscal year 2021.

General and Administrative Expenses

General and administrative expenses increased by $305,054, or 230.7%, to $437,278 in fiscal year 2022 from $132,224 in fiscal year 2021. The increase was mainly  because the Company recorded arrear interest of $172,993 in fiscal year 2022 due to the late filing of tax returns. In addition, there was increased amortization and utility expenses from the Company’s newly purchased two office buildings in downtown Markham.

Professional Fees

Professional fees increased by $139,119, or 65.8%, to $350,636 in fiscal year 2022 from $211,517 in fiscal year 2021. The increase was mainly due to the increased legal fees and accounting fees related to the Company’s public offering process.

Salaries and Compensations

Salaries and compensations increased by $599,299, or 310.1%, to $792,546 in fiscal year 2022 from $193,247 in fiscal year 2021. The significant increase was mainly due to the expansion of the Company’s educational business and the increased compensation that the Company paid during fiscal year 2022 to attract and retain experienced senior management and professional employees.

Interest Expense, Net

Interest expense increased by $0.8 million, to $0.9 million in fiscal year 2022 from $0.1 million in fiscal year 2021. The significant increase was mainly due to a higher bank loan balance in connection with the purchase of two office buildings located in Downtown Markham, Ontario, Canada. The Company’s outstanding bank loan balance was approximately $18.8 million and $6.4 million as of March 31, 2022 and 2021, respectively.

Government Subsidies

In fiscal year 2022, the Company received $490,171 from the Canada Emergency Wage Subsidy program and Canada Emergency Rent Subsidy program. In fiscal year 2021, the Company applied for total loans of $143,136 under the Canada Emergency Business Account (CEBA) program, of which $45,450 is expected to be forgiven. In addition, the Company received $39,207 from the Canada Emergency Wage Subsidy program in fiscal year 2021. The increase of wage subsidy was consistent with the increase of the Company’s salary and compensation expenses.

Impairment Expenses

In fiscal year 2022, the Company recorded impairment loss of $379,165 for the intangible assets and goodwill in connection with the private high schools and Conbridge College, a private college because the Company is in the process of improving the efficiency of the operations, streamlining the business lines to focus on its core education sector, and optimizing the structure of the vocational educational business.

Other income

The Company had other income of $20,709 in fiscal year 2022. In fiscal year 2021, the Company had other income of $245,109, mainly from the one-time sales of personal protective equipment to one Canadian financial institution during the pandemic.

Provision for Income Taxes

Provision for income taxes decreased by $0.7 million, to $0.3 million for fiscal year 2022 from $1.0 million for fiscal year 2021. The decrease was mainly due to the decreased income before income taxes.

Net Income (Loss)

Net loss was $56,474 for fiscal year 2022, as compared to net income of approximately $2.9 million for fiscal year 2021.

Balance Sheet

As of March 31, 2022, the Company had cash of $0.7 million, as compared to $1.2 million as of March 31, 2021.

Cash Flow

Net cash provided by operating cash flow was $6.4 million in fiscal year 2022, compared to $4.4 million for fiscal year 2021.

Net cash used in investing activities was $24.3 million in fiscal year 2022, compared to $3.1 million in fiscal year 2021. The increase in net cash used in investing activities was primarily attributable to the purchase of two office buildings for approximately $16.9 million in downtown Markham, the deposits of approximately $7.2 million paid to acquire the properties located on 95-105 Moatfield Drive, Toronto, as well as the payments made to acquire various private school licenses and Max the Mutt College of Animation.

Net cash provided by financing activities was $17.5 million in fiscal year 2022, compared to net cash used in financing activities of $0.4 million in fiscal year 2021. The increase in net cash provided by financing activities in fiscal year 2022 was primarily attributable to the mortgages the Company obtained from HSBC Bank. In connection with the purchase of the two office buildings, on April 15, 2021, the Company obtained bank loans of $7.2 million (C$9.0 million) and $5.6 million (C$7.0 million) respectively from HSBC Bank.

Recent Development

Initial Public Offering

On May 19, 2022, the Company closed its IPO of 4,250,000 Common Shares at a public offering price of $4.00 per share for gross proceeds of $17.0 million. The total net proceeds to the Company from the IPO, after deducting discounts, expense allowance, and expenses, were approximately $14.3 million. Following the closing of the Offering, the Company has a total of 39,250,000 Common Shares issued and outstanding. In connection with the offering, the Company’s common shares began trading on the NASDAQ under the symbol “VEDU.”

Acquisition of Griggs International Academy China Co. Ltd.

On July 14, 2022, the Company entered into a Capital Increase and Share Expansion Agreement (the “Contribution Agreement”) with Griggs International Academy China Co. Ltd. (“Griggs China“), a Hong Kong private consulting and investment holding company offering United States K-12 diploma programs and services of Griggs International Academy USA at four locations in China.. Pursuant to the Contribution Agreement, the Company has agreed to invest $900,000 in Griggs China in exchange for 9,000 newly issued shares of Griggs China, which will equal 90% of issued and outstanding shares of Griggs China. This transaction closed on July 29, 2022.

On July 19, 2022, the Company signed a purchase agreement with the two principal shareholders of Griggs China  to purchase their 1,000 shares for a total consideration of $50,000. The two shareholders will retain 10% of the dividend rights of the Company’s Griggs Program in exchange for the sale of their ordinary shares, and the Company guaranteed to pay an annual minimum of $20,000 and $10,000, respectively, to the two shareholders as a retainer if no dividend is to be declared. The payment of the retainer commences September 1, 2022 and remains in effect until August 31, 2032. After completing this transaction, the Company will own 100% of Griggs China.

About Visionary Education Technology Holdings Group Inc.

Visionary Education Technology Holdings Group Inc., headquartered in Markham, Canada, is a private education provider located in Canada that offers high-quality education resources to students around the globe. The Company aims to provide access to secondary, college, undergraduate and graduate and vocational education to students in Canada through technological innovation so that more people can learn, grow and succeed to their full potential. As a fully integrated provider of educational programs and services in Canada, the Company has been serving and will continue to serve both Canadian and international students. For more information, visit the Company’s website at https://ir.visiongroupca.com.   

Forward-Looking Statements

All statements other than statements of historical fact in this announcement are forward-looking statements. These forward-looking statements involve known and unknown risks and uncertainties and are based on the Company’s current expectations and projections about future events that the Company believes may affect its financial condition, results of operations, business strategy and financial needs. Investors can identify these forward-looking statements by words or phrases such as “believes,” “expects,” “anticipates,” “estimates,” “intends,” “would,” “continue,” “should,” “may,” or similar expressions. The Company undertakes no obligation to update or revise publicly any forward-looking statements to reflect subsequent occurring events or circumstances, or changes in its expectations, except as may be required by law. Although the Company believes that the expectations expressed in these forward-looking statements are reasonable, it cannot assure you that such expectations will turn out to be correct, and the Company cautions investors that actual results may differ materially from the anticipated results and encourages investors to review other factors that may affect its future results in the Company’s registration statement and in its other filings with the SEC.

For more information, please contact:

Visionary Education Technology Holdings Group Inc.
Investor Relations Department
Email: ir@farvision.ca    

Ascent Investors Relations LLC
Tina Xiao
President
Phone: +1 917-609-0333
Email: tina.xiao@ascent-ir.com 

VISIONARY EDUCATION TECHNOLOGY HOLDINGS GROUP INC.

CONSOLIDATED BALANCE SHEETS

(IN U.S. DOLLARS) 

March 31,

March 31,

2022

2021

ASSETS

CURRENT ASSETS

Cash

$

741,868

$

1,190,616

Short-term investments

56,021

Accounts receivable, net

1,653

183,690

Accounts receivable – related party

286,272

Prepaid and other receivable

179,647

81,522

Inventories

839,390

Due from related parties

432,676

3,104,042

Loan receivable – current

131,036

Related parties loan receivable – current

105,898

Total current assets

1,542,901

5,791,430

Restricted cash – non-current

67,821

Property, plant and equipment, net

23,240,470

4,469,767

Right of use assets

958,477

35,445

Intangible assets, net

1,082,061

428,061

Acquisition deposits

7,364,241

2,496,790

Goodwill

1,030,399

Loan receivable

127,232

Deferred offering cost

940,214

Related parties loan receivable – non-current

318,377

TOTAL ASSETS

$

36,226,584

$

13,667,102

LIABILITIES AND EQUITY

CURRENT LIABILITIES

Accounts payable

$

278,544

$

50,198

Accrued liabilities

1,465,318

120,149

Other tax payable

1,435,045

1,020,329

Due to related parties

7,219,022

1,471,191

Deferred revenue

532,520

201,169

Lease liability – current

211,600

16,150

Bank loans – current

542,264

172,629

Income tax payable

1,598,153

1,116,024

Total current liabilities

13,282,466

4,167,839

Deferred tax liabilities

243,762

33,627

Lease liability, non-current

746,877

19,295

Bank loans, non-current

18,278,316

6,214,428

TOTAL LIABILITIES

32,551,421

10,435,189

Commitments

EQUITY

Common shares, no par value, unlimited shares authorized, 35,000,000 issued and outstanding*

Additional paid-in capital

665,985

665,985

Retained earnings

2,587,747

2,577,998

Accumulated other comprehensive income

185,179

163,295

Total shareholders’ equity attributable to the Company

3,438,911

3,407,278

Noncontrolling interest

236,252

(175,365)

Total shareholders’ equity

3,675,163

3,231,913

TOTAL LIABILITIES AND EQUITY

$

36,226,584

$

13,667,102

*

Retroactively restated for effect of recapitalization

VISIONARY EDUCATION TECHNOLOGY HOLDINGS GROUP INC.

CONSOLIDATED STATEMENTS OF INCOME

AND COMPREHENSIVE INCOME

(IN U.S. DOLLARS)

For the Years Ended March 31,

2022

2021

Revenue – rent

$

2,298,198

$

674,898

Revenue – tuition

669,442

358,241

Revenue – construction

8,117

78,219

Revenue – sales of land

2,272,704

6,613,863

Total Revenues

5,248,461

7,725,221

Cost of revenue – rent

1,322,188

256,981

Cost of revenue – tuition

319,913

124,762

Cost of revenue – construction

4,663

19,529

Cost of revenue – sales of land

990,261

3,058,175

Total cost of revenues

2,637,025

3,459,447

Gross Profit

2,611,436

4,265,774

Operating expenses:

General and administrative expenses

437,278

132,224

Professional fees

350,636

211,517

Salaries

792,546

193,247

Total operating expenses

1,580,460

536,988

Income from operations

1,030,976

3,728,786

Other (expense) income

Interest expense

(906,398)

(141,690)

Impairment loss

(379,165)

Government subsidies

490,171

84,657

Other income

20,709

245,019

Total other (expense) income, net

(774,683)

187,986

Income before income taxes

256,293

3,916,772

Provision for income taxes – current

(312,767)

(1,003,126)

Net (loss) income

(56,474)

2,913,646

Less: net loss (income) attributable to noncontrolling interest

66,223

(46,789)

Net income attributable to Visionary Education Technology Holdings Group

9,749

2,866,857

Other comprehensive income:

Foreign currency translation gain

26,333

164,684

Comprehensive (loss) income

(30,141)

3,078,330

Less: comprehensive loss (income) attributable to noncontrolling interest

61,774

(23,626)

Comprehensive income attributable to Visionary Education Technology Holdings Group

$

31,633

$

3,054,704

Earnings Per share

Basic and diluted

$

(0.00)

$

0.08

Weighted Average Shares Outstanding*

Basic and diluted

35,000,000

35,000,000

  * Retroactively restated for effect of recapitalization

VISIONARY EDUCATION TECHNOLOGY HOLDINGS GROUP INC.

CONSOLIDATED STATEMENTS OF CASH FLOWS

(IN U.S. DOLLARS)

For the Years Ended March 31,

2022

2021

Cash flows from operating activities:

Net (loss) income

$

(56,474)

$

2,913,646

Adjustments to reconcile net income to net cash provided by operating activities:

Depreciation and amortization

494,729

53,763

Gain recognized on government subsidy

22,883

(45,450)

Impairment loss on intangible assets and goodwill

379,165

Changes in operating assets and liabilities:

Accounts receivable

202,741

(174,982)

Accounts receivable from related party

167,550

(272,700)

Inventories

842,346

2,686,597

Prepayments and other current assets

(97,322)

(77,657)

Due from related party

2,114,745

(2,692,545)

Accounts payables

227,370

37,367

Accrued liabilities

854,071

114,453

Other tax payable

406,999

877,215

Deferred revenue

329,113

9,796

Taxes payable

473,607

1,010,214

Net cash provided by operating activities

6,361,523

4,439,717

Cash flows from investing activities:

Acquisition of business

(471,550)

(151,500)

Acquisition deposit

(17,016,884)

(2,378,418)

Purchase additional shares from NCI

(31,808)

Loan advance to related parties

425,770

(377,785)

Refund of land deposit

52,668

Short-term investment

(55,860)

Loan advance to unrelated parties

(2,979)

(121,200)

Acquisition deposits

(7,215,396)

Net cash used in investing activities

(24,284,231)

(3,060,711)

Cash flows from financing activities:

Proceeds from bank loan

85,909

136,350

Proceeds from mortgage

12,768,000

6,060,000

Finance costs on mortgage

(49,928)

(30,300)

Deferred offering costs

(451,049)

Repayment of mortgage

(469,921)

(2,565,470)

Proceeds (Repayment) of shareholder advance

5,652,248

(3,995,358)

Net cash provided by (used in) financing activities

17,535,259

(394,778)

Effect of exchange rate changes on cash

6,522

96,528

Net increase (decrease) in cash

(380,927)

1,080,756

Cash and restricted cash, beginning of the year

1,190,616

109,860

Cash and restricted cash, end of the year

$

809,689

$

1,190,616

SUPPLEMENTAL DISCLOSURES OF CASH FLOW INFORMATION:

Cash paid for income tax

$

$

Cash paid for interest

$

906,398

$

117,708

Cision View original content:https://www.prnewswire.com/news-releases/visionary-education-technology-holdings-group-inc-reports-fiscal-year-2022-financial-results-301605289.html

Source: Visionary Education Technology Holdings Group Inc.

Lunit Announces Financial Results for the First Half of 2022


  • Consolidated revenue in the second quarter of 2022 increased by 190% compared to same prior-year period
  • Total revenue for H1 2022 amounted to KRW 5.48 billion, or 82.5% of the total revenue of last year

SEOUL, South Korea, Aug. 12, 2022 /PRNewswire/ — Lunit (KRX: 328130.KQ), a global provider of AI-powered cancer solutions, today announced strong financial results for the second quarter of the fiscal year 2022.

“Through a strong overseas performance in the first half of this year, Lunit achieved more than 80% of last year’s total sales within the first half of 2022,” said Brandon Suh, CEO of Lunit. “With more partnerships to come and the annual health examination season coming up in the third and fourth quarters, we expect our revenue to increase significantly during the second half of the year.”

Reporting under a consolidated basis, Lunit recorded a cumulative revenue of KRW 5.48 billion for the first half of 2022, reaching 82.5% of total sales for the previous year. H1 revenue for 2022 more than tripled compared to the same prior-year period (KRW 1.42 billion) and the proportion of overseas sales jumped from 66.8% to 84.3% year-over-year.

Lunit’s second quarter 2022 revenue was KRW 2.51 billion, up 190% from the prior-year period (KRW 863 million), among which overseas revenue accounted for 80.6%.

H1 Fiscal 2022 Summary

KRW in
millions

H1 2022

Revenue
proportion

H1 2021

Y/Y

Total revenue

5,478

100 %

1,402

Up 291%

Overseas

4,619

84.3 %

937

Up 393%

Domestic

859

15.7 %

465

Up 84.7%

About Lunit

Lunit is a medical AI software company devoted to developing AI solutions for precision diagnostics and treatment support, mainly focused on conquering cancer.

Lunit has partnered with global medical device giants such as GE Healthcare, Philips, and FujiFilm. The company also focuses on its biomarker business through an exclusive partnership with Guardant Health, a leading global liquid biopsy company.

Lunit has earned international recognition for its unprecedented, state-of-the-art AI technology. More than half of its employees are research and development (R&D) specialists, with more than 12 medical doctors working as full-time staff.

Lunit’s flagship products are Lunit INSIGHT and Lunit SCOPE. The FDA-cleared and CE-marked Lunit INSIGHT series provide AI-powered detection of chest abnormalities and breast cancer with 96-99% accuracy. As of March 2022, Lunit INSIGHT products are being used in approximately 600 medical sites in more than 40 countries. Lunit SCOPE series provide AI detection and analytics for tissue data, quantifying key features and scores that enhance elevated response prediction for immunotherapy. By receiving CE Mark in April 2022, Lunit SCOPE PD-L1 TPS has been officially approved for deployment and use in European pathology practices.

Cision View original content to download multimedia:https://www.prnewswire.com/news-releases/lunit-announces-financial-results-for-the-first-half-of-2022-301604990.html