Tag Archives: FIN

BEST Inc. Announces Unaudited Fourth Quarter and Fiscal Year 2022 Financial Results

The Board Has Authorized a Share Repurchase Program

HANGZHOU, China, March 9, 2023 /PRNewswire/ — BEST Inc. (NYSE: BEST) (“BEST” or the “Company”), a leading integrated smart supply chain solutions and logistics services provider in China and Southeast Asia, today announced its unaudited financial results for the fourth quarter and fiscal year ended December 31, 2022. The Company also announced that its board of directors has authorized a share repurchase program, under which the Company may repurchase up to US$20 million worth of its outstanding American Depositary Shares over the next 12 months.

Johnny Chou, Founder, Chairman and CEO of BEST, commented, “2022 was a challenging year. The COVID-19 pandemic and its related controls seriously impacted general economy, and was particularly hard for the logistic industry. However, under such severe challenges, we prevailed. In the fourth quarter of 2022, both BEST Freight and BEST Supply Chain Management have significantly improved their gross margins and narrowed their losses. At the same time, BEST Global began to show promising operating trends.

After lifting of COVID pandemic-related controls, we have seen a rapid recovery in general economy and our multiple business lines.  We are confident to deliver a strong growth and financial results in 2023.  In addition, our Board has authorized an up-to-$20M share repurchase program.” 

“During 2022, Best Freight focused heavily on digital transformation, cost reductions and quality improvement.  As a result, our operating efficiency and service quality have significantly improved.  In the fourth quarter, Freight’s gross margin grew by 10.4 percentage points and its net loss was narrowed by 69.3% year over year.”

“For BEST Supply Chain Management, its strong technical know-how and superb service capabilities helped us weather the storm.  Despite COVID-related restrictions throughout the year, BEST Supply Chain Management went above and beyond to make sure we provided our customers with top quality service. As a result, we were rewarded with additional business. Supply Chain Management has added 64 new key account customers in the second half of 2022 and its distribution volume and revenue increased in the fourth quarter by 82.1% and 2.7%, respectively, and gross margin increased to 4.4%, from negative 1.9%, year over year.”

“For BEST Global, with the lifting of COVID-related controls, we quickly adjusted our strategy, and realigned our organization in response to the evolving Southeast Asia market. We greatly elevated our organization’s capabilities, widening our network coverage and significantly improved our service quality.  We also expanded our coverage of small- and medium-sized enterprise customers and the revenue contribution from those customers grew by 13 percentage points to 40.2% in the fourth quarter of 2022, compared with the first quarter of 2022. In addition, we are accelerating our B2B2C and cross border business to provide additional product offerings. We believe this strategic direction will usher in Global’s fast recovery and prompt growth for a much improved gross margin and better cash flow in 2023.”

“We finished 2022 with a much more resilient, streamlined business infrastructure and improved operating efficiency. Our strengths in technology, domestic and global supply chain management as well as logistics services place us in a strong position to deliver a strong profitable growth in 2023 and beyond.” concluded Mr. Chou.

Gloria Fan, BEST’s Chief Financial Officer, added, “While our revenue for the fourth quarter was dampened by the COVID-19 pandemic, the cost control measures we enacted significantly narrowed our Group non-GAAP net loss by 52.4% year over year. We are actively managing our cash and our balance sheet remains healthy. At the end of 2022, we had cash, cash equivalents, restricted cash and short-term investments of RMB3.2 billion, after we used RMB1.4 billion during 2022 to repurchase our Convertible Senior Notes due 2024. Our overarching goal is to achieve ongoing sustainable and profitable growth. In 2023, we expect Freight and Supply Chain Management to become profitable in the second quarter and generate positive cash flow and profitable growth throughout the year, and BEST Global to see profitability in certain countries.”

FINANCIAL HIGHLIGHTS ([1]) 

For the Fourth Quarter Ended December 31, 2022:([2])

  • Revenue was RMB1,981.4 million (US$287.3 million), compared with RMB2,724.9 million in the fourth quarter of 2021. The decrease was primarily due to the wind-down of the BEST UCargo business line and lower Freight and Global volume. Revenue generated from UCargo was approximately RMB952,000 (US$0.1 million), compared with RMB350 million in the same quarter of 2021.
  • Gross Loss was RMB58.5 million (US$8.5 million), compared with RMB228.4 million in the fourth quarter of 2021. The decrease in gross loss was primarily due to improved gross margin from BEST Freight and BEST Supply Chain business lines. Gross Loss Margin was 3.0% for the fourth quarter of 2022, compared with a Gross Loss Margin of 8.4% in the same period of 2021.
  • Net Loss from continuing operations was RMB365.8 million (US$53.0 million), compared with RMB734.1 million in the fourth quarter of 2021. Non-GAAP Net Loss from continuing operations([3])([4]) was RMB338.0 million (US$49.0 million), compared with RMB710.4 million in the fourth quarter of 2021.
  • Diluted loss per ADS([5]) from continuing operations was RMB4.49 (US$0.65), compared with RMB9.07 in the fourth quarter of 2021. Non-GAAP diluted loss per ADS(3)(4) from continuing operations was RMB4.13 (US$0.60), compared with RMB8.77 in the fourth quarter of 2021.
  • EBITDA([6]) from continuing operations was negative RMB324.7 million (US$47.1million), compared with negative RMB658.9 million in the fourth quarter of 2021. Adjusted EBITDA(6) from continuing operations was negative RMB296.9 million (US$43.0 million), compared with negative RMB635.2 million in the fourth quarter of 2021.

For the Fiscal Year Ended December 31, 2022:

  • Revenue was RMB7,744.1 million (US$1,122.8 million), compared with RMB11,425.8 million in 2021. The decrease was primarily due to the wind-down of the BEST UCargo business line and lower Freight and Global volume. Revenue generated from UCargo was approximately RMB36.0 million (US$5.2 million), compared with RMB2,809.1 million in 2021.
  • Gross Loss was RMB263.6 million (US$38.2 million), compared with RMB199.4 million in 2021. The increase in gross loss was primarily due to lower parcel volume from BEST Global business line. Gross Loss Margin was 3.4%, compared with a Gross Loss Margin of 1.7% in 2021.
  • Net Loss from continuing operations was RMB1,464.8 million (US$212.4 million), compared with RMB1,263.9 million in 2021. Non-GAAP Net Loss from continuing operations([7])([8]) was RMB1,380.4 million (US$200.1 million), compared with RMB1,214.8 million in 2021.
  • Diluted loss per ADS([9]) from continuing operations was RMB18.17 (US$2.63), compared with a loss of RMB15.61 in 2021. Non-GAAP diluted loss per ADS(3)(4) from continuing operations was RMB17.09 (US$2.48), compared with a loss of RMB14.98 in 2021.
  • EBITDA([10]) from continuing operations was negative RMB1,266.2 million (US$183.6 million), compared with negative RMB976.2 million in 2021. Adjusted EBITDA(6) from continuing operations was negative RMB1,181.8 million (US$171.3 million), compared with negative RMB927.2 million in 2021.

BUSINESS HIGHLIGHTS([11]) 

BEST Freight – In the fourth quarter of 2022, Freight’s volume decreased by 7.6% year over year, and revenue decreased by 32.0% year over year to approximately RMB1.3 billion. The decrease in Freight revenue was primarily due to the wind-down of UCargo business unit.  The Company remained focused on developing its e-commerce related business, which contributed 21.2% of total volume in the fourth quarter of 2022. Freight’s gross margin was negative 1.3%, representing a 10.4 percentage points improvement from the same period of 2021 as we continued to reduce operating expenses and improve efficiency. For the full year of 2022, Freight’s volume decreased by 6.1% year over year to 8.7 million tonnes. 

BEST UCargo’s operations and financial results are now consolidated with BEST Freight. 

BEST Supply Chain Management – In the fourth quarter of 2022, total revenue for Supply Chain Management increased by 2.7% to RMB500.6 million year over year, and gross margin improved by 6.3 percentage points to 4.4%, narrowing Supply Chain Management’s net loss by RMB60.4 million, or 81.3%. Its distribution volume increased by 82.1% in the fourth quarter, while the total number of orders fulfilled by Cloud OFCs decreased by 15.6% year over year. For the full year of 2022, the distribution volume increased by 53.6% year over year, while the total number of orders fulfilled by Cloud OFCs decreased by 16.6%.  BEST Supply Chain Management’s gross margin for 2022 improved by 2.1 percentage points to 6.1%.

BEST Global – The market in Southeast Asia remained challenging in the fourth quarter of 2022. In the wake of relaxed COVID-19 pandemic control measures in the region, there was a shift in consumer consumption activities from online to offline, which negatively impacted the e-commerce logistics industry. As a result, Global’s parcel volume decreased by 41.8% year over year to 25.4 million in the fourth quarter of 2022. For the full year of 2022, Global’s parcel volume decreased by 19.1% year over year to 121.6 million.

Others

As part of its Strategic Refocusing Program, the Company substantially completed its wind down of the Capital business line in the fourth quarter of 2022.   

Key Operational Metrics

Three Months Ended

% Change YOY

December 31,
2020

December 31,
2021

December 31,

2022

2021 vs
2020

2022 vs
2021

Freight Volume (Tonne in ‘000)

2,623

2,408

2,226

(8.2 %)

(7.6 %)

Global Parcel Volume in
Southeast Asia (in ‘000)

27,891

43,707

25,421

56.7 %

(41.8 %)

Fiscal Year Ended

% Change YoY

December 31,
2020

December 31,
2021

December 31,

2022

2021 vs
2020

2022 vs
2021

Freight Volume (Tonne in ‘000)

8,392

9,218

8,659

9.8 %

(6.1 %)

Global Parcel Volume in
Southeast Asia (in ‘000)

73,585

150,392

121,637

104.4 %

(19.1 %)

FINANCIAL RESULTS ([12]) 

For the Fourth Quarter Ended December 31, 2022:

Revenue

The following table sets forth a breakdown of revenue by business segment for the periods indicated.

Table 1 – Breakdown of Revenue by Business Segment

Three Months Ended

December 31, 2021

December 31, 2022

(In ‘000, except for %)

RMB

% of
Revenue

RMB

US$

% of
Revenue

% Change
YOY

Total Freight

1,854,018

68.1 %

1,261,196

182,856

63.7 %

-32.0 %

  -Freight

1,503,995

55.3 %

1,260,244

182,718

63.6 %

-16.2 %

  -Legacy UCargo

350,023

12.8 %

952

138

0.1 %

-99.7 %

Supply Chain
Management

487,337

17.9 %

500,602

72,580

25.3 %

2.7 %

Global

330,564

12.1 %

195,680

28,371

9.9 %

-40.8 %

Others([13])

52,935

1.9 %

23,917

3,468

1.1 %

-54.8 %

Total Revenue

2,724,854

100.0 %

1,981,395

287,275

100.0 %

-27.3 %

  • Freight Service Revenue was RMB1,261.2 million (US$182.9 million) for the fourth quarter of 2022, compared with RMB1,854.0 million in the same period last year, of which, RMB952,000 and RMB350.0 million were from the legacy UCargo business line, respectively. Freight service revenue, excluding the legacy UCargo business, decreased by 16.2% year over year, primarily due to lower volume and decrease in average selling price per tonne.
  • Supply Chain Management Service Revenue increased by 2.7% year over year to RMB500.6 million (US$72.6 million) for the fourth quarter of 2022 from RMB487.3 million in the same period of 2021, primarily due to newly signed customers with high unit economics, and improved service capability.
  • Global Service Revenue decreased by 40.8% year over year to RMB195.7 million (US$28.4 million) for the fourth quarter of 2022 from RMB330.6 million in the same period of 2021, primarily due to decreased parcel volume.

Cost of Revenue

The following table sets forth a breakdown of cost of revenue by business segment for the periods indicated.

Table 2 – Breakdown of Cost of Revenue by Business Segment

Three Months Ended

% of Revenue
Change

YOY

December 31, 2021

December 31, 2022

(In ‘000, except for %)

RMB

% of
Revenue

RMB

US$

% of
Revenue

Freight

(2,070,840)

111.7 %

(1,277,026)

(185,151)

101.3 %

-10.4 %

Supply Chain
Management

(496,353)

101.9 %

(478,511)

(69,378)

95.6 %

-6.3 %

Global

(346,392)

104.8 %

(264,014)

(38,278)

134.9 %

30.1 %

Others

(39,679)

75.0 %

(20,321)

(2,946)

85.0 %

10.0 %

Total Cost of Revenue

(2,953,264)

108.4 %

(2,039,872)

(295,753)

103.0 %

-5.4 %

  • Cost of Revenue for Freight was RMB1,277.0 million (US$185.2 million), or 101.3% of revenue, in the fourth quarter of 2022. The 10.4% year-over-year decrease in cost of revenue as a percentage of revenue was mainly due to improved operating efficiency and effective cost control measures.
  • Cost of Revenue for Supply Chain Management was RMB478.5 million (US$69.4 million), or 95.6% of revenue, in the fourth quarter of 2022. The 6.3% year-over-year decrease in cost of revenue as a percentage of revenue was primarily due to effective cost control measures and customer structure optimization.
  • Cost of Revenue for Global was RMB264.0 million (US$38.3 million), or 134.9% of revenue, in the fourth quarter of 2022. The 30.1% year-over-year increase in cost of revenue as a percentage of revenue was primarily due to lower parcel volume. 
  • Cost of Revenue for Others was RMB20.3 million (US$2.9 million), or 85.0% of revenue, in the fourth quarter of 2022, representing a 10.0% year-over-year increase.

Gross loss was RMB58.5 million (US$8.5 million) in the fourth quarter of 2022, compared with a gross loss of RMB228.4 million in the fourth quarter of 2021; Gross Margin was negative 3.0%, compared with negative 8.4% in the fourth quarter of 2021.

Operating Expenses

Selling, General and Administrative (“SG&A”) Expenses were RMB263.4 million (US$38.2 million), or 13.3% of revenue in the fourth quarter of 2022, compared with RMB354.8 million, or 13.0% of revenue in the same quarter of 2021. The decrease in the SG&A expenses was primarily due to reduced employee headcount. 

Research and Development Expenses were RMB29.2 million (US$4.2 million), or 1.5% of revenue in the fourth quarter of 2022, compared with RMB50.3 million, or 1.8% of revenue in the fourth quarter of 2021, primarily due to reduced employee headcount.

Share-based Compensation (“SBC”) Expenses included in the cost and expense items above were RMB15.6 million (US$2.3 million) in the fourth quarter of 2022, compared with RMB23.7 million in the same period of 2021. Of the total SBC expenses, RMB0.08 million (US$0.01 million) was allocated to cost of revenue, RMB0.7 million (US$0.1 million) was allocated to selling expenses, RMB13.6 million (US$2.0 million) was allocated to general and administrative expenses, and RMB1.2 million (US$0.2 million) was allocated to research and development expenses.

Net Loss and Non-GAAP Net Loss from continuing operations

Net Loss from continuing operations in the fourth quarter of 2022 was RMB365.8 million (US$53.0 million), compared with RMB734.1 million in the same period of 2021. Excluding SBC expenses and fair value change of equity investments, Non-GAAP Net Loss from continuing operations in the fourth quarter of 2022 was RMB338.0 million (US$49.0 million), compared with RMB710.4 million in the fourth quarter of 2021.

Diluted loss per ADS and Non-GAAP diluted loss per ADS from continuing operations

Diluted loss per ADS from continuing operations in the fourth quarter of 2022 was RMB4.49 (US$0.65), compared with a loss of RMB9.07 in the same period of 2021. Excluding SBC expenses, amortization of intangible assets resulting from business acquisitions and fair value change of equity investments, Non-GAAP diluted loss per ADS from continuing operations in the fourth quarter of 2022 was RMB4.13 (US$0.60), compared with a loss of RMB8.77 in the fourth quarter of 2021. A reconciliation of non-GAAP diluted loss per ADS to diluted loss per ADS is included at the end of this results announcement.

Adjusted EBITDA and Adjusted EBITDA Margin from continuing operations

Adjusted EBITDA from continuing operations in the fourth quarter of 2022 was negative RMB296.9 million (US$43.0 million), compared with negative RMB635.2 million in the same period of 2021. Adjusted EBITDA Margin from continuing operations in the fourth quarter of 2022 was negative 15.0%, compared with negative 23.3% in the same period of 2021.

Capital Expenditures (“CAPEX”)

CAPEX was RMB11.1 million (US$1.6 million) or 0.6% of total revenue in the fourth quarter of 2022, compared with CAPEX of RMB20.6 million, or 0.8% of total revenue in the same period of 2021.

Cash and Cash Equivalents, Restricted Cash and Short-term Investments

As of December 31, 2022, cash and cash equivalents, restricted cash and short-term investments were RMB3.2 billion (US$464.5 million), compared with RMB5.5 billion as of December 31, 2021. In 2022, the Company bought back approximately US$200 million (RMB1.4 billion) aggregate principal amount of its existing Convertible Senior Notes due 2024.

For the Fiscal Year Ended December 31, 2022:

Revenue

The following table sets forth a breakdown of revenue by business segment for the periods indicated.

Table 3 – Breakdown of Revenue by Business Segment

Fiscal Year Ended

December 31, 2021

December 31, 2022

(In ‘000, except for %)

RMB

% of
Revenue

RMB

US$

% of
Revenue

% Change
YoY

Total Freight

8,244,435

72.2 %

4,888,278

708,734

63.2 %

-40.7 %

  -Freight

5,435,354

47.6 %

4,852,299

703,518

62.8 %

-10.7 %

  -Legacy UCargo

2,809,081

24.6 %

35,979

5,216

0.4 %

-98.7 %

Supply Chain
Management

1,815,104

15.9 %

1,822,075

264,176

23.5 %

0.4 %

Global

1,193,855

10.4 %

916,907

132,939

11.8 %

-23.2 %

Others

172,442

1.5 %

116,812

16,936

1.5 %

-32.3 %

Total Revenue

11,425,836

100.0 %

7,744,072

1,122,785

100.0 %

-32.2 %

  • Freight Service Revenue was RMB4,888.3 million (US$708.7 million) in 2022 compared with RMB8,244.4 million in 2021, of which, RMB36.0 million and RMB2,809.1 million were from the legacy UCargo business line in 2022 and 2021, respectively. Freight service revenue, excluding the legacy UCargo business, decreased by 10.7% year over year, primarily due to lower volume.
  • Supply Chain Management Service Revenue increased by 0.4% year over year to RMB1,822.1 million (US$264.2 million) in 2022 from RMB1,815.1 million in 2021, primarily due to newly signed customers with high unit economics following discontinuation of certain low margin legacy accounts, as well as improved service capability.
  • Global Service Revenue decreased by 23.2% year over year to RMB916.9 million (US$132.9 million) in 2022 from RMB1,193.9 million in 2021, primarily due to decreased parcel volume.

Cost of Revenue

The following table sets forth a breakdown of cost of revenue by business segment for the periods indicated.

Table 4 – Breakdown of Cost of Revenue by Business Segment

Fiscal Year Ended

% of Revenue
Change

YoY

December 31, 2021

December 31, 2022

(In ‘000, except for %)

RMB

% of
Revenue

RMB

US$

% of
Revenue

Freight

(8,506,738)

103.2 %

(5,114,937)

(741,596)

104.6 %

1.4 %

Supply Chain
Management

(1,741,832)

96.0 %

(1,711,818)

(248,190)

93.9 %

-2.1 %

Global

(1,258,511)

105.4 %

(1,081,587)

(156,815)

118.0 %

12.6 %

Others

(118,143)

68.5 %

(99,288)

(14,395)

85.0 %

16.5 %

Total Cost of Revenue

(11,625,224)

101.7 %

(8,007,630)

(1,160,996)

103.4 %

1.7 %

  • Cost of Revenue for Freight was RMB5,114.9 million (US$741.6 million), or 104.6% of revenue in 2022. The 1.4% year-over-year increase in cost of revenue as a percentage of revenue was mainly due to lower volume.
  • Cost of Revenue for Supply Chain Management was RMB1,711.8 million (US$248.2 million), or 93.9% of revenue in 2022. The 2.1% year-over-year decrease in cost of revenue as a percentage of revenue was primarily due to effective cost control measures and customer structure optimization.
  • Cost of Revenue for Global was RMB1,081.6 million (US$156.8 million), or 118.0% of revenue in 2022. The 12.6% year-over-year increase in cost of revenue as a percentage of revenue was primarily due to lower parcel volume.  
  • Cost of Revenue for Others was RMB99.3 million (US$14.4 million), or 85.0% of revenue in 2022, representing a 16.5% year-over-year increase.

Gross loss was RMB263.6 million (US$38.2 million) in 2022, compared with a gross loss of RMB199.4 million in 2021; Gross Margin was negative 3.4%, compared with negative 1.7% in 2021.

Operating Expenses

Selling, General and Administrative (“SG&A”) Expenses were RMB1,127.3 million (US$163.4 million), or 14.6% of revenue in 2022, compared with RMB1,141.7 million, or 10.0% of revenue in 2021 due to reduced employee headcount.

Research and Development Expenses were RMB144.2 million (US$20.9 million), or 1.9% of revenue in 2022, compared with RMB180.2 million, or 1.6% of revenue in 2021 due to reduced employee headcount. 

Share-based Compensation (“SBC”) Expenses included in the cost and expense items above were RMB72.1 million (US$10.5 million) in 2022, compared with RMB107.7 million in 2021. Of the total SBC expenses, RMB0.32 million (US$0.05 million) was allocated to cost of revenue, RMB3.5 million (US$0.5 million) was allocated to selling expenses, RMB63.3 million (US$9.2 million) was allocated to general and administrative expenses, and RMB5.0 million (US$0.7 million) was allocated to research and development expenses.

Net Loss and Non-GAAP Net Loss from continuing operations

Net Loss from continuing operations in 2022 was RMB1,464.8 million (US$212.4 million), compared with RMB1,263.9 million in 2021. Excluding SBC expenses and fair value change of equity investments, Non-GAAP Net Loss from continuing operations in 2022 was RMB1,380.4 million (US$200.1 million), compared with RMB1,214.8 million in 2021.

Diluted loss per ADS and Non-GAAP diluted loss per ADS from continuing operations

Diluted loss per ADS from continuing operations in 2022 was RMB18.17 (US$2.63), compared with a loss of RMB15.61 in 2021. Excluding SBC expenses, amortization of intangible assets resulting from business acquisitions and fair value change of equity investments, Non-GAAP diluted loss per ADS from continuing operations in 2022 was RMB17.09 (US$2.48), compared with a loss of RMB14.98 in 2021. A reconciliation of non-GAAP diluted loss per ADS to diluted loss per ADS is included at the end of this results announcement.

Adjusted EBITDA and Adjusted EBITDA Margin from continuing operations

Adjusted EBITDA from continuing operations in 2022 was negative RMB1,181.8 million (US$171.3 million), compared with negative RMB927.2 million in 2021. Adjusted EBITDA Margin from continuing operations in 2022 was negative 15.3%, compared with negative 8.1% in 2021.

Capital Expenditures (“CAPEX”)

CAPEX was RMB143.3 million (US$20.8 million) or 1.9% of total revenue in 2022, compared with CAPEX of RMB160.0 million, or 1.4% of total revenue in 2021. 

SHARES OUTSTANDING

As of February 28, 2023, the Company had approximately 393.9 million ordinary shares outstanding([14]). Each American Depositary Share represents five (5) Class A ordinary shares.

FINANCIAL GUIDANCE

The Company confirms its guidance for total revenue between RMB 9.0 billion and RMB 9.5 billion for the full year of 2023.

This forecast reflects the Company’s current and preliminary view based on its current business situation and market conditions, which are subject to change.

WEBCAST AND CONFERENCE CALL INFORMATION

The Company will hold a conference call at 8:00 pm U.S. Eastern Time on March 8, 2023 (9:00 am Beijing Time on March 9, 2023), to discuss its financial results and operating performance for the fourth quarter and fiscal year 2022.

Participants may access the call by dialing the following numbers:

United States                                      : +1-888-317-6003

Hong Kong                                          : 800-963976 or +852-5808-1995

Mainland China                                   : 4001-206115

International                                        : +1-412-317-6061

Participant Elite Entry Number           : 1659917

A replay of the conference call will be accessible through March 15, 2023 by dialing the following numbers:

United States                                       : +1-877-344-7529

International                                         : +1-412-317-0088

Replay Access Code                          : 1608887

Please visit the Company’s investor relations website to view the earnings release prior to the conference call. A live and archived webcast of the conference call and a corporate presentation will be available at the same site.

ABOUT BEST INC.

BEST Inc. (NYSE: BEST) is a leading integrated smart supply chain solutions and logistics services provider in China and Southeast Asia. Through its proprietary technology platform and extensive networks, BEST offers a comprehensive set of logistics and value-added services, including freight delivery, supply chain management and global logistics services. BEST’s mission is to empower business and enrich life by leveraging technology and business model innovation to create a smarter, more efficient supply chain. For more information, please visit: http://www.best-inc.com/en/.  

For investor and media inquiries, please contact:

BEST Inc.
Investor relations team                         
ir@best-inc.com

The Piacente Group, Inc.
Helen Wu
Tel: +86-10-6508-0677
E-mail: best@tpg-ir.com

The Piacente Group, Inc.
Brandi Piacente
Tel: +1-212-481-2050
E-mail:  best@tpg-ir.com 

SAFE HARBOR STATEMENT

This announcement contains forward-looking statements. These statements are made under the “safe harbor” provisions of the U.S. Private Securities Litigation Reform Act of 1995. These forward-looking statements can be identified by terminology such as “will,” “expects,” “anticipates,” “future,” “intends,” “plans,” “believes,” “estimates” and similar statements. Among other things, the business outlook and quotations from management in this announcement, as well as BEST’s strategic and operational plans, contain forward-looking statements. BEST may also make written or oral forward-looking statements in its periodic reports to the U.S. Securities and Exchange Commission (the “SEC”), in its annual report to shareholders, in press releases and other written materials and in oral statements made by its officers, directors or employees to third parties. Statements that are not historical facts, including statements about BEST’s beliefs and expectations, are forward-looking statements. Forward-looking statements involve inherent risks and uncertainties. A number of factors could cause actual results to differ materially from those contained in any forward-looking statement, including but not limited to the following: BEST’s goals and strategies; BEST’s future business development, results of operations and financial condition; BEST’s ability to maintain and enhance its ecosystem; BEST’s ability to compete effectively; BEST’s ability to continue to innovate, meet evolving market trends, adapt to changing customer demands and maintain its culture of innovation; fluctuations in general economic and business conditions in China and other countries in which BEST operates, and assumptions underlying or related to any of the foregoing. Further information regarding these and other risks is included in BEST’s filings with the SEC. All information provided in this press release and in the attachments is as of the date of this press release, and BEST does not undertake any obligation to update any forward-looking statement, except as required under applicable law.

USE OF NON-GAAP FINANCIAL MEASURES

In evaluating its business, BEST considers and uses non-GAAP measures, such as non-GAAP net loss/income, non-GAAP net loss/income margin, adjusted EBITDA, adjusted EBITDA margin, EBITDA, and non-GAAP Diluted earnings/loss per ADS, as supplemental measures in the evaluation of the Company’s operating results and in the Company’s financial and operational decision-making. The Company believes these non-GAAP financial measures that help identify underlying trends in the Company’s business that could otherwise be distorted by the effect of the expenses and gains that the Company includes in loss from operations and net loss. The Company believes that these non-GAAP financial measures provide useful information about its operating results, enhance the overall understanding of its past performance and future prospects and allow for greater visibility with respect to key metrics used by the Company’s management in its financial and operational decision-making. The presentation of these non-GAAP financial measures is not intended to be considered in isolation or as a substitute for the financial information prepared and presented in accordance with U.S. GAAP. For more information on these non-GAAP financial measures, please see the table captioned “Reconciliations of Non-GAAP Measures to the Nearest Comparable GAAP Measures” in the results announcement.

The non-GAAP financial measures are provided as additional information to help investors compare business trends among different reporting periods on a consistent basis and to enhance investors’ overall understanding of the Company’s current financial performance and prospects for the future. These non-GAAP financial measures should be considered in addition to results prepared in accordance with U.S. GAAP, but should not be considered a substitute for, or superior to, U.S. GAAP results. In addition, the Company’s calculation of the non-GAAP financial measures may be different from the calculation used by other companies, and therefore comparability may be limited.

Summary of Unaudited Condensed Consolidated Income Statements

(In Thousands)

Three Months Ended December 31,

Fiscal Year Ended December 31,

2021

2022

2021

2022

RMB

RMB

US$

RMB

RMB

US$

Revenue

Freight

1,854,018

1,261,196

182,856

8,244,435

4,888,278

708,734

-Freight

1,503,995

1,260,244

182,718

5,435,354

4852,299

705,696

-Legacy UCargo

350,023

952

138

2,809,081

35,979

3,038

Supply Chain Management

487,337

500,602

72,580

1,815,104

1,822,075

264,176

Global

330,564

195,680

28,371

1,193,855

916,907

132,939

Others

52,935

23,917

3,468

172,442

116,812

16,936

Total Revenue

2,724,854

1,981,395

287,275

11,425,836

7,744,072

1,122,785

Cost of Revenue

Freight

(2,070,840)

(1,277,026)

(185,151)

(8,506,738)

(5,114,937)

(741,596)

Supply Chain Management

(496,353)

(478,511)

(69,378)

(1,741,832)

(1,711,818)

(248,190)

Global

(346,392)

(264,014)

(38,278)

(1,258,511)

(1,081,587)

(156,815)

Others

(39,679)

(20,321)

(2,946)

(118,143)

(99,288)

(14,395)

Total Cost of Revenue

(2,953,264)

(2,039,872)

(295,753)

(11,625,224)

(8,007,630)

(1,160,996)

Gross Loss

(228,410)

(58,477)

(8,478)

(199,388)

(263,558)

(38,211)

Selling Expenses

(73,021)

(54,621)

(7,919)

(260,219)

(237,918)

(34,495)

General and Administrative
   Expenses

(281,772)

(208,738)

(30,264)

(881,498)

(889,345)

(128,943)

Research and Development
   Expenses

(50,294)

(29,247)

(4,240)

(180,204)

(144,181)

(20,904)

Other operating (loss)/income, net

(89,893)

3,387

491

58,337

108,817

15,777

Loss from Operations

(723,390)

(347,696)

(50,410)

(1,462,972)

(1,426,185)

(206,776)

Interest Income

17,735

19,208

2,785

49,658

80,361

11,651

Interest Expense

(29,310)

(16,329)

(2,367)

(142,751)

(89,058)

(12,912)

Foreign Exchange Gain/(loss)

44,186

68,318

9,905

44,556

(132,730)

(19,244)

Other Income

6,709

2,149

312

321,075

25,914

3,757

Other Expense

(34,657)

(13,815)

(2,003)

(55,253)

5,763

836

(Loss)/Gain on changes in the fair
value of derivative assets/liabilities

(14,918)

(77,577)

(11,248)

(14,918)

71,619

10,384

Loss before Income Tax and
   Share of Net Loss of Equity
   Investees

(733,645)

(365,742)

(53,026)

(1,260,605)

(1,464,316)

(212,304)

Income Tax Expense

(500)

(106)

(15)

(3,198)

(511)

(74)

Loss before Share of Net loss of
   Equity Investees

(734,145)

(365,848)

(53,041)

(1,263,803)

(1,464,827)

(212,378)

Share of Net Loss of Equity
   Investees

(58)

Net Loss from continuing
   operations

(734,145)

(365,848)

(53,041)

(1,263,861)

(1,464,827)

(212,378)

Net gain/(loss) from discontinued
   operations

2,679,400

(31,787)

(4,609)

1,473,489

(38,464)

(5,577)

Net Gain/(Loss)

1,945,255

(397,635)

(57,650)

209,628

(1,503,291)

(217,955)

Net Loss from continuing operations
   attributable to non-controlling
   interests

(28,727)

(13,055)

(1,893)

(52,279)

(39,980)

(5,797)

Net Gain/(Loss) attributable to
   BEST Inc.

1,973,982

(384,580)

(55,757)

261,907

(1,463,311)

(212,158)

Summary of Unaudited Condensed Consolidated Balance Sheets

(In Thousands)

As of December 31,2021

As of December 31, 2022

RMB

RMB

US$

Assets

Current Assets

Cash and Cash Equivalents

3,571,745

533,481

77,347

Restricted Cash

675,159

399,337

57,898

Accounts and Notes Receivables

827,631

691,324

100,237

Inventories

25,622

16,480

2,389

Prepayments and Other Current
   Assets

1,172,472

795,401

115,322

Short–term Investments

147,359

725,043

105,121

Amounts Due from Related Parties

125,198

76,368

11,072

Lease Rental Receivables

298,364

43,067

6,244

Total Current Assets

6,843,550

3,280,501

475,630

Non–current Assets

Property and Equipment, Net

762,642

784,732

113,775

Intangible Assets, Net

55,684

75,553

10,954

Long–term Investments

219,171

156,859

22,742

Goodwill

54,135

54,135

7,849

Non–current Deposits

92,866

50,767

7,361

Other Non–current Assets

111,640

75,666

10,971

Restricted Cash

1,069,244

1,545,605

224,092

Lease Rental Receivables

235,429

40,188

5,827

Operating Lease Right-of-use
Assets

1,899,522

1,743,798

252,827

Total non–current Assets

4,500,333

4,527,303

656,398

Total Assets

11,343,883

7,807,804

1,132,028

Liabilities and Shareholders’
   Equity

Current Liabilities

Long-term borrowings-current

287,814

79,148

11,475

Convertible Senior Notes held by
   related parties

633,475

1,045,488

151,582

Convertible Senior Notes held by
   third parties

633,475

77

11

Short–term Bank Loans

530,495

183,270

26,572

Accounts and Notes Payable

1,353,150

1,430,004

207,331

Income Tax Payable

587

1,563

227

Customer Advances and Deposits
   and Deferred Revenue

298,353

277,737

40,268

Accrued Expenses and Other
   Liabilities

1,591,639

1,198,228

173,727

Financing Lease Liabilities

1,851

1,490

216

Operating Lease Liabilities

518,248

544,262

78,911

Amounts Due to Related Parties

2,763

1,315

191

Total Current Liabilities

5,851,850

4,762,582

690,511

Summary of Unaudited Condensed Consolidated Balance Sheets (Cont’d)

(In Thousands)

As of December 31, 2021

As of December 31, 2022

RMB

RMB

US$

Non-current Liabilities

Convertible senior notes held by

 related parties

955,097

Long-term borrowings

67,080

381

55

Operating Lease Liabilities

1,456,843

1,292,057

187,331

Financing Lease Liabilities

2,121

1,392

202

Other Non–current Liabilities

24,261

18,752

2,719

Long-term Bank Loans

769,767

928,894

134,677

Total Non–current Liabilities

3,275,169

2,241,476

324,984

Total Liabilities

9,127,019

7,004,058

1,015,495

Mezzanine Equity:

Convertible Non-controlling Interests

191,865

191,865

27,818

Total mezzanine equity

191,865

191,865

27,818

Shareholders’ Equity

Ordinary Shares

25,988

25,988

3,768

Treasury Shares

(113,031)

Additional Paid–In Capital

19,522,173

19,481,417

2,824,540

Statutory reserves

167

Accumulated Deficit

(17,471,716)

(18,934,860)([15])

(2,745,297)

Accumulated Other
   Comprehensive Income

107,379

124,464

18,046

BEST Inc. Shareholders’ Equity

2,070,960

697,009

101,057

Non-controlling Interests

(45,961)

(85,128)

(12,342)

Total Shareholders’ Equity

2,024,999

611,881

88,715

Total Liabilities, Mezzanine Equity
   and Shareholders’ Equity

11,343,883

7,807,804

1,132,028

     Summary of Unaudited Condensed Consolidated Statements of Cash Flows

   (In Thousands)

Three Months Ended December 31,

Fiscal Year Ended December 31,

2021

2022

2021

2022

RMB

RMB

US$

RMB

RMB

US$

Net cash used in continuing
   operating activities

(508,632)

(241,890)

(35,071)

(891,135)

(1,051,662)

(152,478)

Net cash used in discontinued
   operating activities

(387,540)

(1,912,826)

(66,174)

(9,594)

Net cash used in operating
   activities

(896,172)

(241,890)

(35,071)

(2,803,961)

(1,117,836)

(162,072)

Net cash generated from
   continuing
investing activities

3,236,982

239,536

34,729

4,990,734

150,756

21,858

Net cash used in discontinued
   Investing activities

(97,328)

(448,016)

Net cash generated from 
   investing activities

3,139,654

239,536

34,729

4,542,718

150,756

21,858

Net cash (used in)/generated
   from
continuing financing
   activities

(746,656)

481

70

(237,922)

(1,948,367)

(282,487)

Net cash generated from/(used
   in
) discontinued financing
   activities

469,421

(337,838)

Net cash (used in)/generated
   from
 financing activities

(277,235)

481

70

(575,760)

(1,948,367)

(282,487)

Exchange Rate Effect on Cash
   and
Cash Equivalents, and
   Restricted Cash

(29,450)

(14,864)

(2,155)

(55,970)

77,722

11,269

Net increase/(decrease) in
   Cash and Cash Equivalents,
   and Restricted Cash

1,936,797

(16,737)

(2,427)

1,107,027

(2,837,725)

(411,432)

Cash and Cash Equivalents,
   and Restricted Cash at
   Beginning of
 Period

3,379,351

2,495,160

361,764

4,209,121

5,316,148

770,769

Cash and Cash Equivalents,
   and Restricted Cash at End
   of
 Period

5,316,148

2,478,423

359,337

5,316,148

2,478,423

359,337

RECONCILIATIONS OF NON-GAAP MEASURES TO THE NEAREST COMPARABLE GAAP MEASURES

For the Company’s continuing operations, the table below sets forth a reconciliation of the Company’s net loss to EBITDA, adjusted EBITDA and adjusted EBITDA margin for the periods indicated:

Table 5 – Reconciliation of EBITDA, Adjusted EBITDA and Adjusted EBITDA Margin 

Three Months Ended December 31, 2022

(In RMB’000)

Freight

Supply Chain

Global

Others

Unallocated([16])

Total

Net Loss

(137,133)

(13,939)

(134,200)

(25,378)

(55,198)

(365,848)

Add

Depreciation &
Amortization

19,411

7,492

11,682

847

4,448

43,880

Interest Expense

16,329

16,329

Income Tax Expense

(12)

(5)

123

106

Subtract

Interest Income

(19,208)

(19,208)

EBITDA

(117,722)

(6,459)

(122,523)

(24,408)

(53,629)

(324,741)

Add

 Share-based

Compensation
Expenses

2,237

1,259

(235)

25

12,291

15,577

Loss from
depreciation of
investments

12,312

12,312

Adjusted EBITDA

(115,485)

(5,200)

(122,758)

(24,383)

(29,026)

(296,852)

Adjusted EBITDA
  Margin

(9.2 %)

(1.0 %)

(62.7 %)

(101.9 %)

(15.0 %)

Three Months Ended December 31, 2021

(In RMB’000)

Freight

Supply Chain

Global

Others

Unallocated([17])

Total

Net Loss

(447,057)

(74,380)

(85,518)

(60,046)

(67,144)

(734,145)

Add

Depreciation &
Amortization

19,730

9,431

4,696

23,257

6,058

63,172

Interest Expense

29,310

29,310

Income Tax
Expense

79

421

500

Subtract

Interest Income

(17,735)

(17,735)

EBITDA

(427,327)

(64,870)

(80,822)

(36,368)

(49,511)

(658,898)

Add

 Share-based

Compensation
Expenses

3,404

1,967

2,066

124

16,173

23,734

Adjusted EBITDA

(423,923)

(62,903)

(78,756)

(36,244)

(33,338)

(635,164)

Adjusted EBITDA
Margin

(22.9 %)

(12.9 %)

23.8%)

(68.5 %)

(23.3 %)

Fiscal Year Ended December 31, 2022

(In RMB’000)

Freight

Supply Chain

Global

Others

Unallocated([18])

Total

Net Loss

(506,411)

(32,277)

(420,687)

(213,794)

(291,658)

(1,464,827)

Add

Depreciation &
Amortization

79,273

35,789

29,300

22,846

22,179

189,387

Interest Expense

89,058

89,058

Income Tax
Expense

23

25

451

12

511

Subtract

Interest Income

(80,361)

(80,361)

EBITDA

(427,138)

3,535

(391,362)

(190,497)

(260,770)

(1,266,232)

Add

 Share-based

Compensation
Expenses

10,478

6,081

4,962

319

50,256

72,096

Loss from
depreciation of
investments

12,312

12,312

Adjusted EBITDA

(416,660)

9,616

(386,400)

(190,178)

(198,202)

(1,181,824)

Adjusted EBITDA
Margin

(8.5 %)

0.5 %

(42.1 %)

(162.8 %)

(15.3 %)

Fiscal Year Ended December 31, 2021

(In RMB’000)

Freight

Supply Chain

Global

Others

Unallocated([19])

Total

Net Loss

(707,793)

(103,387)

(267,902)

(90,775)

(94,004)

(1,263,861)

Add

Depreciation &
Amortization

83,425

38,525

19,506

24,396

25,513

191,365

Interest Expense

142,751

142,751

Income Tax
Expense/(Benefit)

173

21

3,010

(6)

3,198

Subtract

Interest Income

(49,658)

(49,658)

EBITDA

(624,368)

(64,689)

(248,375)

(63,369)

24,596

(976,205)

Add

 Share-based

Compensation
Expenses

13,537

8,351

8,604

608

76,581

107,681

Subtract

Gain from
appreciation of
investments

(58,643)

(58,643)

Adjusted EBITDA

(610,831)

(56,338)

(239,771)

(62,761)

42,534

(927,167)

Adjusted EBITDA
Margin

(7.4 %)

(3.1 %)

(20.1 %)

(36.4 %)

(8.1 %)

For the Company’s continuing operations, the table below sets forth a reconciliation of the Company’s net loss to non-GAAP net loss, non-GAAP net loss margin for the periods indicated:

Table 6 – Reconciliation of Non-GAAP Net Loss and Non-GAAP Net Loss Margin

Three Months Ended December 31, 2022

(In RMB’000)

Freight

Supply Chain

Global

Others

Unallocated([20])

Total

Net Loss

(137,133)

(13,939)

(134,200)

(25,378)

(55,198)

(365,848)

Add

 Share-based

Compensation
Expenses

2,237

1,259

(235)

25

12,291

15,577

Loss from
depreciation of
investments

12,312

12,312

Non-GAAP Net
    Loss

(134,896)

(12,680)

(134,435)

(25,353)

(30,595)

(337,959)

Non-GAAP Net
    Loss
 Margin

(10.7 %)

(2.5 %)

(68.7 %)

(106.0 %)

(17.1 %)

Three Months Ended December 31, 2021

(In RMB’000)

Freight

Supply Chain

Global

Others

Unallocated([21])

Total

Net Loss

(447,057)

(74,380)

(85,518)

(60,046)

(67,144)

(734,145)

Add

 Share-based

Compensation
Expenses

3,404

1,967

2,066

124

16,173

23,734

Non-GAAP Net

Loss

(443,653)

(72,413)

(83,452)

(59,922)

(50,971)

(710,411)

Non-GAAP Net

Loss Margin

(23.9 %)

(14.9 %)

(25.2 %)

(113.2 %)

(26.1 %)

Fiscal Year Ended December 31, 2022

(In RMB’000)

Freight

Supply Chain

Global

Others

Unallocated([22])

Total

Net Loss

(506,411)

(32,277)

(420,687)

(213,794)

(291,658)

(1,464,827)

Add

 Share-based

Compensation
Expenses

10,478

6,081

4,962

319

50,256

72,096

 Loss from
 depreciation of
investments

12,312

12,312

Non-GAAP Net

Loss

(495,933)

(26,196)

(415,725)

(213,475)

(229,090)

(1,380,419)

Non-GAAP Net

Loss Margin

(10.1 %)

(1.4 %)

(45.3 %)

(182.8 %)

(17.8 %)

Fiscal Year  Ended December 31, 2021

(In RMB’000)

Freight

Supply Chain

Global

Others

Unallocated([23])

Total

Net Loss

(707,793)

(103,387)

(267,902)

(90,775)

(94,004)

(1,263,861)

Add

 Share-based

Compensation
Expenses

13,537

8,351

8,604

608

76,581

107,681

Subtract

Gain from
appreciation of
investments

(58,643)

(58,643)

Non-GAAP Net

Loss

(694,256)

(95,036)

(259,298)

(90,167)

(76,066)

(1,214,823)

Non-GAAP Net

Loss Margin

(8.4 %)

(5.2 %)

(21.7 %)

(52.3 %)

(10.6 %)

For the Company’s continuing operations, the table below sets forth a reconciliation of the Company’s diluted loss per ADS to Non-GAAP diluted loss per ADS for the periods indicated:

Table 7 – Reconciliation of diluted loss per ADS and Non-GAAP diluted loss per ADS

Three Months Ended December 31,

Fiscal Year Ended December 31,

2022

2022

(In ‘000)

RMB

US$

RMB

US$

Net Loss Attributable to Ordinary Shareholders

(352,793)

(51,148)

(1,424,847)

(206,581)

Add

Share-based Compensation Expenses

15,577

2,258

72,096

10,454

Loss from depreciation of investments

12,312

1,785

12,312

1,785

Non-GAAP Net Loss Attributable to Ordinary
   Shareholders

(324,904)

(47,105)

(1,340,439)

(194,342)

Weighted Average Diluted Ordinary Shares 
   Outstanding During the Quarter

Diluted

393,078,084

393,078,084

392,192,648

392,192,648

Diluted (Non-GAAP)

393,078,084

393,078,084

392,192,648

392,192,648

Diluted loss per ordinary share

(0.90)

(0.13)

(3.63)

(0.53)

Add

Non-GAAP adjustment to net loss per   
   ordinary share

0.07

0.01

0.21

0.03

Non-GAAP diluted loss per ordinary share

(0.83)

(0.12)

(3.42)

(0.50)

Diluted loss per ADS

(4.49)

(0.65)

(18.17)

(2.63)

Add

Non-GAAP adjustment to net loss per ADS

0.36

0.05

1.08

0.15

Non-GAAP diluted loss per ADS

(4.13)

(0.60)

(17.09)

(2.48)

([1]) All numbers presented have been rounded to the nearest integer, tenth, or hundredth, and year over year comparisons are based on figures before rounding.                     

([2]) In December 2021, BEST sold its China express business, the principal terms of which were previously announced. As a result, China express business has been deconsolidated from the Company and its historical financial results are reflected in the Company’s consolidated financial statements as discontinued operations accordingly. The financial information and non-GAAP financial information disclosed in this press release is presented on a continuing operations basis, unless otherwise specifically stated.

([3]) Non-GAAP net income/loss represents net income/loss excluding share-based compensation expenses, amortization of intangible assets resulting from business acquisitions, and fair value change of equity investments (if any).

([4]) See the sections entitled “Use of Non-GAAP Financial Measures” and “Reconciliations of Non-GAAP Measures to the Nearest Comparable GAAP Measures” for more information about the non-GAAP measures referred to within this results announcement.

([5]) Diluted earnings/loss per ADS, is calculated by dividing net income/loss attributable to ordinary shareholders as adjusted for the effect of dilutive ordinary equivalent shares, if any, by the weighted average number of ordinary and dilutive ordinary equivalent shares expressed in ADS outstanding during the period.

([6]) EBITDA represents net income/loss excluding depreciation, amortization, interest expense and income tax expense and minus interest income. Adjusted EBITDA represents EBITDA excluding share-based compensation expenses and fair value change of equity investments (if any).

([7]) Non-GAAP net income/loss represents net income/loss excluding share-based compensation expenses, amortization of intangible assets resulting from business acquisitions, and fair value change of equity investments (if any).

([8]) See the sections entitled “Use of Non-GAAP Financial Measures” and “Reconciliations of Non-GAAP Measures to the Nearest Comparable GAAP Measures” for more information about the non-GAAP measures referred to within this results announcement.

([9]) Diluted earnings/loss per ADS, is calculated by dividing net income/loss attributable to ordinary shareholders as adjusted for the effect of dilutive ordinary equivalent shares, if any, by the weighted average number of ordinary and dilutive ordinary equivalent shares expressed in ADS outstanding during the period.

([10]) EBITDA represents net income/loss excluding depreciation, amortization, interest expense and income tax expense and minus interest income. Adjusted EBITDA represents EBITDA excluding share-based compensation expenses and fair value change of equity investments (if any).

([11]) All numbers presented have been rounded to the nearest integer, tenth, or hundredth, and year over year comparisons are based on figures before rounding.                     

([12]) All numbers represented the financial results from continuing operations, unless otherwise stated.             

([13]) Others” Segment primarily represents Capital business units. Results from UCargo’s legacy contracts with external customers are now reported under “Freight” segment and prior period segment information were retrospectively revised to conform to current period presentation.         

([14]) The total number of shares outstanding excludes shares reserved for future issuances upon exercise or vesting of awards granted under the Company’s share incentive plans.

([15]) Including accumulated accretion to redemption value and deemed dividend in relation to redeemable convertible preferred shares of RMB9,493,807, and accumulated loss from operations of RMB9,441,053.

([16]) Unallocated expenses are primarily related to corporate administrative expenses and other miscellaneous items that are not allocated to individual segments.

([17]) Unallocated expenses are primarily related to corporate administrative expenses and other miscellaneous items that are not allocated to individual segments.

([18]) Unallocated expenses are primarily related to corporate administrative expenses and other miscellaneous items that are not allocated to individual segments.

([19]) Unallocated expenses are primarily related to corporate administrative expenses and other miscellaneous items that are not allocated to individual segments.

([20]) Unallocated expenses are primarily related to corporate administrative expenses and other miscellaneous items that are not allocated to individual segments.

([21]) Unallocated expenses are primarily related to corporate administrative expenses and other miscellaneous items that are not allocated to individual segments.

([22]) Unallocated expenses are primarily related to corporate administrative expenses and other miscellaneous items that are not allocated to individual segments.

([23]) Unallocated expenses are primarily related to corporate administrative expenses and other miscellaneous items that are not allocated to individual segments.

Cision View original content:https://www.prnewswire.com/news-releases/best-inc-announces-unaudited-fourth-quarter-and-fiscal-year-2022-financial-results-301765733.html

Source: BEST Inc.

GLN International Attracts Investment to Lead the Global QR Payment/Withdrawal Market

SEOUL, South Korea, March 3, 2023 /PRNewswire/ — GLN International, a global QR payment/withdrawal platform, announced the successful completion of a strategic investment from four domestic and international institutions. The investment was made by Korea’s KB Digital Platform Fund, Taiwan’s Taishin International Bank, Japan’s Sumitomo Mitsui Trust Bank and Korea’s Kakaopay.


The investment could be made at the estimated value of 110 billion KRW(83.7 million USD) based on the  investors’ recognition that GLN’s business model and potential to be successful, despite the current economic downturn. The company plans to use the investment to further strengthen its leading position in the global QR payment/withdrawal platform market by speeding up the strategic alliance between global banks, payment networks and distributors.

GLN was spun off from Hana Bank in July 2021 and has been forming partnerships with domestic and foreign financial institutions since then. The company currently provides QR payment/withdrawal and tuition payment services in global areas such as Japan, Vietnam, Thailand, Taiwan, Hong Kong, Singapore, Laos, and Guam.

The inquiries about potential alliance and investment opportunities with multiple global financial institutions and digital platforms are continuing, which may expand the service coverage and improve the service quality.

Customers can use the GLN service  through Hana Bank’s Hana 1Q app and Hana Card’s Hana Money app, and Toss app, allowing users to easily and safely make payments and withdrawals simply by scanning a QR code.

Han Jun-seong, CEO of GLN International, said, “In order to expand the global QR financial ecosystem, the participation of domestic and foreign super app operators should be the key,” and “through the formation of this alliance, GLN plans to amplify the global QR payment/withdrawal coverage and plays a role in leading various areas of related business.

ZTE holds Global Industrial Innovation Forum at MWC 2023, shaping digital innovation

  • ZTE held a Global Industrial Innovation Forum with the theme of “Shaping Digital Innovation” at MWC 2023
  • The Forum gathered experts to deliver keynote speeches and discuss around the trending insights, business development strategies and technologies in specific areas

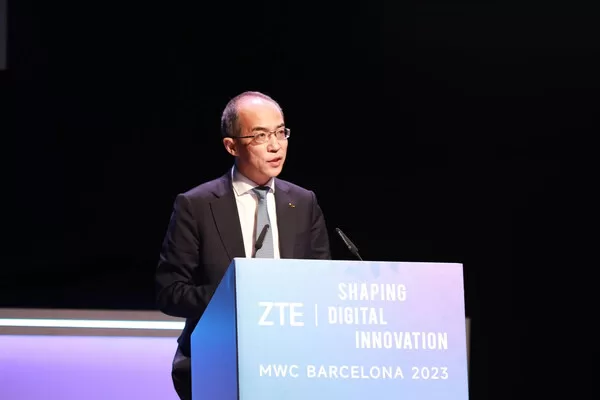
BARCELONA, Spain, March 1, 2023 /PRNewswire/ — ZTE Corporation, a global leading provider of information and communication technology solutions, held a Global Industrial Innovation Forum with the theme of “Shaping Digital Innovation” at Mobile World Congress (MWC) in Barcelona on February 27, 2023. The forum covers two sessions in terms of “Future Trends and Opportunities” and “Unleashing New Value”, gathering experts from global telecom operators, leading consulting agencies, eco-partners and related industries to deliver keynote speeches and discuss around the trending insights, business development strategies and technologies in specific areas.

ZTE CEO Xu Ziyang delivered a welcome speech in Global Industrial Innovation Forum at MWC 2023

Guests attending and delivering speeches on the forum are including: Xu Ziyang, CEO of ZTE; John Hoffman, CEO of GSMA; George Held, Chief of Staff of VEON Group; Vikram Sinha, President Director and CEO of Indosat Ooredoo Hutchison; Peter Jarich, Head of GSMA Intelligence; Ni Fei, SVP of ZTE; Spas Velinov, CTO of Yettel Bulgaria EAD; Dr. Terje Jensen, SVP of Telenor Group; Ma Hongbing, GM of Science & Technology Innovation Department of China Unicom; Dr. Bi Qi, Chief Expert of China Telecom; Dr. Bai Gang, VP of ZTE; Hu Junjie, GM of Wireline Marketing of ZTE; Juan David Rodriguez, CTO of America Movil Peru S.A.C; Dr. Rizal Akbar, VP of Telkom Indonesia; Tanapong Ittisakulchai, CEBO of AIS; and Ovens Andrew John, Chief Director of Global Service of ZTE Europe.

Xu Ziyang, CEO of ZTE, delivered a welcome speech for the forum, said: “We are now facing the greatest digital wave ever, which will bring changes we have never seen before, and with these changes will come opportunities. To seize these opportunities, innovation will be crucial. That’s why we named this session ‘Shaping Digital Innovation’. The digital innovation essentially brings multiple benefits in terms of three aspects. First, it fundamentally boosts the development of the ICT industry, extends the boundaries of capacity, and safeguards sustainability. Second, it creates new values for verticals. By unleashing the power of digital innovation, we can drive massive increases in both efficiency and profitability. Third, it can unlock infinite possibilities beyond our imagination. With the continuous evolution of digital technologies, the real and digital worlds will converge and evolve faster, and finally reshape our entire society. ZTE remains open and committed to ensuring benefits for our customers and partners, and aims to build a digital and intelligent ecosystem for shared success.”

During the session of “Future Trends and Opportunities”, a number of guest speakers delivered keynote speeches on the trending insights of 2023 and future business development strategies, including George Held, Chief of Staff of VEON Group; Vikram Sinha, President Director and CEO of Indosat Ooredoo Hutchison; Peter Jarich, Head of GSMA Intelligence; Ni Fei, SVP of ZTE; Spas Velinov, CTO of Yettel Bulgaria EAD; and Dr. Terje Jensen, SVP of Telenor Group.

With the irreversible trend of digital transformation, the increasing demand for traffic and computing power cannot be ignored. The overarching trend of green development worldwide is imminent. Therefore, responding to the trends of times, exploring the new opportunities of growing digital intelligence, riding the waves of global technological and industrial evolution have become key enablers for enterprises clinching long-term victory.

During the session of “Unleashing New Value”, Ma Hongbing, GM of Science & Technology Innovation Department of China Unicom; Dr. Bi Qi, Chief Expert of China Telecom; Dr. Bai Gang, VP of ZTE; Hu Junjie, GM of Wireline Marketing of ZTE; Juan David Rodriguez, CTO of America Movil Peru S.A.C; Dr. Rizal Akbar, VP of Telkom Indonesia; Tanapong Ittisakulchai, CEBO of AIS; and Ovens Andrew John, Chief Director of Global Service of ZTE Europe, delivered keynote speeches on 5G Growing, Brightening a New Optical Era, Intelligent New Operation and Maintenance, Digital Twin, and other technical fields.

As a digital native company, ZTE has been cooperating extensively with global partners in digital infrastructure construction and digital industry development, promoting digital intelligence and low-carbonization for industries with innovative ICT technologies. ZTE will always stick to the business philosophy of “Simplicity, Agility, and Openness for Win-Win”, and is committed to serving as the “Driver of Digital Economy” to shape digital innovation.

MEDIA INQUIRIES:

ZTE Corporation
Communications
Email: ZTE.press.release@zte.com.cn

SequoiaDB is Shortlisted for the IDC Innovator List and Rated as a Distributed Database Innovator

GUANGZHOU, China, Feb. 25, 2023 /PRNewswire/ — In 2022, IDC issued the IDC Innovator Innovative Enterprise Award to non-enterprise customer groups (solution providers) for the first time. SequoiaDB won this award for its innovative application of the “lake-house integration” distributed database in the financial field.

SequoiaDB is Shortlisted for the IDC Innovator List and Rated as a Distributed Database Innovator

IDC Innovator introduces emerging IT suppliers with innovative technologies and breakthrough business models through research on IT buyers such as CIO-level executives, investment institutions, IT department or business line professionals. The report judges from multiple dimensions, such as the company’s industry background, product concept, product features, and market performance, and selects innovative manufacturers with outstanding comprehensive performance in this market field.

SequoiaDB was founded in 2012. Over the past 10 years, it has been focusing on the use of distributed databases R&D to solve Big-Data business. By deepening the needs of the financial and banking industry, it has developed from “multi-model data lake” and “real-time data lake” to “lake-house integrated architecture”.

SequoiaDB shortlisted IDC Innovator this time mainly due to the unique positioning and value of product applications. With the deepening development of digitalization in all walks of life, SequoiaDB believes that the financial and banking industry not only needs a business-oriented “transaction core” that manages single result data, but also needs to build a “Data-Core” that is oriented to the full amount of data generated during business “Transaction-Core”.

The “Data-Core” oriented to the value of the full amount of data is not to compete with the traditional “Transaction-Core” database, but to solve the problem that the traditional transaction core database cannot manage through the “integrated lake-house” technical architecture based on the native distributed database Comprehensive requirements for massive data and multi-modal data processing, thus forming effective synergy with traditional “transaction core” databases. SequoiaDB serves the full amount of data of the enterprise. As the infrastructure of the “Data-Core” of the enterprise, it provides enterprises with real-time access to the full amount of cross-business data and decision-making basis based on unified data sources to realize the continuous release of data value.

Up to now, SequoiaDB has been used by more than 100 financial bank customers on a large scale, covering state-owned banks, joint-stock banks, provincial rural credit cards, city commercial banks, insurance, securities and other financial customers, and the cumulative number of corporate users exceeds 1,000. The largest operating cluster in the system that has been officially put into production, with a data volume of 1.4 trillion rows, a capacity of 3PB, and a scale of more than 400 servers. The customer who has been stably producing and running the Sequoia database for the longest time has been as long as 8 years. Compared with Hadoop-based big data solutions, SequoiaDB not only provides complete SQL capabilities, but also fully supports ACID, and provides an integrated fusion processing platform for structured, semi-structured, and unstructured data through the integrated architecture of lakes and warehouses. data value”.

Media Contact: 
Lee Jia Jia  
Emial: lijiajia@sequoiadb.com

Cision View original content to download multimedia:https://www.prnewswire.com/news-releases/sequoiadb-is-shortlisted-for-the-idc-innovator-list-and-rated-as-a-distributed-database-innovator-301755965.html

The 6th Guangzhou Award Now Open for Application

GUANGZHOU, China, Feb. 24, 2023 /PRNewswire/ — On February 23, the launch ceremony of the 6th Guangzhou International Award for Urban Innovation (Guangzhou Award) was held in Barcelona, Spain during the 2023 United Cities and Local Governments (UCLG) Retreat and Campus. At the meeting, UCLG, World Association of the Major Metropolises (Metropolis) and Guangzhou City jointly announced the call for submissions of the 6th Guangzhou Award. Mr. Deng Changxiong, Deputy Director of the Office of Foreign Affairs Commission of the Guangzhou Municipal Committee, Ms. Emilia Saiz, Secretary General of UCLG, and Mr. Jordi Vaquer, Secretary General of Metropolis, attended the meeting and delivered speeches.


Mr. Deng read out a congratulatory message from the Chinese People’s Association for Friendship with Foreign Countries (CPAFFC) in his speech. “The CPAFFC is willing to work with the governments of all cities to support the UCLG and the Metropolis to play a greater role, and continues to make good use of international platforms such as the Global Mayors’ Forum and the Guangzhou Award to create opportunities for cooperation and development among global cities.” 

Ms. Emilia Saiz, and Mr. Jordi Vaquer highly appreciated the achievements and contributions made by Guangzhou in actively promoting international exchange and cooperation among cities and fostering the innovative development of global cities, and expressed their continued unwavering support for the development of Guangzhou Award.

Co-sponsored by the City of Guangzhou, the UCLG and the Metropolis, the Guangzhou Award aims to recognize innovation in improving social, economic, and environmental sustainability and good urban governance in cities and regions and, in doing so, to advance the prosperity and quality of life of their citizens. So far, five cycles have been held, attracting over 1,300 initiatives worldwide. It has become a global platform for city-to-city learning and the documentation, dissemination, and analysis of the local implementation of global agendas including SDGs and the New Urban Agenda (NUA).

The 6th Guangzhou Award is now calling for participation from all cities and local governments around the world with ongoing or recently completed initiatives, including those that are implemented in collaboration with private and civil society partners. Please learn more about the detailed guidelines on: http://www.guangzhouaward.org/The6thGuangzhouAward?lang=en

Vipshop Reports Unaudited Fourth Quarter and Full Year 2022 Financial Results

Conference Call to Be Held at 7:30 A.M. U.S. Eastern Time on February 23, 2023

GUANGZHOU, China, Feb. 23, 2023 /PRNewswire/ — Vipshop Holdings Limited (NYSE: VIPS), a leading online discount retailer for brands in China (“Vipshop” or the “Company”), today announced its unaudited financial results for the quarter and full year ended December 31, 2022.

Fourth Quarter and Full Year 2022 Highlights

  • Total net revenues for the fourth quarter of 2022 were RMB31.8 billion (US$4.6 billion), as compared with RMB34.1 billion in the prior year period. Total net revenues for the full year of 2022 were RMB103.2 billion (US$15.0 billion), as compared with RMB117.1 billion in the prior year.
  • GMV[1] for the fourth quarter of 2022 was RMB54.4 billion, as compared with RMB57.0 billion in the prior year period. GMV for the full year of 2022 was RMB175.2 billion, as compared with RMB191.5 billion in the prior year.
  • Gross profit for the fourth quarter of 2022 increased by 2.8% year over year to RMB6.9 billion (US$1.0 billion) from RMB6.7 billion in the prior year period. Gross profit for the full year of 2022 was RMB21.6 billion (US$3.1 billion), as compared with RMB23.1 billion in the prior year.
  • Net income attributable to Vipshop’s shareholders for the fourth quarter of 2022 increased by 57.9% year over year to RMB2.2 billion (US$323.9 million) from RMB1.4 billion in the prior year period. Net income attributable to Vipshop’s shareholders for the full year of 2022 increased by 34.6% year over year to RMB6.3 billion (US$913.2 million) from RMB4.7 billion in the prior year.
  • Non-GAAP net income attributable to Vipshop’s shareholders[2] for the fourth quarter of 2022 increased by 23.9% year over year to RMB2.2 billion (US$323.5 million) from RMB1.8 billion in the prior year period. Non-GAAP net income attributable to Vipshop’s shareholders for the full year of 2022 increased by 13.7% year over year to RMB6.8 billion (US$991.3 million) from RMB6.0 billion in the prior year.
  • The number of active customers[3] for the fourth quarter of 2022 was 47.7 million, as compared with 49.2 million in the prior year period. The number of active customers for the full year of 2022 was 84.8 million, as compared with 93.9 million in the prior year.
  • Total orders[4] for the fourth quarter of 2022 increased to 218.5 million from 216.9 million in the prior year period. Total orders for the full year of 2022 were 739.5 million, as compared with 786.6 million in the prior year.

Mr. Eric Shen, Chairman and Chief Executive Officer of Vipshop, stated, “We had another quarter of strong earnings to finish off an extremely challenging year. Our business fundamentals are now stronger with the capabilities that we have built in merchandising, operations, and technologies in the past year. We have gained momentum with brand partners, securing a consistent flow of quality merchandise at exceptional values to our platform. We have won loyalty from customers, growing the high-value customer base all year long. And we have stepped up efforts in sustainability that benefits all stakeholders. Our sharp execution in 2022 gives us confidence as we look ahead for the post-pandemic opportunities. We believe that we are now in a healthier position than before to achieve both growth and profitability.”

Mr. David Cui, Chief Financial Officer of Vipshop, further commented, “We are pleased to deliver the most profitable quarter in the past two years as we continued with topline recovery. For the full year, we achieved record-high net income with solid margin expansion through consistent efforts to optimize operating efficiency. In addition, we remain committed to delivering value to our shareholders, with a total of US$952 million of ADSs repurchased under our share buyback programs throughout 2022. Looking ahead into 2023, we are confident about regaining growth while sustaining healthy profitability.”  

Fourth Quarter 2022 Financial Results

REVENUES

Total net revenues for the fourth quarter of 2022 were RMB31.8 billion (US$4.6 billion), as compared with RMB34.1 billion in the prior year period, primarily attributable to short-term disruptions on economic activities from the surge of COVID-19 infections nationwide.

GROSS PROFIT

Gross profit for the fourth quarter of 2022 increased by 2.8% year over year to RMB6.9 billion (US$1.0 billion) from RMB6.7 billion in the prior year period. Gross margin for the fourth quarter of 2022 increased to 21.7% from 19.7% in the prior year period.

OPERATING EXPENSES

Total operating expenses for the fourth quarter of 2022 decreased by 6.5% year over year to RMB4.6 billion (US$673.9 million) from RMB5.0 billion in the prior year period. As a percentage of total net revenues, total operating expenses for the fourth quarter of 2022 was 14.6%, which stayed flat as compared with the prior year period.

  • Fulfillment expenses for the fourth quarter of 2022 were RMB2.2 billion (US$312.8 million), which largely stayed flat as compared with the prior year period. As a percentage of total net revenues, fulfillment expenses for the fourth quarter of 2022 was 6.8%, as compared with 6.4% in the prior year period.
  • Marketing expenses for the fourth quarter of 2022 decreased by 17.6% year over year to RMB944.1 million (US$136.9 million) from RMB1.1 billion in the prior year period. As a percentage of total net revenues, marketing expenses for the fourth quarter of 2022 decreased to 3.0% from 3.4% in the prior year period, primarily attributable to more prudent marketing strategy.
  • Technology and content expenses for the fourth quarter of 2022 decreased by 7.8% year over year to RMB408.5 million (US$59.2 million) from RMB443.0 million in the prior year period. As a percentage of total net revenues, technology and content expenses for the fourth quarter of 2022 was 1.3%, which stayed flat as compared with the prior year period.
  • General and administrative expenses for the fourth quarter of 2022 decreased by 5.2% year over year to RMB1.1 billion (US$165.0 million), as compared with RMB1.2 billion in the prior year period. As a percentage of total net revenues, general and administrative expenses for the fourth quarter of 2022 was 3.6%, as compared with 3.5% in the prior year period.

INCOME FROM OPERATIONS

Income from operations for the fourth quarter of 2022 increased by 37.1% year over year to RMB2.5 billion (US$363.8 million), as compared with RMB1.8 billion in the prior year period. Operating margin for the fourth quarter of 2022 increased to 7.9% from 5.4% in the prior year period.

Non-GAAP income from operations[5] for the fourth quarter of 2022, which excluded share-based compensation expenses and amortization of intangible assets resulting from business acquisitions, increased by 33.6% year over year to RMB2.8 billion (US$402.2 million) from RMB2.1 billion in the prior year period. Non-GAAP operating income margin[6] for the fourth quarter of 2022 increased to 8.7% from 6.1% in the prior year period.

NET INCOME

Net income attributable to Vipshop’s shareholders for the fourth quarter of 2022 increased by 57.9% year over year to RMB2.2 billion (US$323.9 million) from RMB1.4 billion in the prior year period. Net margin attributable to Vipshop’s shareholders for the fourth quarter of 2022 increased to 7.0% from 4.1% in the prior year period. Net income attributable to Vipshop’s shareholders per diluted ADS[7] for the fourth quarter of 2022 increased to RMB3.66 (US$0.53) from RMB2.07 in the prior year period.

Non-GAAP net income attributable to Vipshop’s shareholders for the fourth quarter of 2022, which excluded (i) share-based compensation expenses, (ii) impairment loss of investments, (iii) investment loss (gain) and revaluation of investments excluding dividends, (iv) reconciling items on the share of equity method investments, (v) amortization of intangible assets resulting from business acquisitions, and (vi) tax effects on non-GAAP adjustments, increased by 23.9% year over year to RMB2.2 billion (US$323.5 million) from RMB1.8 billion in the prior year period. Non-GAAP net margin attributable to Vipshop’s shareholders[8] for the fourth quarter of 2022 increased to 7.0% from 5.3% in the prior year period. Non-GAAP net income attributable to Vipshop’s shareholders per diluted ADS[9] for the fourth quarter of 2022 increased to RMB3.65 (US$0.53) from RMB2.64 in the prior year period.

For the quarter ended December 31, 2022, the Company’s weighted average number of ADSs used in computing diluted income per ADS was 610,448,180.

BALANCE SHEET AND CASH FLOW

As of December 31, 2022, the Company had cash and cash equivalents and restricted cash of RMB23.1 billion (US$3.3 billion) and short term investments of RMB1.6 billion (US$231.4 million).

For the quarter ended December 31, 2022, net cash generated from operating activities was RMB6.5 billion (US$946.1 million), and free cash flow[10], a non-GAAP measurement of liquidity, was as follows:

For the three months ended

Dec 31, 2021


Dec 31, 2022


Dec 31, 2022


RMB’000 

RMB’000 

US$’000

Net cash generated from operating activities

6,873,191

6,525,597

946,123

Reconciling items:

   Net impact from Internet financing activities[11]

(4,926)

243,833

35,352

   Capital expenditures

(1,204,433)

(587,100)

(85,121)

Free cash inflow

5,663,832

6,182,330

896,354

Full Year 2022 Financial Results

Total net revenues for the full year of 2022 were RMB103.2 billion (US$15.0 billion), as compared with RMB117.1 billion in the prior year.

Gross profit for the full year of 2022 was RMB21.6 billion (US$3.1 billion), as compared with RMB23.1 billion in the prior year. Gross margin for the full year of 2022 increased to 21.0% from 19.7% in the prior year.

Income from operations for the full year of 2022 increased by 11.0% year over year to RMB6.2 billion (US$898.5 million) from RMB5.6 billion in the prior year. Operating margin for the full year increased to 6.0% from 4.8% in the prior year.

Non-GAAP income from operations for the full year of 2022, which excluded share-based compensation expenses and amortization of intangible assets resulting from business acquisitions, increased by 12.1% year over year to RMB7.4 billion (US$1.1 billion) from RMB6.6 billion in the prior year. Non-GAAP operating income margin for the full year of 2022 increased to 7.2% from 5.6% in the prior year.

Net income attributable to Vipshop’s shareholders for the full year of 2022 increased by 34.6% year over year to RMB6.3 billion (US$913.2 million) from RMB4.7 billion in the prior year. Net margin attributable to Vipshop’s shareholders for the full year of 2022 increased to 6.1% from 4.0% in the prior year. Net income attributable to Vipshop’s shareholders per diluted ADS for the full year of 2022 increased to RMB9.83 (US$1.43) from RMB6.75 in the prior year.

Non-GAAP net income attributable to Vipshop’s shareholders for the full year of 2022, which excluded (i) share-based compensation expenses, (ii) impairment loss of investments, (iii) investment loss(gain) and revaluation of investments excluding dividends, (iv) reconciling items on the share of equity method investments, (v) amortization of intangible assets resulting from business acquisitions, and (vi) tax effects on non-GAAP adjustments, increased by 13.7% year over year to RMB6.8 billion (US$991.3 million) from RMB6.0 billion in the prior year. Non-GAAP net margin attributable to Vipshop’s shareholders for the full year of 2022 increased to 6.6% from 5.1% in the prior year. Non-GAAP net income attributable to Vipshop’s shareholders per diluted ADS for the full year of 2022 increased to RMB10.67(US$1.55) from RMB8.67 in the prior year.

For the full year of 2022, the Company’s weighted average number of ADSs used in computing diluted earnings per ADS was 640,786,520.

For the full year of 2022, net cash generated from operating activities was RMB10.5 billion (US$1.5 billion), and free cash flow, a non-GAAP measurement of liquidity, was as follows:

For the trailing twelve months ended

Dec 31, 2021


Dec 31, 2022


Dec 31, 2022


RMB’000 

RMB’000 

US$’000 

Net cash generated from operating activities

6,744,644

10,519,692

1,525,212

Reconciling items:

   Net impact from Internet financing activities[11]

(89,546)

408,550

59,234

   Capital expenditures

(3,578,645)

(3,102,589)

(449,833)

Free cash inflow

3,076,453

7,825,653

1,134,613

Share Repurchase Program

During the quarter ended December 31, 2022, the Company repurchased US$317.9 million of its ADSs under its current US$1 billion share repurchase program, which is effective through March 2024. As of December 31, 2022, the Company has an un-utilized amount of US$247.5 million under this program.

Business Outlook

For the first quarter of 2023, the Company expects its total net revenues to be between RMB25.2 billion and RMB26.5 billion, representing a year-over-year increase of approximately 0% to 5%. These forecasts reflect the Company’s current and preliminary view on the market and operational conditions, which is subject to change.

Exchange Rate

The Company’s business is primarily conducted in China and the significant majority of revenues generated are denominated in Renminbi. This announcement contains currency conversions of Renminbi amounts into U.S. dollars solely for the convenience of the reader. Unless otherwise noted, all translations from Renminbi to U.S. dollars are made at a rate of RMB6.8972 to US$1.00, the effective noon buying rate on December 30, 2022 as set forth in the H.10 statistical release of the Federal Reserve Board. No representation is made that the Renminbi amounts could have been, or could be, converted, realized or settled into U.S. dollars at that rate on December 30, 2022, or at any other rate.

Conference Call Information

The Company will hold a conference call on Thursday, February 23, 2023 at 7:30 am U.S. Eastern Time, 8:30 pm Beijing Time to discuss the financial results.

All participants wishing to join the conference call must pre-register online using the link provided below.

Registration Link: https://register.vevent.com/register/BI6984a3247975465ba30e29f8757ef611

Once pre-registration has been completed, each participant will receive dial-in numbers and a unique access PIN via email. To join the conference, participants should use the dial-in details followed by the PIN code.

A live webcast of the earnings conference call can be accessed at https://edge.media-server.com/mmc/p/wo4ejch9. An archived webcast will be available at the Company’s investor relations website at http://ir.vip.com.

About Vipshop Holdings Limited

Vipshop Holdings Limited is a leading online discount retailer for brands in China. Vipshop offers high quality and popular branded products to consumers throughout China at a significant discount to retail prices. Since it was founded in August 2008, the Company has rapidly built a sizeable and growing base of customers and brand partners. For more information, please visit https://ir.vip.com/.

Safe Harbor Statement

This announcement contains forward-looking statements. These statements are made under the “safe harbor” provisions of the U.S. Private Securities Litigation Reform Act of 1995. These forward-looking statements can be identified by terminology such as “will,” “expects,” “anticipates,” “future,” “intends,” “plans,” “believes,” “estimates” and similar statements. Among other things, the business outlook and quotations from management in this announcement, as well as Vipshop’s strategic and operational plans, contain forward-looking statements. Vipshop may also make written or oral forward-looking statements in its periodic reports to the U.S. Securities and Exchange Commission (the “SEC”), in its annual report to shareholders, in press releases and other written materials and in oral statements made by its officers, directors or employees to third parties. Statements that are not historical facts, including statements about Vipshop’s beliefs and expectations, are forward-looking statements. Forward-looking statements involve inherent risks and uncertainties. A number of factors could cause actual results to differ materially from those contained in any forward-looking statement, including but not limited to the following: Vipshop’s goals and strategies; Vipshop’s future business development, results of operations and financial condition; the expected growth of the online discount retail market in China; Vipshop’s ability to attract customers and brand partners and further enhance its brand recognition; Vipshop’s expectations regarding needs for and market acceptance of flash sales products and services; competition in the discount retail industry; the potential impact of the COVID-19 to Vipshop’s business operations and the economy in China and elsewhere generally; fluctuations in general economic and business conditions in China and assumptions underlying or related to any of the foregoing. Further information regarding these and other risks is included in Vipshop’s filings with the SEC. All information provided in this press release is as of the date of this press release, and Vipshop does not undertake any obligation to update any forward-looking statement, except as required under applicable law.

Use of Non-GAAP Financial Measures

The condensed consolidated financial information is derived from the Company’s unaudited interim condensed consolidated financial statements prepared in conformity with accounting principles generally accepted in the United States of America (“U.S. GAAP”), except that comparative consolidated statements of income and cash flows for the period presented and detailed footnote disclosures required by Accounting Standards Codification 270, Interim Reporting (“ASC270”), have been omitted. Vipshop uses non-GAAP net income attributable to Vipshop’s shareholders, non-GAAP net income attributable to Vipshop’s shareholders per diluted ADS, non-GAAP income from operations, non-GAAP operating income margin, non-GAAP net margin attributable to Vipshop’s shareholders, and free cash flow, each of which is a non-GAAP financial measure. Non-GAAP net income attributable to Vipshop’s shareholders is net income attributable to Vipshop’s shareholders excluding (i) share-based compensation expenses, (ii) impairment loss of investments, (iii) investment loss (gain) and revaluation of investments excluding dividends, (iv) reconciling items on the share of equity method investments, (v) amortization of intangible assets resulting from business acquisitions,and (vi) tax effects on non-GAAP adjustments. Non-GAAP net income attributable to Vipshop’s shareholders per diluted ADS is computed using non-GAAP net income attributable to Vipshop’s shareholders divided by weighted average number of diluted ADS outstanding for computing diluted earnings per ADS. Non-GAAP income from operations is income from operations excluding share-based compensation expenses and amortization of intangible assets resulting from business acquisitions. Non-GAAP operating income margin is non-GAAP income from operations as a percentage of total net revenues. Non-GAAP net margin attributable to Vipshop’s shareholders is non-GAAP net income attributable to Vipshop’s shareholders as a percentage of total net revenues. Free cash flow is net cash from operating activities adding back the impact from internet financing activities and less capital expenditures, which include purchase and deposits of property and equipment and land use rights. Impact from internet financing activities added back or deducted from free cash flow contains changes in the balances of financial products, which are primarily consumer financing and supplier financing that the Company provides to customers and suppliers. The Company believes that separate analysis and exclusion of the non-cash impact of (i) share-based compensation, (ii) impairment loss of investments, (iii) investment loss (gain) and revaluation of investments excluding dividends, (iv) reconciling items on the share of equity method investments, (v) amortization of intangible assets resulting from business acquisitions,and (vi) tax effects on non-GAAP adjustments add clarity to the constituent parts of its performance. The Company reviews these non-GAAP financial measures together with GAAP financial measures to obtain a better understanding of its operating performance. It uses these non-GAAP financial measures for planning, forecasting and measuring results against the forecast. The Company believes that non-GAAP financial measures are useful supplemental information for investors and analysts to assess its operating performance without the effect of (i) share-based compensation expenses, (ii) impairment loss of investments, (iii) investment loss (gain) and revaluation of investments excluding dividends, (iv) reconciling items on the share of equity method investments, (v) amortization of intangible assets resulting from business acquisitions, and (vi) tax effects on non-GAAP adjustments. Free cash flow enables the Company to assess liquidity and cash flow, taking into account the impact from internet financing activities and the financial resources needed for the expansion of fulfillment infrastructure, technology platform and Shan Shan Outlets. Share-based compensation expenses have been and will continue to be significant recurring expenses in its business. However, the use of non-GAAP financial measures has material limitations as an analytical tool. One of the limitations of using non-GAAP financial measures is that they do not include all items that impact the Company’s net income for the period. In addition, because non-GAAP financial measures are not measured in the same manner by all companies, they may not be comparable to other similar titled measures used by other companies. One of the key limitations of free cash flow is that it does not represent the residual cash flow available for discretionary expenditures.

The presentation of these non-GAAP financial measures is not intended to be considered in isolation from, or as a substitute for, the financial information prepared and presented in accordance with U.S. GAAP. For more information on these non-GAAP financial measures, please see the table captioned “Vipshop Holdings Limited Reconciliations of GAAP and Non-GAAP Results” at the end of this release.

Investor Relations Contact

Tel: +86 (20) 2233-0732
Email: IR@vipshop.com

[1] “Gross merchandise value (GMV)” is defined as the total Renminbi value of all products and services sold through the Company’s online sales business, online marketplace platform, Shan Shan Outlets, and other offline stores during the relevant period, including through the Company’s websites and mobile apps, third-party websites and mobile apps, Shan Shan Outlets, and other offline stores, which were fulfilled by either the Company or its third-party merchants, regardless of whether or not the goods were delivered or returned. GMV includes shipping charges paid by buyers to sellers. For prudent considerations, the Company does not consider products or services to be sold if the relevant orders were placed and canceled pre-shipment and only included orders that left the Company’s or other third-party vendors’ warehouses. 

[2] Non-GAAP net income attributable to Vipshop’s shareholders is a non-GAAP financial measure, which is defined as net income attributable to Vipshop’s shareholders excluding (i) share-based compensation expenses, (ii) impairment loss of investments, (iii) investment loss (gain) and revaluation of investments excluding dividends, (iv) reconciling items on the share of equity method investments, (v) amortization of intangible assets resulting from business acquisitions, and (vi) tax effects on non-GAAP adjustments.

[3] “Active customers” is defined as registered members who have purchased from the Company’s online sales business or the Company’s online marketplace platforms at least once during the relevant period.

[4] “Total orders” is defined as the total number of orders placed during the relevant period, including the orders for products and services sold through the Company’s online sales business and the Company’s online marketplace platforms (excluding, for the avoidance of doubt, orders from the Company’s offline stores and outlets), net of orders returned.

[5] Non-GAAP income from operations is a non-GAAP financial measure, which is defined as income from operations excluding share-based compensation expenses and amortization of intangible assets resulting from business acquisitions.

[6] Non-GAAP operating income margin is a non-GAAP financial measure, which is defined as non-GAAP income from operations as a percentage of total net revenues.

[7] “ADS” means American depositary share, each of which represents 0.2 Class A ordinary share.

[8] Non-GAAP net margin attributable to Vipshop’s shareholders is a non-GAAP financial measure, which is defined as non-GAAP net income attributable to Vipshop’s shareholders, as a percentage of total net revenues.

[9] Non-GAAP net income attributable to Vipshop’s shareholders per diluted ADS is a non-GAAP financial measure, which is defined as non-GAAP net income attributable to Vipshop’s shareholders, divided by the weighted average number of diluted ADS outstanding for computing diluted earnings per ADS.

[10] Free cash flow is a non-GAAP financial measure, which is defined as net cash from operating activities adding back the impact from Internet financing activities and less capital expenditures, which include purchase and deposits of property and equipment and land use rights.

[11] Net impact from Internet financing activities represents net cash flow relating to the Company’s financial products, which are primarily consumer financing and supplier financing that the Company provides to its customers and suppliers.

 Vipshop Holdings Limited 

 Unaudited Condensed Consolidated Statements of Income and Comprehensive Income  

 (In thousands, except for share and per share data) 

Three Months Ended

 Twelve Months Ended 

 Dec 31,2021 

Dec 31,2022

Dec 31,2022

 Dec 31,2021 

 Dec 31,2022 

 Dec 31,2022 

RMB’000

RMB’000

USD’000 

RMB’000

RMB’000

USD’000

Product revenues 

32,276,319

29,914,304

4,337,166

111,256,902

97,250,078

14,099,936

Other revenues (1)

1,855,354

1,843,456

267,276

5,802,776

5,902,411

855,769

 Total net revenues 

34,131,673

31,757,760

4,604,442

117,059,678

103,152,489

14,955,705

 Cost of revenues 

(27,418,277)

(24,857,565)

(3,604,008)

(93,953,121)

(81,536,409)

(11,821,668)

 Gross profit 

6,713,396

6,900,195

1,000,434

23,106,557

21,616,080

3,134,037

 Operating expenses: 

 Fulfillment expenses (2) 

(2,183,570)

(2,157,586)

(312,821)

(7,652,504)

(7,247,210)

(1,050,747)

 Marketing expenses 

(1,145,834)

(944,051)

(136,875)

(5,089,213)

(2,831,316)

(410,502)

 Technology and content expenses 

(443,011)

(408,543)

(59,233)

(1,517,307)

(1,605,422)

(232,764)

 General and administrative expenses 

(1,200,449)

(1,137,858)

(164,974)

(4,189,690)

(4,459,518)

(646,569)

 Total operating expenses 

(4,972,864)

(4,648,038)

(673,903)

(18,448,714)

(16,143,466)

(2,340,582)

 Other operating income 

89,183

257,062

37,270

924,579

724,832

105,091

 Income from operations 

1,829,715

2,509,219

363,801

5,582,422

6,197,446

898,546

 Investment gain and revaluation of investments 

92,232

257,064

37,271

85,685

546,031

79,167

 Impairment loss of investments 

(217,046)

(34,347)

(4,980)

(414,780)

(93,904)

(13,615)

 Interest expense 

(4,899)

(4,311)

(625)

(14,461)

(24,258)

(3,517)

 Interest income 

194,870

198,255

28,744

671,461

764,018

110,772

 Exchange (loss) gain 

(34,451)

160,542

23,276

(37,052)

687,871

99,732

 Income before income tax expense and share of  (loss) income of equity method investees 

1,860,421

3,086,422

447,487

5,873,275

8,077,204

1,171,085

 Income tax expenses

(390,691)

(903,839)

(131,044)

(1,222,704)

(1,758,810)

(255,003)

 Share of (loss) income of equity method investees 

(47,023)

59,176

8,580

42,303

(6,559)

(951)

 Net income 

1,422,707

2,241,759

325,023

4,692,874

6,311,835

915,131

Net income attributable to non-controlling interests

(7,938)

(7,998)

(1,160)

(11,801)

(13,019)

(1,888)

 Net income attributable to Vipshop’s shareholders 

1,414,769

2,233,761

323,863

4,681,073

6,298,816

913,243

 Shares used in calculating earnings per share (3): 

 Weighted average number of Class A and Class B ordinary shares: 

 —Basic 

135,695,489

121,010,371

121,010,371

136,175,112

127,235,048

127,235,048

 —Diluted 

136,631,560

122,089,636

122,089,636

138,745,022

128,157,304

128,157,304

 Net earnings per Class A and Class B ordinary share 

 Net income attributable to Vipshop’s shareholders——Basic 

10.43

18.46

2.68

34.38

49.51

7.18

 Net income attributable to Vipshop’s shareholders——Diluted 

10.35

18.30

2.65

33.74

49.15

7.13

 Net earnings per ADS (1 ordinary share equals to 5 ADSs) 

 Net income attributable to Vipshop’s shareholders——Basic 

2.09

3.69

0.54

6.88

9.90

1.44

 Net income attributable to Vipshop’s shareholders——Diluted 

2.07

3.66

0.53

6.75

9.83

1.43

(1) Other revenues primarily consist of product promotion and online advertising revenues, lease income mainly earned from the Shan
Shan Outlets ,fees charged to third-party merchants which the Company provides platform access for sales of their products, revenue from
third-party logistics services, loan facilitation service income and membership fee income.

(1) Other revenues primarily consist of product promotion
and online advertising revenues, lease income mainly
earned from the Shan Shan Outlets ,fees charged to third-
party merchants which the Company provides platform
access for sales of their products, revenue from third-party
logistics services, loan facilitation service income and
membership fee income.

 (2) Fulfillment expenses include shipping and handling expenses, which amounted RMB1.5 billion and RMB 1.5 billion in the three month
periods ended December 31,2021 and December 31,2022, respectively. 

 (2) Fulfillment expenses include shipping and handling
expenses, which amounted RMB5.2 billion and RMB 5.1
billion in the twelve month periods ended December
31,2021 and December 31,2022, respectively. 

(3) Authorized share capital is re-classified and re-designated into Class A ordinary shares and Class B ordinary shares, with each Class A
ordinary share being entitled to one vote and each Class B ordinary share being entitled to ten votes on all matters that are subject to
shareholder vote.

(3) Authorized share capital is re-classified and re-
designated into Class A ordinary shares and Class B
ordinary shares, with each Class A ordinary share being
entitled to one vote and each Class B ordinary share being
entitled to ten votes on all matters that are subject to
shareholder vote.

Three Months Ended

Twelve Months Ended 

 Dec 31,2021 

Dec 31,2022

Dec 31,2022

 Dec 31,2021 

 Dec 31,2022 

 Dec 31,2022 

 RMB’000 

 RMB’000 

 USD’000 

 RMB’000 

 RMB’000 

 USD’000 

 Share-based compensation expenses are included in the operating
expenses as follows: 

 Fulfillment expenses 

18,867

16,913

2,452

88,985

74,063

10,738

 Marketing expenses 

2,571

4,489

651

26,834

14,630

2,121

 Technology and content expenses 

59,809

52,588

7,625

252,730

242,714

35,190

 General and administrative expenses 

165,469

191,191

27,720

641,464

876,174

127,033

 Total 

246,716

265,181

38,448

1,010,013

1,207,581

175,082

 Vipshop Holdings Limited

 Unaudited Condensed Consolidated Balance Sheets

 (In thousands, except for share and per share data) 

 Dec 31,2021 

Dec 31,2022

Dec 31,2022

RMB’000

 RMB’000 

 USD’000 

ASSETS

CURRENT ASSETS

Cash and cash equivalents

16,297,410

21,938,653

3,180,806

Restricted cash 

873,859

1,164,748

168,873

Short term investments

5,381,618

1,595,904

231,384

Accounts receivable, net

459,128

567,730

82,313

Amounts due from related parties,net

637,825

670,187

97,168

Other receivables and prepayments,net

2,326,866

2,280,449

330,634

Loan receivables,net

131

882

128

Inventories

6,865,108

5,515,880

799,727

Total current assets

32,841,945

33,734,433

4,891,033

NON-CURRENT ASSETS

Property and equipment, net

14,376,712

16,225,589

2,352,489

Deposits for property and equipment

382,121

296,717

43,020

Land use rights, net

6,612,165

7,638,506

1,107,479

Intangible assets, net

320,943

336,599

48,802

Investment in equity method investees

2,476,868

2,162,872

313,587

Other investments

2,482,911

2,660,305

385,709

Other long-term assets

296,366

91,762

13,304

Goodwill

589,165

755,213

109,496

Deferred tax assets, net

760,023

681,770

98,847

Operating lease right-of-use assets

1,148,322

891,744

129,291

Total non-current assets

29,445,596

31,741,077

4,602,024

TOTAL ASSETS

62,287,541

65,475,510

9,493,057

 LIABILTIES AND  EQUITY  

 CURRENT LIABILITIES 

 Short term loans 

1,975,184

2,687,438

389,642

 Accounts payable 

13,144,935

15,018,138

2,177,425

 Advance from customers  

1,828,781

1,737,424

251,903

 Accrued expenses and other current liabilities  

7,658,677

8,394,742

1,217,121

 Amounts due to related parties  

429,088

151,736

22,000

 Deferred income  

449,693

400,207

58,025

 Operating lease liabilities 

284,659

136,435

19,781

Total current liabilities

25,771,017

28,526,120

4,135,897

 NON-CURRENT LIABILITIES 

Deferred tax liability 

437,202

573,734

83,184

Deferred income-non current 

1,026,155

1,469,685

213,084

 Operating lease liabilities 

952,813

832,928

120,763

 Other long term liabilities  

272,038

Total non-current liabilities

2,688,208

2,876,347

417,031

TOTAL LIABILITIES

28,459,225

31,402,467

4,552,928

EQUITY:

Class A ordinary shares (US$0.0001 par value, 483,489,642 shares
authorized,122,975,885 and 124,060,090 shares issued, of which
120,232,895 and 101,621,330 shares were outstanding as of December
31,2021 and December 31,2022, respectively) 

80

80

12

Class B ordinary shares (US$0.0001 par value, 16,510,358 shares
authorized, and 15,560,358 and 15,560,358 shares issued and outstanding
as of December 31, 2021 and December 31,2022, respectively) 

11

11

2

Treasury shares,at cost(2,742,990 and 22,438,760 Class A shares as of
December 31, 2021 and December 31,2022, respectively )

(1,927,719)

(8,352,511)

(1,211,000)

Additional paid-in capital

12,227,637

13,091,781

1,898,130

Retained earnings

22,421,488

28,720,304

4,164,053

Accumulated other comprehensive loss

(88,599)

(707,628)

(102,596)

Non-controlling interests

1,195,418

1,321,006

191,528

Total shareholders’ equity

33,828,316

34,073,043

4,940,129

TOTAL LIABILITIES AND SHAREHOLDERS’ EQUITY 

62,287,541

65,475,510

9,493,057

 Vipshop Holdings Limited

 Reconciliations of GAAP and Non-GAAP Results

Three Months Ended

Twelve Months Ended

 Dec 31,2021 

 Dec 31,2022 

 Dec 31,2022 

 Dec 31,2021 

 Dec 31,2022 

 Dec 31,2022 

 RMB’000 

 RMB’000 

 USD’000 

 RMB’000 

 RMB’000 

 USD’000 

 Income from operations 

1,829,715

2,509,219

363,801

5,582,422

6,197,446

898,545

 Share-based compensation expenses 

246,716

265,181

38,448

1,010,013

1,207,581

175,082

 Amortization of intangible assets resulting from business acquisitions  

11,792.00

 Non-GAAP income from operations 

2,076,431

2,774,400

402,249

6,604,227

7,405,027

1,073,627

 Net income attributable to Vipshop’s shareholders 

1,414,769

2,233,761

323,863

4,681,073

6,298,816

913,243

 Share-based compensation expenses 

246,716

265,181

38,448

1,010,013

1,207,581

175,082

 Impairment loss of investments 

217,046

34,347

4,980

414,780

93,904

13,615

 Investment loss (gain) and revaluation of investments excluding dividends 

984

(257,064)

(37,271)

116,567

(533,826)

(77,397)

 Reconciling items on the share of equity method investments(4) 

(77,608)

(46,430)

(6,732)

(120,621)

2,965

430

 Amortization of intangible assets resulting from business acquisitions  

11,792

0

 Tax effects on non-GAAP adjustments 

(1,029)

1,270

184

(101,925)

(232,532)

(33,714)

 Non-GAAP net income attributable to Vipshop’s shareholders 

1,800,878

2,231,065

323,472

6,011,679

6,836,908

991,259

(4) To exclude the GAAP to non-GAAP reconciling items relating to investment loss (gain) and revaluation of investments on the share of
equity method investments.

 Shares used in calculating earnings per share: 

 Weighted average number of Class A and Class B ordinary shares: 

 —Basic 

135,695,489

121,010,371

121,010,371

136,175,112

127,235,048

127,235,048

 —Diluted 

136,631,560

122,089,636

122,089,636

138,745,022

128,157,304

128,157,304

 Non-GAAP net income per Class A and Class B ordinary share 

 Non-GAAP net income attributable to Vipshop’s shareholders——Basic 

13.27

18.44

2.67

44.15

53.73

7.79

 Non-GAAP net income attributable to Vipshop’s shareholders——Diluted 

13.18

18.27

2.65

43.33

53.35

7.74

 Non-GAAP net income per ADS (1 ordinary share equal to 5 ADSs) 

 Non-GAAP net income attributable to Vipshop’s shareholders——Basic 

2.65

3.69

0.53

8.83

10.75

1.56

 Non-GAAP net income attributable to Vipshop’s shareholders——Diluted 

2.64

3.65

0.53

8.67

10.67

1.55

Cision View original content:https://www.prnewswire.com/news-releases/vipshop-reports-unaudited-fourth-quarter-and-full-year-2022-financial-results-301754108.html

TuanChe Limited Announces Receipt of Minimum Bid Price Notice From Nasdaq

BEIJING, Feb. 22, 2023 /PRNewswire/ — TuanChe Limited (“TuanChe” or the “Company”) (NASDAQ: TC), a leading integrated automotive marketplace in China, today announced that it received a notification letter dated February 17, 2023 (the “Deficiency Letter”) from the Listing Qualifications Department of The Nasdaq Stock Market Inc. (the “Nasdaq”), indicating that the Company is no longer in compliance with the minimum bid price requirement set forth in Rule 5550(a)(2) of the Nasdaq Listing Rules as the Company’s closing bid price per American depositary share (“ADS”), each representing sixteen Class A ordinary shares, par value US$0.0001 per share, of the Company, has been below US$1.00 for a period of 30 consecutive business days. The Deficiency Letter does not result in the immediate delisting of the Company’s securities.

Pursuant to Rule 5810(c)(3)(A) of the Nasdaq Listing Rules, the Company has a compliance period of 180 calendar days, or until August 16, 2023 (the “Compliance Period”), to regain compliance with Nasdaq’s minimum bid price requirement. If at any time during the Compliance Period, the closing bid price per ADS is at least US$1.00 for a minimum of 10 consecutive business days, Nasdaq will provide the Company a written confirmation of compliance and the matter will be closed.

In the event that the Company does not regain compliance by August 16, 2023, subject to the determination by the staff of Nasdaq, it may be eligible for an additional 180 calendar days compliance period if it meets the continued listing requirements for market value of publicly held shares and all other initial listing standards, with the exception of bid price requirement, of the Nasdaq Capital Market, and provides written notice to Nasdaq of its intention to cure the deficiency.

The Company intends to monitor the closing bid price of its ADSs between now and August 16, 2023 and is considering its options, including an adjustment of its ADS-to-Class A ordinary share ratio, to regain compliance with the minimum bid price requirement under the Nasdaq Listing Rules. The Company is currently in compliance with all other Nasdaq continued listing standards. The Deficiency Letter does not affect the Company’s business operations, its U.S. Securities and Exchange Commission reporting requirements or contractual obligations.

About TuanChe

Founded in 2010, TuanChe Limited (NASDAQ: TC) is a leading integrated automotive marketplace in China. TuanChe offers services to connect automotive consumers with various industry players such as automakers, dealers and other automotive service providers. TuanChe provides automotive marketing and transaction related services by integrating its online platforms with offline sales events. Through its integrated marketing solutions, TuanChe turns individual and isolated automobile purchase transactions into large-scale collective purchase activities by creating an interactive many-to-many environment. Furthermore, leveraging its proprietary data analytics and advanced digital marketing system, TuanChe’s online marketing service platform helps industry customers increase the efficiency and effectiveness of their advertising placements.

For more information, please contact ir@tuanche.com.

Safe Harbor Statement

This announcement contains forward-looking statements within the meaning of Section 21E of the Securities Exchange Act of 1934, as amended, and as defined in the U.S. Private Securities Litigation Reform Act of 1995. These forward-looking statements include, without limitation, the Company’s business plans and development and business outlook, which can be identified by terminology such as “may,” “will,” “expect,” “anticipate,” “aim,” “estimate,” “intend,” “plan,” “believe,” “potential,” “continue,” “is/are likely to” or other similar expressions. Such statements are based upon management’s current expectations and current market and operating conditions, and relate to events that involve known or unknown risks, uncertainties and other factors, all of which are difficult to predict and many of which are beyond the Company’s control. Further information regarding these and other risks, uncertainties or factors is included in the Company’s filings with the U.S. Securities and Exchange Commission. The Company does not undertake any obligation to update any forward-looking statement as a result of new information, future events or otherwise, except as required under law.

For investor and media inquiries, please contact:
TuanChe Limited
Investor Relations
Tel: +86 (10) 6397-6232
Email: ir@tuanche.com

The Piacente Group, Inc.
Brandi Piacente
Tel: +1 (212) 481-2050
Email: tuanche@tpg-ir.com

Cision View original content:https://www.prnewswire.com/news-releases/tuanche-limited-announces-receipt-of-minimum-bid-price-notice-from-nasdaq-301751449.html

YouLianCloud Officially Accesses Baidu ERNIE Bot, Driving the Development of Financial AIGC

SHANGHAI, Feb. 21, 2023 /PRNewswire/ — On February 14, 2023, YouLianCloud announced to be the first batch of early experience officers of ERNIE Bot. Subsequently, YouLianCloud will fully experience ERNIE Bot ‘s ability to use AI to drive intelligent financial content production and jointly promote smarter, better quality financial intelligence products and services.

Next, YouLianCloud will apply the results of Baidu’s leading intelligent dialogue technology in the field of financial AIGC. This move marks the priority of YouLianCloud to gain the support of leading AI technology, and also marks the first landing of conversational language modeling technology in domestic financial intelligence scenarios.

ERNIE Bot is a generative conversational product launched by Baidu based on Wenxin’s large model technology.

As the leading intelligent financial information engine in China, YouLianCloud takes ecological connection as the core, deeply cultivates the financial industry and AIGC, uses natural language processing, big data and knowledge graph technology, relies on intelligent creation, intelligent connection, intelligent opinion integration financial SaaS, and provides enterprises with intelligent applications for multiple scenarios such as sales, marketing, investment research, and risk control.

In 2020, with ecological connection as the core, YouLianCloud launched the intelligent financial information connection engine “YouLian Connection” to automate and intelligently connect the online communication mode in real time, safely and accurately, helping enterprises to realize cost reduction and efficiency increase. In 2021, YouLianCloud deeply researched the field of financial AI and cultivated rich insight into the needs of the financial sector. By combining natural language processing, Knowledge Graph and generative AI technology, YouLianCloud launched the intelligent financial information creation platform “YouLian AIGC”, which generates content in the form of intelligent financial information and intelligent financial videos to help enterprises develop intelligently.

At present, “ERNIE Bot” is making a sprint before going online. YouLianCloud has priority to internal testing with ERNIE Bot, and integrates ERNIE Bot’s technical capabilities. It will deepen cooperation with Baidu in various fields such as product development and standard formulation. With the assistance of Baidu’s technical team, YouLianCloud will continue to build diversified solutions for more financial scenarios. Through technology sharing, training empowerment, and joint marketing, YouLianCloud will strengthen its competitiveness, create more financial AI application solutions and services for users, and ultimately unlock new industrial opportunities and lead industrial transformation and upgrading.

Cision View original content:https://www.prnewswire.com/news-releases/youliancloud-officially-accesses-baidu-ernie-bot-driving-the-development-of-financial-aigc-301751343.html

Tencent Music Entertainment Group to Report Fourth Quarter and Full Year 2022 Financial Results on March 21, 2023 Eastern Time

SHENZHEN, China, Feb. 20, 2023 /PRNewswire/ — Tencent Music Entertainment Group (“TME”, or the “Company”) (NYSE: TME and HKEX: 1698), the leading online music and audio entertainment platform in China, today announced that it will report its unaudited financial results for the fourth quarter and full year of 2022 before the U.S. market opens on Tuesday, March 21, 2023.

TME’s management will host a Tencent Meeting Webinar on Tuesday, March 21, 2023, at 7:00 A.M. Eastern Time or 7:00 P.M. Beijing/Hong Kong Time on Tuesday, March 21, 2023, to review and discuss the Company’s business and financial performance.

For participants who wish to join the Tencent Meeting Webinar, please complete online registration in advance using the links provided below. Upon registration, each participant will receive an email with webinar access information, including meeting ID, meeting link, dial-in numbers, and a unique attendee ID to join the webinar.

Participant Online Registration 
Chinese Mainland1:    https://meeting.tencent.com/dw/jm2lKMZeeHs5
International:               https://voovmeeting.com/dw/jm2lKMZeeHs5

A live and archived webcast of the webinar will also be available at the Company’s investor relations website at https://ir.tencentmusic.com/.

1Chinese Mainland, for the purpose of this announcement only, excluding the Hong Kong Special Administrative Region, the Macao Special Administrative Region of the People’s Republic of China and Taiwan

About Tencent Music Entertainment

Tencent Music Entertainment Group (NYSE: TME and HKEX: 1698) is the leading online music and audio entertainment platform in China, operating the country’s highly popular and innovative music apps: QQ Music, Kugou Music, Kuwo Music and WeSing. TME’s mission is to create endless possibilities with music and technology. TME’s platform comprises online music, online audio, online karaoke, music-centric live streaming and online concert services, enabling music fans to discover, listen, sing, watch, perform and socialize around music. For more information, please visit ir.tencentmusic.com.

Investor Relations Contact
Tencent Music Entertainment Group
ir@tencentmusic.com
+86 (755) 8601-3388 ext. 818415

Cision View original content:https://www.prnewswire.com/news-releases/tencent-music-entertainment-group-to-report-fourth-quarter-and-full-year-2022-financial-results-on-march-21-2023-eastern-time-301749611.html

Gridex Protocol, the First Ever Fully On-Chain Order Book on Ethereum, Sponsors Europe’s Premier Blockchain Event

LONDON, Feb. 18, 2023 /PRNewswire/ — Gridex Protocol, a cutting-edge trading protocol on Ethereum mainnet and layer 2s that features a fully on-chain order book, was a proud sponsor of the European Blockchain Convention in Barcelona, that took place between February 15-17, 2023. As a diamond sponsor, Gridex Protocol made its European debut by participating in the event, which brought together over 3,000 attendees and more than 200 speakers. The event is the most influential blockchain and crypto event in Europe and features Web3 creators, builders, founders, CEOs, and investors, discussing a range of topics including blockchain, crypto, NFTs, DeFi, metaverse, and Web3.

On the second day of the event, Ali Al-Ali, co-founder and technical lead of Gridex, spoke to an audience of crypto industry leaders and enthusiasts about how a fully on-chain order book protocol is the key catalyst for DeFi mass adoption. 

With current mainstream DEXs being primarily based on Automated Market Maker (AMM) models, Gridex instead adapts order books – a model usually utilised in centralized exchanges (CEXs) – to be viable on-chain.

“While the AMM model brings convenience, it is more of a compromise to adapt to an on-chain environment, and there are issues such as impermanent loss on volatile pairs, high slippage and limited trading functionality. On the other hand, order books have a lot more trading functionality but require a lot of computation”, Ali said.

Gridex however, has achieved a historic breakthrough by reducing the resource consumption to as low as an AMM (and in some cases even lower). This has been made possible through our revolutionary Grid Maker Order Book Model, the first fully on-chain order book on Ethereum that determines the most suitable trade instantly. As well as this, maker orders allow traders to place orders of any size and price, without fear of slippage and no impermanent loss to worry about. With these features, we truly believe the Gridex Protocol is the pioneer for the future of trading, and we invite you all to try it.”

About Gridex

The Gridex Protocol is a permissionless and non-custodial order book trading protocol consisting of persistent, non-upgradable smart contracts on Ethereum. Its next step is the development of Gridex Proof of Stake (PoS), which will enable it to become a layer 0 cross-chain order book protocol that supports all mainstream layer 1s and generalized layer 2s, including Ethereum, Arbitrum, Optimism, Polygon… and Bitcoin. Gridex is devoted to offering an excellent user experience, driving decentralization and transparency throughout the DeFi market.

In conclusion, the European Blockchain Convention has provided a great platform for Gridex to share new ideas and connect with like-minded people. Gridex Protocol will officially launch in March 2023, with the Gridex PoS set to launch in Q1 2024.

For more information about Gridex please visit the links below:

Visit Our Website:
https://www.gdx.org/
Read our Whitepaper
https://www.gdx.org/gridex-whitepaper.pdf 
Join Our Discord
https://discord.gg/ta5dYcBaFz
Follow us on Twitter
https://twitter.com/gridexprotocol

Cision View original content to download multimedia:https://www.prnewswire.com/news-releases/gridex-protocol-the-first-ever-fully-on-chain-order-book-on-ethereum-sponsors-europes-premier-blockchain-event-301750370.html