Tag Archives: FIN

Markel hires Kelly Castriotta as Senior Director, Global Cyber Underwriting


RICHMOND, Virginia, Sept. 3, 2020 — Markel Corporation (NYSE: MKL) announced today that Kelly Castriotta, Esq., has joined the company as Senior Director, Global Cyber Underwriting.

In this new role, Castriotta will work closely with Markel’s cyber leaders to further strengthen cyber underwriting best practices and standards across all of the company’s insurance divisions. She will also be the lead underwriting project manager for Markel’s US non-affirmative cyber project and provide guidance on product development and enterprise risk management initiatives.

Before joining Markel, Castriotta served as head of cyber underwriting and product development for financial lines at Allianz, where she led non-affirmative cyber mapping and implementation in North America. She also previously held underwriting and claims positions with Arch Insurance and worked for CNA Insurance as a claims attorney.

"Kelly is a recognized thought leader for cyber insurance, and we’re excited to welcome her to Markel. She has more than a decade of experience spanning product innovation, underwriting management, in-house claims consulting, and coverage litigation," said Kara Owens, Managing Director, Global Cyber Underwriting Executive. "Kelly’s expertise will enhance our cyber underwriting capabilities, aid new product development across our divisions, and help to assist us in enterprise risk management."

Castriotta is a published author and frequent speaker at industry events. She recently received the Business Insurance 2020 Breakout Award which recognizes the next generation of insurance industry leaders.

Castriotta reports to Owens and is based out of Markel’s Chicago office.

About Markel
Markel is a diverse financial holding company serving a variety of niche markets. The Company’s principal business markets and underwrites specialty insurance products. In each of the Company’s businesses, it seeks to provide quality products and excellent customer service so that it can be a market leader. The financial goals of the Company are to earn consistent underwriting and operating profits and superior investment returns to build shareholder value. Visit Markel on the web at markel.com.

Logo – https://techent.tv/wp-content/uploads/2020/09/markel-hires-kelly-castriotta-as-senior-director-global-cyber-underwriting.jpg

Related Links :

http://www.markel.com

http://www.markelcorp.com

Arria NLG introduces Microsoft Excel add-in bringing dynamic, on demand natural language summaries and report automation to spreadsheets


New integration turns Excel data into contextual narratives reducing the time it takes to identify and communicate key insights

MORRISTOWN, New Jersey, Sept. 2, 2020 — Arria NLG today introduced Arria for Excel, a Microsoft Office add-in that brings natural language generation (NLG) functionality to any user of Microsoft Excel.

Arria brings the power of language to the most widely adopted business analytics tool! Arria for Excel gives you the ability to instantly narrate Excel spreadsheets, easily export directly to Word or PowerPoint, enjoy timely financial report automation and more!

Users worldwide rely on the robust functionality and intuitive design of Microsoft Excel to help them analyze and understand data. Arria’s add-in brings data understanding to the masses.

Arria for Excel adds natural-language summaries and report automation right within the worksheet, instantly turning volumes of data into insightful narratives. Users can tailor narratives to specific audiences, providing contextual commentary and explanatory analyses which are not only indistinguishable from those created by subject matter experts, but also created in seconds.

For enterprise professionals, Excel is entrenched as the most widely adopted business analytics tool and it is every analyst’s tried-and-true tool for decision and reporting support. Arria augments existing Excel workflows with:

  1. Consistency and accuracy. A next-generation report writer that dynamically automates data-driven financial summaries. Best practices are captured and maintained. Last-minute changes are no longer nerve-racking.
  2. Timeliness of reporting. Financial reports must be available in time to inform decision making. Therefore, financial reports can now be published as soon as possible after the end of the reporting period.
  3. Team sharing. With volumes of data changing at a pace like never before, insightful information delivery across the enterprise provides clarity and confidence in times of uncertainty.

If you’re like most people, the first time you use it, you’ll wonder how you ever got along without it.  It is simply a superb addition to the software, dramatically increasing productivity, efficiency and speed to decision-making.

"For data to have value, enterprises must be able to extract meaningful insights that lead to positive business outcomes," said Sharon Daniels, CEO, Arria NLG. "They need to reduce the time it takes to get to those insights, and take action."

Businesses that generate analysis and reports with basic tables and charts lacking advanced language analytics are competitively disadvantaged. Pairing Arria NLG technology with Excel eliminates these constraints by augmenting complex analysis with easy-to-digest narrative directly within worksheets.

In an ever-changing time, businesses and governments are turning to technology to simplify and operationalize what was previously complex and time consuming. Arria for Excel has the potential to drive the user experience of next-generation augmented analytics tools expanding the benefits to a wider audience.

For details, please visit: https://www.arria.com/excel/

About Arria NLG

Arria NLG is a form of artificial intelligence that transforms structured data into natural language. Through data analysis, knowledge automation, language generation and tailored information delivery, Arria software replicates the human process of expertly analyzing and communicating data insights. Arria dynamically turns data into written or spoken narrative at machine speed and on a massive scale by giving data the power of language.

The Arria NLG platform gives you the ability to take advantage of pre-built out-of-the-box apps—or, you can create and customize your own projects. Arria has a rapidly growing list of global clients and partners providing solutions across multiple industries including; banking, financial services, insurance, pharmaceutical, consumer product goods, news and media.

Media Contact: Jenn Mastrangelo
jennifer.mastrangelo@arria.com

SOURCE Arria NLG

Related Links

https://www.arria.com/excel/

Photo – https://mma.prnasia.com/media2/1246992/arria_nlg.jpg?p=medium600  
Logo – https://mma.prnasia.com/media2/1164169/Arria_NLG_Logo.jpg?p=medium600  

Related Links :

Home

Arria for Excel

Crypto.com Pay Now Powers CRO Payments From Any ERC-20 Wallet


Enables merchants to expand reach to 30 million + crypto wallets

HONG KONG, Aug. 29, 2020Crypto.com today announced that Crypto.com Pay — the company’s payment solution for online merchants — will now support CRO payments from any ERC-20 wallet. This evolution of Crypto.com Pay will help merchants expand their reach by giving customers more wallet options to spend CRO and increase transaction volume.


Crypto.com Pay Now Powers CRO Payments From Any ERC-20 Wallet.


There are an estimated 30 million+ ERC-20 wallets in use throughout the global crypto industry, representing a massive market for merchants seeking to attract crypto users. Today’s enhancement of Crypto.com Pay allows merchants to drive broad acceptance of payments from all ERC-20 wallets.

Kris Marszalek, Co-founder and CEO of Crypto.com said: "This marks an important milestone in CRO utility and a major step towards widespread adoption of CRO. Now, any user with an ERC-20 wallet can transact with Crypto.com Pay merchants. Those merchants will benefit from a large customer base using 30M+ ERC-20 wallets, regardless of which wallet customers choose to use."

Benoît Pellevoizin, VP of Marketing at Ledger, said: "As one of the most prominent crypto industry players. It is Ledger’s duty to stimulate crypto adoption for all comers. At Ledger we are convinced crypto mass adoption will be brought by new services enabling regular digital usage such as ecommerce payments. Ledger is very glad to partner with Crypto.com by supporting CRO tokens on Ledger Live. From now on, Ledger’s users will be able to pay in CRO ERC-20 tokens with Ledger Live on ecommerce websites supporting this new Crypto.com Pay feature."

Alen Salamun, CTO of BC Vault, said: "This is what blockchain is all about in the first place! It is always nice to see a company as Crypto.com provide more and more real-world use cases for their token (CRO). Since BC Vault hardware crypto wallet supports all ERC-20 tokens in existence with the launch on Crypto.com Pay system now BC Vault users are able to pay directly from within the BC Vault desktop application to any merchant supporting Crypto.com Pay on-chain payment. Our valued customers will also be able to pay for their BC Vault hardware crypto wallet in our online store using any existing ERC-20 wallet holding CRO tokens. Now you can even buy BC Vault with BC Vault!"

Steve Hipwell, Co-Founder and COO of Travala.com, said: "We are the world’s largest blockchain-based online travel company, which means it’s critical that we offer Travala.com users flexible payment options in crypto. By accepting CRO payment from any ERC-20 wallet, Crypto.com Pay opens up crypto payments to millions more wallets, making it easier to pay for bookings and bringing us one step closer to widespread crypto adoption."

Since launching in 2018, Crypto.com Pay has helped merchants such as Ledger, Coinzilla, as well as platforms such as WooCommerce and Oveit tap into the global cryptocurrency economy and accept crypto on their website. Crypto.com Pay features zero transaction fees and only 0.5% for settlements – an 80% saving on fees compared to typical payment processors – with low volatility and easy integration for merchants. Merchants interested in offering Crypto.com Pay to their customers can sign up here.

For users, all payments made in CRO are entitled to CRO cashback, known as Pay Rewards, which are collected in the user’s Crypto.com App. Until Sept 30th, 2020, customers paying with wallets other than Crypto.com App can also enjoy the 2X Pay Rewards privilege enjoyed by App users with 10,000 CRO staked in Exchange or with an active 3 Months Earn term, which is up to 10% of Pay Rewards. If the email provided by the customer does not belong to a Crypto.com App account, the Pay Rewards can still be able to be collected if the someone uses that email to sign up at Crypto.com App and verified within 90 days.

More details about Pay Rewards can be found here. For more details, please visit our FAQ page here (for merchants) and here (for retail customers).

About Crypto.com

Crypto.com was founded in 2016 on a simple belief: it’s a basic human right for everyone to control their money, data and identity. Crypto.com serves over 3 million customers today, providing them with a powerful alternative to traditional financial services through the Crypto.com App, the Crypto.com Card and the Crypto.com Exchange.

Crypto.com is built on a solid foundation of security, privacy and compliance and is the first cryptocurrency company in the world to have ISO/IEC 27701:2019, CCSS Level 3, ISO27001:2013 and PCI:DSS 3.2.1, Level 1 compliance. Crypto.com is headquartered in Hong Kong with a 500+ strong team. Find out more by visiting https://crypto.com

Photo – https://techent.tv/wp-content/uploads/2020/08/crypto-com-pay-now-powers-cro-payments-from-any-erc-20-wallet.jpg  
Logo – https://techent.tv/wp-content/uploads/2020/08/crypto-com-pay-now-powers-cro-payments-from-any-erc-20-wallet-2.jpg


Sungrow 1H 2020 Fiscal Report: Revenues up 55.57% Year-on-Year

HEFEI, China, Aug. 28, 2020 — Sungrow, the global leading inverter solution supplier for renewables, posted its 1H fiscal report in late August, showing a huge growth on revenue, underlining the solid financial result and strong competitiveness for the first half of 2020 despite the impact of the pandemic.

Specifically, the revenue increased by 55.57% year-on-year (YoY) to US$ 987.2 million in 1H 2020, while net income grew by 34.13% YoY to US$ 63.4 million, due to strong performance in Americas, Europe and China. Operational cash flow also improved by 85.41% per the statement.

Sungrow continues to lead the global market with a revenue of US$ 870.8 million in the PV segment, embracing a YoY increase of 48.49%. The energy storage segment meanwhile has enjoyed a staggering 49.66% YoY growth to US$ 35.6 million in revenues for 1H 2020.

The Company attributes the boost to strong performance to the continued efforts in pioneering technical innovations and expanding global footprints. Sungrow’s cumulative shipment reached 120 GW as of June this year and has more than 1000 deployments of its integrated energy storage solutions over the world. The agile local team can offer responsive technical support, sales and 24/7 after-sale service, which is essential for forging partnerships during COVID-19.

"As a pioneer, Sungrow keeps offering state-of-the-art products and solutions to meet diversified global market demand. The forecast for the second half of 2020 is optimistic as the global market heads to recover in a few months," said Prof. Cao Renxian, Chairman of Sungrow.

Prof. Cao also mentioned that Sungrow was once again ranked "100% bankable" by BloombergNEF as per the latest bankability survey, becoming the only inverter brand ranked "100% bankable" for two straight years.

About Sungrow

Sungrow Power Supply Co., Ltd ("Sungrow") is the world’s most bankable inverter brand with over 120 GW installed worldwide as of June 2020. Founded in 1997 by University Professor Cao Renxian, Sungrow is a leader in the research and development of solar inverters, with the largest dedicated R&D team in the industry and a broad product portfolio offering PV inverter solutions and energy storage systems for utility-scale, commercial, and residential applications, as well as internationally recognized floating PV plant solutions. With a strong 23-year track record in the PV space, Sungrow products power installations in over 120 countries, maintaining a worldwide market share of over 15%. Learn more about Sungrow by visiting www.sungrowpower.com.

Related Links :

http://www.sungrowpower.com

Delivery Robot Company Pudu Robotics raised Nearly $15 Million in Series B+ Financing, Led by Sequoia Capital China

SHENZHEN, China, Aug. 28, 2020 — On August 19, the indoor delivery robot company Pudu Robotics announced the completion of Series B+ round of nearly $15 Million led by Sequoia Capital China. Existing shareholders Meituan, Everwin Investment, QC Capital, and Chengbohan Fund all joined this round of financing. This is Pudu Robotics’s second round of financing in just two months. On July 1 this year, Pudu Robotics raised the Series B financing of more than $15 Million exclusively invested by Meituan. 

Pudu Robotics all series of products

Guo Shanshan, a partner of Sequoia Capital China, the lead investor in this round, said, "Robots are a new form of labor and are also the focus of our continued attention. Pudu has deep accumulation in the field of service robots. It started by providing delivery robots to the catering industry and has begun to expand to more diverse working scenarios. The demand of customers for this type of new labor is constantly growing, and we believe that service robots will soon become standard configuration in many industries."

Pudu Robotics is a global benchmark company in the field of delivery robots. Since its establishment in 2016, it has maintained rapid growth, and its products have been sold to more than 20 countries and regions around the world. Zhang Tao, CEO of Pudu, said that the funds from this Series B+ Financing would be mainly used to expand the market of the company’s delivery robot business, as well as its robot businesses in other scenarios.

Linhong Jiang
Phone: +86-400-0826-660
E-mail: business@pudutech.com  
https://www.pudutech.com/en

Photo – https://photos.prnasia.com/prnh/20200828/2902205-1?lang=0


Xinhua Silk Road: China’s Quanzhou rolls out multiple measures to optimize business environment

BEIJING, Aug. 28, 2020 — Quanzhou City, located in southeast China’s Fujian Province, has rolled out a series of measures to optimize business environment.

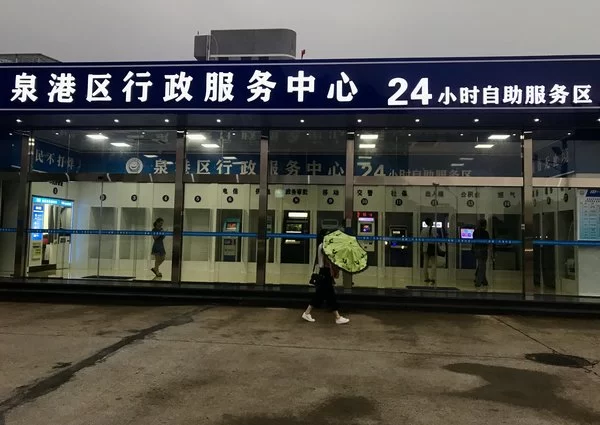
Self-service machines at the administration service center in Quangang District of Quanzhou City to provide 24-hour government services for the public ‭

Quanzhou has been committed to attracting investments. It strives to realize a great breakthrough in industrial investment attraction, with the expected investment amount on newly signed industrial chain projects exceeding 55 billion yuan

Since the beginning of this year, Quanzhou has made all-out efforts to help enterprises relieve difficulties. The city has tried to improve the mechanism to find out enterprises’ needs, established a group of foreign-related lawyers to provide services for enterprises, helped them coordinate the difficulties in employment, meals, materials, financing, sales, tax and fee handling, and issued risk warnings. The reimbursement of unemployment insurance and job stabilization subsidies have been raised from 50 percent to 100 percent.

In the meantime, Quanzhou has tried to optimize the enterprise-related policy implementation mechanism to benefit enterprises. As of the end of July, the city has reduced or exempted a total of 2.045 billion yuan worth of social insurance premiums, provided 4.914 billion yuan of re-lending funding support for 817 enterprises, and reimbursed 276.03 million yuan of unemployment insurance and job stabilization subsidies, which has benefited 2,814 enterprises.

Moreover, Quanzhou strives to improve government services by streamlining administrative approval process in a bid to achieve the goal of "one submission, parallel processing, time-limited settlement and unified delivery."

The municipal administration service center in Quanzhou has set up special offices for "market access, investment and construction, convenience services, and social and people’s livelihood" to provide "one-stop" services for enterprises and the general public.

Quanzhou has built a new model of "Internet + government services." The city has tried to optimize online administrative approval system and launched more than 200 self-service machines to provide 24-hour government services for the public.

See the original link: https://en.imsilkroad.com/p/315749.html

Photo – https://photos.prnasia.com/prnh/20200828/2901290-1?lang=0

OKEx’s Third Elite Trading Team Contest Concluded With a Historic $700M+ in Total Trading Volume


VALLETTA, Malta, Aug. 28, 2020 — OKEx (www.okex.com), a world-leading cryptocurrency spot and derivatives exchange, announced the successful conclusion of its third Elite Trading Team Contest. The month-long contest with a total prize pool of 150,000 USDT attracted record-breaking interest, with 8,082 participants forming 231 teams, including 3Commas, CoinCodex, Bitsgap, Gunbotmany and other well-known global trading platforms.

During the contest, the competing teams generated a historic $703,658,154 in notional trading volume, which is about seven times the total trading volume of OKEx’s previous Elite Trading Team Contest. The sotaytaichinh.vn team led by user Erik.Chu won the championship.

"We would like to congratulate all the teams and individuals who took part and achieved such outstanding results and thank them for using their amazing performance and sophisticated range of trading strategies on the OKEx platform," commented OKEx CEO Jay Hao. He continued: "We are very honored to have so many talented traders among our global user base as well as well-known platforms that choose to trade on OKEx, setting such an impressive yield record. We hope that this contest will become a platform for users to communicate and learn from each other, as well as a way for OKEx to give back to users. The bar is now certainly set very high for the next round."

The top 10 teams and top 50 individuals ranked by trading yield — as well as the 10 most popular captains — shared a prize pool of 150,000 USDT with individual rewards as high as 5,000 USDT and team payouts reaching 20,000 USDT.

This was the third Elite Trading Contest held by OKEx and a real indication of the growing popularity of both cryptocurrency trading and this type of event, in which individual traders and teams compete for high-stakes prize pools. According to previous data, the contest saw a significant increase in terms of both participants and transaction volume compared to the previous event, indicating that the reach and status of the OKEx Elite Trading Contest are constantly increasing.

About OKEx

A world-leading cryptocurrency spot and derivatives exchange, OKEx offers the most diverse marketplace where global crypto traders, miners and institutional investors come to manage crypto assets, enhance investment opportunities and hedge risks. We provide spot and derivatives trading — including futures, perpetual swap and options — of major cryptocurrencies, offering investors flexibility in formulating their strategies to maximize gains and mitigate risks.

Logo – https://photos.prnasia.com/prnh/20200526/2813046-1-LOGO?lang=0

Related Links :

https://www.okex.com/

ATIF Holdings Limited Regains Compliance with NASDAQ Listing Requirements

SHENZHEN, China, Aug. 28, 2020 — ATIF Holdings Limited (Nasdaq: ATIF, the "Company"), a company providing business consulting services and multimedia services in Asia, today announced that on August 26, 2020, it received a written notice (the "Notice") from the Listing Qualifications Department of The Nasdaq Stock Market ("Nasdaq") that the Company has regained compliance with the Nasdaq’s Listing Rules (the "Rules") regarding the annual meeting of shareholders requirement for continued listing on the Nasdaq Capital Market.

The Company was previously notified by Nasdaq on August 4, 2020 that it was not in compliance with the annual meeting requirement for continued listing on The Nasdaq Capital Market as a result of not having held an annual meeting of stockholders within 12 months of the end of the Company’s fiscal year on July 31, 2020. On August 13, 2020, the Company submitted to Nasdaq its intention to follow home country practice in accordance with Listing Rule 5615(a)(3) and in lieu of Nasdaq’s annual meeting requirement. Accordingly, the Company’s ordinary shares will continue to be listed on The Nasdaq Capital Market and Nasdaq considers the matter closed.

About ATIF Holdings Limited

Headquartered in Shenzhen, China, ATIF Holdings Limited ("ATIF") is a company providing business consulting services to small and medium-sized enterprises in Asia, including going public consulting services, international business planning and consulting services, and financial media services. ATIF has advised several enterprises in China in their plans to become publicly listed in the U.S. Through its majority-owned subsidiary, Leaping Group Co., Ltd., ATIF also provides multimedia services and is engaged in three major businesses, including multi-channel advertising, event planning and execution, film and TV program production and movie theater operations. ATIF operates the largest pre-movie advertising network in Heilongjiang Province and Liaoning Province of China and also provides advertising services in elevators and supermarkets. ATIF is often hired to plan both online and offline advertising campaigns and to produce related advertising material. In addition, ATIF invests in films and TV programs and distributes them in movie theaters or through online platforms. ATIF is also one of majority shareholders of AeroCentury Corp. (NYSE American: ACY) which is an independent global aircraft operating lessor and finance company specializing in leasing regional jet and turboprop aircraft and related engines to airlines and commercial users worldwide. For more information, please visit https://ir.atifchina.com/.

Forward-Looking Statements

Certain statements made in this release are "forward looking statements" within the meaning of the "safe harbor" provisions of the United States Private Securities Litigation Reform Act of 1995. When used in this press release, the words "estimates," "projected," "expects," "anticipates," "forecasts," "plans," "intends," "believes," "seeks," "may," "will," "should," "future," "propose" and variations of these words or similar expressions (or the negative versions of such words or expressions) are intended to identify forward-looking statements. These forward-looking statements are not guarantee of future performance, conditions or results, and involve a number of known and unknown risks, uncertainties, assumptions and other important factors, many of which are outside the Company’s control, that could cause actual results or outcomes to differ materially from those discussed in the forward-looking statements. Important factors, among others, are: future financial and operating results, including revenues, income, expenditures, cash balances and other financial items; ability to manage growth and expansion; current and future economic and political conditions; ability to compete in an industry with low barriers to entry; ability to continue to operate through our VIE structure; ability to obtain additional financing in the future to fund capital expenditures; ability to attract new clients and further enhance brand recognition; ability to hire and retain qualified management personnel and key employees; trends and competition in the financial consulting services industry; a pandemic or epidemic; and other factors listed in the Company’s annual report on Form 20-F and other documents filed with the Securities and Exchange Commission. The Company undertakes no obligation to update forward-looking statements to reflect subsequent occurring events or circumstances, or changes in its expectations, except as may be required by law. Although the Company believes that the expectations expressed in these forward-looking statements are reasonable, it cannot assure you that such expectations will turn out to be correct, and the Company cautions you that actual results may differ materially from the anticipated results expressed or implied by the forward-looking statements we make. You should not rely upon forward-looking statements as predictions of future events. Forward-looking statements represent our management’s beliefs and assumptions only as of the date such statements are made. These forward-looking statements are made as of the date of this news release.

For more information, please contact Investor Relations at:
EverGreen Consulting Inc.
Janice Wang
+86-13811768559
+1-908-510-2351
IR@changqingconsulting.com

Related Links :

http://ir.atifchina.com/

Yiren Digital Reports Second Quarter 2020 Financial Results

BEIJING, Aug. 28, 2020 — Yiren Digital Ltd. (NYSE: YRD) ("Yiren Digital" or the "Company"), a leading fintech company in China, today announced its unaudited financial results for the second quarter ended June 30, 2020.

Second Quarter 2020 Operational Highlights

Wealth Management—Yiren Wealth

  • Cumulative number of investors served reached 2,223,250 as of June 30, 2020, representing an increase of 0.2% from 2,218,181 as of March 31, 2020 and compared to 2,185,513 as of June 30, 2019.
  • Number of current investors was 195,211 as of June 30, 2020, representing a decrease of 11.5% from 220,568 as of March 31, 2020.
  • Number of current non-P2P investors was 31,530 as of June 30, 2020, representing an increase of 19.7% from 26,346 as of March 31, 2020, and compared to 17,133 as of June 30, 2019.
  • Total assets under administration ("AUA") for P2P products on Yiren Wealth was RMB 25,896.8 million (US$3,665.4 million) as of June 30, 2020, representing a decrease of 15.2% from RMB 30,536.4 million as of March 31, 2020, and compared to RMB 43,249.9 million as of June 30, 2019.
  • Total AUA for non-P2P products on Yiren Wealth was RMB 2,528.6 million (US$357.9 million) as of June 30, 2020, representing an increase of 47.6% from 1,713.1 million as of March 31, 2020,and compared to RMB 352.7 million as of June 30, 2019.
  • Sales volume of non-P2P products amounted to RMB 2,186.2 million (US$309.4 million) in the second quarter of 2020, representing an increase of 1.1% from RMB 2,163.3 million in the first quarter of 2020 and compared to RMB 284.8 million in the same period of 2019.

Consumer Credit—Yiren Credit

  • Total loan originations in the second quarter of 2020 reached RMB 2.4 billion (US$0.3 billion), representing an increase of 30.6% from RMB 1.8 billion in the first quarter of 2020 and compared to RMB 9.7 billion in the second quarter of 2019.
  • Cumulative number of borrowers served reached 4,917,635 as of June 30, 2020, representing an increase of 2.2% from 4,810,184 as of March 31, 2020 and compared to 4,491,334 as of June 30, 2019.
  • Number of borrowers served in the second quarter of 2020 was 107,568 representing a decrease of 6.8% from 115,420 in the first quarter of 2020 and compared to 135,246 in the second quarter of 2019.
  • The percentage of loan volume generated by repeat borrowers was 0.3% in the second quarter of 2020.
  • 25.0% of loan originations were generated online in the second quarter of 2020.
  • Total outstanding principal balance of performing loans reached RMB 33,454.4 million (US$4,735.2 million) as of June 30,2020, representing a decrease of 20.5% from RMB 42,063.0 million as of March 31,2020.

"With the pandemic still not far behind us and the changing market environment in the second quarter, we are making comprehensive progresses towards our business transition in our credit-tech business and have achieved meaningful scale in our wealth management business growth," said Mr. Ning Tang, Chairman and Chief Executive Officer of Yiren Digital.

"For our credit-tech business, our new online product initiatives are tracking very well. Our new revolving loan product, Yi Xiang Hua, accounted for 13% of our total loan volume this quarter, growing over 500% quarter over quarter. Meanwhile, by leveraging our vast offline service network coverage, we are ramping up auto loans nicely, achieving a 51% growth from last quarter. Moreover, we have made great strides in repositioning our credit business by moving from a P2P funding model to a loan facilitation model. In the second quarter, 63% of loans facilitated were funded by institutional intuitional partners and we expect this proportion to reach close to 100% by the end of this year with a diversified partner base."

"On wealth management business, we are seeing very strong growth momentum particularly for our fund products. As of June 30, 2020, the number of current non-P2P investors increased 20% from last quarter to 31,530, and total AUA for non-P2P products increased by 48% quarterly to RMB 2.5 billion. Moreover, average AUA per investor for non-P2P products also sees steady growth, with average AUA per investor for bank’s fixed-income products exceeding RMB 100,000 and for funds over RMB 50,000, which is well above industry average"

"We are delighted to see a notable acceleration in loan originations from prior quarter to RMB 2.4 billion, thanks to our strategic initiatives this year in diversification of our loan products," said Mr. Zhong Bi, Chief Financial Officer of Yiren Digital. "To provide relief to our borrowers who were significantly affected by the pandemic as well as medical workers who fought on the frontlines, we proactively granted a concession totaling RMB 245 million for over 50,000 borrowers in principal, interest and late fees, this represents a one-time hit to our revenue. On the balance sheet side, our cash position remains strong with approximately RMB 3.4 billion of cash and short-term investments as of June 30, 2020. "

"Thanks to our continued efforts in risk management, the delinquency rates have shown a progressive improving trend. 15-90 days delinquency has decreased to 5.5% as of June 30, 2020 from 8.9% as of March 31, 2020. 15-90 days delinquency further decreased to 5.2% as of July 31, 2020 as a result of our strengthened efforts in tightening controls and improving borrower’s credit quality." said Mr. Michael Ji, Chief Risk Officer of Yiren Digital. "To mitigate the risk caused by covid-19 and help customers went through the financial hardship, we have launched 7 relating special collection projects in the second quarter, including continued ‘pandemic customer care program’, which offered payment relief for the customers who were hit by covid-19 and healthcare givers who were fighting the disease. These special collection projects helped us achieve a decline in NCL by over 10% as compared with projection at the beginning of the year, even facing the economic headwind. We will continue to strengthen our risk management and expect delinquency rates to further improve in the second half of the year.

Second Quarter 2020 Financial Results

Total amount of loans facilitated in the second quarter of 2020 was RMB 2,402.5 million (US$340.1 million), compared to RMB 9,673.8 million in the same period last year. As of June 30, 2020, the total outstanding principal amount of the performing loans was RMB 33.5 billion (US$4.7 billion), decreased by 20% from RMB 42.1 billion as of March 31, 2020.

Total net revenue in the second quarter of 2020 was RMB 754.7 million (US$106.8 million), compared to RMB 2,216.6 million in the same period last year. Revenue from Yiren Credit reached RMB 432.3 million (US$61.2 million), representing a decrease of 73% from RMB 1,624.3 million in the second quarter of 2019. Revenue from Yiren Wealth reached RMB 322.4 million (US$45.6 million), representing a decrease of 46% from RMB 592.4 million in the second quarter of 2019.

Sales and marketing expenses in the second quarter of 2020 were RMB 508.5 million (US$72.0 million), compared to RMB 1,208.6 million in the same period last year. Sales and marketing expenses in the second quarter of 2020 accounted for 21.2% of the total amount of loans facilitated, as compared to 12.5% in the same period last year mainly due to the decline of loan volume.

Origination and servicing costs in the second quarter of 2020 were RMB 165.2 million (US$23.4 million), compared to RMB 162.9 million in the same period last year. Origination and servicing costs in the second quarter of 2020 accounted for 6.9% of the total amount of loans facilitated, compared to 1.7% in the same period last year due to the decline of loan volume.

General and administrative expenses in the second quarter of 2020 were RMB 172.6 million (US$24.4 million), compared to RMB 175.5 million in the same period last year. General and administrative expenses in the second quarter of 2020 accounted for 22.9% of the total net revenue, compared to 7.9% in the same period last year.

Allowance for contract assets and receivables in the second quarter of 2020 were RMB 168.7 million (US$23.9 million), compared to RMB 500.9 million in the same period last year.

Income tax benefit in the second quarter of 2020 was RMB 47.6 million (US$6.7 million).

Net loss in the second quarter of 2020 was RMB 232.2 million (US$32.9 million), compared to net income of RMB 154.5 million in the same period last year. 

Adjusted EBITDA (non-GAAP) in the second quarter of 2020 was net loss of RMB 269.4 million (US$38.1 million), compared to net income of RMB 239.9 million in the same period last year.

Basic income per ADS in the second quarter of 2020 was net loss of RMB 2.5 (US$0.4), compared to a basic income per ADS of RMB 1.7 in the same period last year.

Diluted income per ADS in the second quarter of 2020 was net loss of RMB 2.5 (US$0.4), compared to a diluted income per ADS of RMB 1.7 in the same period last year.

Net cash used in operating activities in the second quarter of 2020 was RMB 86.8 million (US$12.3 million), compared to net cash generated from operating activities of RMB 36.4 million in the same period last year.

Net cash used in investing activities in the second quarter of 2020 was RMB 164.6 million (US$23.3 million), compared to net cash provided by investing activities of RMB 240.9 million in the same period last year.

As of June 30, 2020, cash and cash equivalents was RMB 2,935.5 million (US$415.5 million), compared to RMB 3,195.0 million as of March 31, 2020. As of June 30, 2020, the balance of held-to-maturity investments was RMB 4.1 million (US$0.6 million), compared to RMB 4.4 million as of March 31, 2020. As of June 30, 2020, the balance of available-for-sale investments was RMB 513.0 million (US$72.6 million), compared to RMB 456.1 million as of March 31, 2020.

Delinquency rates. As of June 30, 2020, the delinquency rates for loans that are past due for 15-29 days, 30-59 days and 60-89 days were 1.4%, 2.0%, and 2.1%, respectively compared to1.6%, 4.1%, and 3.2%, as of March 31, 2020. 

Cumulative M3+ net chargeoff rates. As of June 30, 2020, the cumulative M3+ net charge-off rate for loans originated in 2017 was 16.7%, compared to 16.5% as of March 31, 2020. As of June 30, 2020, the cumulative M3+ net charge-off rate for loans originated in 2018 was 17.6%, compared to 15.8% as of March 31, 2020. As of June 30, 2020, the cumulative M3+ net charge-off rate for loans originated in 2019 was 9.4%, compared to 5.2% as of March 31, 2020.

Recent Development

Management Change

Mr. Zhong Bi has resigned from his position as the Company’s Chief Financial Officer ("CFO") to pursue other opportunities, effective on September 10, 2020. The board of directors of the Company has appointed Ms. Na Mei as the Company’s new CFO, effective on September 10, 2020. Over the past two months, Ms. Mei has been working with Mr. Bi on daily CFO duties to ensure a smooth transition.

Ms. Mei joined CreditEase Consumer Credit Division, now part of Yiren Digital, in 2015. She has served as the financial controller for this business unit and the head of business finance department. Prior to joining CreditEase, Ms. Mei had worked 12 years at PricewaterhouseCoopers. She brought in seasoned experience in finance management, taxation, internal control and consulting, along with years of first-hand exposure dealing with publicly listed companies in China and abroad. Ms. Mei obtained her bachelor’s degree from Capital Economic University and is a certified public accountant.

2020 Share Incentive Plan

Yiren Digital adopted a 2020 share incentive plan (the "2020 Plan") in the second quarter of 2020. The 2020 Plan has a ten-year term, and has a maximum number of 18,560,000 ordinary shares available for issuance pursuant to all awards under the 2020 Plan. Yiren Digital may grant restricted share units and other form of awards pursuant to the 2020 Plan. In connection with the adoption of the 2020 Plan and to prevent dilution to existing shareholders, CreditEase Holdings (Cayman) Limited, the parent company of Yiren Digital, will surrender for cancellation and for nil consideration 18,560,000 ordinary shares of US$0.0001 par value each standing in its name in the register of members of Yiren Digital.

Non-GAAP Financial Measures

In evaluating the business, the Company considers and uses several non-GAAP financial measures, such as adjusted EBITDA and adjusted EBITDA margin as supplemental measures to review and assess operating performance. We believe these non-GAAP measures provide useful information about our core operating results, enhance the overall understanding of our past performance and prospects and allow for greater visibility with respect to key metrics used by our management in our financial and operational decision-making. The presentation of these non-GAAP financial measures is not intended to be considered in isolation or as a substitute for the financial information prepared and presented in accordance with accounting principles generally accepted in the United States of America ("U.S. GAAP"). The non-GAAP financial measures have limitations as analytical tools. Other companies, including peer companies in the industry, may calculate these non-GAAP measures differently, which may reduce their usefulness as a comparative measure. The Company compensates for these limitations by reconciling the non-GAAP financial measures to the nearest U.S. GAAP performance measure, all of which should be considered when evaluating our performance. See "Operating Highlights and Reconciliation of GAAP to Non-GAAP measures" at the end of this press release.

Currency Conversion

This announcement contains currency conversions of certain RMB amounts into US$ at specified rates solely for the convenience of the reader. Unless otherwise noted, all translations from RMB to US$ are made at a rate of RMB 7.0651 to US$1.00, the effective noon buying rate on June 30, 2020, as set forth in the H.10 statistical release of the Federal Reserve Board.

Conference Call

Yiren Digital’s management will host an earnings conference call at 8:00 p.m. U.S. Eastern Time on August 27, 2020 (or 8:00 a.m. Beijing/Hong Kong Time on August 28, 2020).

Participants who wish to join the call should register online in advance of the conference at:

http://apac.directeventreg.com/registration/event/9992747

Please note the Conference ID number of 9992747.

Once registration is completed, participants will receive the dial-in information for the conference call, an event passcode, and a unique registrant ID number. 

Participants joining the conference call should dial-in at least 10 minutes before the scheduled start time.

A replay of the conference call may be accessed by phone at the following numbers until September 3, 2020:

International

+61 2-8199-0299

U.S.

+1 646-254-3697

Replay Access Code:

9992747

Additionally, a live and archived webcast of the conference call will be available at ir.yirendai.com.

Safe Harbor Statement

This press release contains forward-looking statements. These statements constitute "forward-looking" statements within the meaning of Section 21E of the Securities Exchange Act of 1934, as amended, and as defined in the U.S. Private Securities Litigation Reform Act of 1995. These forward-looking statements can be identified by terminology such as "will," "expects," "anticipates," "future," "intends," "plans," "believes," "estimates," "target," "confident" and similar statements. Such statements are based upon management’s current expectations and current market and operating conditions and relate to events that involve known or unknown risks, uncertainties and other factors, all of which are difficult to predict and many of which are beyond Yiren Digital’s control. Forward-looking statements involve risks, uncertainties, and other factors that could cause actual results to differ materially from those contained in any such statements. Potential risks and uncertainties include, but are not limited to, uncertainties as to Yiren Digital’s ability to attract and retain borrowers and investors on its marketplace, its ability to introduce new loan products and platform enhancements, its ability to compete effectively, PRC regulations and policies relating to the peer-to-peer lending service industry in China, general economic conditions in China, and Yiren Digital’s ability to meet the standards necessary to maintain listing of its ADSs on the NYSE or other stock exchange, including its ability to cure any non-compliance with the NYSE’s continued listing criteria. Further information regarding these and other risks, uncertainties or factors is included in Yiren Digital’s filings with the U.S. Securities and Exchange Commission. All information provided in this press release is as of the date of this press release, and Yiren Digital does not undertake any obligation to update any forward-looking statement as a result of new information, future events or otherwise, except as required under applicable law.

About Yiren Digital

Yiren Digital Ltd. (NYSE: YRD) is a leading fintech company in China, providing both credit and wealth management services. For its credit business, the Company provides an effective solution to address largely underserved investor and individual borrower demand in China through online and offline channels to efficiently match borrowers with investors and execute loan transactions. Yiren Digital deploys a proprietary risk management system, which enables the Company to effectively assess the creditworthiness of borrowers, appropriately price the risks associated with borrowers, and offer quality loan investment opportunities to investors. Yiren Digital’s marketplace provides borrowers with quick and convenient access to consumer credit at competitive prices and investors with easy and quick access to an alternative asset class with attractive returns. For its wealth management business, the Company targets China’s mass affluent population and strives to provide customized wealth management services, with a combination of long-term and short-term targets as well as different types of investments, ranging from cash and fixed-income assets, to funds and insurance. For more information, please visit ir.Yirendai.com.


Unaudited Condensed Consolidated Statements of Operations

 (in thousands, except for share, per share and per ADS data, and percentages)

For the Three Months Ended 

For the Six Months Ended 

June 30,
2019

March 31,
2020

June 30,
2020

June 30,
2020

June 30,
2019

June 30,
2020

June 30,
2020

RMB

RMB

RMB

USD

RMB

RMB

USD

Net revenue:

Loan facilitation services

1,237,718

358,541

171,084

24,215

2,292,764

529,625

74,964

Post-origination services

241,321

146,520

126,477

17,902

537,600

272,997

38,640

Account management services

549,024

413,166

300,720

42,564

1,037,364

713,886

101,044

Others

188,577

105,433

156,408

22,138

329,320

261,841

37,061

Total net revenue

2,216,640

1,023,660

754,689

106,819

4,197,048

1,778,349

251,709

Operating costs and expenses:

Sales and marketing

1,208,647

616,441

508,466

71,969

2,336,592

1,124,907

159,220

Origination and servicing

162,945

102,918

165,183

23,380

335,068

268,101

37,947

General and administrative

175,534

149,041

172,568

24,425

433,241

321,609

45,521

Allowance for contract assets and
receivables

500,861

143,385

168,708

23,879

691,965

312,093

44,174

Total operating costs and expenses

2,047,987

1,011,785

1,014,925

143,653

3,796,866

2,026,710

286,862

Other income/(expenses):

Interest income, net

25,213

25,116

16,950

2,399

49,088

42,066

5,954

Fair value adjustments related to
Consolidated ABFE

5,787

(26,020)

(32,957)

(4,665)

40,785

(58,977)

(8,348)

Others, net

17,480

12,184

(3,510)

(496)

177,703

8,674

1,228

Total other income/(expenses)

48,480

11,280

(19,517)

(2,762)

267,576

(8,237)

(1,166)

Income/(loss) before provision for
income taxes

217,133

23,155

(279,753)

(39,596)

667,758

(256,598)

(36,319)

Share of results of equity investees

(816)

(5,773)

Income tax expense/(benefit)

61,856

3,936

(47,558)

(6,731)

138,390

(43,622)

(6,174)

Net income/(loss)

154,461

19,219

(232,195)

(32,865)

523,595

(212,976)

(30,145)

Weighted average number of ordinary
shares outstanding, basic

184,608,337

185,600,961

185,613,735

185,613,735

184,865,964

185,607,348

185,607,348

Basic income/(loss) per share

0.8367

0.1036

(1.2510)

(0.1771)

2.8323

(1.1475)

(0.1624)

Basic income/(loss) per ADS

1.6734

0.2072

(2.5020)

(0.3542)

5.6646

(2.2950)

(0.3248)

Weighted average number of ordinary
shares outstanding, diluted

186,667,233

186,166,429

185,613,735

185,613,735

186,621,626

185,607,348

185,607,348

Diluted income/(loss) per share

0.8275

0.1032

(1.2510)

(0.1771)

2.8057

(1.1475)

(0.1624)

Diluted income/(loss) per ADS

1.6550

0.2064

(2.5020)

(0.3542)

5.6114

(2.2950)

(0.3248)

Unaudited Condensed Consolidated
Cash Flow Data

Net cash generated from/(used in)
operating activities

36,352

557,762

(86,768)

(12,281)

(622,083)

470,994

66,664

Net cash provided by/(used in)
investing activities

240,896

(524,479)

(164,623)

(23,302)

(9,035)

(689,102)

(97,537)

Net cash (used in)/provided by
financing activities

(73,385)

(65,637)

39,905

5,648

420,004

(25,732)

(3,642)

Effect of foreign exchange rate changes

1,532

1,206

(86)

(12)

(664)

1,120

159

Net increase/(decrease) in cash, cash
equivalents and restricted cash

205,395

(31,148)

(211,572)

(29,947)

(211,778)

(242,720)

(34,356)

Cash, cash equivalents and restricted
cash, beginning of period

2,617,311

3,269,142

3,237,994

458,308

3,034,484

3,269,142

462,717

Cash, cash equivalents and restricted
cash, end of period

2,822,706

3,237,994

3,026,422

428,361

2,822,706

3,026,422

428,361


Unaudited Condensed Consolidated Balance Sheets

 (in thousands)

As of

December 31,
2019

March 31,
2020

June 30,
2020

June 30,
2020

RMB

RMB

RMB

USD

        Cash and cash equivalents

3,198,086

3,194,993

2,935,543

415,498

        Restricted cash

71,056

43,001

90,879

12,863

        Accounts receivable

3,398

33,902

27,309

3,865

        Contract assets, net

2,398,685

1,873,548

1,356,886

192,055

        Contract cost

160,003

149,917

145,809

20,638

        Prepaid expenses and other assets

1,333,221

868,462

1,134,257

160,545

        Loans at fair value

418,492

313,267

246,475

34,886

        Financing receivables

29,612

33,381

54,876

7,767

        Amounts due from related parties

988,853

1,583,859

1,560,376

220,857

        Held-to-maturity investments

6,627

4,399

4,126

584

        Available-for-sale investments

460,991

456,061

513,013

72,612

        Property, equipment and software, net

195,855

188,880

184,957

26,179

        Deferred tax assets

45,407

42,084

49,051

6,943

        Right-of-use assets

334,134

291,028

224,067

31,715

Total assets

9,644,420

9,076,782

8,527,624

1,207,007

        Accounts payable

43,583

39,068

40,324

5,708

        Amounts due to related parties

106,645

112,034

184,325

26,090

        Liabilities from quality assurance program and guarantee

4,397

3,487

2,660

377

        Deferred revenue

358,203

254,933

190,712

26,994

        Accrued expenses and other liabilities

2,338,745

1,946,205

1,981,040

280,397

        Refund liability

1,801,535

1,760,942

1,501,318

212,497

        Deferred tax liabilities

218,888

216,304

162,016

22,932

        Lease liabilities

282,334

259,197

205,056

29,024

Total liabilities

5,154,330

4,592,170

4,267,451

604,019

        Ordinary shares

121

121

121

17

        Additional paid-in capital

5,038,691

5,045,268

5,050,226

714,813

        Treasury stock

(37,097)

(37,097)

(37,097)

(5,251)

        Accumulated other comprehensive income

21,855

18,671

23,474

3,323

        Accumulated deficit

(533,480)

(542,351)

(776,551)

(109,914)

Total equity

4,490,090

4,484,612

4,260,173

602,988

Total liabilities and equity

9,644,420

9,076,782

8,527,624

1,207,007


Operating Highlights and Reconciliation of GAAP to Non-GAAP Measures

(in thousands, except for number of  borrowers, number of investors and percentages)

For the Three Months Ended 

For the Six Months Ended 

June 30,
2019

March 31,
2020

June 30,
2020

June 30,
2020

June 30,
2019

June 30,
2020

June 30,
2020

RMB

RMB

RMB

USD

RMB

RMB

USD

Operating Highlights

Amount of p2p investment

11,939,582

5,203,747

4,017,751

568,676

23,375,170

9,221,497

1,305,218

Number of p2p investors

157,973

78,256

63,066

63,066

320,054

108,252

108,252

Amount of non-p2p investment

284,782

2,163,313

2,186,210

309,438

613,490

4,349,523

615,635

Number of non-p2p investors

10,235

18,809

30,392

30,392

19,370

39,443

39,443

Amount of loans facilitated

9,673,818

1,839,454

2,402,494

340,051

20,608,740

4,241,948

600,409

Number of borrowers

135,246

115,420

107,568

107,568

280,634

220,731

220,731

Remaining principal of performing
loans

58,071,303

42,063,039

33,454,423

4,735,166

58,071,303

33,454,423

4,735,166

Segment Information

Wealth management:

Revenue

592,378

415,876

322,381

45,630

1,113,812

738,257

104,493

Sales and marketing expenses

213,168

67,326

45,454

6,434

357,072

112,780

15,963

Consumer credit:

Revenue

1,624,262

607,784

432,308

61,189

3,083,236

1,040,092

147,216

Sales and marketing expenses

995,479

549,115

463,012

65,535

1,979,520

1,012,127

143,257

Reconciliation of Adjusted
EBITDA

Net income/(loss)

154,461

19,219

(232,195)

(32,865)

523,595

(212,976)

(30,145)

Interest income, net

(25,213)

(25,116)

(16,950)

(2,399)

(49,088)

(42,066)

(5,954)

Income tax expense/(benefit)

61,856

3,936

(47,558)

(6,731)

138,390

(43,622)

(6,174)

Depreciation and amortization

31,112

27,171

24,368

3,449

63,614

51,539

7,295

Share-based compensation

17,732

4,541

2,954

418

32,431

7,495

1,061

Adjusted EBITDA

239,948

29,751

(269,381)

(38,128)

708,942

(239,630)

(33,917)

Adjusted EBITDA margin

10.8%

2.9%

-35.7%

-35.7%

16.9%

-13.5%

-13.5%


Delinquency Rates

Delinquent for

15-29 days

30-59 days

60-89 days

All Loans

December 31, 2015

0.7%

1.2%

0.9%

December 31, 2016

0.6%

0.9%

0.8%

December 31, 2017

0.8%

1.0%

0.8%

December 31, 2018

1.0%

1.8%

1.7%

December 31, 2019

1.2%

2.0%

1.7%

March 31, 2020

1.6%

4.1%

3.2%

June 30, 2020

1.4%

2.0%

2.1%

Online Channels

December 31, 2015

0.5%

0.8%

0.6%

December 31, 2016

0.5%

0.9%

0.8%

December 31, 2017

1.1%

1.1%

0.9%

December 31, 2018

1.2%

2.3%

2.2%

December 31, 2019

1.6%

2.9%

2.5%

March 31, 2020

1.9%

5.2%

3.8%

June 30, 2020

1.4%

2.4%

2.7%

Offline Channels

December 31, 2015

0.7%

1.2%

1.0%

December 31, 2016

0.6%

0.9%

0.8%

December 31, 2017

0.6%

0.9%

0.7%

December 31, 2018

0.9%

1.6%

1.5%

December 31, 2019

1.0%

1.7%

1.5%

March 31, 2020

1.6%

3.7%

3.1%

June 30, 2020

1.4%

1.8%

2.0%


Net Charge-Off Rate

Loan
Issued
Period

Amount of Loans
Facilitated
During the Period

Accumulated M3+ Net Charge-
Off
as of June 30, 2020

Total Net Charge-Off
Rate
as of June 30, 2020

(in RMB thousands)

(in RMB thousands)

2015

53,143,029

4,441,696

8.4%

2016

53,805,112

5,057,850

9.4%

2017

69,883,293

11,693,408

16.7%

2018

63,176,149

11,131,294

17.6%

2019

39,103,048

3,688,712

9.4%

2020Q1

1,320,428

6,388

0.5%


M3+ Net Charge-Off Rate

Loan
Issued
Period

Month on Book

4

7

10

13

16

19

22

25

28

31

34

2015Q1

0.8%

2.0%

3.4%

4.7%

5.7%

6.5%

7.1%

7.5%

7.7%

7.8%

7.8%

2015Q2

0.8%

2.3%

3.8%

5.2%

6.4%

7.3%

7.9%

8.3%

8.5%

8.7%

8.8%

2015Q3

0.4%

1.6%

3.1%

4.4%

5.6%

6.5%

7.1%

7.6%

7.9%

8.1%

8.4%

2015Q4

0.4%

1.6%

3.1%

4.4%

5.5%

6.3%

6.9%

7.4%

7.9%

8.3%

8.5%

2016Q1

0.3%

1.2%

2.5%

3.6%

4.5%

5.2%

5.8%

6.4%

7.0%

7.4%

7.6%

2016Q2

0.4%

1.6%

3.1%

4.3%

5.2%

6.0%

6.8%

7.6%

8.1%

8.4%

8.7%

2016Q3

0.3%

1.6%

3.1%

4.3%

5.4%

6.6%

7.8%

8.6%

9.2%

9.5%

9.8%

2016Q4

0.2%

1.5%

2.9%

4.4%

5.9%

7.4%

8.4%

9.3%

10.0%

10.4%

10.7%

2017Q1

0.3%

1.5%

3.2%

5.1%

7.1%

8.6%

9.8%

10.8%

11.5%

12.0%

12.2%

2017Q2

1.1%

2.9%

5.6%

8.4%

10.4%

12.1%

13.5%

14.5%

15.3%

15.8%

16.0%

2017Q3

0.3%

2.9%

6.4%

9.1%

11.6%

13.6%

15.0%

16.2%

16.9%

17.5%

2017Q4

0.5%

3.9%

7.3%

10.5%

13.2%

15.3%

16.9%

18.0%

18.8%

2018Q1

0.4%

3.0%

6.6%

10.1%

12.9%

15.2%

16.9%

18.2%

2018Q2

0.5%

3.6%

7.4%

10.8%

13.6%

15.8%

17.7%

2018Q3

0.4%

3.0%

6.2%

9.1%

11.7%

13.9%

2018Q4

0.3%

2.5%

5.6%

8.6%

11.7%

2019Q1

0.2%

2.5%

5.6%

9.0%

2019Q2

0.3%

2.9%

6.9%

2019Q3

0.3%

3.4%

2019Q4

0.3%


Related Links :

http://ir.yirendai.com/

LAIX Inc. Announces Second Quarter 2020 Unaudited Financial Results

SHANGHAI, Aug. 27, 2020 — LAIX Inc. ("LAIX" or the "Company") (NYSE: LAIX), an artificial intelligence (AI) company in China that creates and delivers products and services to popularize English learning, today announced its unaudited financial results for the second quarter ended June 30, 2020.

Second Quarter 2020 Financial and Operating Highlights

  • Gross billings[1] for the second quarter of 2020 were RMB306.2 million (US$43.3 million), a 13.2% decrease from RMB352.7 million for the previous quarter and a 5.5% increase from RMB290.1 million for the same quarter last year.
  • Net revenues for the second quarter of 2020 were RMB269.4 million (US$38.1 million), an 18.0% increase from RMB228.3 million for the previous quarter and a 2.5% decrease from RMB276.4 million for the same quarter last year.
  • Gross margin for the second quarter of 2020 was 71.9%, compared with 65.5% for the previous quarter and 76.5% for the same quarter last year.
  • Sales and marketing expenses for the second quarter of 2020 were RMB200.7 million (US$28.4 million), a 24.2% decrease from RMB264.7 million for the previous quarter and an 8.7% decrease from RMB219.7 million for the same quarter last year.
  • Net loss for the second quarter of 2020 was RMB92.5 million (US$13.1 million), compared with RMB197.0 million for the previous quarter and RMB87.8 million for the same quarter last year.
  • Operating cash outflow for the second quarter of 2020 was RMB66.4 million (US$9.4 million), compared with RMB99.8 million for the previous quarter and RMB58.9 million for the same quarter last year.
  • Approximately 0.5 million paying users purchased the Company’s courses and services for the second quarter of 2020, compared with approximately 0.9 million paying users for the previous quarter and approximately 0.9 million paying users for the same quarter last year.
  • Total cumulative registered users were 185.6 million as of June 30, 2020, compared with 179.7 million total cumulative registered users as of March 31, 2020 and 138.8 million total cumulative registered users as of June 30, 2019.

[1] "Gross billings" for a certain period refer to the total amount of cash received from the sale of course packages in that period net of the total amount of cash refunds paid to users in the same period.

Management Comments

Dr. Yi Wang, Chairman and Chief Executive Officer of LAIX, commented, "We are pleased to see the net revenues for the second quarter of 2020 reach RMB269.4 million, an 18.0% increase from the previous quarter and exceeding the high end of our guidance range. Gross profit margin bounced back above 70%, and sales and marketing expenses as a percentage of net revenues declined to 74.5%, compared to 115.9% in the previous quarter. Consequently, net loss narrowed to RMB92.5 million, down 53.0% sequentially. Operating cash outflow also declined to RMB66.4 million in the second quarter of 2020, compared with RMB99.8 million in the first quarter of 2020. While the total number of unique paying users decreased sequentially as a result of both the fade-away of the unexpected increase in traffic due to the COVID-19 outburst in the first quarter as well as our stringent cost control in advertising and optimization of user acquisition costs, our gross billings per paying user improved by 50.6% quarter-over-quarter, demonstrating our success in migrating users into targeted courses with higher average selling prices. We believe there is room for further improvement in these metrics in the coming quarters.

"Our improving financial performance reflects our focus and priority on efficiently allocating resources, restructuring the product mix and streamlining our operations. Streamlining our operations involves optimizing the organizational structure, refining marketing channels and enhancing free learning content, in order to drive our company towards profitable growth in the long term. Looking ahead, we will continue to focus on product innovation and further refinement of our internal operations, together as our efforts to achieve a healthy and sustainable growth in the long term." concluded Dr. Wang.

Second Quarter 2020 Financial Results

Net Revenues

Net revenues for the second quarter of 2020 were RMB269.4 million (US$38.1 million), an 18.0% increase from RMB228.3 million for the previous quarter and a 2.5% decrease from RMB276.4 million for the same quarter last year. The quarter-over-quarter increase was primarily attributable to the upgrade of product mix, introducing additional courses and services with higher average selling prices.

Cost of Revenues

Cost of revenues for the second quarter of 2020 was RMB75.6 million (US$10.7 million), a 4.0% decrease from RMB78.8 million for the previous quarter and a 16.6% increase from RMB64.9 million for the same quarter last year. The quarter-over-quarter change was primarily due to decreases in salaries and benefit expenses.

Gross Profit and Gross Margin

Gross profit for the second quarter of 2020 was RMB193.8 million (US$27.4 million), a 29.6% increase from RMB149.5 million for the previous quarter and an 8.4% decrease from RMB211.6 million for the same quarter last year.

Gross margin for the second quarter of 2020 was 71.9%, compared with 65.5% for the previous quarter and 76.5% for the same quarter last year.

Operating Expenses

Total operating expenses for the second quarter of 2020 were RMB289.7 million (US$41.0 million), a 16.3% decrease from RMB346.1 million for the previous quarter and a 3.6% decrease from RMB300.5 million for the same quarter last year. The changes were primarily due to an improvement in operating efficiency and the optimization of the organizational structure.

Sales and marketing expenses for the second quarter of 2020 were RMB200.7 million (US$28.4 million), a 24.2% decrease from RMB264.7 million for the previous quarter and an 8.7% decrease from RMB219.7 million for the same quarter last year. The changes were primarily due to the Company’s stringent cost control in advertising and optimization of user acquisition costs. Sales and marketing expenses as a percentage of net revenues decreased to 74.5% for the second quarter of 2020, compared with 115.9% for the previous quarter and 79.5% for the same quarter last year.

Research and development expenses for the second quarter of 2020 were RMB48.5 million (US$6.9 million), an 18.1% decrease from RMB59.2 million for the previous quarter and an 8.3% decrease from RMB52.9 million for the same quarter last year. Research and development expenses as a percentage of net revenues decreased from the same quarter last year, representing 18.0% of net revenues for the second quarter of 2020, compared with 25.9% for the previous quarter and 19.1% for the same quarter last year. The changes were primarily due to the efficiency optimization in personnel management.

General and administrative expenses for the second quarter of 2020 were RMB40.5 million (US$5.7 million), an 82.8% increase from RMB22.1 million for the previous quarter and a 45.0% increase from RMB27.9 million for the same quarter last year, primarily due to a one-off impairment loss on leasehold improvement caused by early termination of lease in Wuhan due to changes in business strategy. Subsequently in August, the early termination of lease was confirmed with the lessor. General and administrative expenses were 15.0% of net revenues for the second quarter of 2020, compared with 9.7% for the previous quarter and 10.1% for the same quarter last year.

Loss from Operations

Loss from operations for the second quarter of 2020 was RMB95.9 million (US$13.6 million), compared with RMB196.5 million for the previous quarter and RMB88.9 million for the same quarter last year. The improvement in operating result was attributable to: (i) the upgrade of product mix, introducing additional courses and services with higher average selling prices; (ii) an improvement in operating efficiency; and (iii) stringent cost control in advertising and optimization of user acquisition costs.

Adjusted EBITDA[2]

Adjusted EBITDA for the second quarter of 2020 was a loss of RMB77.8 million (US$11.0 million), compared with an adjusted EBITDA loss of RMB182.5 million for the previous quarter and an adjusted EBITDA loss of RMB77.2 million for the same quarter last year.

[2] "Adjusted EBITDA" is a non-GAAP measure, which represents EBITDA before share-based compensation expenses. EBITDA represents net loss before interest, tax, depreciation and amortization. See "Reconciliations of GAAP and Non-GAAP Results" at the end of this press release.

Foreign exchange related (losses) / gains, net

Foreign exchange gain was RMB0.1 million (US$20 thousand) in the second quarter of 2020, compared with a foreign exchange loss of RMB2.3 million for the previous quarter and a foreign exchange loss of RMB1.7 million for the same quarter last year. 

Net Loss

Net loss for the second quarter of 2020 was RMB92.5 million (US$13.1 million), compared with RMB197.0 million for the previous quarter and RMB87.8 million for the same quarter last year.

Adjusted net loss[3] for the second quarter of 2020 was RMB85.3 million (US$12.1 million), compared with RMB189.2 million for the previous quarter and RMB81.6 million for the same quarter last year.

Basic and diluted net loss per ordinary share attributable to ordinary shareholders for the second quarter of 2020 was RMB1.87 (US$0.27), compared with RMB3.99 for the previous quarter and RMB1.78 for the same quarter last year. 

[3] "Adjusted net loss" is a non-GAAP measure, which excludes share-based compensation expenses. See "Reconciliation of GAAP and Non-GAAP Results" at the end of this press release.

Balance Sheet & Cashflows

As of June 30, 2020, the Company’s cash, cash equivalents, restricted cash and short-term investments totaled RMB390.3 million (US$55.3 million), compared with RMB459.4 million as of March 31, 2020 and RMB552.6 million as of December 31, 2019. 

Operating cash outflow for the second quarter of 2020 was RMB66.4 million (US$9.4 million), compared with RMB99.8 million for the previous quarter and RMB58.9 million for the same quarter last year.

The Company had deferred revenues of RMB828.8 million (US$117.3 million) as of June 30, 2020, compared with RMB820.7 million as of March 31, 2020 and RMB696.0 million as of December 31, 2019.

Impact of the Recently Adopted Major Accounting Pronouncement

In June 2016, the FASB issued ASU 2016-13 "Financial Instruments-Credit Losses (Topic 326)," which requires entities to measure all expected credit losses for financial assets held at the reporting date based on historical experience, current conditions, and reasonable and supportable forecasts. This replaces the existing incurred loss model and is applicable to the measurement of credit losses on financial assets measured at amortized cost. The Company adopted the new standard effective January 1, 2020 on a modified retrospective basis and did not restate comparative periods. The impact of new standard was immaterial to the Company.

Outlook

For the third quarter of 2020, the Company currently expects:

–  Net revenues to be between RMB230.0 million to RMB250.0 million, which would represent a decrease of approximately 12.2% to 4.6% from RMB262.1 million for the same quarter last year;

This forecast reflects the Company’s current and preliminary view on the current business situation and market conditions, which is subject to change.

Conference Call

The Company’s management will host an earnings conference call at 9:00 PM U.S. Eastern Time on August 26, 2020 (9:00 AM Beijing/Hong Kong time on August 27, 2020).

Dial-in details for the earnings conference call are as follows:

United States (toll free):

+1-877-396-2308

International:

+1-647-689-5527

Mainland China:

400-048-6136 or 400-043-3098

Hong Kong:

+852-5803-0358

Conference ID:

2666857

Participants should dial-in at least 10 minutes before the scheduled start time to be connected to the call.

Additionally, a live and archived webcast of the conference call will be available on the Company’s investor relations website at http://ir.laix.com/investors.

About LAIX Inc.

LAIX Inc. ("LAIX" or the "Company") is an artificial intelligence (AI) company in China that creates and delivers products and services to popularize English learning. Its proprietary AI teacher utilizes cutting-edge deep learning and adaptive learning technologies, big data, well-established education pedagogies and the mobile internet. LAIX believes its innovative approach fundamentally transforms learning. LAIX provides its products and services on demand via its mobile apps, primarily its flagship "English Liulishuo" mobile app launched in 2013. On the Company’s platform, AI technologies are seamlessly integrated with diverse learning content incorporating well-established language learning pedagogies, gamified features and strong social elements to deliver an engaging, adaptive learning experience. LAIX provides a variety of courses inspired by a broad range of topics and culture themes to make English learning more interesting and is committed to offering a fun, interactive learning environment to motivate and engage its users.

For more information, please visit: http://ir.laix.com.

Use of Non-GAAP Financial Measures

We use adjusted EBITDA and adjusted net loss, each a non-GAAP financial measure, in evaluating our operating results and for financial and operational decision-making purposes.

We believe that adjusted EBITDA and adjusted net loss help identify underlying trends in our business that could otherwise be distorted by the effect of certain expenses that we include in loss from operations and net loss. We believe that adjusted EBITDA and adjusted net loss provide useful information about our results of operations, enhance the overall understanding of our past performance and future prospects and allow for greater visibility with respect to key metrics used by our management in its financial and operational decision-making.

Adjusted EBITDA and adjusted net loss should not be considered in isolation or construed as an alternative to loss from operations, net loss or any other measure of performance or as an indicator of our operating performance. Investors are encouraged to review the historical non-GAAP financial measures to the most directly comparable GAAP measures. Adjusted EBITDA and adjusted net loss presented here may not be comparable to similarly titled measures presented by other companies. Other companies may calculate similarly titled measures differently, limiting their usefulness as comparative measures to our data. We encourage investors and others to review our financial information in its entirety and not rely on a single financial measure.

Exchange Rate Information

This announcement contains translations of certain RMB amounts into U.S. dollars at a specified rate solely for the convenience of the reader. Unless otherwise noted, all translations from Renminbi to U.S. dollars are made at a rate of RMB7.0651 to US$1.00, the rate in effect as of June 30, 2020 published by the Federal Reserve Board.

Safe Harbor Statement

This announcement contains forward-looking statements. These statements are made under the "safe harbor" provisions of the U.S. Private Securities Litigation Reform Act of 1995. These forward-looking statements can be identified by terminology such as "will," "expects," "anticipates," "aims," "future," "intends," "plans," "believes," "estimates," "confident," "potential," "continue" or other similar expressions. Among other things, the Outlook and quotations from management in this announcement, as well as LAIX’s strategic and operational plans, contain forward-looking statements. LAIX may also make written or oral forward-looking statements in its periodic reports to the U.S. Securities and Exchange Commission, in its annual report to shareholders, in press releases and other written materials and in oral statements made by its officers, directors or employees to third parties. Statements that are not historical facts, including but not limited to statements about LAIX’s beliefs and expectations, are forward-looking statements. Forward-looking statements involve inherent risks and uncertainties, and a variety of factors could cause actual results to differ materially from those contained in any forward-looking statement, including but not limited to the following: LAIX’s goals and strategies; LAIX’s future business development, results of operations and financial condition; the expected growth of the education market; LAIX’s ability to monetize the user base; fluctuations in general economic and business conditions in China; the potential impact of the COVID-19 to LAIX’s business operations and the economy in China and elsewhere generally; and assumptions underlying or related to any of the foregoing. Further information regarding these and other risks is included in the Company’s filings with the Securities and Exchange Commission. All information provided in this press release and in the attachments is as of the date of the press release, and the Company undertakes no duty to update such information, except as required under applicable law.

For investor and media inquiries, please contact:

LAIX Inc.
Harry He
Investor Relations
Email: ir@laix.com 

The Piacente Group Investor Relations
Brandi Piacente
Tel: +1-212-481-2050
Email: liulishuo@tpg-ir.com

Emilie Wu
Tel: +86-21-6039-8363
Email: liulishuo@tpg-ir.com  


LAIX INC.

 UNAUDITED CONSOLIDATED BALANCE SHEETS

 (Amount in thousands of Renminbi ("RMB") and US dollars ("US$"))

 As of

As of

December 31, 2019

June 30, 2020

RMB

RMB

US$

ASSETS

Current assets:

Cash and cash equivalents

281,166

169,248

23,955

Restricted cash

1,816

2,147

304

Short-term investments

269,643

218,953

30,991

Accounts receivable, net

7,360

8,509

1,204

Prepayments and other current assets

86,787

81,449

11,528

Total current assets

646,772

480,306

67,982

Non-current assets:

Property and equipment, net

71,637

45,670

6,464

Investment in equity fund

5,919

6,196

877

Intangible assets, net

15,541

15,776

2,233

Operating lease right-of-use assets, net 

155,525

111,929

15,843

Other non-current assets

8,447

7,253

1,027

Deferred tax assets

15,336

15,336

2,171

Total non-current assets

272,405

202,160

28,615

Total assets

919,177

682,466

96,597

LIABILITIES 

Current liabilities:

Accounts payable 

137,684

102,208

14,467

Deferred revenue

695,971

828,763

117,304

Salary and welfare payable

153,969

130,490

18,470

Tax payable

74,340

75,080

10,627

Operating lease liability, current

37,009

34,973

4,950

Accrued liabilities and other current liabilities

15,444

16,448

2,327

Total current liabilities

1,114,417

1,187,962

168,145

Non-current liabilities:

Operating lease liability, non-current

117,124

77,868

11,022

Other non-current liabilities

12,441

12,839

1,817

Total non-current liabilities

129,565

90,707

12,839

Total liabilities

1,243,982

1,278,669

180,984

Shareholders’ equity/(deficit)

Class A Ordinary shares

208

210

30

Class B Ordinary shares

121

121

17

Subscriptions receivable from founding shareholders

(122)

(122)

(17)

Treasury Stock

(10,730)

(15,327)

(2,169)

Additional paid-in capital

1,167,884

1,184,200

167,613

Accumulated other comprehensive income

29,483

35,874

5,077

Accumulated (deficit)

(1,511,649)

(1,801,159)

(254,938)

Total shareholders’ equity/(deficit)

(324,805)

(596,203)

(84,387)

Total liabilities and shareholders’ equity/(deficit)

919,177

682,466

96,597


LAIX INC. 

UNAUDITED CONSOLIDATED STATEMENTS OF COMPREHENSIVE LOSS

(Amount in thousands of Renminbi ("RMB") and US dollars ("US$")

except for number of shares and per share data)

Three months ended

Six months ended

June 30

March 31

June 30

June 30

June 30

2019

2020

2020

2019

2020

RMB

RMB

RMB

US$

RMB

RMB

US$

Net revenues

276,427

228,338

269,405

38,132

529,731

497,743

70,451

Cost of revenues

(64,865)

(78,799)

(75,646)

(10,707)

(124,555)

(154,445)

(21,860)

Gross profit

211,562

149,539

193,759

27,425

405,176

343,298

48,591

Operating expenses:

Sales and marketing expenses

(219,734)

(264,740)

(200,726)

(28,411)

(413,362)

(465,466)

(65,882)

Research and development expenses

(52,882)

(59,219)

(48,482)

(6,862)

(102,961)

(107,701)

(15,244)

General and administrative expenses

(27,895)

(22,139)

(40,461)

(5,727)

(47,942)

(62,600)

(8,860)

Total operating expenses

(300,511)

(346,098)

(289,669)

(41,000)

(564,265)

(635,767)

(89,986)

Other operating income

18

25

4

43

6

Loss from Operations

(88,949)

(196,541)

(95,885)

(13,571)

(159,089)

(292,426)

(41,389)

Other income/(expenses):

Interest income

761

683

366

52

1,062

1,049

148

Foreign exchange related (losses)/gains, net

(1,711)

(2,319)

140

20

(1,012)

(2,179)

(308)

Change in fair value of short-term investment

1,815

517

806

114

3,938

1,323

187

Other income, net

269

682

2,098

297

42

2,780

393

Loss before income taxes expenses

(87,815)

(196,978)

(92,475)

(13,088)

(155,059)

(289,453)

(40,969)

Income tax expenses

(28)

(29)

(28)

(4)

(56)

(57)

(8)

Net loss

(87,843)

(197,007)

(92,503)

(13,092)

(155,115)

(289,510)

(40,977)

Net loss attributable to LAIX Inc.’s ordinary
shareholders

(87,843)

(197,007)

(92,503)

(13,092)

(155,115)

(289,510)

(40,977)


LAIX INC.

UNAUDITED CONSOLIDATED STATEMENTS OF COMPREHENSIVE LOSS

(Amount in thousands of Renminbi ("RMB") and US dollars ("US$")

except for number of shares and per share data)

Three months ended

Six months ended

June 30

March 31

June 30

June 30

June 30

2019

2020

2020

2019

2020

RMB

RMB

RMB

US$

RMB

RMB

US$

Net loss

(87,843)

(197,007)

(92,503)

(13,092)

(155,115)

(289,510)

(40,977)

Other comprehensive income/(loss)

—Foreign currency translation adjustment, net of nil tax

14,605

6,776

(385)

(54)

835

6,391

905

Comprehensive loss

(73,238)

(190,231)

(92,888)

(13,146)

(154,280)

(283,119)

(40,072)

Net loss per Class A and Class B ordinary shares

—Basic and Diluted

(1.78)

(3.99)

(1.87)

(0.27)

(3.19)

(5.87)

(0.83)

Weighted average number of Class A and Class B
ordinary shares used in per share calculation

—Basic and Diluted

49,246,017

49,359,565

49,337,462

49,337,462

48,609,846

49,348,103

49,348,103


LAIX INC.

Reconciliation of GAAP and Non-GAAP Results

(Amount in thousands of Renminbi ("RMB") and US dollars("US$")

except for percentage data)

Three months ended

Six months ended

June 30,
2019

March 31,
2020

June 30,
2020

June 30,
2019

June 30,
2020

RMB

RMB

RMB

US$

RMB

RMB

US$

Net loss

(87,843)

(197,007)

(92,503)

(13,092)

(155,115)

(289,510)

(40,977)

Add:

Share-based compensation expenses

6,239

7,774

7,241

1,025

19,059

15,015

2,125

Depreciation of property, plant and equipment

5,001

7,347

7,781

1,101

7,439

15,128

2,141

Amortization of prepaid interest expense and service fees to loan companies

92

252

Income tax expenses

28

29

28

4

56

57

8

Subtract:

Interest income

(761)

(683)

(366)

(52)

(1,062)

(1,049)

(148)

Adjusted EBITDA

(77,244)

(182,540)

(77,819)

(11,014)

(129,371)

(260,359)

(36,851)

Net loss

(87,843)

(197,007)

(92,503)

(13,092)

(155,115)

(289,510)

(40,977)

Add back:

Share-based compensation expenses

6,239

7,774

7,241

1,025

19,059

15,015

2,125

Adjusted net loss

(81,604)

(189,233)

(85,262)

(12,067)

(136,056)

(274,495)

(38,852)