Tag Archives: ENV

Canadian Solar Prices Offering of US$200 Million Convertible Senior Notes

GUELPH, ON, Sept. 11, 2020 — Canadian Solar Inc. (NASDAQ: CSIQ) (the "Company", or "Canadian Solar"), one of the world’s largest solar power companies, today announced pricing of its previously announced offering of US$200 million in aggregate principal amount of convertible senior notes due 2025 (the "Notes") that is exempt from the registration requirements of the Securities Act of 1933, as amended (the "Securities Act"). The Company has granted the initial purchasers in the offering a 30-day option to purchase up to an additional US$30 million aggregate principal amount of the Notes. The Company plans to use the net proceeds from the offering for general corporate purposes, which may include the expansion of manufacturing capacity, development of solar power projects and working capital.

The Notes will be senior, unsecured obligations of the Company. The Notes will accrue interest at an annual rate of 2.50%. Interest on the Notes will be payable semi-annually in arrears on April 1 and October 1 of each year, beginning April 1, 2021. The Notes will mature on October 1, 2025, unless repurchased, redeemed or converted in accordance with their terms prior to such date. The Company may not redeem the Notes prior to October 6, 2023 unless certain tax-related events occur. On or after October 6, 2023, the Company may redeem for cash all or part of the Notes, at its option, if the last reported sale price of the Company’s common stock has been at least 130% of the conversion price then in effect on each of at least 20 trading days (whether or not consecutive) during any 30 consecutive trading day period (including the last trading day of such period) ending on, and including, the trading day immediately prior to the date the Company provides notice of redemption. In the event of certain fundamental changes, holders of the Notes may require the Company to repurchase all or part of the Notes in cash, subject to certain conditions. In addition, if a make-whole fundamental change occurs prior to the maturity date or the Company redeems the Notes, the Company will, under certain circumstances, increase the conversion rate for holders who convert Notes in connection with such make-whole fundamental change or redemption.

The Notes will be convertible at the option of the holders at any time prior to the close of business on the second business day immediately preceding the maturity date. The initial conversion rate of the Notes is 27.2707 common shares of the Company, per US$1,000 principal amount of Notes (which is equivalent to an initial conversion price of approximately US$36.67 per common share and represents a conversion premium of approximately 32.50% above the NASDAQ last reported sale price of the Company’s common shares on September 10, 2020, which was US$27.675 per common share). The conversion rate for the Notes is subject to adjustments upon the occurrence of certain events. Upon conversion, the Company will deliver to such converting holders, a number of the Company’s common shares equal to the applicable conversion rate as of the relevant conversion date, together with a cash payment in lieu of any fractional share.

The Notes have been offered in the United States to persons reasonably believed to be qualified institutional buyers pursuant to Rule 144A and to non-U.S. persons outside the United States in reliance on Regulation S under the Securities Act. The Notes and the common shares deliverable upon conversion of the Notes have not been and will not be registered under the Securities Act or the securities laws of any other place, and may not be offered or sold in the United States absent registration or an applicable exemption from registration requirements.

The Company expects to close the offering on or about September 15, 2020, subject to the satisfaction of customary closing conditions.

This press release shall not constitute an offer to sell or a solicitation of an offer to purchase any securities, nor shall there be any offer, solicitation or sale of the securities in any state or jurisdiction in which such an offer, solicitation or sale would be unlawful.

This press release contains information about the pending offerings of the Notes, and there can be no assurance that any of the offerings will be completed.

About Canadian Solar Inc.

Canadian Solar was founded in 2001 in Canada and is one of the world’s largest solar power companies. It is a leading manufacturer of solar photovoltaic modules and provider of solar energy solutions and has a geographically diversified pipeline of utility-scale solar power projects in various stages of development. Over the past 19 years, Canadian Solar has successfully delivered over 46 GW of premium-quality, solar photovoltaic modules to customers in over 150 countries. Canadian Solar is one of the most bankable companies in the solar industry, having been publicly listed on NASDAQ since 2006. For additional information about the Company, follow Canadian Solar on LinkedIn or visit www.canadiansolar.com.

Safe Harbor/Forward-Looking Statements

Certain statements in this press release are forward-looking statements that involve a number of risks and uncertainties that could cause actual results to differ materially. These statements are made under the "Safe Harbor" provisions of the U.S. Private Securities Litigation Reform Act of 1995. In some cases, you can identify forward-looking statements by such terms as "believes," "expects," "anticipates," "intends," "estimates," the negative of these terms, or other comparable terminology. Factors that could cause actual results to differ include general business and economic conditions and the state of the solar industry; governmental support for the deployment of solar power; future available supplies of high-purity silicon; demand for end-use products by consumers and inventory levels of such products in the supply chain; changes in demand from significant customers; changes in demand from major markets such as Japan, the U.S., India and China; changes in customer order patterns; changes in product mix; capacity utilization; level of competition; pricing pressure and declines in average selling prices; delays in new product introduction; delays in utility-scale project approval process; delays in utility-scale project construction; delays in the completion of project sales; continued success in technological innovations and delivery of products with the features customers demand; shortage in supply of materials or capacity requirements; availability of financing; exchange rate fluctuations; litigation and other risks as described in the Company’s SEC filings, including its annual report on Form 20-F filed on April 28, 2020. Although the Company believes that the expectations reflected in the forward-looking statements are reasonable, it cannot guarantee future results, level of activity, performance, or achievements. Investors should not place undue reliance on these forward-looking statements. All information provided in this press release is as of today’s date, unless otherwise stated, and Canadian Solar undertakes no duty to update such information, except as required under applicable law.

Related Links :

http://www.canadiansolar.com

ReneSola Power to Participate at the H.C. Wainwright 22nd Annual Global Investment Conference on September 15, 2020


STAMFORD, Conn., Sept. 10, 2020 — ReneSola Ltd ("ReneSola Power" or the "Company") (www.renesolapower.com) (NYSE: SOL), a leading fully integrated solar project developer, announced that management will participate in the H.C. Wainwright 22nd Annual Global Investment Conference. The conference will be held virtually on Tuesday, September 15, 2020, with a management presentation available to the public scheduled for 12:00 p.m. ET as well as a one-on-one meeting format for institutional investors.

The presentation will be webcast live from the Investors section of ReneSola Power’s website at https://ir.renesolapower.com/event-calendar.  A replay of the webcast will be archived and available from the Investors section of ReneSola Power’s website.

Management will be available for one-on-one meetings with institutional investors at the event. Portfolio managers and analysts who wish to request a meeting should contact their institutional sales representative at H.C. Wainwright.

Presentation materials will be made available on the Investors section of ReneSola Power’s website at https://ir.renesolapower.com/event-calendar.

About ReneSola Power

ReneSola Power (NYSE: SOL) is a leading global solar project developer and operator. The Company focuses on solar power project development, construction management and project financing services. With local professional teams in more than 10 countries around the world, the business is spread across a number of regions where the solar power project markets are growing rapidly, and can sustain that growth due to improved clarity around government policies. The Company’s strategy is to pursue high-margin project development opportunities in these profitable and growing markets; specifically, in the U.S. and Europe, where the Company has a market-leading position in several geographies, including Poland, Hungary, Minnesota and New York.


Related Links :

http://www.renesolapower.com

JinkoSolar is Number 1 on Silicon Valley Toxics Coalition’s Latest Scorecard

JACKSONVILLE, Fla., Sept. 4, 2020 — JinkoSolar Holding Co., Ltd. (NYSE: JKS) ("JinkoSolar"), an innovative global solar module manufacturer, today announced that it is the top manufacturer in Silicon Valley Toxics Coalition’s ("SVTC") latest Solar Scorecard. JinkoSolar earned a score of 100/100, more than the other 36 module manufacturers in the Scorecard. 

The Scorecard is a resource for consumers, investors, developers, EPCs, distributors, and installers who want to purchase PV modules from responsible product stewards. Criteria in the Scorecard includes environmental, health, and safety metrics. This achievement comes a year after JinkoSolar became the first PV module manufacturer to join the RE100, pledging to power 100% of its operations with renewables by 2025. 

Mr. Kangping Chen, Chief Executive Officer of JinkoSolar, commented, "We support SVTC’s goal to ensure that the solar industry does not overlook the importance of equitable environmental and holistic sustainable approaches to all business operations. We hope more of our peers follow our lead, so the solar industry as a whole can become a beacon of sustainable practices."

"We applaud JinkoSolar for its transparency, leadership, and commitment to producing modules in a clean and responsible way," said Sheila Davis, Executive Director of SVTC. "Customers have choices when they make purchases, and we hope that the Solar Scorecard can help them make informed decisions."

About JinkoSolar Holding Co., Ltd.

JinkoSolar (NYSE: JKS) is one of the largest and most innovative solar module manufacturers in the world. JinkoSolar distributes it solar products and sells its solutions and services to a diversified international utility, commercial, and residential customer base in China, the United States, Japan, Germany, the United Kingdom, Chile, South Africa, India, Mexico, Brazil, the United Arab Emirates, Italy, Spain, France, Belgium, and other countries and regions. JinkoSolar has built a vertically integrated solar product value chain, with an integrated annual capacity of 17.5 GW for silicon wafers, 10.6 GW for solar cells, and 16.0 GW for solar modules, as of March 31, 2020. 

JinkoSolar has 7 production facilities globally, and 14 overseas subsidiaries in Japan, South Korea, Vietnam, India, Turkey, Germany, Italy, Switzerland, United States, Mexico, Brazil, Chile, and Australia, and global sales teams in China, United Kingdom, France, Spain, Bulgaria, Greece, Ukraine, Jordan, Saudi Arabia, Tunisia, Morocco, Kenya, South Africa, Costa Rica, Colombia, Panama, Kazakhstan, Malaysia, Myanmar, Sri Lanka, Thailand, Vietnam, Poland, and Argentina.

To find out more, please see: www.jinkosolar.com

About Silicon Valley Toxics Coalition

Silicon Valley Toxics Coalition is a nonprofit organization engaged in research, advocacy and grassroots organizing to promote human health and environmental justice in response to the rapid growth of the high-tech industry. For more information, go to www.svtc.org.

Safe Harbor Statement

This press release contains forward-looking statements. These statements constitute "forward-looking" statements within the meaning of Section 27A of the Securities Act of 1933, as amended, and Section 21E of the Securities Exchange Act of 1934, as amended, and as defined in the U.S. Private Securities Litigation Reform Act of 1995. These forward-looking statements can be identified by terminology such as "will," "expects," "anticipates," "future," "intends, "plans," "believes," "estimates" and similar statements. Among other things, the quotations from management in this press release and the Company’s operations and business outlook, contain forward-looking statements. Such statements involve certain risks and uncertainties that could cause actual results to differ materially from those in the forward-looking statements. Further information regarding these and other risks is included in JinkoSolar’s filings with the U.S. Securities and Exchange Commission, including its annual report on Form 20-F. Except as required by law, the Company does not undertake any obligation to update any forward-looking statements, whether as a result of new information, future events or otherwise.

For investor and media inquiries, please contact:

Ms. Ripple Zhang
JinkoSolar Holding Co., Ltd.
Tel: +86 21-5183-3105
Email: pr@jinkosolar.com

Related Links :

http://www.jinkosolar.com

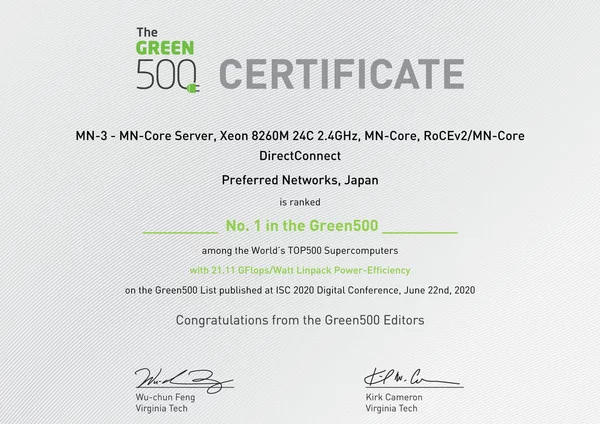
#1 on the Green500 – Supermicro and Preferred Networks (PFN) Collaborate to Develop the World’s Most Efficient Supercomputer

Deep Learning Supercomputer MN-Core™ Achieves Record 21.11 Gigaflops Performance-Per-Watt Based on Real-World Scientific Application Benchmarks  

SAN JOSE, California, Aug. 31, 2020 — Super Micro Computer, Inc. (Nasdaq: SMCI), a global leader in enterprise computing, storage, networking solutions and green computing technology, today announced that its collaboration with Preferred Networks achieved the ranking for the Green500 semi-annual industry assessment. The MN-3 reached a record 21.11Gigaflops of performance-per-watt on a benchmark run that delivered a total performance of 1.62 Petaflops. This efficiency achievement is 15% higher than the previous Green500 record of 18.404 Gflops/W, which was recorded in June 2018.


"Supermicro was excited to work with PFN on this exceptional system supporting machine learning (ML) and deep learning (DL) applications and energy efficiency," said Charles Liang, CEO and president of Supermicro. "The Green500 international recognition confirms that Supermicro delivers exceptional products – resource-saving, superior design, and high-reliability to the market."

PFN partnered with Supermicro to develop this customized server, which addresses a wide range of applications that require ultra-fast communications. Based in Japan, PFN strives to solve complex problems that utilize deep learning, robotics, and other advanced technologies.

"We are very pleased to have partnered with Supermicro, who worked with us very closely to build MN-3, which was recognized as the world’s most energy-efficiency supercomputer," stated Yusuke Doi, VP of Computing Infrastructure at Preferred Networks. "We can deliver outstanding performance while using a fraction of the power that was previously required for such a large supercomputer."

The PFN solution is based on the Supermicro GPU server that utilizes Intel® Xeon® CPUs, and MN-Core boards developed by Preferred Networks. This advanced system offers up to 6TB of DDR4 memory, and multiple GPUs or accelerators, as well as the interconnects that enable ultra-fast communications between GPUs.

PFN Supercomputer

The PFN supercomputer can serve many users simultaneously. The initial cluster consisted of 48 servers- four interconnect nodes, and five 100GbE switches. There was a total of 2,080 CPU cores, housed in a 7U high rack-mounted unit.

Learn more about the Green500 supercomputer.   

Follow Supermicro on LinkedIn, Twitter, and Facebook to receive their latest news and announcements.

About Super Micro Computer, Inc.

Supermicro (Nasdaq: SMCI), the leading innovator in high-performance, high-efficiency server technology, is a premier provider of advanced Server Building Block Solutions® for Data Center, Cloud Computing, Enterprise IT, Hadoop/Big Data, HPC and Embedded Systems worldwide. Supermicro is committed to protecting the environment through its "We Keep IT Green®" initiative and provides customers with the most energy-efficient, environmentally-friendly solutions available on the market.

Supermicro, Server Building Block Solutions, and We Keep IT Green are trademarks and/or registered trademarks of Super Micro Computer, Inc.

All other brands, names and trademarks are the property of their respective owners.

SMCI-F

PFN Supercomputer
PFN Supercomputer

Photo – https://techent.tv/wp-content/uploads/2020/08/1-on-the-green500-supermicro-and-preferred-networks-pfn-collaborate-to-develop-the-worlds-most-efficient-supercomputer-2.jpg 
Photo – https://techent.tv/wp-content/uploads/2020/08/1-on-the-green500-supermicro-and-preferred-networks-pfn-collaborate-to-develop-the-worlds-most-efficient-supercomputer.jpg

Related Links :

http://www.supermicro.com

At ‘GAC Tech Day’, hydrogen fuel-cell technology takes the limelight, highlights GAC’s scientific depth and technical capabilities

GUANGZHOU, China, Aug. 31, 2020 — Recently at the GAC Tech Day 2020, GAC Group unveiled its latest scientific and technological achievements, including two major platform technologies and three futuristic technologies. Powering current innovations at GAC Group are the Global Platform Modular Architecture (GPMA) that incorporates traditional fuel power as well as the GAC Electric Platform (GEP) 2.0. Building on these platforms, GAC Group announced three technological breakthroughs: the ADiGO 3.0 intelligent driving interconnected ecosystem, hydrogen fuel-cell vehicle Aion LX Fuel Cell and 3DG graphene preparation technology, these leading technologies will enable GAC Group to achieve much more in the near future.

Aion LX Fuel Cell
Aion LX Fuel Cell

At the event, GAC unveiled its first hydrogen fuel-cell passenger car, the Aion LX Fuel Cell, attracting major industry observers and media due key benefits such as its fast charging times, long battery life and zero pollution. Industry experts have lauded the advent of hydrogen fuel-cell vehicles, as it is expected to become a popular environmentally friendly solution for vehicles with zero carbon emissions.

GAC Group has prioritized climate conversation as a strategy and are focusing on hydrogen-based clean energy, known as the "ultimate energy" of the 21st century. Hydrogen fuel-cell vehicles have become a forward-looking technology with promising development prospects.

GAC Group has achieved an industry-leading advantage in hydrogen fuel-cell technology through the launch of the Aion LX Fuel Cell. The hydrogen-based vehicle developed on the GEP 2.0 platform is equipped with a hydrogen fuel-cell system independently developed also by GAC Group.

GAC’s hydrogen fuel-cell vehicle has shown to solve several problems of current renewable energy vehicles. Firstly, it only takes 3-5 minutes to recharge each time, which is shorter than the charging time of most electric vehicles. Secondly, the NEDC operating range of this car exceeds 650KM, reaching international benchmarks. Thirdly, the car also solves the problem of ignition and operations in low-temperature weather: at minus 30°C, a one-button cold start can be enabled sans an external heat source without affecting the cruising range. Most importantly, its emissions are only pure water, and the filter element carried can filter 99% of the inhalable particulate matter, not only reducing pollution but also purifying the surrounding air.

The Aion LX Fuel Cell has also been comprehensively upgraded to exceed safety expectations. Built upon the five-star safety of the original model Aion LX, it has also passed difficult safety tests such as 32km/h side column collision and 80km/h rear collision.

Riding on the wave of technology and digitization, GAC Group has taken the lead in laying out a strategic industry-wide roadmap for technological innovation. GAC MOTOR has developed rapidly in overseas markets in recent years. Supported by GAC Group’s strong scientific and technological backing, the Group remains committed to bring a high-tech driving experience to people all over the world and continue to create value for a lifestyle of mobility for humankind.

Photo – https://photos.prnasia.com/prnh/20200831/2903236-1?lang=0

Sungrow 1H 2020 Fiscal Report: Revenues up 55.57% Year-on-Year

HEFEI, China, Aug. 28, 2020 — Sungrow, the global leading inverter solution supplier for renewables, posted its 1H fiscal report in late August, showing a huge growth on revenue, underlining the solid financial result and strong competitiveness for the first half of 2020 despite the impact of the pandemic.

Specifically, the revenue increased by 55.57% year-on-year (YoY) to US$ 987.2 million in 1H 2020, while net income grew by 34.13% YoY to US$ 63.4 million, due to strong performance in Americas, Europe and China. Operational cash flow also improved by 85.41% per the statement.

Sungrow continues to lead the global market with a revenue of US$ 870.8 million in the PV segment, embracing a YoY increase of 48.49%. The energy storage segment meanwhile has enjoyed a staggering 49.66% YoY growth to US$ 35.6 million in revenues for 1H 2020.

The Company attributes the boost to strong performance to the continued efforts in pioneering technical innovations and expanding global footprints. Sungrow’s cumulative shipment reached 120 GW as of June this year and has more than 1000 deployments of its integrated energy storage solutions over the world. The agile local team can offer responsive technical support, sales and 24/7 after-sale service, which is essential for forging partnerships during COVID-19.

"As a pioneer, Sungrow keeps offering state-of-the-art products and solutions to meet diversified global market demand. The forecast for the second half of 2020 is optimistic as the global market heads to recover in a few months," said Prof. Cao Renxian, Chairman of Sungrow.

Prof. Cao also mentioned that Sungrow was once again ranked "100% bankable" by BloombergNEF as per the latest bankability survey, becoming the only inverter brand ranked "100% bankable" for two straight years.

About Sungrow

Sungrow Power Supply Co., Ltd ("Sungrow") is the world’s most bankable inverter brand with over 120 GW installed worldwide as of June 2020. Founded in 1997 by University Professor Cao Renxian, Sungrow is a leader in the research and development of solar inverters, with the largest dedicated R&D team in the industry and a broad product portfolio offering PV inverter solutions and energy storage systems for utility-scale, commercial, and residential applications, as well as internationally recognized floating PV plant solutions. With a strong 23-year track record in the PV space, Sungrow products power installations in over 120 countries, maintaining a worldwide market share of over 15%. Learn more about Sungrow by visiting www.sungrowpower.com.

Related Links :

http://www.sungrowpower.com

HARTING Technology Group has been shaping the future for 75 years

Innovative products and solutions for Industry 4.0

ESPELKAMP, Germany, Aug. 28, 2020 For 75 years now, the HARTING Technology Group has been driving technological change. The vision formulated in 1996 by the owner family "We want to shape the future with technologies for people" remains the guiding star of our entrepreneurial activities. September 1 marks the 75th anniversary of the founding day of the family company.

The manufacturer of everyday products such as waffle irons and irons has evolved into a worldwide leading supplier of industrial connection technology for the three lifelines of data, signal and power, a global player fielding innovative products and solutions focusing on Industry 4.0 and digitization.    

– Cross reference: Picture is available at AP Images (http://www.apimages.com) –

Wilhelm and Marie Harting opened the "Wilhelm Harting Mechanical Workshops" on September 1, 1945, in a repair workshop covering a good 100 square meters in Minden. From 1950 onwards, the company gradually moved to the neighbouring town Espelkamp. This was the period in which the success story of the Han® connector commenced. The Han® (HARTING standard), patented in 1956 and a registered trademark since 1957, became the standard, the epitome of the industrial connector. Thanks to the Han-Modular® series, customers are able to achieve optimal design solutions for the supply of machines, systems and plants.   

In October 2015, Dietmar Harting, son of Marie and Wilhelm Harting, handed over the reins as Chairman of the Board to his son Philip. Today, Philip Harting and his sister Maresa Harting-Hertz work closely with their parents Margrit and Dietmar Harting on the Board. The body includes three managers from outside the family.

Contact:

HARTING Stiftung & Co. KG
Detlef Sieverdingbeck
General Manager
Corporate Communications & Branding (CCB) 
Marienwerderstr. 3
32339 Espelkamp

Tel.: 05772 47-244
Fax:  05772 47-400
Detlef.Sieverdingbeck@HARTING.com
More information at www.HARTING.com


Related Links :

http://www.harting.com/

JinkoSolar Ranked as Top Solar Brand used in Debt Financed Projects and Most “Bankable” PV Manufacturer by Bloomberg New Energy Finance

SHANGRAO, China, Aug. 21, 2020 — JinkoSolar Holding Co., Ltd. (the "Company" or "JinkoSolar") (NYSE: JKS), one of the largest and most innovative solar module manufacturers in the world, today announced that it was ranked as a top solar brand in debt financed projects and named a most "bankable" PV manufacturer by Bloomberg New Energy Finance (BNEF). Forty-nine global solar module manufacturers were ranked based on BNEF’s global survey of key PV stakeholders assessing which module brands used in projects are most likely to obtain non-recourse debt financing from commercial banks.

Survey respondents included banks, funds, engineering, procurement, and construction firms (EPCs), independent power producers (IPPs) and technical advisers involved in solar projects around the world. The survey addressed product quality, long term reliability, field deployment performance, and the manufacturer’s financial strength. JinkoSolar was considered highly bankable by 100% of the survey respondents. Further confirming JinkoSolar’s high bankability score, BNEF’s data also shows that projects using JinkoSolar modules have secured more term-loan financing than any other Chinese PV brand ever.

"As one of the leading solar module manufacturers, we are proud to be recognized once again by BNEF as a most trusted solar brand by customers, investors, and banks all over the world. This is a testament to the outstanding research, stringent quality checks and world records we have set to revolutionize the solar industry with our advanced technology, reliability, and high-quality products," said Mr. Kangping Chen, CEO of JinkoSolar. "We have invested heavily in R&D over the years and will continue to invest in the quality, proven reliability and long-term performance of our PV modules because we believe this will generate value and better returns for investors."

About JinkoSolar Holding Co., Ltd.

JinkoSolar (NYSE: JKS) is one of the largest and most innovative solar module manufacturers in the world. JinkoSolar distributes its solar products and sells its solutions and services to a diversified international utility, commercial and residential customer base in China, the United States, Japan, Germany, the United Kingdom, Chile, South Africa, India, Mexico, Brazil, the United Arab Emirates, Italy, Spain, France, Belgium, and other countries and regions. JinkoSolar has built a vertically integrated solar product value chain, with an integrated annual capacity of 17.5 GW for mono wafers, 10.6 GW for solar cells, and 16 GW for solar modules, as of March 31, 2020.

JinkoSolar has over 15,000 employees across its 7 productions facilities globally, 14 overseas subsidiaries in Japan, South Korea, Vietnam, India, Turkey, Germany, Italy, Switzerland, United States, Mexico, Brazil, Chile and Australia, and global sales teams in China, United Kingdom, France, Spain, Bulgaria, Greece, Ukraine, Jordan, Saudi Arabia, Tunisia, Morocco, Kenya, South Africa, Costa Rica, Colombia, Panama, Kazakhstan, Malaysia, Myanmar, Sri Lanka, Thailand, Vietnam, Poland and Argentina.

To find out more, please see: www.jinkosolar.com 

Safe Harbor Statement

This press release contains forward-looking statements. These statements constitute "forward-looking" statements within the meaning of Section 27A of the Securities Act of 1933, as amended, and Section 21E of the Securities Exchange Act of 1934, as amended, and as defined in the U.S. Private Securities Litigation Reform Act of 1995. These forward-looking statements can be identified by terminology such as "will," "expects," "anticipates," "future," "intends, "plans," "believes," "estimates" and similar statements. Among other things, the quotations from management in this press release and the Company’s operations and business outlook, contain forward-looking statements. Such statements involve certain risks and uncertainties that could cause actual results to differ materially from those in the forward-looking statements. Further information regarding these and other risks is included in JinkoSolar’s filings with the U.S. Securities and Exchange Commission, including its annual report on Form 20-F. Except as required by law, the Company does not undertake any obligation to update any forward-looking statements, whether as a result of new information, future events or otherwise.

For investor and media inquiries, please contact:

Ms. Ripple Zhang
JinkoSolar Holding Co., Ltd.
Tel: +86 21-5183-3105
Email: pr@jinkosolar.com

Related Links :

http://www.jinkosolar.com

JinkoSolar reshapes PV technology scenarios with its new N-Type Tiger Pro 610W unveiled at SNEC 2020

SHANGRAO, China, Aug. 7, 2020 — JinkoSolar Holding Co., Ltd. ("JinkoSolar" or "Company") (NYSE: JKS) one of the world’s largest and most innovative module manufacturers in the world, today launched its new generation of 610W Tiger Pro High-efficiency monocrystalline TR solar module and its BIPV solutions, Building Integrated Photovoltaics product series, which will be unveiled at SNEC 2020 in Shanghai.

As a PV company that has ranked first in global modules shipments for four consecutive years, JinkoSolar has always been committed to providing global customers with high-efficiency, top quality, and extremely reliable solar modules. The key behind the success of Tiger Pro 610W is the N-Type HOT 2.0 high-efficiency cell technology, independently developed by JinkoSolar. Thanks to the introduction of new technologies, such as HOT tunneling layer passivated contact and advanced metallization, the cell efficiency has reached 24.79%, setting once again a world record for the efficiency of large area N-Type monocrystalline silicon solar cells. At the same time, the use of 78 cell design and of TR technology, which helps reduce significantly the cell gap, as well as lower the electricity cost and improve the system compatibility, represents another milestone for the PV industry in its quest for grid parity.

JinkoSolar’s module series have continuously broken the conversion efficiency record, starting from 2018, JinkoSolar Eagle PERC high-efficiency monocrystalline series, with a power of 390W and a conversion efficiency of 19.8%, followed by the Tiger HOT 1.0 high-efficiency monocrystalline series delivering a power output up to 475W and a conversion efficiency of 20.87%. The newest Tiger Pro HOT2.0, high-efficiency monocrystalline series, with its maximum output of 610W and a conversion efficiency of 22.3%, is setting once again new-standards for the industry and positioning JinkoSolar far ahead from its competitors.

Moreover, thanks to the great improvements made with the smart combination "PV + Architecture", during this edition of SNEC, JinkoSolar also unveiled its first version of colored BIPV module series. With a power output of up to 550W, this product series is available in a variety of colors and levels of translucence, incorporating modern architectural aesthetics for use as a building component.

Dr. Jin Hao, CTO of JinkoSolar, commented: "Reducing costs and increasing efficiency is the goal that the industry has always been striving for. JinkoSolar has always been committed to providing global customers with high-efficiency, top quality, and extremely reliable solar modules. We will increase our investment in R&D to ensure constant innovation in our technology, improve our products performance, and ensure the highest system compatibility. This will allow us to fulfill our commitment to offer the best service to our global customers and to allow the application of our solar modules in a variety of scenarios, further empowering the solar PV industry and achieving grid parity."

About JinkoSolar Holding Co., Ltd.

JinkoSolar (NYSE: JKS) is one of the largest and most innovative solar module manufacturers in the world. JinkoSolar distributes its solar products and sells its solutions and services to a diversified international utility, commercial and residential customer base in China, the United States, Japan, Germany, the United Kingdom, Chile, South Africa, India, Mexico, Brazil, the United Arab Emirates, Italy, Spain, France, Belgium, and other countries and regions. JinkoSolar has built a vertically integrated solar product value chain, with an integrated annual capacity of 17.5 GW for mono wafers, 10.6 GW for solar cells, and 16 GW for solar modules, as of March 31, 2020.

JinkoSolar has over 15,000 employees across its 7 productions facilities globally, 14 overseas subsidiaries in Japan, South Korea, Vietnam, India, Turkey, Germany, Italy, Switzerland, United States, Mexico, Brazil, Chile and Australia, and global sales teams in China, United Kingdom, France, Spain, Bulgaria, Greece, Ukraine, Jordan, Saudi Arabia, Tunisia, Morocco, Kenya, South Africa, Costa Rica, Colombia, Panama, Kazakhstan, Malaysia, Myanmar, Sri Lanka, Thailand, Vietnam, Poland and Argentina.

To find out more, please see: www.jinkosolar.com

Safe Harbor Statement

This press release contains forward-looking statements. These statements constitute "forward-looking" statements within the meaning of Section 27A of the Securities Act of 1933, as amended, and Section 21E of the Securities Exchange Act of 1934, as amended, and as defined in the U.S. Private Securities Litigation Reform Act of 1995. These forward-looking statements can be identified by terminology such as "will," "expects," "anticipates," "future," "intends, "plans," "believes," "estimates" and similar statements. Among other things, the quotations from management in this press release and the Company’s operations and business outlook, contain forward-looking statements. Such statements involve certain risks and uncertainties that could cause actual results to differ materially from those in the forward-looking statements. Further information regarding these and other risks is included in JinkoSolar’s filings with the U.S. Securities and Exchange Commission, including its annual report on Form 20-F. Except as required by law, the Company does not undertake any obligation to update any forward-looking statements, whether as a result of new information, future events or otherwise.

For investor and media inquiries, please contact:

Ms. Ripple Zhang
JinkoSolar Holding Co., Ltd.
Tel: +86 21-5183-3105
Email: pr@jinkosolar.com

Related Links :

http://www.jinkosolar.com

Canadian Solar Reports Second Quarter 2020 Results

GUELPH, ON, Aug. 7, 2020 — Canadian Solar Inc. ("Canadian Solar" or the "Company") (NASDAQ: CSIQ) today announced financial results for the quarter ended June 30, 2020.

Second Quarter 2020 Highlights

  • 31% sequential increase in total module shipments to 2.9 GW, exceeding guidance of 2.5 GW to 2.7 GW.
  • Net revenue of $696 million exceeding guidance of $630 million to $680 million.
  • Gross margin of 21.2% exceeding guidance of 18.5% to 20.5%.
  • 17% reduction in operating expenses compared to the second quarter of 2019.
  • Net income attributable to Canadian Solar of $20.6 million or $0.34 per diluted share.
  • Updated shipment guidance to 11 GW to 12 GW for 2020, and 18 GW to 20 GW for 2021.

Dr. Shawn Qu, Chairman and CEO, commented, "Despite challenging market conditions, second quarter results exceeded expectations both on revenue and profits. Over the past 19 years, we have built a strong foundation and track record based on technology innovation, all-around product execution, robust customer channels and prudent capital deployment. This foundation has helped us to dynamically adjust to changing market environments and consistently deliver a market-leading return on capital and equity.

Last week, we announced the plan to list our Module and System Solutions ("MSS") business on China’s stock market. If successful, it will give us greater access to additional, lower-cost sources of capital and allow us to grow faster at a time when we believe growth in the solar industry and market consolidation are both set to accelerate. We have started the pre-IPO capital raising process to bring in new partners to our MSS business and convert it into a Sino-foreign joint stock company, which is required by Chinese security regulations for listing in China’s stock market. This investment round is expected to be completed by the end of September, and will also allow us to immediately expand our manufacturing capacity using the best available technologies and equipment to support our newly set module shipment plan for 2021.

In addition, we believe the listing will help us unlock value for shareholders by addressing our valuation gap relative to China-listed solar companies. Meanwhile, as a Canadian-based global company, we remain fully committed to our NASDAQ listing and remain focused on expanding our Energy business worldwide by growing our high-quality project pipeline and sales, and increasing our partial ownership of select solar and storage projects."

Yan Zhuang, President and COO, said, "We are benefiting from a demand rebound across most of our markets, with our order backlog for the second half of 2020 and even next year already exceeding our previous expectations. While the current polysilicon supply disruption and shortage presents a near-term challenge, we are positioning ourselves for long-term growth. On the one hand, we will expand capacity and increase the level of vertical integration in our module business, which will allow us to capture more global market share, enhance pricing power, control costs and improve profitability in an industry that is rapidly consolidating. On the other hand, we are building our technological capabilities in the solar PV plus storage space, gearing up for new growth opportunities as adoption of clean solar energy accelerates."

Dr. Huifeng Chang, Senior VP and CFO, added, "As the industry demand and capital market conditions are both improving, we are working to strike a balance between investing for long-term growth and preserving cash. In the near term, uncertainties remain around the impact of the ongoing pandemic, geopolitical and policy risks. In the medium- to longer-term, the plan to list our MSS business in China’s stock market will give us the additional resources to deliver higher future earnings growth and return on capital. We remain disciplined in our capital allocation decisions, as always, and will continue to monitor the market and adjust to changes."

Second Quarter 2020 Results

Total module shipments in the second quarter of 2020 increased to 2,905 MW from 2,214 MW in the first quarter of 2020, and 2,143 MW in the second quarter of 2019. Growth in shipments was driven by moderate market share gains. Of the total, 281 MW was shipped to the Company’s utility-scale solar power projects in the second quarter of 2020.

Net revenue in the second quarter of 2020 was $696 million, compared to $826 million in the first quarter of 2020, and $1,036 million in the second quarter of 2019. Growth in module shipments and EPC service revenues were offset by lower average module selling prices ("ASP") and limited project sales. Project execution and sales schedules have been delayed due to the impact of COVID-19. That said, the Company is making headway and recently announced the financial closing of the 367 MWp Maplewood projects in Texas, for example.

Gross profit in the second quarter of 2020 was $147 million, compared to $223 million in the first quarter of 2020, and $183 million in the second quarter of 2019. Gross margin in the second quarter of 2020 was 21.2%, compared to 27.0% in the first quarter of 2020, and 17.6% in the second quarter of 2019. Gross margin was 18.2% excluding the benefit of a U.S. anti-dumping ("AD") and countervailing duty ("CVD") true-up of $20.4 million. The lower gross margin was anticipated given the significant decline in ASPs, partially offset by lower manufacturing costs.

Income from operations in the second quarter of 2020 was $45 million, compared to $113 million in the first quarter of 2020, and $61 million in the second quarter of 2019. The decline was partially offset by a 17% year-over-year reduction in the Company’s operating expenses to $102 million in the second quarter of 2020.

Non-cash depreciation and amortization charges in the second quarter of 2020 were $48 million, compared to $45 million in the first quarter of 2020, and $40 million in the second quarter of 2019.

Net foreign exchange loss in the second quarter was $4.5 million, compared to a net loss of $1 million in the first quarter of 2020 and a net gain of $4 million in the second quarter of 2019. The higher foreign exchange loss was mainly due to unfavorable moves in the Brazilian Real and the Thai Baht.

Income tax expense in the second quarter of 2020 was $9 million, compared to an income tax benefit of $29 million in the first quarter of 2020 and an income tax expense of $14 million in the second quarter of 2019.

Net income attributable to Canadian Solar in the second quarter of 2020 was $20.6 million, or $0.34 per diluted share, compared to net income of $110.6 million, or $1.84 per diluted share in the first quarter of 2020, and net income of $62.7 million, or $1.04 per diluted share in the second quarter of 2019.

Net cash used in operating activities in the second quarter of 2020 was approximately $114 million, compared to $105 million in the first quarter of 2019.

Module and System Solutions (MSS) Business Segment

Manufacturing Capacity

The table below sets forth the Company’s manufacturing capacity expansion plan until September 30, 2020. The Company is working on its new 2021 capacity expansion plans and will provide an update in the next quarter.

Manufacturing Capacity (MW)

June 30, 2020

Actual

September 30,
2020

Planned

December 31,
2020

Planned

Ingot

1,850

1,920

1,920

Wafer

5,000

5,000

5,500

Cell

9,700

10,050

10,150

Module

13,950

14,010

16,060

The Company’s manufacturing capacity expansion plan is subject to change based on market conditions and the Company’s capital allocation plan.

Operating Results 

The following table presents unaudited select results of operations data of the Company’s MSS business segment for the periods indicated.

MSS Business Segment Financial Results* 

(In Thousands of U.S. Dollars, Except Percentages and Unless Otherwise Stated)

Three Months Ended

Six Months Ended

June 30, 2020

March 31, 2020

June 30, 2019

June 30, 2020

June 30, 2019

Net revenues

706,155

689,799

673,116

1,395,954

1,142,017

Cost of revenues

557,263

540,931

519,376

1,098,194

889,040

Gross profit

148,892

148,868

153,740

297,760

252,977

Operating expenses

85,670

87,370

95,303

173,040

173,799

Income (loss) from operations

63,222

61,498

58,437

124,720

79,178

Gross margin

21.1%

21.6%

22.8%

21.3%

22.2%

Operating margin

9.0%

8.9%

8.7%

8.9%

6.9%

*Includes effects of both sales to third party customers and to the Company’s Energy Business Segment. Please refer to the attached
financial tables for intercompany transaction elimination information. Income from operations reflect management’s allocation and
estimate as some services are shared by the Company’s two business segments.


The table below provides the geographic distribution of the net revenue of the MSS business:

MSS Net Revenues Geographic Distribution* (In Millions of U.S. Dollars, Except Percentages)

Q2 2020

% of Net Revenues

Q1 2020

% of Net Revenues

Q2 2019

% of Net Revenues

Asia

261

39

175

30

236

36

Americas

215

32

252

43

181

27

Europe and others

193

29

161

27

244

37

Total

669

100

588

100

661

100

*Excludes sales from the MSS business to the Energy business.

Canadian Solar shipped 2.9 GW of modules to more than 80 countries in the second quarter of 2020. The top five markets of the MSS business ranked by revenues were the U.S., Japan, China, Spain and Australia.

Multi-crystalline modules accounted for 65% of the Company’s module shipments in the second quarter of 2020, and mono-crystalline modules accounted for 35%. The Company has the flexibility to produce both multi-crystalline and mono-crystalline modules, with the mix decision depending on the relative profitability and levelized cost of electricity ("LCOE") of the alternative products.

Energy Business Segment

Energy Business Strategy

Canadian Solar has one of the world’s largest utility-scale solar project development platforms, with a track record of originating, developing, financing, building and bringing into commercial operation over 5.6 GWp of solar power plants across six continents. As a first mover, the Company has acquired extensive experience and built a leadership position in solar project development, with a current total project backlog and pipeline of 15.1 GWp.

Traditionally, the operating model for the Company’s Energy business has been to sell projects when they reach either their notice to proceed date ("NTP") or commercial operation date ("COD"), depending on the optimal exit point for each project based on its specific risk and return profile. In certain cases, the Company has retained a minority ownership interest in order to capture additional operational value throughout the partial ownership holding period, while accelerating capital turnover into developing new solar projects. An example of this is the Canadian Solar Infrastructure Fund ("CSIF"), a publicly traded investment fund akin to a real estate investment trust, holding operating solar assets in Japan. CSIF has been listed on the Tokyo Stock Exchange since 2017 and remains 15%-owned by the Company. In addition to continuing to grow its project backlog and pipeline, the Company is evaluating ways to replicate its successful Japanese strategy in other markets, focusing on those regions with strong energy demand, attractive power prices and project returns, and stable capital markets. There are two key benefits to this approach:

  • It will permit Canadian Solar to capture higher margins while recycling a large portion of capital. Meanwhile, it will allow the Company to build a base of stable and long-term cash flows from power sales, operations and maintenance ("O&M"), asset management and other services; and create new growth opportunities, including energy storage systems integration and optimization.
  • Over time, the addition of more predictable and stable revenues and cash flows from power sales, O&M, asset management and other services will help smooth typical lumpiness associated with the development and sale of solar power projects.

Management targets are to achieve the following project sales and accumulated project ownership retained in the next 5 years:

Energy Business Targets

2020

2021

2022

2023

2024

Annual Project Sales, GWp

1.1-1.3

1.8-2.3

2.4-2.9

3.2-3.7

3.6-4.1

Cumulative Projects Retained (including inventory to be sold), MWp

~30

~130

~410

~760

~960


Note: There are uncertainties regarding the closing dates of project sales in 2020 due to COVID-19 disruptions. Forecasts for annual project sales
include both projects sold at NTP and COD, which have a significant impact on revenue but more limited impact on profits. Final timing and
recognition of project sales may be impacted by various external factors. These targets are subject to change without notice.

To help finance this business strategy, the Company is evaluating ways to create capital partnerships with investors seeking long-term stable cash flows through investments in clean, profitable and countercyclical solar energy infrastructure investments, via public or private investment vehicles. Given the low interest rate environment, management believes the Company’s solar assets are highly attractive to investors seeking stable yields, which will help build sustainable long-term value for Canadian Solar’s shareholders. The Company will make further progress updates as it executes on this strategy.

Project Backlog and Pipeline

As of June 30, 2020, the Company’s total project backlog and pipeline totaled 15.1 GWp, of which the project backlog totaled 4.2 GWp. The backlog includes projects that have passed their Cliff Risk Date and are expected to be built in the next one to four years. A project’s Cliff Risk Date depends on the country where the project is located and is defined as the date on which the project passes the last of the high-risk development stages. This is usually the receipt of all required environmental and regulatory approvals, interconnection agreements, feed-in tariff ("FIT") arrangements and power purchase agreements ("PPAs"). All projects in the current backlog have secured a PPA or FIT or are reasonably assured of securing one.

The Company’s project pipeline totaled 10.9 GWp as of June 30, 2020. The pipeline includes early- to mid-stage project opportunities currently under development but that are yet to be de-risked.

Project Backlog and Pipeline (as of June 30, 2020)

Region

Backlog

Pipeline

Total

North America

1,544

4,101

5,645

Latin America

1,539

3,657

5,196

Europe, the Middle East and Africa ("EMEA")

383

2,148

2,531

Japan

220

0

220

Asia Pacific excluding Japan

547

927

1,474

China

0

80

80

Total

4,233

10,913

15,146

Note: Backlog represents the gross MWp size of projects, including 63 MWp in Latin America and 124
MWp in EMEA that have already been sold to third parties or are not owned by Canadian Solar.


The Company believes there are significant growth opportunities in the solar plus storage market, given declining battery storage costs, higher capacity needs and accelerating retirements of fossil fuel power plants. The Company further believes it is uniquely positioned to deliver solar plus storage solutions to its customers given its integrated business model as a top-tier module technology manufacturer and global project developer, and is committed to expanding its presence in this space.

The table below sets forth the Company’s storage project backlog and pipeline as of June 30, 2020, which almost doubled compared to the previous quarter.

Backlog

Pipeline

Total

Storage (MWh)

1,201

3,482

4,683

Projects in Construction

In addition to its project backlog and pipeline, the Company has 839 MWp of solar projects in construction.

Projects in Construction (as of June 30, 2020)

Region

MWp

Expected COD

North America

32

2020-21

Latin America

732

2020-21

Japan

70

2020-21

Asia Pacific ex. Japan

5

2020

Total

839

Note: Latin America portfolio includes 508 MWp of projects already
sold at NTP, with milestone revenue recognition over the 2019-2021
period.

The Company has a sizable amount of premium, high FIT projects in Japan. The table below sets forth the expected COD schedule of the Company’s project backlog in development and construction in Japan, as of June 30, 2020:

Expected COD Schedule (MWp) 

2020

2021

2022 and
Thereafter

Total

13

66

211

290

Solar Power Plants in Operation

As of June 30, 2020, the Company’s power plants in operation totaled 956 MWp, with an estimated total resale value of approximately $773 million to Canadian Solar. The estimated resale value is based on selling prices that Canadian Solar is currently negotiating or transaction prices of similar assets in the relevant markets.

North America

Latin America

Japan

Asia Pacific ex. Japan

China

Total

216

100

85

96

459

956

Note: The table represents the gross MWp size of the power plants in operation, including 108 MWp in North
America and 26 MWp in Asia Pacific, excluding Japan, already sold to third parties.

Operating Results

The following table presents unaudited select results of operations data of the Company’s Energy business segment for the periods indicated.

Energy Business Segment Financial Results

(In Thousands of U.S. Dollars, Except Percentages and Unless Otherwise Stated)

Three Months Ended

Six Months Ended

June 30, 2020

March 31, 2020

June 30, 2019

June 30, 2020

June 30, 2019

Net revenues

26,661

238,088

374,938

264,749

406,525

Cost of revenues

15,083

148,339

353,529

163,422

375,703

Gross profit

11,578

89,749

21,409

101,327

30,822

Operating expenses

16,074

22,391

26,597

38,465

48,935

Income (loss) from operations

(4,496)

67,358

(5,188)

62,862

(18,113)

Gross margin

43.4%

37.7%

5.7%

38.3%

7.6%

Operating margin

-16.9%

28.3%

-1.4%

23.7%

-4.5%

Business Outlook

The Company’s business outlook is based on management’s current views and estimates given existing market conditions, order book, production capacity, anticipated timing of project sales, and the global economic environment. This outlook is subject to uncertainty with respect to, among other things, final customer demand, project construction and sale schedules, and the global impact of the ongoing COVID-19 pandemic. Management’s views and estimates are subject to change without notice.

For the third quarter of 2020, the Company expects total module shipments to be in the range of 2.9 GW to 3.1 GW, including approximately 300 MW of module shipments to the Company’s own projects that may not be immediately recognized as revenues. Total revenues are expected to be in the range of $840 million to $890 million, with gross margin expected to be between 14% and 16%.

For the full year of 2020, the Company now expects shipments to be in the range of 11 GW to 12 GW.

Management expects the demand in 2021 to be strong, according to various research reports and Canadian Solar’s own sales feedback. At the same time, industry consolidation is set to accelerate as customer preferences become more sophisticated around quality and service, increasingly choosing top tier solar brands.

As a result, Canadian Solar is positioning itself more assertively for returns-accretive growth. The Company is currently planning for 18 GW to 20 GW of shipments in 2021.

Dr. Shawn Qu, Chairman and CEO, commented, "We are encouraged to see demand rebounding globally, as more companies and consumers worldwide insist on sustainable power sources. For our Energy Business, our pipeline growth and project execution are making progress, although uncertainty remains around the timing and recognition of certain project sales. On the MSS side, we expect near-term margin pressure given cost increases from polysilicon supply shortages; however, given our leadership position in premium markets, we are able to share a portion of the higher costs with customers. Importantly, we expect the impact of the polysilicon supply disruption to lessen over the coming quarters as polysilicon suppliers restore their temporarily shut-down capacities and restart some of the currently idled, higher-cost capacities.

We plan to expand our market share as we increase our low-cost manufacturing capacity of high-quality modules, which will be supported by the pre-IPO round of capital raising for our MSS business. The improved access to capital through the expected China listing will help us to further capitalize on accelerating secular growth in solar demand, and to unlock sustainable value for our shareholders."

Changes to the Board of Directors

Mr. Karl Olsoni was nominated by the Company and approved by shareholders as a new independent director during the 2020 Annual Meeting of Shareholders. He will serve on the Audit and Compensation Committees. Mr. Olsoni has served as a strategic advisor to the Board of Directors since January 2020.

Furthermore, the Board of Directors has accepted the resignation of Mr. Robert K. McDermott, who has played an instrumental role in the Company’s success since his appointment as lead independent director in 2006. "On behalf of our Board of Directors and the Company, I thank Bob for his valuable service and contributions and wish him well in future endeavors," said Dr. Qu.

Recent Developments

On August 4, 2020, Canadian Solar announced that it commenced the construction of a 10 MWp solar power plant in Germany.

On July 27, 2020, Canadian Solar announced that a special committee of independent directors of the Company, with the assistance of outside financial and legal advisors, completed a review of strategic alternatives available to the Company and the board of directors of the Company decided to pursue a listing of the Company’s MSS business on either the Shanghai Stock Exchange’s Science and Technology Innovation Board or the Shenzhen Stock Exchange’s ChiNext Market.

On July 21, 2020, Canadian Solar announced its wholly-owned subsidiary Recurrent Energy closed $282 million of debt financing to construct its Maplewood and Maplewood 2 solar power projects totaling 367 MWp in Texas.

On June 23, 2020, Canadian Solar announced it signed two private power purchase agreements with Braskem S.A. and COPEL Energia for a total of 274 MWp of solar power projects in Brazil.

Conference Call Information

The Company will hold a conference call at 8:00 a.m. U.S. Eastern Daylight Time on August 7, 2020 (8:00 p.m., August 7, 2020 in Hong Kong) to discuss the Company’s second quarter 2020 results and business outlook. The dial-in phone number for the live audio call is 1-866-519-4004 (toll-free from the U.S.), +852-3018-6771 (local dial-in from Hong Kong) or +1 845-675-0437 (from international locations). The passcode for the call is 8068256.  A live webcast of the conference call will also be available on the Investor Relations section of Canadian Solar’s website at www.canadiansolar.com.

A replay of the call will be available two hours after the conclusion of the call until 9:00 a.m. U.S. Eastern Daylight Time on Saturday, August 15, 2020 (9:00 p.m., August 15, 2020 in Hong Kong) and can be accessed by dialing +1-855-452-5696 (toll-free from the U.S.), +852-3051-2780 (local dial-in from Hong Kong) or +1-646-254-3697 (from international locations), with passcode 8068256.  A webcast replay will also be available on the investor relations section of Canadian Solar’s at www.canadiansolar.com.

About Canadian Solar Inc.

Canadian Solar was founded in 2001 in Canada and is one of the world’s largest solar power companies. It is a leading manufacturer of solar photovoltaic modules and provider of solar energy solutions and has a geographically diversified pipeline of utility-scale solar power projects in various stages of development. Over the past 19 years, Canadian Solar has successfully delivered over 46 GW of premium-quality, solar photovoltaic modules to customers in over 150 countries. Canadian Solar is one of the most bankable companies in the solar industry, having been publicly listed on NASDAQ since 2006. For additional information about the Company, follow Canadian Solar on LinkedIn or visit www.canadiansolar.com.

Safe Harbor/Forward-Looking Statements

Certain statements in this press release regarding the Company’s expected future shipment volumes, gross margins are forward-looking statements that involve a number of risks and uncertainties that could cause actual results to differ materially. These statements are made under the "Safe Harbor" provisions of the U.S. Private Securities Litigation Reform Act of 1995. In some cases, you can identify forward-looking statements by such terms as "believes," "expects," "anticipates," "intends," "estimates," the negative of these terms, or other comparable terminology. Factors that could cause actual results to differ include general business and economic conditions and the state of the solar industry; volatility, uncertainty, delays and disruptions related to the COVID-19 pandemic; governmental support for the deployment of solar power; future available supplies of high-purity silicon; demand for end-use products by consumers and inventory levels of such products in the supply chain; changes in demand from significant customers; changes in demand from major markets such as Japan, the U.S., India, China and Brazil; changes in customer order patterns; changes in product mix; capacity utilization; level of competition; pricing pressure and declines in average selling prices; delays in new product introduction; delays in utility-scale project approval process; delays in utility-scale project construction; delays in the completion of project sales; continued success in technological innovations and delivery of products with the features customers demand; shortage in supply of materials or capacity requirements; availability of financing; exchange rate fluctuations; litigation and other risks as described in the Company’s SEC filings, including its annual report on Form 20-F filed on April 28, 2020. Although the Company believes that the expectations reflected in the forward-looking statements are reasonable, it cannot guarantee future results, level of activity, performance, or achievements. Investors should not place undue reliance on these forward-looking statements. All information provided in this press release is as of today’s date, unless otherwise stated, and Canadian Solar undertakes no duty to update such information, except as required under applicable law.

FINANCIAL TABLES FOLLOW


The following tables provide unaudited select financial data for the Company’s Module and System Solutions
("MSS") and Energy businesses:

Select Financial Data – Module and System Solutions, and Energy

Three Months Ended June 30, 2020
(In Thousands of U.S. Dollars, Except Percentages)

MSS

Energy

Elimination

Total

Net revenues 

$706,155

$26,661

($36,970)

$695,846

Cost of revenues

557,263

15,083

(23,712)

548,634

Gross profit

148,892

11,578

(13,258)

147,212

Gross margin

21.1%

43.4%

21.2%

Income (loss) from
  operations

63,222

(4,496)

(13,258)

45,468

Select Financial Data – Module and System Solutions, and
Energy

Six Months Ended June 30, 2020
(In Thousands of U.S. Dollars, Except Percentages)

MSS

Energy

Elimination

Total

Net revenues 

$1,395,954

$264,749

($139,222)

$1,521,481

Cost of revenues

1,098,194

163,422

(110,544)

1,151,072

Gross profit

297,760

101,327

(28,678)

370,409

Gross margin

21.3%

38.3%

24.3%

Income (loss) from
  operations

124,720

62,862

(28,678)

158,904


Select Financial Data – Module and System Solutions, and Energy

Three Months Ended

June 30, 2020 

Six Months Ended

June 30, 2020

(In Thousands of U.S. Dollars)

MSS Revenues:

Solar modules and other solar power
products

$ 613,068

$ 1,158,962

Solar system kits

42,901

72,098

EPC services

3,164

3,922

Others (materials and components)

10,052

21,750

Subtotal

$ 669,185

$ 1,256,732

Energy Revenues:

Solar power projects

$ 2,685

$ 230,439

Electricity

1,882

2,930

O&M services

5,027

10,213

Others (EPC and development services)

17,067

21,167

Subtotal

$ 26,661

$ 264,749

Total net revenues

$ 695,846

$ 1,521,481


Canadian Solar Inc.

Unaudited Condensed Consolidated Statements of Operations

(In Thousands of U.S. Dollars, Except Share and Per Share Data and Unless Otherwise Stated)

Three Months Ended

Six Months Ended

June 30,

March 31,

June 30,

June 30,

June 30,

2020

2020

2019

2020

2019

Net revenues

$ 695,846

$ 825,635

$ 1,036,275

$ 1,521,481

$ 1,520,994

Cost of revenues

548,634

602,438

853,633

1,151,072

1,230,913

Gross profit

147,212

223,197

182,642

370,409

290,081

Operating expenses:

Selling expenses

53,463

52,659

45,361

106,122

83,292

General and administrative
expenses

46,354

52,961

65,735

99,315

117,159

Research and development
expenses

10,924

10,056

12,133

20,980

25,298

Other operating income

(8,997)

(5,915)

(1,329)

(14,912)

(3,015)

Total operating expenses

101,744

109,761

121,900

211,505

222,734

Income from operations

45,468

113,436

60,742

158,904

67,347

Other income (expenses):

Interest expense

(16,960)

(19,013)

(20,654)

(35,973)

(42,352)

Interest income

2,081

2,779

4,452

4,859

6,481

Gain (loss) on change in
fair value of derivatives, net

(2,349)

33,109

(12,489)

30,759

(13,748)

Foreign exchange gain
(loss), net

(2,192)

(34,119)

16,415

(36,311)

3,828

Investment income (loss)

1,525

(14,012)

2,002

(12,487)

2,547

Other expenses, net

(17,895)

(31,256)

(10,274)

(49,153)

(43,244)

Income before income taxes and
equity in earnings of
unconsolidated investees

27,573

82,180

50,468

109,751

24,103

Income tax benefit (expense)

(8,899)

29,051

(13,951)

20,154

(6,423)

Equity in earnings of
unconsolidated investees

1,739

16

23,740

1,755

25,721

Net income

20,413

111,247

60,257

131,660

43,401

Less: Net income (loss)
attributable to non-controlling
interests

(191)

616

(2,425)

425

(2,116)

Net income attributable to
Canadian Solar Inc.

$ 20,604

$ 110,631

$ 62,682

$ 131,235

$ 45,517

Earnings per share – basic

$   0.35

$   1.86

$   1.05

$ 2.20

$   0.77

Shares used in computation – basic

59,371,856

59,376,332

59,547,209

59,539,092

59,389,975

Earnings per share – diluted

$   0.34

$   1.84

$   1.04

$ 2.18

$   0.76

Shares used in computation –
diluted

59,793,196

60,084,298

60,260,410

60,127,369

60,272,536


Canadian Solar Inc.

Unaudited Condensed Consolidated Statement of Comprehensive Income

(In Thousands of U.S. Dollars)

 Three Months Ended

Six Months Ended

June 30,

March 31,

June 30,

June 30,

June 30,

2020

2020

2019

2020

2019

Net Income

20,413

111,247

60,257

131,660

43,401

Other comprehensive income (net
of tax of nil):

Foreign currency translation
adjustment

30,997

(45,971)

(11,170)

(14,974)

4,815

De-recognition of commodity hedge
and interest rate swap

4,439

4,439

Loss on changes in fair value of
derivatives

(104)

(4,011)

(3,310)

(4,115)

(5,680)

Comprehensive income

55,745

61,265

45,777

117,010

42,536

Less: comprehensive income(loss)
attributable to non-controlling
interests

3,802

(1,441)

(1,028)

2,361

(5,355)

Comprehensive income
attributable to Canadian Solar Inc.

51,943

62,706

46,805

114,649

47,891


Canadian Solar Inc.

Unaudited Condensed Consolidated Balance Sheets

(In Thousands of U.S. Dollars)

June 30,

December 31,

2020

2019

ASSETS

Current assets:

Cash and cash equivalents

$    578,815

$     668,770

Restricted cash

398,739

526,723

Accounts receivable trade, net

421,691

436,815

Accounts receivable, unbilled

16,096

15,256

Amounts due from related parties

18,052

31,232

Inventories

547,106

554,070

Value added tax recoverable

109,358

108,920

Advances to suppliers

49,504

47,978

Derivative assets

5,989

5,547

Project assets

653,750

604,083

Prepaid expenses and other current assets

397,300

253,542

Total current assets

3,196,400

3,252,936

Restricted cash

16,766

9,927

Property, plant and equipment, net

970,065

1,046,035

Solar power systems, net

49,654

52,957

Deferred tax assets, net

136,267

153,963

Advances to suppliers

41,484

40,897

Prepaid land use right

58,800

60,836

Investments in affiliates

79,322

152,828

Intangible assets, net

22,430

22,791

Project assets

492,519

483,051

Right-of-use assets

30,162

37,733

Other non-current assets

164,661

153,253

TOTAL ASSETS

$    5,258,530

$       5,467,207


Canadian Solar Inc.

Unaudited Condensed Consolidated Balance Sheets (Continued)

(In Thousands of U.S. Dollars)

June 30,

December 31,

2020

2019

Current liabilities:

Short-term borrowings

$    1,015,749

$    933,120

Long-term borrowings on project assets –
current

179,978

286,173

Accounts payable

460,817

585,601

Notes payable

472,000

544,991

Amounts due to related parties

3,989

10,077

Other payables

448,973

446,454

Advance from customers

69,546

134,806

Derivative liabilities

10,461

10,481

Operating lease liabilities

17,218

18,767

Other current liabilities

112,496

121,527

Total current liabilities

2,791,227

3,091,997

Accrued warranty costs

47,280

55,878

Long-term borrowings

580,442

619,477

Derivatives liabilities

5,374

1,841

Liability for uncertain tax positions

15,543

15,353

Deferred tax liabilities

54,689

56,463

Loss contingency accruals

26,828

28,513

Operating lease liabilities

15,523

20,718

Financing liabilities

75,457

76,575

Other non-current liabilities

97,207

75,334

Total LIABILITIES

3,709,570

4,042,149

Equity:

Common shares

686,425

703,806

Treasury stock

(11,845)

Additional paid-in capital

22,989

17,179

Retained earnings

924,836

793,601

Accumulated other comprehensive loss

(126,193)

(109,607)

Total Canadian Solar Inc. shareholders’ equity

1,508,057

1,393,134

Non-controlling interests in subsidiaries

40,903

31,924

TOTAL EQUITY

1,548,960

1,425,058

TOTAL LIABILITIES AND EQUITY

$    5,258,530

$     5,467,207


About Non-GAAP Financial Measures

To supplement its financial disclosures presented in accordance with GAAP, the Company uses non-GAAP measures which are adjusted from the most comparable GAAP measures for certain items as described below. The Company presents non-GAAP net income and diluted earnings per share so that readers can better understand the underlying operating performance of the business before the impact of AD/CVD true-up provisions. The non-GAAP numbers are not measures of financial performance under U.S. GAAP, and should not be considered in isolation or as an alternative to other measures determined in accordance with GAAP. These non-GAAP measures may differ from non-GAAP measures used by other companies, and therefore their comparability may be limited.

Statement of Operations Data:

(In Thousands of U.S. Dollars, Except Share and Per Share Data)

Three Months Ended

Six Months Ended

June 30,

2020

June 30,

2019

June 30,

2020

June 30,

2019

GAAP net income attributable to Canadian
Solar Inc.

20,604

62,682

131,235

45,517

Non-GAAP income adjustment items:

AD/CVD provision true-up

(20,397)

(21,617)

(20,397)

(21,617)

Tax impact

5,054

5,365

5,054

5,365

Non-GAAP net income attributable to
Canadian Solar Inc.

5,261

46,430

115,892

29,265

GAAP income per share – diluted

$ 0.34

$ 1.04

$ 2.18

$ 0.76

Non-GAAP income per share – diluted

$ 0.09

$ 0.77

$ 1.93

$ 0.49

Shares used in computation – diluted

59,793,196

60,260,410

60,127,369

60,272,536


Related Links :

http://www.canadiansolar.com