Tag Archives: ENV

EnviroGold Global Appoints Dr. Mark Thorpe as CEO and Director


ESG and Sustainability Veteran Will Drive Company’s Aggressive Growth Plan.

TORONTO, May 3, 2021 — EnviroGold Global (Can) Ltd. ("EnviroGold Global" or the "Company"), a clean technology company accelerating the world’s transition to a circular resource economy, today announced that its Board of Directors has appointed Dr. Mark Thorpe as Chief Executive Officer and Member of the Board of Directors, effective May 3, 2021.

"Dr. Thorpe is a remarkable leader with the depth of experience, the personal presence and the technical expertise to lead our world class team as we continue to capitalize on the enormous opportunity to sustainably satisfy the world’s increasing demand for precious, critical and strategic metals by transforming mining waste into the future of profitable, responsible resource development," said David Cam, Chairman of EnviroGold Global. "Under Dr. Thorpe’s leadership, we are confident the deployment of our market-ready, technical solutions will accelerate as the Company grows to achieve its full potential, setting the benchmark for ESG – focused corporate performance."

"The outlook for EnviroGold Global and its proprietary processes is extremely bright," said Dr. Thorpe. "There is enormous political, social and economic pressure on mining concerns around the world to remediate mine extraction waste and sustainably supply the mineral and metal resources that are critical to modern infrastructure, technology and investment. With a commercial opportunity measured in the hundreds of billions of dollars, superior proprietary technology and know-how, and a high-margin, scalable business model, EnviroGold Global is strategically positioned to lead the future of a sustainable, circular economy in metals and mining."

Dr. Thorpe brings decades of experience as a senior executive in mining, sustainability and environmental operations with a professional background that includes senior positions at Placer Dome, Golden Star and Torex. Dr. Thorpe is the Vice Chairman of the Canada Mining Innovation Council.

About EnviroGold Global

Headquartered in Toronto, Canada, EnviroGold Global is a clean technology company capitalizing environmental stewardship and sustainably supplying the world’s increasing demand for precious, critical, and strategic metals by profitably reclaiming unrecovered value from mine tailings and resource development waste streams. EnviroGold Global leverages proprietary technology, superior operationalized knowledge, and an agile, efficient culture to recover valuable metals, recharge  resources and accelerate the world’s transition to a sustainable circular resource economy. EnviroGold Global is actively expanding the Company’s significant reprocessing pipeline.

Press Contact

Suzanne Gragg – Press Liaison
Telephone: 571-332-9778
Email: spalmer@graggadv.com

Logo – https://techent.tv/wp-content/uploads/2021/05/envirogold-global-appoints-dr-mark-thorpe-as-ceo-and-director.jpg

Related Links :

https://www.envirogoldglobal.com/

How Dahua Video Monitoring Solution Protects Endangered Species

HANGZHOU, China, April 30, 2021 — Extinction of wildlife species has become a tragic feature of the modern world. Many species around the earth are threatened by environmental challenges from climate change, fire, and pollution. The threat comes also from illegal activities carried out by people, such as poaching and unauthorized hunting and logging. 

Dahua Video Monitoring Solution Protects Endangered Species

Dahua Video Monitoring Solution Protects Endangered Species

Species extinction is more than just a concern of conservationists. The health of our planet depends on preserving the evolutionary path of natural ecosystems; this is what makes human life sustainable. Thankfully, people around the world have begun to pay greater attention. And Dahua Technology is committed to developing and deploying systems that can help.

Dahua’s solutions have been helping to level the playing field for at-risk ecosystems and preserve nearly 50 endangered species. For example, in Qinghai province, Dahua has built several "Ecology Windows" where remote monitoring systems provide real-time monitoring in the five major preservation areas in the province, including the Three River Source, Qinghai Lake, Huangshui Basin, Damu Basin and Qilian Mountains. 

Using intelligent video analytics (such as intelligent detection, tracking and early alerts), Dahua’s technologies not only protect wildlife from immediate threats, but also offer remote monitoring for research purposes. The video metadata is stored in the Qinghai Environmental Cloud Platform, whereas continuously building its observation database to support research on species diversity and other key elements of ecosystem health. 

Experts today use Dahua products to build a better understanding of many endangered species including antelopes, wild donkeys, snow leopards, and Chinese hornbeams, bar-headed geese, black-necked cranes, and Eurasian otters. Collecting precise data about migration activities, for example, gives the scientific community the information it needs to design and deploy better conservation policies and programs.

As a world-leading video-centric smart IoT solution and service provider, Dahua Technology is committed to making the world safer and more secure. Protecting people, protecting endangered species, and protecting the environment are all central to our mission, now and in the future. 

Visit http://www.dahuasecurity.com to learn more and follow us on social media.

Facebook: Dahua Technology                       Twitter: Dahua Technology 
YouTube: Dahua Technology Channel          LinkedIn: Dahua Technology Co. LTD

Media Contact

Vivid
Overseas Media & PR Manager
86-571-28069750
Gu_jun1@dahuatech.com

First servers for data centers certified for sustainability

Like other IT products, data center products come with social and environmental challenges. With Hewlett Packard Enterprise taking the lead, the first servers are now certified according to the rigorous sustainability criteria in TCO Certified.

STOCKHOLM, April 16, 2021TCO Certified is the global leading sustainability certification for IT products. With environmental and social criteria, TCO Certified covers the full lifecycle of the product, including supply chain responsibility, hazardous substances, and circular criteria promoting. This life-cycle approach results in more circular products available for buyers.

First servers for data centers certified for sustainability

Organizations increasingly demand IT products that are more sustainable. The challenge for most purchasers is to verify that sustainability claims made by the IT brands for their products actually are correct. With TCO Certified, independent verification is not optional, it is always included. Compliance with all criteria is independently verified throughout the life of the certificate ensuring that consumers and professional purchasers are given accurate, comparable information.

"Annually more than 20,000 hours are spent verifying products as well as the factories where they’re made according to the criteria in TCO Certified. We know that a mere self-declaration is not enough to drive change — product testing at independent test laboratories and factory inspections by independent auditors are critical," says Sören Enholm, CEO of TCO Development, the organization behind TCO Certified.

Hewlett Packard Enterprise is the first brand whose servers meet the tough criteria in TCO Certified for data center products.

"We expect more brands to follow. The interest in our data center product categories is high, both from the industry looking to apply for TCO Certified for their products, and from the purchasing community asking for products with independently verified sustainability claims," continues Sören Enholm.

"In our Product Finder, you can search for certified products and have access to data backing the sustainability of those products. Our new Product Watcher functions also make it easy for buyers to track sustainability measures and product categories of interest," says Sören Enholm.

Toward sustainable IT products

With over 25 years of experience, TCO Certified is the world-leading sustainability certification for IT products. Our comprehensive criteria are designed to drive social and environmental responsibility throughout the product life cycle. Covering 11 product categories including displays, computers and mobile devices, compliance is independently verified, both pre- and post-certification.

Photo – https://techent.tv/wp-content/uploads/2021/04/first-servers-for-data-centers-certified-for-sustainability.jpg

Contact:
Cassandra Julin
+46(0)702866861
press@tcodevelopment.com 
Press Room

Related Links :

https://tcocertified.com

JinkoSolar Announces Fourth Quarter and Full Year 2020 Financial Results

SHANGRAO, China, April 9, 2021 — JinkoSolar Holding Co., Ltd. ("JinkoSolar" or the "Company") (NYSE: JKS), one of the largest and most innovative solar module manufacturers in the world, today announced its unaudited financial results for the fourth quarter and full year ended December 31, 2020.

Strategic Business Updates

  • Despite extreme challenges, we experienced significant growth in both revenues and shipments for the full year compared with 2019.
  • As of the end of 2020, JinkoSolar became the world’s largest PV manufacturer, with aggregate module of 70GW. We expect shipments to sustain a growth rate of over 30% in 2021.
  • Unrelenting volatility in the industrial value chain underscored the resilience to risk of integrated manufacturers. We adjusted each link of the production process smoothly and flexibly.
  • Our new generation Tiger Pro flagship products will account for 40% to 50% of the total shipments this year, with cumulative orders of over 10 GW.
  • JinkoSolar is leveraging our capacity for technical innovation and our brand reputation built on years of global marketing and excellent service, in order to continue expanding successfully and develop new business models.
  • Uncertainty has had the effect of consolidating the market, with heightened competition among key players. In response we have been optimizing supply chain management throughout the network and partners on an ongoing basis.

Fourth Quarter 2020 Operational and Financial Highlights

  • Quarterly shipments were 5,774 MW, up 27.2% year over year.
  • Total revenues were US$1.44 billion, down 1.1% year over year.
  • Gross profit was US$230.9 million, down 12.9% year over year (or US$206.4 million, down 22.1% year over year[1] if excluding the reversal benefit of Countervailing Duty ("CVD") and Anti-dumping Duty ("ADD")).
  • Gross margin of 16.0%, compared with 17.0% in Q3 2020 and 18.2% in Q4 2019. (Or 14.3%, compared with 17.0% in Q3 2020 and 18.1% in Q4 2019 if excluding the reversal benefit of CVD and ADD).
  • Income from operations of US$11.0 million, down 88.0% year over year. (or loss from operations of US$13.6 million, down 114.9% year over year, if excluding the reversal benefit of CVD and ADD ).
  • Non-GAAP net income of US$5.1 million, down 92.3% year over year.
  • Net loss of US$57.8 million, due to US$65.5 million loss of change in fair value of convertible senior notes and call option, as a result of the sharp rise in stock price for the fourth quarter.

[1] The company recorded the reversal benefit ADD and CVD in aggregate of RMB160.0 million (US$24.5 million) in cost of revenues in the fourth quarter of 2020, compared to RMB1.7 million (US$0.2 million) in the fourth quarter of 2019, based on the final results of the administrative review of the CVD and ADD order published by the U.S. Department of Commerce.

Full Year 2020 Operational and Financial Highlights

  • Annual shipments were 18,771 MW, up 31.4% year over year.
  • Total revenues were US$5.38 billion, up 18.1% year over year.
  • Gross profit was US$945.8 million, up 13.6% year over year (or US$921.3 million, up 15.2% year over year[2] if excluding the reversal benefit of CVD and ADD).
  • Gross margin of 17.6%, compared with 18.3% in full year of 2019. (of 17.1% compared with 17.5% in full year 2019 if excluding the reversal benefit of CVD and ADD).
  • Income from operations of US$273.6 million, up 3.2% year over year (or US$249.0 million up 7.2% if excluding the reversal benefit of CVD and ADD).
  • Non-GAAP net income of US$146.9 million, down 1.2% year over year.
  • Net income of US$35.3 million, including US$111.2 million loss of change in fair value of convertible senior notes and call option, given the sharp rise in stock price for 2020.

[2] The company recorded the reversal benefit of anti-dumping (AD) and countervailing duty (CVD) of RMB160.0 million (US$24.5 million) in cost of revenues in 2020, compared to RMB213.6 million (US$30.7 million) in the 2019, based on the final results of the administrative review of the CVD and ADD order published by the U.S. Department of Commerce.

Mr. Xiande Li, JinkoSolar’s Chairman of the Board of Directors and Chief Executive Officer, commented, "2020 was a very challenging year for the solar industry as global markets were shrouded in uncertainty due to the COVID-19 pandemic. Despite difficult market conditions, we increased our global market share and captured growth opportunities thanks to our resilient network and strategic partnerships along the industry value chain. Gross margin for the fourth quarter was within our expectations and both revenues and shipments for the full year recorded significant growth compared with 2019. We expect total shipments in 2021 to grow over 30%, to be in the range of 25GW to 30GW. By the end of 2021, we expect our in-house annual production capacity of monocrystalline silicon wafers, high efficiency solar cells and modules to reach 33 GW, 27 GW and 37 GW, respectively."

"Since the fourth quarter of 2020, the mismatch between supply and demand continued to drive volatility upstream and downstream.  We predict this scenario will continue into the second quarter of this year. While there are still supply shortages, there is enough polysilicon to support over 180GW of module production and supply is sufficient in most segments of the supply chain. As global installation levels are still likely to increase this year, demand for modules will revive once market prices are stabilized."

"The continuous volatility in the industrial value chain further highlighted the resilience to risk of integrated manufacturers. Meanwhile, economic uncertainties continued to concentrate key players and heightened competition for "survival of the fittest" and rewarded highly adaptive companies to gain more market share. We have been closely monitoring market trends, adjusting with flexibility each link of the production process, and continuously optimizing our supply chain management throughout our network and partners."

"JinkoSolar has long been committed to promoting the acceleration of carbon neutrality through product innovation, operating excellence and collaboration with various partners. In response to rising demand, we have also been actively deploying innovative solutions for the solar+ industries and are working to promote safe and efficient energy systems."

"As the world enters into the era of grid parity, we continue to leverage years of global marketing experience and excellent service to solidify our foothold in major regions worldwide. We have shipped our energy storage products to the Middle East and Africa, and will launch products specifically designed for the U.S. and Japanese markets in the second half of 2021. Meanwhile, our business in the global distribution market is showing a rapid upward trend, and our products for Building Integrated Photovoltaics (BIPV) systems have been installed in a number of commercial real estate projects in China."

Fourth Quarter 2020 Financial Results

Total Revenues

Total revenues in the fourth quarter of 2020 were RMB9.42 billion (US$1.44 billion), an increase of 7.5% from RMB8.77 billion in the third quarter of 2020 and a decrease of 1.1% from RMB9.53 billion in the fourth quarter of 2019. The sequential increase was mainly attributable to an increase in the shipment of solar modules partially offset by a decline in the average selling price of solar modules.

Gross Profit and Gross Margin

Gross profit in the fourth quarter of 2020 was RMB1.51 billion (US$230.9 million) (or RMB1.35 billion if excluding the impact from the Countervailing Duty ("CVD") and Anti-dumping Duty ("ADD") reversal benefit, compared with RMB1.49 billion in the third quarter of 2020 and RMB1.73 billion in the fourth quarter of 2019.

Gross margin was 16.0% in the fourth quarter of 2020 (or 14.3% if excluding the impact from the CVD and ADD reversal benefit), compared with 17.0% in the third quarter of 2020 and 18.2% in the fourth quarter of 2019 (or 18.1% if excluding the impact from the CVD and ADD reversal benefit). The sequential and year-over-year decrease was mainly attributable to (i) a decline in the average selling price of solar modules due to the intensified global market competition of solar modules and (ii) an increase in the cost of raw materials.

Income/(Loss) from Operations and Operating Margin

Income from operations in the fourth quarter of 2020 was RMB71.6 million (US$11.0 million) (or RMB (88.4) million if excluding the impact from CVD and ADD reversal benefit), compared with RMB546.0 million in the third quarter of 2020 and RMB594.8 million in the fourth quarter of 2019 (or RMB593.1 million if excluding the impact from CVD and ADD reversal benefit).

Operating margin was 0.8% (or -0.9% if excluding the impact from CVD and ADD reversal benefit) in the fourth quarter of 2020, compared with 6.2% in the third quarter of 2020 and 6.2% in the fourth quarter of 2019.

Total operating expenses in the fourth quarter of 2020 were RMB1.44 billion (US$220.0 million), an increase of 51.3% from RMB948.9 million in the third quarter of 2020 and an increase of 26.5% from RMB1.13 billion in the fourth quarter of 2019. The sequential and year-over-year increase was mainly attributable to (i) an increase in disposal and impairment loss on property, plant and equipment as a result of the Company’s upgrade of production equipment in the fourth quarter of 2020 with the total amount of RMB230.6 million, (ii) an increase in impairment loss on one overseas solar power project with the amount of RMB93.8 million in the fourth quarter of 2020 (iii) an increase in shipping costs and (iv) an increase of research and development expenditure. 

Total operating expenses accounted for 15.2% of total revenues in the fourth quarter of 2020, compared to 10.8% in the third quarter of 2020 and 11.9% in the fourth quarter of 2019.

Interest Expense, Net

Net interest expense in the fourth quarter of 2020 was RMB115.2 million (US$17.6 million), a decrease of 10.9% from RMB129.2 million in the third quarter of 2020 and an increase of 37.4% from RMB83.8 million in the fourth quarter of 2019. The sequential decrease was mainly due to a decrease of bank acceptance notes discount expense. The year-over-year increases were mainly due to an increase in interest expense with the increase of interest-bearing debts.

Exchange Loss/(Gain) and Change in Fair Value of Foreign Exchange Derivatives

The Company recorded a net exchange loss (including change in fair value of foreign exchange derivatives) of RMB47.9 million (US$7.3 million) in the fourth quarter of 2020, compared to a net exchange loss of RMB63.9 million in the third quarter of 2020 and a net exchange gain of RMB77.9 million in the fourth quarter of 2019. The net exchange loss was mainly due to the depreciation of the U.S. dollars against the RMB (exchange rate of U.S. dollars against RMB dropped from 6.8101 to 6.5249) in the fourth quarter of 2020.

Change in Fair Value of Convertible Senior Notes and Call Option

The Company issued US$85.0 million of 4.5% convertible senior notes due 2024 (the "Notes") in May 2019 and has elected to measure the Notes at fair value derived by valuation model, i.e. Binomial Model. The Company recognized a loss from a change in fair value of the Notes of RMB685.4 million (US$105.0 million) in the fourth quarter of 2020, compared to a loss of RMB593.7 million in the third quarter of 2020 and RMB152.7 million in the fourth quarter of 2019. The change was primarily due to an increase in the Company’s stock price in the fourth quarter of 2020.

Concurrent with the issuance of the Notes in May 2019, the Company entered into a call option transaction with an affiliate of Credit Suisse Securities (USA) LLC. The Company accounted for the call option transaction as freestanding derivative assets in its consolidated balance sheets, which is marked to market during each reporting period. The Company recorded a gain from a change in fair value of the call option of RMB257.8 million (US$39.5 million) in the fourth quarter of 2020, compared to a gain of RMB280.7 million in the third quarter of 2020 and RMB85.6 million in the fourth quarter of 2019. The change was primarily due to an increase in the Company’s stock price in the fourth quarter of 2020.

Equity in Gain/(Loss) of Affiliated Companies

The Company indirectly holds a 20% equity interest in Sweihan PV Power Company P.J.S.C, a developer and operator of solar power projects in Dubai, and accounts for its investment using the equity method. The Company also holds a 30% equity interest in Jiangsu Jinko-Tiansheng Co., Ltd, which processes and assembles PV modules as an OEM manufacturer, and accounts for its investments using the equity method. The Company recorded equity in gain of affiliated companies of RMB19.9 million (US$3.1 million) in the fourth quarter of 2020, compared with a gain of RMB24.7 million in the third quarter of 2020 and a gain of RMB31.8 million in the fourth quarter of 2019. The gain primarily arose from revenue generated from operations in the fourth quarter of 2020.

Income Tax (Expenses)/Benefit

The Company recorded an income tax benefit of RMB23.1 million (US$3.5 million) in the fourth quarter of 2020, compared with an income tax expense of RMB69.2 million in the third quarter of 2020 and an income tax expense of RMB221.0 million in the fourth quarter of 2019.

Net Income/(loss) and Earnings/(loss) per Share

Net loss attributable to the Company’s ordinary shareholders was RMB377.0 million (US$57.8 million) in the fourth quarter of 2020, compared with net income attributable to the Company’s ordinary shareholders of RMB6.9 million in the third quarter of 2020 and RMB369.5 million in the fourth quarter of 2019.

Basic and diluted earnings/(loss) per ordinary share were RMB(2.08) (US$(0.32)) and RMB(3.60) (US$(0.55)), respectively, during the fourth quarter of 2020, compared to RMB0.04 and RMB(1.55) in the third quarter of 2020, RMB2.08 and RMB1.67 in the fourth quarter of 2019. This translates into basic and diluted earnings/(loss) per ADS of RMB(8.32) (US$(1.27)) and RMB(14.40) (US$(2.21)), respectively in the fourth quarter of 2020; RMB0.16 and RMB(6.20) in the third quarter of 2020; RMB8.32 and RMB6.68 in the fourth quarter of 2019.  The difference between basic and diluted loss per share in the fourth quarter of 2020 was mainly due to the dilutive impact of call option.

Non-GAAP net income attributable to the Company’s ordinary shareholders in the fourth quarter of 2020 was RMB33.4 million (US$5.1 million), compared with RMB321.4 million in the third quarter of 2020 and RMB 432.2 million in the fourth quarter of 2019.

Non-GAAP basic and diluted earnings per ordinary share were both RMB0.19 (US$0.03), during the fourth quarter of 2020; RMB1.81 in the third quarter of 2020 and RMB2.43 in the fourth quarter of 2019. This translates into non-GAAP basic and diluted earnings per ADS of both RMB0.74 (US$0.11) in the fourth quarter of 2020; RMB7.22 in the third quarter of 2020 and RMB 9.74 in the fourth quarter of 2019.

Financial Position

As of December 31, 2020, the Company had RMB8.07 billion (US$1.24 billion) in cash and cash equivalents and restricted cash, compared with RMB6.23 billion as of December 31, 2019.

As of December 31, 2020, the Company’s accounts receivables due from third parties were RMB4.53 billion (US$695.0 million), compared with RMB5.27 billion as of December 31, 2019.

As of December 31, 2020, the Company’s inventories were RMB8.38 billion (US$1.28 billion), compared with RMB5.82 billion as of December 31, 2019.

As of December 31, 2020, the Company’s total interest-bearing debts were RMB18.28 billion (US$2.80 billion), of which RMB748.8 million (US$114.8 million) was related to the Company’s overseas downstream solar projects, compared with RMB13.41 billion, of which RMB2.05 billion was related to the Company’s overseas downstream solar projects as of December 31, 2019.

Full Year 2020 Financial Results

Total Revenues

Total revenues for full year 2020 were RMB35.13 billion (US$5.38 billion), an increase of 18.1% from RMB29.75 billion for full year 2019. The increase in total revenues was mainly attributable to an increase in the shipment of solar modules, which was partially offset by a decline in the average selling price of solar modules.

Gross Profit and Gross Margin

Gross profit for full year 2020 was RMB6.17 billion (US$945.8 million), an increase of 13.6% from RMB5.43 billion for full year 2019. Gross margin was 17.6% for full year 2020, compared with 18.3% for full year 2019. The year-over-year increase was mainly attributable to (i) an increase in the shipment of solar modules in 2020, which was partially offset by a decline in the average selling price of solar modules, (ii) an increase in self-produced production volume by increasing shift toward integrated mono-based high-efficiency products capacity, and (iii) the continued reduction of integrated production costs resulting from the Company’s industry-leading integrated cost structure.

Excluding the CVD and ADD reversal benefits, gross margin was 17.1% for full year 2020, compared with 17.5% for full year 2019. The year-over-year decrease was attributable to (i) a decline in the average selling price of solar modules due to the intensified global market competition of solar modules and (ii) an increase in the cost of raw materials.

Income from Operations and Operating Margin

Income from operations for full year 2020 was RMB1.78 billion (US$273.6 million), compared with RMB1.73 billion for full year 2019. Operating margin for full year 2020 was 5.1%, compared with 5.8% for full year 2019.

Total operating expenses for full year 2020 were RMB4.39 billion (US$672.3 million), an increase of 18.5% from RMB3.70 billion for full year 2019. As a percentage of total revenues, operating expenses accounted for 12.5% for full year 2020, compared with 12.4% for full year 2019. The increase in total operating expenses was primarily due to (i) an increase in shipping cost, (ii) an increase in disposal loss on property, plant and equipment as a result of the Company’s upgrade of production equipment and (iii) an increase in impairment loss on one overseas solar power project with the amount of RMB93.8million in the fourth quarter of 2020.

Interest Expense, Net

Net interest expense for full year 2020 was RMB459.2 million (US$70.4 million), an increase of 17.3% from RMB391.6 million for full year 2019. The increase was mainly due to an increase in interest expense with the increase of interest-bearing debts.  

Exchange Loss and Change in Fair Value of Foreign Exchange Derivatives

The Company recorded a net exchange loss (including change in fair value of foreign exchange derivatives) of RMB148.9 million (US$22.8 million) for full year 2020 due primarily to depreciation of US dollars against RMB. The Company recorded a net exchange loss of RMB69.8 million for full year 2019. With the rapid increase in overseas orders, the Company increased its foreign currency hedge ratio to hedge against anticipated cash flow denominated in U.S. dollars over the next six months.

Change in Fair Value of Interest Rate Swap

The Company entered into Interest Rate Swap agreements with several banks for the purpose of reducing interest rate risk exposure. The Company recorded a loss of RMB78.9 million (US$12.1 million) arising from change in fair value of the Interest Rate Swap agreements for full year 2020, compared to a loss of RMB70.0 million for full year 2019. The loss in 2020 was primarily due to a decrease in USD LIBOR rates. The Company did not elect to use hedge accounting for any of its derivatives.

Change in Fair Value of Convertible Senior Notes and Call Option

The Company issued the Notes in May 2019 and has elected to measure them at fair value derived by valuation model, i.e. Binomial Model. The Company recognized a loss from a change in fair value of the Notes of RMB1.20 billion (US$184.2 million) for full year 2020, compared to a loss of RMB114.1 million for full year 2019. The change in 2020 was primarily due to a significant increase in the Company’s stock price in 2020.

Concurrent with the issuance of the Notes in May 2019, the Company entered into a call option transaction with an affiliate of Credit Suisse Securities (USA) LLC. The Company accounted for the call option transaction as freestanding derivative assets in its consolidated balance sheets, which is marked to market at each reporting period. The Company recorded a gain from a change in fair value of the call option of RMB476.3 million (US$73.0 million) for full year 2020, compared to a gain of RMB84.8 million for full year 2019. The change in 2020 was primarily due to a significant increase in the Company’s stock price in 2020.

Equity in (Loss)/Income of Affiliated Companies

The Company indirectly holds a 20% equity interest of Sweihan PV Power Company P.J.S.C, a developer and operator of solar power projects in Dubai, and accounts for its investments using the equity method. The Company also holds a 30% equity interest in Jiangsu Jinko-Tiansheng Co., Ltd, which processes and assembles PV modules as an OEM manufacturer, and accounts for its investments using the equity method. The Company recorded equity in loss of affiliated companies of RMB52.7 million (US$8.1 million) for full year 2020, compared with a loss of RMB48.9 million in 2019. The loss primarily arose from change in fair value of interest rate swap agreements purchased by Sweihan PV Power Company P.J.S.C. due to a continuous decrease in USD LIBOR rates. Hedge accounting was not applied for the derivative.

Income Tax Expense, Net

The Company recognized an income tax expense of RMB178.4 million (US$27.3 million) for full year 2020, compared with an income tax expense of RMB278.0 million in full year 2019.

Net Income and Earnings/(loss) per Share

Net income attributable to the Company’s ordinary shareholders for full year 2020 was RMB230.4 million (US$35.3 million), compared with a net income of RMB898.7 million in full year 2019.

Basic and diluted earnings/(loss) per share for full year 2020 were RMB1.29 (US$0.20) and RMB(1.36) (US$(0.21)), respectively, compared to RMB5.31 and RMB4.85 for full year 2019. This translates into basic and diluted earnings/(loss) per ADS of RMB5.15 (US$0.79) and RMB(5.42) (US$(0.83)), respectively for full year 2020, compared to RMB21.22 and RMB19.40 for full year 2019.

Non-GAAP net income for full year 2020 was RMB958.4 million (US$146.9 million), compared with non-GAAP net income of RMB969.5 million in full year 2019.

Non-GAAP basic and diluted earnings per share for full year 2020 were both RMB5.36 (US$0.82), compared to RMB5.73 for full year 2019, which translates into non-GAAP basic and diluted earnings per ADS of both RMB21.42 (US$3.28) for full year 2020, compared to RMB22.90 for full year 2019.

Fourth Quarter and Full Year 2020 Operational Highlights

Solar Module Shipments

Total solar module shipments in the fourth quarter of 2020 were 5,774 MW.

Total solar module shipments in full year 2020 were 18.8 GW, compared to 14.3 GW in 2019.

Solar Products Production Capacity

As of December 31, 2020, the Company’s in-house annual mono wafer[3], solar cell and solar module production capacity was 22 GW, 11GW (10.2 GW for PERC cells and 800 MW for N type cells) and 31 GW, respectively.

Note:

In addition to the mono wafer, our multi wafer production capacity was 3.5 GW as of September 30, 2020[3]

Operations and Business Outlook

Since installations are still likely to increase, and supply is sufficient in most segments of the supply chain, we anticipate that demand for modules will revive once market prices stabilized. We remain optimistic about global installation levels in 2021.

First Quarter and Full Year 2021 Guidance

The Company’s business outlook is based on management’s current views and estimates with respect to market conditions, production capacity, the Company’s order book and the global economic environment. This outlook is subject to uncertainty on final customer demand and sale schedules. Management’s views and estimates are subject to change without notice.

For the first quarter of 2021, the Company expects total solar module shipments to be in the range of 4.5 GW to 5.0 GW. Total revenue for the first quarter is expected to be in the range of US$1.18 billion to US$1.30 billion. Gross margin for the first quarter is expected to be between 12% and 15%.

For full year 2021, the Company estimates total shipments (including solar cell and wafer) to be in the range of 25 GW to 30 GW.

Solar Products Production Capacity

JinkoSolar expects its annual mono wafer, solar cell and solar module production capacity to reach 33 GW, 27 GW (including 800 MW N-type cells) and 37 GW, respectively, by the end of 2021.

Recent Business Developments

  • In October 2020, JinkoSolar announced the completion of a RMB 3.10 billion equity financing by its principal operating subsidiary Jinko Solar Co., Ltd.
  • In November 2020, JinkoSolar and its subsidiary Sichuan Jinko signed a long-term purchase agreement with second tier subsidiaries of Tongwei Co., Ltd., namely Sichuan Yongxiang Polysilicon Co., Ltd., Sichuan Yongxiang New Energy Co., Ltd., Inner Mongolia Tongwei High-purity Crystalline Silicon Company, and Yunnan Tongwei High-purity Crystalline Silicon Company.
  • In November 2020, JinkoSolar announced the resignation of Mr. Zhiqun Xu as the Company’s Chief Operating Officer and the appointment of Dr. Jiun-Hua Allen Guo as the Company’s new Chief Operating Officer.
  • In November 2020, JinkoSolar’s wholly-owned subsidiary JinkoSolar Sweihan (HK) Limited signed a share and debt purchase agreement with Jinko Power (HK) Company Limited, an indirectly wholly-owned subsidiary of Jinko Power Technology Co., Ltd.
  • In December 2020, JinkoSolar became the sole PV company given the highest AAA rating for credit quality in the Chinese market.
  • In December 2020, JinkoSolar announced that Mr. Longgen Zhang resigned as a director of the board of directors of the Company and Mr. Haiyun (Charlie) Cao was appointed as a director of the Board.
  • In December 2020, "Weekly Toyo Keizai", an authoritative business and finance magazine in Japan, listed JinkoSolar in its latest ranking of "China’s Top 100 New Enterprises".
  • In December 2020, JinkoSolar announced changes to its senior management team, in order to comply with certain business operations and independence requirements of the Shanghai Stock Exchange Science and Technology Innovation Board, in relation to the proposed listing of its principal operating subsidiary, Jinko Solar Co., Ltd. on the STAR Market.
  • In December 2020, JinkoSolar filed a prospectus supplement to sell up to an aggregate of US$100,000,000 of the American depositary shares, each representing four ordinary shares of JinkoSolar, through an at-the-market equity offering program, which had been approved by its board of directors. This offering was completed in January 2021.
  • In January 2021, JinkoSolar won the prestigious PV Magazine Award 2020 in the Module category for its Tiger monofacial module.
  • In February 2021, JinkoSolar and its subsidiaries signed a solar glass procurement contract with Flat Glass Group Co. Ltd., securing approximately 338 million square meters of rolled glass to support the production of 59GW of JinkoSolar’s high-efficient solar modules for three years from 2021 to 2023.
  • In February 2021, JinkoSolar announced that it intends to sign a "strategic cooperation agreement" with Tongwei Co., Ltd. to jointly invest in a high-purity crystalline silicon project with annual capacity of 45,000 metric tons and a silicon wafer project with an annual production capacity of 15GW, as well as develop a more extensive industrial chain cooperation.
  • In February 2021, JinkoSolar won the Green Builder Media’s 2021 Green Innovation award.
  • In March 2021, JinkoSolar adopted a 2021 equity incentive plan with a ten-year term. The plan has a maximum number of 2,600,000 ordinary shares of the Company available for issuance pursuant to all awards under the 2021 Plan, including options, restricted shares and other share-based awards.

Conference Call Information

JinkoSolar’s management will host an earnings conference call on Friday, April 9, 2021 at 8:00 a.m. U.S. Eastern Time (8:00 p.m. Beijing / Hong Kong the same day)..

Dial-in details for the earnings conference call are as follows:

Hong Kong / International:

+852 3027 6500

U.S. Toll Free:

+1 855-824-5644

Passcode:

73382078#

Please dial in 10 minutes before the call is scheduled to begin and provide the passcode to join the call.

A telephone replay of the call will be available 2 hours after the conclusion of the conference call through 23:59 U.S. Eastern Time, April 16, 2021. The dial-in details for the replay are as follows:

International:

+61 2 8325 2405

U.S.:

+1 646 982 0473

Passcode:

319340208#

Additionally, a live and archived webcast of the conference call will be available on the Investor Relations section of JinkoSolar’s website at www.jinkosolar.com.

About JinkoSolar Holding Co., Ltd.

JinkoSolar (NYSE: JKS) is one of the largest and most innovative solar module manufacturers in the world. JinkoSolar distributes its solar products and sells its solutions and services to a diversified international utility, commercial and residential customer base in China, the United States, Japan, Germany, the United Kingdom, Chile, South Africa, India, Mexico, Brazil, the United Arab Emirates, Italy, Spain, France, Belgium, and other countries and regions. JinkoSolar has built a vertically integrated solar product value chain, with an integrated annual capacity of 20 GW for mono wafers, 11 GW for solar cells, and 30 GW for solar modules, as of December 31, 2020.

JinkoSolar has 9 productions facilities globally, 21 overseas subsidiaries in Japan, South Korea, Vietnam, India, Turkey, Germany, Italy, Switzerland, United States, Mexico, Brazil, Chile, Australia, Portugal, Canada, Malaysia, UAE, Kenya, Hong Kong, Denmark, and global sales teams in China, United Kingdom, France, Spain, Bulgaria, Greece, Ukraine, Jordan, Saudi Arabia, Tunisia, Morocco, Kenya, South Africa, Costa Rica, Colombia, Panama, Kazakhstan, Malaysia, Myanmar, Sri Lanka, Thailand, Vietnam, Poland and Argentina, as of September 30, 2020.

To find out more, please see: www.jinkosolar.com

Use of Non-GAAP Financial Measures

To supplement its consolidated financial results presented in accordance with United States Generally Accepted Accounting Principles ("GAAP"), JinkoSolar uses certain non-GAAP financial measures including, non-GAAP net income, non-GAAP earnings per Share, and non-GAAP earnings per ADS, which are adjusted from the comparable GAAP results to exclude certain expenses or incremental ordinary shares relating to share-based compensation, convertible senior notes and call option:

  • Non-GAAP net income is adjusted to exclude the expenses relating to issuance cost of convertible senior notes, change in fair value of convertible senior notes and call option, interest expenses of convertible senior notes and call option, exchange (gain)/loss on the convertible senior notes and call option, and stock-based compensation (benefit)/expense; given these Non-GAAP net income adjustments above are either related to the Company or its subsidiaries incorporated in Cayman Islands, which are not subject to tax exposures, or related to those subsidiaries with tax loss positions which result in no tax impacts, therefore no tax adjustment is needed in conjunction with these Non-GAAP net income adjustments; and
  • Non-GAAP earnings per share and non-GAAP earnings per ADS are adjusted to exclude the expenses relating to issuance cost of convertible senior notes, change in fair value of convertible senior notes and call option, interest expenses of convertible senior notes and call option, exchange gain on the convertible senior notes and call option, and stock-based compensation. As the Non-GAAP net income is adjusted to exclude the change in fair value of call option, the dilutive impact of call option, if any, is also excluded from the denominator for the calculation of Non-GAAP earnings per share and non-GAAP earnings per ADS.

The Company believes that the use of non-GAAP information is useful for analysts and investors to evaluate JinkoSolar’s current and future performances based on a more meaningful comparison of net income and diluted net income per ADS when compared with its peers and historical results from prior periods. These measures are not intended to represent or substitute numbers as measured under GAAP. The submission of non-GAAP numbers is voluntary and should be reviewed together with GAAP results.

Impact of the Recently Adopted Major Accounting Pronouncement

The Company adopted the update of ASU No. 2016-13, Financial Instruments – Credit Losses (Topic 326): "Measurement of Credit Losses on Financial Instruments" on January 1, 2020.

Upon adoption of ASC 326 on January 1, 2020, the Company used the modified retrospective transition method through a RMB6.6 million cumulative-effect increase to retained earnings, among which RMB30.9 million was related to the decrease of allowance for accounts receivables-third parties, RMB15.0 million was related to the increase of allowance for accounts receivables- related parties and RMB9.3 million was related to the increase of allowance for other receivables and other current/non-current assets. The adoption of the new guidance did not have a material impact to the Company’s consolidated financial statements.

Currency Convenience Translation

The conversion of Renminbi into U.S. dollars in this release, made solely for the convenience of the readers, is based on the noon buying rate in the city of New York for cable transfers of Renminbi as certified for customs purposes by the Federal Reserve Bank of New York as of December 31, 2020, which was RMB6.5250 to US$1.00. No representation is intended to imply that the Renminbi amounts could have been, or could be, converted, realized, or settled into U.S. dollars at that rate or any other rate. The percentages stated in this press release are calculated based on Renminbi.

Safe-Harbor Statement

This press release contains forward-looking statements. These statements constitute "forward-looking" statements within the meaning of Section 27A of the Securities Act of 1933, as amended, and Section 21E of the Securities Exchange Act of 1934, as amended, and as defined in the U.S. Private Securities Litigation Reform Act of 1995. These forward-looking statements can be identified by terminology such as "will," "expects," "anticipates," "future," "intends, "plans," "believes," "estimates" and similar statements. Among other things, the quotations from management in this press release and the Company’s operations and business outlook, contain forward-looking statements. Such statements involve certain risks and uncertainties that could cause actual results to differ materially from those in the forward-looking statements. Further information regarding these and other risks is included in JinkoSolar’s filings with the U.S. Securities and Exchange Commission, including its annual report on Form 20-F. Except as required by law, the Company does not undertake any obligation to update any forward-looking statements, whether as a result of new information, future events or otherwise.

For investor and media inquiries, please contact:

In China:
Ms. Stella Wang
JinkoSolar Holding Co., Ltd.
Tel: +86 21- 5180-8777 ext.7806
Email: ir@jinkosolar.com

Rene Vanguestaine
Christensen
Tel: +86 178 1749 0483
Email: rvanguestaine@ChristensenIR.com

In the U.S.:
Ms. Linda Bergkamp
Christensen
Tel: +1-480-614-3004
Email: lbergkamp@ChristensenIR.com

UNAUDITED CONDENSED CONSOLIDATED STATEMENTS OF OPERATIONS

(in thousands, except ADS and Share data)

2019

2020

RMB

RMB

USD

 Revenues from third parties 

29,592,010

35,067,287

5,374,297

 Revenues from related parties 

154,278

62,172

9,528

 Total revenues 

29,746,288

35,129,459

5,383,825

 Cost of revenues 

(24,314,602)

(28,957,798)

(4,437,977)

 Gross profit 

5,431,686

6,171,661

945,848

 Operating expenses: 

   Selling and marketing 

(2,250,336)

(2,473,980)

(379,154)

   General and administrative 

(1,059,025)

(1,409,371)

(215,996)

   Research and development 

(324,435)

(389,192)

(59,646)

   Impairment of long-lived assets 

(68,262)

(114,168)

(17,497)

 Total operating expenses 

(3,702,058)

(4,386,711)

(672,293)

 Income from operations 

1,729,628

1,784,950

273,555

 Interest expenses, net 

(391,582)

(459,234)

(70,381)

 Subsidy income 

63,017

191,981

29,422

 Exchange gain/(loss) 

8,809

(336,523)

(51,574)

 Change in fair value of interest rate
swap 

(69,974)

(78,878)

(12,089)

 Change in fair value of foreign
exchange derivatives 

(78,615)

187,578

28,748

 Convertible senior notes issuance
costs 

(18,646)

 Change in fair value of convertible
senior notes and call option 

(29,257)

(725,792)

(111,232)

 Other income, net 

17,873

2,292

351

 Gain on disposal of subsidiaries 

19,935

 Income before income taxes

1,251,188

566,374

86,800

 Income tax expense 

(277,979)

(178,411)

(27,343)

 Equity in loss of affiliated companies 

(48,855)

(52,706)

(8,078)

 Net income 

924,354

335,257

51,379

 Less: Net income attributable to non-
controlling interests 

25,690

104,871

16,072

 Net income attributable to JinkoSolar
 Holding Co., Ltd.’s ordinary
shareholders 

898,664

230,386

35,307

 Net income/(loss) attributable to
JinkoSolar Holding Co., Ltd.’s
 ordinary shareholders per share: 

   Basic 

5.31

1.29

0.20

   Diluted 

4.85

(1.36)

(0.21)

 Net income/(loss) attributable to
JinkoSolar Holding Co., Ltd.’s
 ordinary shareholders per ADS: 

   Basic 

21.22

5.15

0.79

   Diluted 

19.40

(5.42)

(0.83)

 Weighted average ordinary shares
outstanding: 

   Basic 

169,363,306

178,938,853

178,938,853

   Diluted 

166,567,757

171,438,853

171,438,853

 Weighted average ADS outstanding: 

   Basic 

42,340,827

44,734,713

44,734,713

   Diluted 

41,641,939

42,859,713

42,859,713

UNAUDITED CONDENSED CONSOLIDATED STATEMENT OF
COMPREHENSIVE INCOME

 Net income 

924,354

335,257

51,379

 Other comprehensive income/(loss): 

   -Foreign currency translation
adjustments 

13,741

(251,894)

(38,604)

   -Change in the instrument-specific
credit risk 

(21,090)

60,326

9,245

 Comprehensive income 

917,005

143,689

22,020

 Less: Comprehensive income
attributable to non-controlling
interests 

25,690

104,871

16,072

 Comprehensive income attributable
to JinkoSolar Holding Co., Ltd.’s
ordinary shareholders 

891,315

38,818

5,948

 Reconciliation of GAAP and non-
GAAP Results 

 1. Non-GAAP earnings per share
and non-GAAP earnings per ADS 

 GAAP net income attributable to
ordinary shareholders 

898,664

230,386

35,307

 Convertible senior notes issuance
costs 

18,646

 Change in fair value of convertible
senior notes and call option 

29,257

725,792

111,232

 Net interest expenses of convertible
senior notes and call option 

15,384

26,614

4,079

 Exchange loss/(gain) on convertible
senior notes and call option 

3,002

(25,347)

(3,885)

 Stock-based compensation
expense 

4,578

923

141

 Non-GAAP net income attributable
to ordinary shareholders 

969,531

958,368

146,874

 Non-GAAP earnings per share
attributable to ordinary shareholders – 

   Basic 

5.73

5.36

0.82

   Diluted 

5.73

5.36

0.82

 Non-GAAP earnings per ADS
attributable to ordinary shareholders – 

   Basic 

22.90

21.42

3.28

   Diluted 

22.90

21.42

3.28

 Non-GAAP weighted average
ordinary shares outstanding  

   Basic 

169,363,306

178,938,853

178,938,853

   Diluted 

169,363,306

178,938,853

178,938,853

 Non-GAAP weighted average ADS
outstanding  

   Basic 

42,340,827

44,734,713

44,734,713

   Diluted 

42,340,827

44,734,713

44,734,713


JINKOSOLAR HOLDING CO., LTD. 

UNAUDITED CONDENSED CONSOLIDATED STATEMENTS OF OPERATIONS

(in thousands, except ADS and Share data)

For the quarter ended

December 31, 2019

September 30, 2020

December 31, 2020

RMB

RMB

RMB

USD

 Revenues from third parties 

9,528,920

8,768,376

9,418,979

1,443,522

 Revenues from related parties 

538

1,919

5,599

858

 Total revenues 

9,529,458

8,770,295

9,424,578

1,444,380

 Cost of revenues 

(7,799,733)

(7,275,366)

(7,917,667)

(1,213,436)

 Gross profit 

1,729,725

1,494,929

1,506,911

230,944

 Operating expenses: 

   Selling and marketing 

(632,871)

(498,221)

(652,751)

(100,038)

   General and administrative 

(342,048)

(345,228)

(531,097)

(81,394)

   Research and development 

(91,740)

(105,445)

(137,320)

(21,045)

   Impairment of long-lived assets 

(68,262)

(114,168)

(17,497)

 Total operating expenses 

(1,134,921)

(948,894)

(1,435,336)

(219,974)

 Income from operations 

594,804

546,035

71,575

10,970

 Interest expenses, net 

(83,826)

(129,221)

(115,161)

(17,649)

 Subsidy income 

14,366

62,839

109,702

16,812

 Exchange loss  

(14,003)

(175,650)

(223,439)

(34,243)

 Change in fair value of interest rate
swap 

24,466

 Change in fair value of foreign
exchange derivatives 

91,889

111,710

175,521

26,900

 Change in fair value of convertible
senior notes and call option 

(67,119)

(312,992)

(427,624)

(65,536)

 Other income/(expense), net 

1,432

(1,409)

3,762

577

 Gain on disposal of subsidiaries 

19,935

 Income/(loss) before income taxes

581,944

101,312

(405,664)

(62,169)

 Income Tax (Expenses)/Benefit 

(220,993)

(69,226)

23,089

3,539

 Equity in gain of affiliated companies 

31,780

24,704

19,906

3,051

 Net income/(loss) 

392,731

56,790

(362,669)

(55,579)

 Less: Net income attributable to non-
controlling interests 

23,225

49,937

14,282

2,189

 Net income/(loss) attributable to
JinkoSolar  Holding Co., Ltd.’s
ordinary shareholders 

369,506

6,853

(376,951)

(57,768)

 Net income/(loss) attributable to
JinkoSolar Holding Co., Ltd.’s
 ordinary shareholders per share: 

   Basic 

2.08

0.04

(2.08)

(0.32)

   Diluted 

1.67

(1.55)

(3.60)

(0.55)

 Net income/(loss) attributable to
JinkoSolar Holding Co., Ltd.’s
   ordinary shareholders per ADS: 

   Basic 

8.32

0.16

(8.32)

(1.27)

   Diluted 

6.68

(6.20)

(14.40)

(2.21)

 Weighted average ordinary shares
outstanding: 

   Basic 

177,524,685

177,992,073

181,285,886

181,285,886

   Diluted 

171,509,296

170,492,073

173,785,886

173,785,886

 Weighted average ADS outstanding: 

   Basic 

44,381,171

44,498,018

45,321,472

45,321,472

   Diluted 

42,877,324

42,623,018

43,446,472

43,446,472

UNAUDITED CONDENSED CONSOLIDATED STATEMENT OF COMPREHENSIVE INCOME

 Net income/(loss) 

392,731

56,790

(362,669)

(55,579)

 Other comprehensive income/(loss): 

   -Foreign currency translation
adjustments 

(21,970)

(100,718)

(187,456)

(28,729)

   -Change in the instrument-specific
credit risk 

(26,579)

(36,727)

71,330

10,932

 Comprehensive income/(loss) 

344,182

(80,655)

(478,795)

(73,376)

 Less: Comprehensive income
attributable to non-controlling
interests 

23,225

49,937

14,282

2,189

 Comprehensive income/(loss)
attributable to JinkoSolar Holding Co.,
Ltd.’s ordinary shareholders 

320,957

(130,592)

(493,077)

(75,565)

 Reconciliation of GAAP and non-
GAAP Results 

 1. Non-GAAP earnings per share
and non-GAAP earnings per ADS 

 GAAP net income/(loss) attributable
to ordinary shareholders 

369,506

6,853

(376,951)

(57,768)

 Convertible senior notes issuance
costs 

 Change in fair value of convertible
senior notes and call option 

67,119

312,992

427,624

65,536

 Net interest expenses of convertible
senior notes and call option 

6,281

7,217

6,535

1,002

 Exchange gain on convertible senior
notes and call option 

(4,112)

(5,904)

(23,816)

(3,650)

 Stock-based compensation
(benefit)/expense 

(6,630)

194

56

9

 Non-GAAP net income attributable to
ordinary shareholders 

432,164

321,352

33,448

5,129

 Non-GAAP earnings per share
attributable to ordinary shareholders – 

   Basic 

2.43

1.81

0.19

0.03

   Diluted 

2.43

1.81

0.19

0.03

 Non-GAAP earnings per ADS
attributable to ordinary shareholders – 

   Basic 

9.74

7.22

0.74

0.11

   Diluted 

9.74

7.22

0.74

0.11

 Non-GAAP weighted average
ordinary shares outstanding  

   Basic 

177,524,685

177,992,073

181,285,886

181,285,886

   Diluted 

177,524,685

177,992,073

181,285,886

181,285,886

 Non-GAAP weighted average ADS
outstanding  

   Basic 

44,381,171

44,498,018

45,321,472

45,321,472

   Diluted 

44,381,171

44,498,018

45,321,472

45,321,472


JINKOSOLAR HOLDING CO., LTD. 

UNAUDITED CONDENSED CONSOLIDATED BALANCE SHEETS

(in thousands)

December 31, 2019

December 31, 2020

RMB

RMB

USD

ASSETS

Current assets:

  Cash and cash equivalents

5,653,854

7,481,678

1,146,617

  Restricted cash 

576,546

593,094

90,896

  Restricted short-term investments

6,930,502

6,400,637

980,941

  Short-term investments

570,000

87,356

  Accounts receivable, net – related parties

520,504

410,358

62,890

  Accounts receivable, net – third parties

5,266,351

4,534,758

694,982

  Notes receivable, net – related parties

18,629

33,001

5,058

  Notes receivable, net – third parties

1,529,801

1,051,561

161,159

  Advances to suppliers, net – third parties

2,522,373

1,002,613

153,657

  Inventories, net

5,818,789

8,376,936

1,283,822

  Forward contract receivables

52,281

183,146

28,068

  Prepayments and other current assets, net – related parties

54,318

23,756

3,641

  Prepayments and other current assets, net

1,573,482

3,020,592

462,926

  Held-for-sale assets

1,170,818

Total current assets

31,688,248

33,682,130

5,162,013

Non-current assets:

  Restricted cash

531,158

1,389,194

212,903

  Accounts receivable, net – third parties

26,405

4,047

  Project Assets

798,243

645,355

98,905

  Long-term investments

278,021

194,258

29,771

  Property, plant and equipment, net

10,208,205

12,455,444

1,908,880

  Land use rights, net

597,922

760,962

116,623

  Intangible assets, net

36,395

35,838

5,492

  Financing lease right-of-use assets, net

1,259,713

829,122

127,069

  Operating lease right-of-use assets, net

317,904

316,512

48,507

  Deferred tax assets 

271,286

255,107

39,097

  Call Option – concurrent with issuance of convertible
  senior notes

294,178

756,929

116,004

  Other assets, net – related parties

96,753

107,319

16,447

  Other assets, net – third parties

1,466,692

1,777,799

272,460

Total non-current assets

16,156,470

19,550,244

2,996,205

Total assets

47,844,718

53,232,374

8,158,218

LIABILITIES

Current liabilities:

  Accounts payable – related parties

36,310

14,114

2,163

  Accounts payable – third parties

4,952,630

4,436,495

679,923

  Notes payable – third parties

7,518,570

9,334,876

1,430,632

  Accrued payroll and welfare expenses

879,465

995,054

152,499

  Advances from related parties

749

  Advances from  third parties

4,350,380

2,451,495

375,708

  Income tax payable

117,422

73,720

11,298

  Other payables and accruals

3,055,928

3,408,391

522,359

  Other payables due to related parties

13,127

71,515

10,960

  Forward contract payables

3,857

17,895

2,743

  Convertible senior notes – current

1,831,612

280,707

  Financing lease liabilities – current

227,613

272,330

41,736

  Operating lease liabilities – current

40,043

48,244

7,394

  Short-term borrowings from third parties,
     including current portion of long-term bank
     borrowings

9,047,250

8,238,531

1,262,610

  Guarantee liabilities to related parties

25,688

22,519

3,451

  Held-for-sale liabilities

1,008,196

Total current liabilities

31,277,228

31,216,791

4,784,183

Non-current liabilities:

  Long-term borrowings

1,586,187

7,301,536

1,119,009

  Convertible senior notes

728,216

  Accrued warranty costs – non current

651,968

769,332

117,905

  Financing lease liabilities

583,491

313,088

47,983

  Operating lease liabilities

279,534

277,239

42,489

  Deferred tax liability

250,734

328,713

50,377

  Long-term Payables

97

15

  Guarantee liabilities to related parties 
   – non current

46,332

34,812

5,335

Total non-current liabilities

4,126,462

9,024,817

1,383,113

Total liabilities

35,403,690

40,241,608

6,167,296

SHAREHOLDERS’ EQUITY

Ordinary shares (US$0.00002 par value, 500,000,000
shares authorized, 180,653,497 and 190,380,309 shares
issued as of December 31, 2019 and December 31, 2020,
respectively)

25

26

4

Additional paid-in capital

4,582,850

5,251,245

804,789

Subscription Receivable

Statutory reserves

689,707

692,009

106,055

Accumulated other comprehensive income

62,952

(128,615)

(19,711)

Treasury stock, at cost; 1,723,200 and 2,945,840 ordinary
shares as of  December 31, 2019 and December 31, 2020,
respectively

(13,876)

(43,170)

(6,616)

Accumulated retained earnings

3,981,661

4,216,353

646,184

Total JinkoSolar Holding Co., Ltd. shareholders’ equity

9,303,319

9,987,848

1,530,705

Non-controlling interests

3,137,709

3,002,918

460,217

Total liabilities and shareholders’ equity

47,844,718

53,232,374

8,158,218


Related Links :

http://www.jinkosolar.com

XELS launches eco-conscious blockchain platform for carbon offset credits


TOKYO, April 7, 2021 — XELS, a startup that hopes to tackle climate change by increasing participation and transparency in carbon markets, has launched its blockchain-based carbon offset platform. The company is initially focused on voluntary carbon offset credits, which are increasingly attractive to companies that want to show consumers they’re serious about reducing their carbon footprint.

Since the birth of carbon markets following the Kyoto Protocol and Paris Agreement, fraud has hindered the effectiveness of carbon credit sales and trading. Bad actors sometimes sell fake or expired credits, and "recycling" fraud had led to the double spending of unretired credits. Carbon markets are the perfect use case for blockchain’s distributed ledger technology, as transactions cannot be modified, reversed, or duplicated. Carbon credits that exist on the blockchain can also be "burned," with a publicly visible record proving it has been retired forever.

"We believe that decentralization is the only way that carbon markets can work effectively," explains XELS founder and CEO Takeshi Nojima. "XELS will enable the industry to maintain open, transparent records – from generation, to sale, to retirement. Making it easy for corporations to transparently offset their carbon without fear of fraud will make them even more willing to combat global warming, and it will pay dividends as far as consumer trust that they’re truly intent on making a difference for the environment."

In addition to putting voluntary carbon credits on the blockchain, the company also seeks to offer "compliance" credits, which are heavily regulated under national cap and trade agreements. Japan lags behind European nations, where businesses are compelled to buy compliance credits to avoid heavy taxes. XELS is already in talks with numerous listed companies in Japan that are keen to get on board with Prime Minister Yoshihide Suga’s target of reaching net zero domestic emissions by 2050.

XELS is cognizant of concerns surrounding the high energy consumption associated with popular incumbent blockchains. Later this year, XELS will migrate its platform to a proprietary, low-energy blockchain that the company has been developing since 2017. XELS Chain takes a hybrid proof-of-stake and proof-of-work approach, while enabling users to run a full node on a basic laptop without the need for power-hungry mining hardware.

XELS, based dually in Tokyo and Hong Kong, is a member of the Climate Chain Coalition.

Learn more about XELS at www.xels.io

For media inquiries, please contact pr@xels.io


JinkoSolar to Report Fourth Quarter and Full Year 2020 Results on April 9, 2021

SHANGRAO, China, March 26, 2021 — JinkoSolar Holding Co., Ltd. ("JinkoSolar" or the "Company") (NYSE: JKS), one of the largest and most innovative solar module manufacturers in the world, today announced that it plans to release its unaudited financial results for the fourth quarter and full year ended December 31, 2020 before the open of U.S. markets on Friday, April 9, 2021.

JinkoSolar’s management will host an earnings conference call on Friday, April 9, 2021 at 8:00 a.m. U.S. Eastern Time (8:00 p.m. Beijing / Hong Kong the same day).

Dial-in details for the earnings conference call are as follows:

Hong Kong / International:

+852 3027 6500

U.S. Toll Free:

+1 855-824-5644

Passcode:

73382078#

Please dial in 10 minutes before the call is scheduled to begin and provide the passcode to join the call.

A telephone replay of the call will be available 2 hours after the conclusion of the conference call through 23:59 U.S. Eastern Time, April 16, 2021. The dial-in details for the replay are as follows:

International:

+61 2 8325 2405

U.S.:

+1 646 982 0473

Passcode:

319340208#

Additionally, a live and archived webcast of the conference call will be available on the Investor Relations section of JinkoSolar’s website at http://www.jinkosolar.com.

About JinkoSolar Holding Co., Ltd.

JinkoSolar (NYSE: JKS) is one of the largest and most innovative solar module manufacturers in the world. JinkoSolar distributes its solar products and sells its solutions and services to a diversified international utility, commercial and residential customer base in China, the United States, Japan, Germany, the United Kingdom, Chile, South Africa, India, Mexico, Brazil, the United Arab Emirates, Italy, Spain, France, Belgium, and other countries and regions. JinkoSolar has built a vertically integrated solar product value chain, with an integrated annual capacity of 20 GW for mono wafers, 11 GW for solar cells, and 25 GW for solar modules, as of September 30, 2020.

JinkoSolar has 9 productions facilities globally, 20 overseas subsidiaries in Japan, South Korea, Vietnam, India, Turkey, Germany, Italy, Switzerland, United States, Mexico, Brazil, Chile, Australia, Portugal, Canada, Malaysia, UAE, Kenya, Denmark, and global sales teams in China, United Kingdom, France, Spain, Bulgaria, Greece, Ukraine, Jordan, Saudi Arabia, Tunisia, Morocco, Kenya, South Africa, Costa Rica, Colombia, Panama, Kazakhstan, Malaysia, Myanmar, Sri Lanka, Thailand, Vietnam, Poland and Argentina, as of September 30, 2020.

To find out more, please see: www.jinkosolar.com

Safe Harbor Statement

This press release contains forward-looking statements. These statements constitute "forward-looking" statements within the meaning of Section 27A of the Securities Act of 1933, as amended, and Section 21E of the Securities Exchange Act of 1934, as amended, and as defined in the U.S. Private Securities Litigation Reform Act of 1995. These forward-looking statements can be identified by terminology such as "will," "expects," "anticipates," "future," "intends, "plans," "believes," "estimates" and similar statements. Among other things, the quotations from management in this press release and the Company’s operations and business outlook, contain forward-looking statements. Such statements involve certain risks and uncertainties that could cause actual results to differ materially from those in the forward-looking statements. Further information regarding these and other risks is included in JinkoSolar’s filings with the U.S. Securities and Exchange Commission, including its annual report on Form 20-F. Except as required by law, the Company does not undertake any obligation to update any forward-looking statements, whether as a result of new information, future events or otherwise.

For investor and media inquiries, please contact:

In China:

Ms. Stella Wang
JinkoSolar Holding Co., Ltd.
Tel: +86 21-5180-8777 ext.7806
Email: ir@jinkosolar.com

Mr. Rene Vanguestaine
Christensen
Tel: + 86 178 1749 0483
Email: rvanguestaine@ChristensenIR.com

In the U.S.:

Ms. Linda Bergkamp
Christensen, Scottsdale, Arizona
Tel: +1-480-614-3004
Email: lbergkamp@ChristensenIR.com

Related Links :

http://www.jinkosolar.com

ReneSola Power Announces Fourth Quarter and Full Year 2020 Financial Results

— Reports Net Profits in Fourth Quarter and Full Year 2020

— Enters 2021 Well-Capitalized for Growth

STAMFORD, Conn., March 26, 2021 — ReneSola Ltd ("ReneSola Power" or the "Company") (www.renesolapower.com) (NYSE: SOL), a leading fully integrated solar project developer, today announced its unaudited financial results for the fourth quarter and full year ended December 31, 2020. ReneSola Power’s fourth quarter and full year 2020 financial results and management commentary can be found by accessing the Company’s shareholder letter on the quarterly results page of the Investor Relations section of ReneSola Power’s website at: http://ir.renesolapower.com.

ReneSola Power will hold a conference call today to discuss results and to provide an update on the business.

Conference Call Details

ReneSola Power’s management will hold a conference call today, March 26, 2021 at 8:30 a.m. U.S. Eastern Time (8:30 p.m. China Standard Time) to discuss financial results. 

Please register in advance to join the conference call using the link provided below and dial in 10 minutes before the call is scheduled to begin. Conference call access information will be provided upon registration.

Participant Online Registration: http://apac.directeventreg.com/registration/event/7836968

A replay of the conference call may be accessed by phone at the following numbers until April 3, 2021. To access the replay, please reference the conference ID 7836968.

Phone Number

Toll-Free Number

United States

+1 (646) 254-3697

+1 (855) 452-5696

Hong Kong

+852 3051-2780

+852 8009-63117

Mainland China

+86 (800) 870-0206

+86 (400) 602-2065

Other International

+61 (2) 8199-0299

A webcast of the conference call will be available on the ReneSola Power website at http://ir.renesolapower.com.

About ReneSola Power

ReneSola Power (NYSE: SOL) is a leading global solar project developer and operator. The Company focuses on solar power project development, construction management and project financing services. With local professional teams in more than 10 countries around the world, the business is spread across a number of regions where the solar power project markets are growing rapidly, and can sustain that growth due to improved clarity around government policies. The Company’s strategy is to pursue high-margin project development opportunities in these profitable and growing markets; specifically, in the U.S. and Europe, where the Company has a market-leading position in several geographies, including Poland, Hungary, Minnesota and New York.

Related Links :

http://www.renesolapower.com

Ionix Technology Inc. Announces 20 Million RMB Sale Order Will Be Obtained by Its Subsidiary Sijirun

LAS VEGAS, March 25, 2021 — Ionix Technology, Inc. (OTCQB: IINX), ("Ionix Technology", "IINX" or "the Company"), a business aggregator in the fields of photoelectric display and smart energy, today announced at least 20 million RMB Lithium-ion Battery equipment order will be obtained by a fully owned subsidiary of Ionix Technology Inc., Sijirun (Yixing) Technology Limited, becoming a profit growing point of the company. The first batch order has been signed on 18th this month with a total purchase price of more than 7 million RMB.

Sijirun is a conspicuous component of Ionix’s energy industry business chain which is an ecological and developing closed-loop. And it is also very important for the company’s business in the fields of new energy intelligent manufacturing and intelligent equipment industry. High intelligence of the equipment is a guarantee of high stability and consistency for EV and Energy storage battery.

Mr. Li Cheng, the CEO, expressed the confidence that the sales from the intelligent equipment business will become the new profit growth point of the company. He said: "these orders are based on the huge market demand for high-end intelligent lithium-ion battery. They are the first two sale orders with more than 20 million RMB after Ionix decided to build a new energy industry chain by the merger and acquisition of new energy upstream and downstream enterprises, which has laid a solid foundation for future performance development. The fulfillment and the completion of the orders will bring positive cash flow for the company, and will have a positive impact on the company’s performance, and also will inspire our confidence in merger and acquisition and development in the new energy industry chain."

To learn more, please visit our website: www.theiinx.com

Safe Harbor Statement

This news release contains "forward-looking statements" as that term is defined in the United States Securities Act of 1933, as amended and the Securities Exchange Act of 1934, as amended. Statements in this press release that are not purely historical are forward-looking statements, including beliefs, plans, expectations or intentions regarding the future, and results of new business opportunities. Actual results could differ from those projected in any forward-looking statements due to numerous factors, such as the inherent uncertainties associated with new business opportunities and development stage companies. Ionix Technology assumes no obligation to update the forward-looking statements. Although Ionix Technology believes that any beliefs, plans, expectations and intentions contained in this press release are reasonable, there can be no assurance that they will prove to be accurate. Investors should refer to the risk factors disclosure outlined in Ionix Technology’s annual report on Form 10-K for the most recent fiscal year, quarterly reports on Form 10-Q and other periodic reports filed from time-to-time with the U.S. Securities and Exchange Commission.

Related Links :

http://www.theiinx.com

Huawei Launches New Data Center and Power Supply Solutions Globally

SHENZHEN, China, March 22, 2021 — Huawei launches next-generation Data Center and Power Supply Solutions at the Digitally Transforming Energy Infrastructure online event, the company also interpreted the latest trends in digital power development, tackling head-on the key questions of the day, from green energy to intelligent transformation.

Make Any Room a Data Center

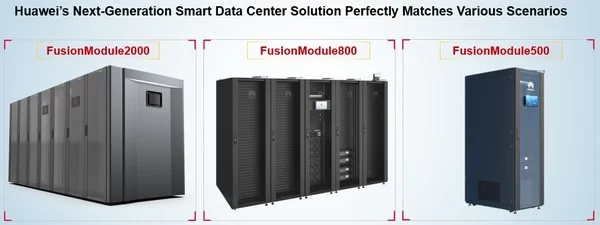
Huawei promised to make any room a data center as it outlined a new, smart modular data center solution for small and edge computing scenarios, including three data center products — FusionModule2000, FusionModule800, and FusionModule500 — designed for different industrial needs.

Huawei outlined a new, smart modular data center solution for small and edge computing scenarios, including three data center products - FusionModule2000, FusionModule800, and FusionModule500.
Huawei outlined a new, smart modular data center solution for small and edge computing scenarios, including three data center products – FusionModule2000, FusionModule800, and FusionModule500.

Key to the Smart Modular Data Solution, SmartLi UPS — Huawei’s smart lithium battery UPS — helps enterprises of all sizes turn any room into a data center. Doing away with the need for a traditional raised floor design, far lower requirements are placed on ceiling heights. Instead, air conditioner pipes and strong- and weak-current cables are routed from top-down, meaning that equipment can be accommodated even when ceiling heights are as low as 2.6 m, far below the 3 m minimum height required for a traditional data center. Huawei partner NetCraft Information Technology (Macau) has already adopted this solution, which NetCraft sales director Benjamin Wong praised at the event.

"With the Huawei Modular Data Center Solution, all required components are modular," Wong said. "An easy way for customers to understand this solution is to consider that each component is like a building block: You can build up your castle by adding different blocks, so you can add more blocks in the future when needed."

One Rack Supports One Megawatt of Power

In next five years, Information Technology (IT) devices will continue to evolve, with ever-higher computing power and density needed. Inevitably, Central Processing Unit (CPU) and server power requirements will also increase. To balance efficiency and costs, data centers will therefore develop toward higher density models, precisely the direction that Huawei’s ongoing Research and Development (R&D) investment has taken: namely, the implementation of a high-density, efficient, intelligent power supply and distribution system.

A direct result of that period of exploration, Huawei launched an ultra-high-density modular UPS product series — UPS5000-H — that uses a new 100 kVA/3 U ultra-high-density hot-swappable power modules. It is the industry’s first UPS that enables a single standard rack to support one megawatt of power. With high-density, high-efficiency, and intelligence, this series effectively lowers the physical footprint and reduces the number of installation labor hours needed in comparison to other UPS solutions. And, once up and running, system efficiency reaches 97%; in addition, the system is low-load and efficient in hibernation mode.

Huawei launched an ultra-high-density modular UPS product series - UPS5000-H - that uses a new 100 kVA/3 U ultra-high-density hot-swappable power modules
Huawei launched an ultra-high-density modular UPS product series – UPS5000-H – that uses a new 100 kVA/3 U ultra-high-density hot-swappable power modules

Making Site Power Simple

A defining trend of digital transformation is the widespread emergence of digital sites — telecom sites, edge computing sites, video sites, and more — reflecting increasing Information Communications Technology (ICT) convergence. Indeed, both Alternating Current (AC) and Direct Current (DC) power supplies are required to power diverse onsite sensing Internet of Things (IoT) devices, Communication Technology (CT) devices, and Information Technology (IT) devices. Unlike the traditional use of multiple AC and DC power systems, forming a kind of patchwork model, Huawei’s iMagicPower adopts a multi-function, integrated design, supporting solar, Diesel Generator (DG), mains, and battery as power inputs. It also provides different power output modes, including 12/24/36/48 V DC output and 24/220/380 V AC output. With all functional parts available in a modular design, precise configuration is possible and future expansion is simplified, allowing enterprises to build according to their needs and means.

For site level energy storage and backup, Huawei launched CloudLi, a fifth generation energy storage system. Compared with common lithium batteries, Huawei CloudLi offers improved performance in terms of power density and reliability, alongside a range of intelligent features to help customers reduce both Capital Expenditure (CAPEX) and Operating Expenditure (OPEX). Particularly important with staffing restrictions in place during the ongoing COVID-19 pandemic, CloudLi supports remote, intelligent Operations and Maintenance (O&M), doing away with manual tasks such as onsite inspection and onsite maintenance.

Unternehmensvorstellung Wöhrle, one of Huawei’s power system partners based in Germany, has experience of using both iMagicPower and CloudLi. The company’s Chief Technology Officer (CTO) has noted that the high reliability of the solutions ensures that they function safely in a wide temperature range even under harsh conditions, with intelligent features enabling optimal monitoring of the lithium batteries.

About Huawei

Huawei is a leading global provider of information and communications technology (ICT) infrastructure and smart devices. With integrated solutions across four key domains – telecom networks, IT, smart devices, and cloud services – we are committed to bringing digital to every person, home and organization for a fully connected, intelligent world.

Huawei’s end-to-end portfolio of products, solutions and services are both competitive and secure. Through open collaboration with ecosystem partners, we create lasting value for our customers, working to empower people, enrich home life, and inspire innovation in organizations of all shapes and sizes.

At Huawei, innovation focuses on customer needs. We invest heavily in basic research, concentrating on technological breakthroughs that drive the world forward. We have more than 194,000 employees, and we operate in more than 170 countries and regions. Founded in 1987, Huawei is a private company fully owned by its employees.

For more information, please visit Huawei online at www.huawei.com or follow us on:

http://www.linkedin.com/company/Huawei 
http://www.twitter.com/Huawei 
http://www.facebook.com/Huawei 
http://www.youtube.com/Huawei

Related Links :

http://www.huawei.com

Sungrow Supplies Inverters for the Sol do Sertao Solar Complex after Agreement with Essentia Energia


SAO PAULO, March 15, 2021 — Sungrow, the global leading inverter solution supplier for renewables, will supply the SG3125HV central inverter solution for the implementation of the project Sol do Sertão Solar after an agreement with Essentia Energia, a new Renewable Energy firm created by Pátria Investimentos. The projects will be implemented in Oliveira dos Brejinhos, a city in Bahia that is about 600 km from the capital and will have a total capacity of 475 MWp once completed.

According to Gilberto Peixoto, director of implementation of the Sol do Sertão Complex, there are eight solar PV plants that is generating more than 4,000 job (directly and indirectly) creations throughout its works. Sungrow will provide 122 units of SG3125HV inverters, which comprise a set of 61 blocks, in addition to the commissioning and training service of the team’s O&M. "We always look for suppliers that are market leaders, for first-tier solutions, and Sungrow was chosen for its proven technology and reference in the solar energy sector," said the executive.

The project is in a region where the thermal feeling can exceed 40ºC, while Sungrow SG3125HV can work without derating even temperature reaches 50ºC. The inverter is equipped with a smart forced air-cooling system that in addition to increasing the life of the equipment, ensures that it does not lose productivity even in the most extreme conditions. The product is compatible with bifacial modules and tracking systems, enabling higher yields. It is prefabricated with inputs for DC-coupled storage solutions which could be added at a later stage.

According to Rafael Ribeiro, Country Manager of Sungrow Brazil, the Company sees a lot of potential across the country and takes the first place in market share. "It is an honor to be part of Essentia Energia birth and support them in a utility-scale project of this size," said Rafael Ribeiro.  "We’re also committed to powering more communities with standout residential and commercial products supplied to the Brazilian distribution market," he added.

The work on the Sol do Sertão Solar Complex is under construction and the complete commercial operation of the plant is scheduled for the second half of 2021.

About Essentia Energia

Essentia Energia is a renewable energy company that operates in the wind and solar generation and commercialization segments. The company has as its investing partner the Pátria Infraestrutura fund, from Pátria Investimentos, a leader in alternative asset management in Latin America and with more than 30 years of experience in the areas of Infrastructure, Private Equity, Real Estate and Credit.

About Sungrow

Sungrow Power Supply Co., Ltd ("Sungrow") is the world’s most bankable inverter brand with over 154 GW installed worldwide as of December 2020. Founded in 1997 by University Professor Cao Renxian, Sungrow is a leader in the research and development of solar inverters, with the largest dedicated R&D team in the industry and a broad product portfolio offering PV inverter solutions and energy storage systems for utility-scale, commercial, and residential applications, as well as internationally recognized floating PV plant solutions. With a strong 24-year track record in the PV space, Sungrow products power installations in over 150 countries. Learn more about Sungrow by visiting www.sungrowpower.com.

Related Links :

http://www.sungrowpower.com