


Achieved Profitability a Quarter Ahead of Plan and Expects Strong Fourth Quarter SAN JOSE, Calif., Nov. 21, 2023 — Automation Anywhere, the leader…

Rossell Techsys Unveils State-of-the-Art Calibration and Metrology Lab
BENGALURU, India, July 25, 2023 — Rossell Techsys, a leading global engineering and manufacturing company in the aerospace and defense sector, is…

Anthology Announces AI-powered Course Building Tools, New Student Success Features in Blackboard Learn
New progress tracking, accessibility and course building tools streamline critical processes for instructors and provide key data to unlock learner success …

Global Industrial Control & Factory Automation Market to Surpass USD 259.84 Bn By 2031| Growth Market Reports
PUNE, India, July 3, 2023 — According to a recent market study by Growth Market Reports, titled, "Global Industrial Control & Factory…

Nintex Names Amit Mathradas Chief Executive Officer
MELBOURNE, Australia, March 4, 2023 — Nintex, the global standard for process intelligence and automation, today announced the appointment of Amit Mathradas…

Hollysys Automation Technologies Reports Unaudited Financial Results for the Second Quarter and the First Half Year Ended December 31, 2022
First Half of Fiscal Year 2023 Financial Highlights Total revenues were $414.8 million, an increase of 12.2% compared to the comparable prior year period. Gross margin was 36.1%,…

Magicycle Unveiled the World’s First Step Through Full Suspension Ebike
ONTARIO, Calif., Feb. 15, 2023 — After waiting for 2 months, Magicycle Deer, the mysterious full-suspension electric bike manufactured by Magicycle, finally made its world debut on the impressive…
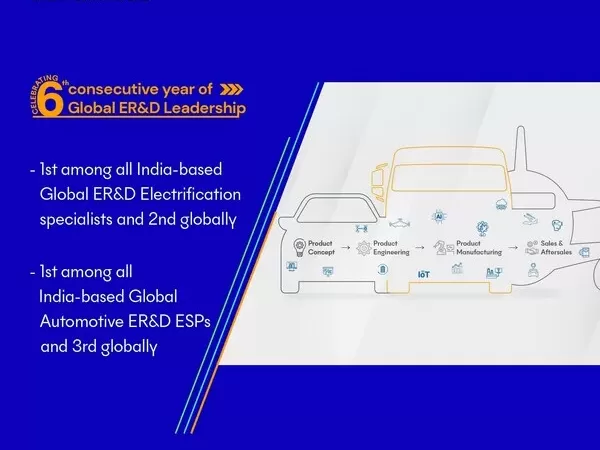
Tata Technologies celebrates 6th consecutive year of Global ER&D Leadership in Zinnov Zones 2022
Tata Technologies has been positioned 1st among all India-based Global ER&D Electrification specialists and 2nd globally as the ESP of choice for OEMs embarking on their electrification journey. PUNE, India…
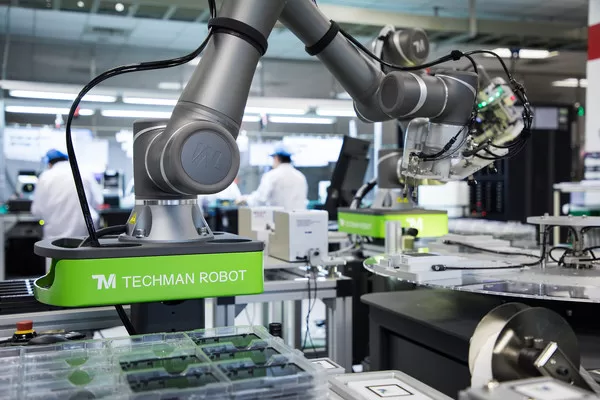
Techman Robot Announces its All-in-One AI Cobot Series
Merging a powerful and precise robotic arm, native AI processing, smart vision system and comprehensive software suite in a single, easily deployed package TAOYUAN, Taiwan, Dec. 13, 2022 — Techman…

Hesai Becomes the World’s First Automotive Lidar Company To Reach 10,000 Units Monthly Delivery
SHANGHAI, Oct. 7, 2022 — Hesai has officially announced its monthly delivery of the AT128 lidar exceeded 10,000 units, making Hesai the world’s first automotive lidar company to reach…