Tag Archives: ECP

JA Solar Signs a Solar Module Agreement with General Solar

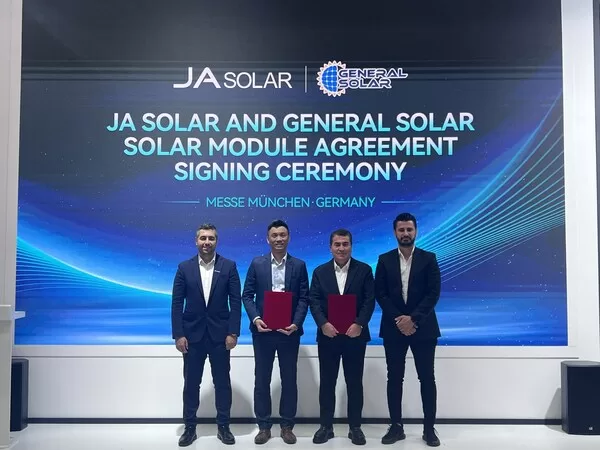
BEIJING, July 5, 2023 /PRNewswire/ — On June 16th, JA Solar, a leading manufacturer of high-performance solar power products, signed a solar module agreement with General Solar, a Turkish solar company. The agreement was signed at a ceremony attended by General Solar’s Chairman of the Board of Directors, Ali Demirdaş, Vice Chairman, Ercan Dinçer, and JA Solar’s Assistant President, Steven Chen.

JA Solar Signed a Solar Module Agreement with General Solar

The agreement will see both companies work together to strengthen cooperation in PV market development, resource sharing, innovation acceleration and other areas. The aim is to improve development, construction, and operations in the PV industry, and jointly promote the high-quality and sustainable development of Turkey’s PV market.

The partnership between JA Solar and General Solar represents an important step towards achieving a sustainable, low-carbon future. By leveraging their respective strengths in PV development and application, the two companies will drive innovation and accelerate the adoption of clean energy solutions in Turkey and beyond.

JA Solar’s high-efficiency products and high-quality services have already contributed to the sustainable development of Turkey’s PV market, with the company currently holding a market share of 17%. Based on its previous business performance, JA Solar is expected to see continued growth in Turkey in the future.

Source: JA Solar Technology Co., Ltd.

Q1 2023 Global Semiconductor Equipment Billings Grow 9% Year-Over-Year, SEMI Reports


MILPITAS, Calif., June 7, 2023 /PRNewswire/ — Global semiconductor equipment billings increased 9% year-over-year to US$26.8 billion in the first quarter of 2023, SEMI announced today in its Worldwide Semiconductor Equipment Market Statistics (WWSEMS) Report. Quarter-over-quarter billings slipped 3%. 

“Semiconductor equipment revenue in the first quarter was robust despite macroeconomic headwinds and a challenging industry environment,” said Ajit Manocha, SEMI president and CEO. “The fundamentals remain healthy for the long-term strategic investments needed to support major technology advancements for AI, automotive, and other growth applications.”

Compiled from data submitted by members of SEMI and the Semiconductor Equipment Association of Japan (SEAJ), the WWSEMS Report is a summary of the monthly billings figures for the global semiconductor equipment industry. 

Following are quarterly billings data in billions of U.S. dollars with quarter-over-quarter and year-over-year changes by region:

Region

1Q2023

4Q2022

1Q2022

1Q (QoQ)

1Q (YoY)

Taiwan

6.93

7.98

4.88

-13 %

42 %

Mainland China

5.86

6.36

7.57

-8 %

-23 %

Korea

5.62

5.80

5.15

-3 %

9 %

North America

3.93

2.60

2.62

51 %

50 %

Japan

1.90

2.25

1.90

-16 %

0 %

Europe

1.52

1.46

1.28

4 %

19 %

Rest of the World

1.06

1.32

1.29

-20 %

-18 %

Total

26.81

27.78

24.69

-3 %

9 %

Sources: SEMI (www.semi.org) and SEAJ (www.seaj.or.jp), June 2023

Note: Summed subtotals may not equal the total due to rounding.

The SEMI Equipment Market Data Subscription (EMDS) provides comprehensive market data for the global semiconductor equipment market. The subscription includes three reports:

  • Monthly SEMI Billings Report, a perspective on equipment market trends
  • Monthly Worldwide Semiconductor Equipment Market Statistics (WWSEMS), a detailed report of semiconductor equipment billings for seven regions and 24 market segments
  • SEMI Semiconductor Equipment Forecast, an outlook for the semiconductor equipment market

Download a sample of the EMDS report.

For more information about the report or to subscribe, please contact the SEMI Market Intelligence Team at mktstats@semi.org. More details are also available on the SEMI Market Data webpage.  

About SEMI
SEMI® connects more than 2,500 member companies and 1.3 million professionals worldwide to advance the technology and business of electronics design and manufacturing. SEMI members are responsible for the innovations in materials, design, equipment, software, devices, and services that enable smarter, faster, more powerful, and more affordable electronic products. Electronic System Design Alliance (ESD Alliance), FlexTech, the Fab Owners Alliance (FOA), the MEMS & Sensors Industry Group (MSIG), Nano-Bio Materials Consortium (NBMC), and SOI Consortium are SEMI Strategic Technology Communities. Visit www.semi.org, contact one of our worldwide offices, and connect with SEMI on LinkedIn and Twitter to learn more.

Association Contact
Michael Hall/SEMI
Phone: 1.408.943.7988
Email: mhall@semi.org

Hanersun Ranked as a Tier 1 PV Module Manufacturer with its 600W+ Technology

NANJING, China, May 26, 2023 /PRNewswire/ — This week, the world-renowned BloombergNEF (BNEF) announced the Tier 1 list (a first-class PV module manufacturer) for the second quarter of 2023. Hanersun has been successfully named on the list due to its 600W+ high-efficiency large-format PV products, steadily increasing brand credibility and solid bankability.

As a global energy research and information provider, BNEF’s assessment reports are an essential reference for international new energy sector investigation, as the gold standard in the panel manufacturing industry. Therefore, the BNEF Tier 1 ranking is often used as a fair, objective, and highly credible reference for industry analysis. International financial institutions widely recognize it due to its stringent criteria.

Hanersun is well known for its 600W+ ultra-high power modules and has already become a major manufacturer of 600W+ bifacial module since 2021. In early 2023, Hanersun released the HITOUCH 6N series high-efficiency modules, which combine 210 and TOPCon technology and reach a power output of even 700W, ideal for large-scale ground-mounted power plants.

Hanersun’s ranking among the top global PV module manufacturers results from years of continuous pursuit of technological innovation and product upgrades. At the same time, the Tier 1 ranking reflects the high recognition of Hanersun modules by international professional research institutions and will help enhance the visibility and influence of the Hanersun brand globally.

In the future, Hanersun will continue to produce efficient and energy-saving solar technology products through cost optimization and technology iteration to make more significant contributions to a clean, low-carbon world.

EV Group and Dymek Company Form Joint Venture Company in Malaysia to Enhance Regional Customer Support

ST. FLORIAN, Austria and HONG KONG, May 23, 2023 /PRNewswire/ — EV Group (EVG), a leading supplier of wafer bonding and lithography equipment for the MEMS, nanotechnology and semiconductor markets, and Dymek Company, an advanced equipment distributor for the semiconductor, biomedical, data storage, photovoltaic and aerospace industries, today announced that they have established a new joint venture company in Malaysia.

The new company, called EV Group Malaysia Dymek Sdn. Bhd., will be charged with managing EVG’s customer support operations in Malaysia. Hermann Waltl, executive sales and customer support director and member of the executive board at EVG, will serve as director of the new joint venture, and Sean Lim from Dymek will serve as managing director of the new joint venture.

EV Group Malaysia Dymek is located at 70-3-31, D’Piazza Mall, Jalan Mahsuri, 11900 Bayan Lepas, Penang, Malaysia.

Working closely with EVG’s headquarters, EV Group Malaysia Dymek will be responsible for numerous key regional customer support activities, including equipment installation, technical service and support, spare parts management and supply, and process development support. The company will be fully operational in July 2023.

Malaysia has been an important center for semiconductor and microelectronics packaging, test and assembly for several decades. As global investments from leading chip manufacturers and outsourced semiconductor assembly and test companies in the region continue to ramp up, it is vital that EVG strengthen its customer support infrastructure here as well,” stated Hermann Waltl. “Dymek has been a key strategic partner for EVG in several countries in Asia already for many years, and we look forward to partnering with them to enhance our customer support in Malaysia as well.”

“This strategic move by EV Group to establish a more direct presence in Malaysia will be well-received by the semiconductor and microelectronics industries of Southeast Asia. Companies here already recognize EVG as a market and technology leader in semiconductor process equipment, and now knowing they can receive local support from local engineers will only further increase their confidence and trust in EVG,” stated Stanley Lam, managing director, Asia Pacific, at Dymek Company. “We are pleased to be working closely with EVG to grow and enhance their customer support infrastructure in Malaysia and across Southeast Asia.”

See EVG at SEMICON Southeast Asia
EVG is a sponsor and program speaker at SEMICON Southeast Asia, taking place May 23-25 at the Setia SPICE Convention Centre in Penang, Malaysia. Attendees interested in learning more about EVG’s latest developments in heterogeneous integration are welcome to attend the Advanced Packaging Forum on Wednesday, May 24 at 15:00 to see Dr. Thorsten Matthias, regional sales director Asia-Pacific for EVG, present on state of the art and upcoming requirements in wafer-to-wafer and die-to-wafer hybrid bonding.

About Dymek Company
Dymek Company Ltd was established in 1989 and is an advanced equipment distributor to leading manufacturers and innovative R&D facilities in the Aerospace, Biomedical, Semiconductor, Data Storage, and Photovoltaic industries. In the early 2000s, Dymek expanded from our headquarters in Hong Kong throughout Southeast Asia and China in order to meet the diverse needs of our customers. In today’s globalized marketplace, it is standard for our customers to have integrated supply chains that link countries across Asia Pacific, and our expert staff is prepared to meet them wherever they are and connect them with industry-leading equipment from around the world. More information about Dymek is available at www.dymek.com.

About EV Group (EVG)
EV Group (EVG) is a leading supplier of equipment and process solutions for the manufacture of semiconductors, microelectromechanical systems (MEMS), compound semiconductors, power devices and nanotechnology devices. Key products include wafer bonding, thin-wafer processing, lithography/nanoimprint lithography (NIL) and metrology equipment, as well as photoresist coaters, cleaners and inspection systems. Founded in 1980, EV Group services and supports an elaborate network of global customers and partners all over the world. More information about EVG is available at www.EVGroup.com.

Dymek Contact:
Dow Wang
Marketing Manager
Dymek Company Ltd
Tel: +60 4 641 5536
E-mail: marketing@dymek.com

EV Group Contacts:

Clemens Schütte 

David Moreno

Director, Marketing and Communications

Principal

EV Group

Open Sky Communications

Tel: +43 7712 5311 0 

Tel: +1.415.519.3915

E-mail: Marketing@EVGroup.com 

E-mail: dmoreno@openskypr.com 

Emeren to Release First Quarter 2023 Financial Results on May 31, 2023


STAMFORD, CT, May 20, 2023 /PRNewswire/ — Emeren Group Ltd (“Emeren” or the “Company”) (www.emeren.com) (NYSE: SOL), a leading global solar project developer, owner, and operator, today announced that it will report its unaudited financial results for the first quarter ended March 31, 2023 after the U.S. stock market close on Wednesday, May 31, 2023. The Company will host a conference call to discuss the financial results at 5:00 p.m. U.S. Eastern Time on Wednesday, May 31, 2023.

What:    Emeren Group Ltd First Quarter (ended March 31, 2023) Earnings Call

When:    5:00 p.m. U.S. Eastern Time on Wednesday, May 31, 2023

Webcast: https://edge.media-server.com/mmc/p/upr9x999

Participant Online Registration: https://register.vevent.com/register/BId591b19e06ce430c8013887637b005f4

Please register in advance to join the conference call using the link provided below and dial in 10 minutes before the call is scheduled to begin. Conference call access information will be provided upon registration.

Additionally, a live and archived webcast of the conference call will be available on the Investor Relations section of Emeren Group Ltd’s website at https://ir.emeren.com/.

About Emeren Group Ltd

Emeren Group Ltd (NYSE: SOL) is a leading global solar project developer, owner, and operator with a ~3 GW pipeline of projects and IPP assets across Europe, North America, and Asia. The Company focuses on solar power project development, construction management and project financing services with local professional teams across multiple countries. For more information, go to www.emeren.com.     

Edifier Announces W820NB Plus Headphones


Featuring support for LDAC coding and certification of Hi-Res Audio Wireless.

RICHMOND, BC, May 18, 2023 /PRNewswire/ — Edifier, the forward-thinking audio-technology brand, has announced the release of the W820NB Plus which continues the brand’s outstanding record for affordable but premium quality audio products incorporating the latest technologies. The W820NB Plus is an update to the top selling W820NB headphones. This latest version features support for LDAC coding, certification of Hi-Res Audio Wireless, 40mm dynamic driver with Titanium coated composite diaphragm for crystal clear listening and up to 49 hours of playtime.

Edifier W820NB Plus Wireless Noise Cancellation Over-Ear Headphones, LDAC codec with Hi-Res Audio & Hi-Res Wireless certification.

The W820NB Plus is certified by Hi-Res Audio and Hi-Res Wireless Audio, providing a high-frequency bandwidth of up to 40kHz. Whether users prefer wired or wireless connectivity, they can enjoy music with enhanced details, a wider sound field, and richer emotions.

These latest headphones utilize LDAC high-definition codecs technology that allows for a transmission bandwidth of up to 990kbps, similar to a highway in wireless protocol. This ensures that high-bit-rate audio files are transmitted with great protection, retaining about three times the amount of music detail and delivering nearly lossless, natural and full sound.

The W820NB Plus headphones feature Hybrid ANC technology that can effectively cancel up to 43dB of background noise, resulting in an immersive music listening experience. Moreover, these headphones use advanced deep neural network call noise reduction technology, ensuring clear voice calls by accurately capturing the human voice and filtering out unwanted sounds. Business or personal calls can be made and taken with the confidence that call quality is guaranteed.

Equipped with 40mm Titanium coated composite diaphragm dynamic driver, the W820NB Plus offers an exceptional transient response that enhances the clarity of high-frequency sounds. This results in rich, dynamic bass and clear, well-defined mids and highs, which create an immersive music experience background noise.

With a high capacity battery and an energy saving Bluetooth chip, the W820NB Plus provides up to 49 hours of non-stop playtime, making it ideal for travel. Even if the battery runs low, charging for just 10 minutes gives up to 7 hours of music playback ensuring that users can listen to their favourite playlist anytime, anywhere without missing a beat.

Turn on the ambient sound mode and enjoy music whilst being aware of the surroundings without worrying about missing that important train, plane, bus announcement and more. With an ultra low game mode of just 0.08 seconds, users will experience perfectly synchronized sound. Every sound and position is accurately heard, allowing users to fully immerse themselves in the game and play their roles effortlessly.

The W820NB Plus is also compatible with The Edifier Connect App which offers a wide range of musical options and allows users to tailor their listening experience. Users can customize settings such as power display, EQ selection, shutdown timer, prompt volume and soothing sounds to their own preferences.

Available in Grey, Green, Blue, Ivory or traditional Black, there is a colour for everyone. The super soft headband and ear cushions are comfortable to wear for long periods of time. The retractable headphone arm will give users a secure fit with less pressure and help prevent sound leakage.

Price & Availability:

Currently, the W820NB Plus is available for $79.99 on Amazon.com and authorized dealer – Edifier-online.com.

About Edifier:

Edifier specializes in the design and manufacture of premium audio solutions that showcase technological innovation and design excellence. Founded in 1996 and headquartered in Beijing, China, Edifier delivers outstanding sound experience through a wide range of audio systems for personal entertainment and professional use. Renowned for its award-winning design philosophy, expertise and innovation in acoustic technology, and superior manufacturing standards, Edifier is one of today’s leading innovators of audio electronics.  

More information about Edifier is available online at www.edifier.com.

Canadian Solar Reports First Quarter 2023 Results

GUELPH, ON, May 18, 2023 /PRNewswire/ — Canadian Solar Inc. (“Canadian Solar” or the “Company”) (NASDAQ: CSIQ) today announced financial results for the first quarter ended March 31, 2023.

Highlights

  • 66% increase in solar module shipments year-over-year (“yoy”) to 6.1 GW, in line with guidance of 5.9 GW to 6.2 GW.
  • 36% increase in revenue yoy to $1.7 billion, in line with guidance of $1.6 billion to $1.8 billion.
  • 18.7% gross margin, in line with guidance of 18% to 20%.
  • Net income attributable to Canadian Solar of $84 million or $1.19 per diluted share.
  • 25 GWp of solar development pipeline and 47 GWh of battery storage development pipeline, as of March 31, 2023 (Recurrent Energy, formerly Global Energy).
  • Carve-out IPO of CSI Solar subsidiary on track to be completed in the second quarter of 2023.

Dr. Shawn Qu, Chairman and CEO, commented, “We started off the year strong with 36% yoy revenue growth and 750% increase in diluted earnings per share. We continue to leverage our premium brand to capture increased solar and battery storage opportunities, while laying the groundwork for future success with strategic capacity expansion. We remain focused on profitable growth and continue to optimize our cost structure through vertical integration. With the imminent IPO of our CSI Solar subsidiary, we will have a new platform to raise investment capital and further strengthen our leading position in solar and battery storage manufacturing.”

Yan Zhuang, President of Canadian Solar’s CSI Solar subsidiary, said, “We delivered a record operating profit in the first quarter, despite normal seasonal softness with lower input and manufacturing processing costs, and lower logistics costs. Looking ahead, as we continue to grow our volumes and increase the level of vertical integration, we expect profitability to remain healthy as our cost structure continues to improve and we reap the benefits of greater scale. On the battery energy storage side, we continue to grow our contracted turnkey pipeline which stood at approximately $1.3 billion as of March 31, 2023, and have continued to sign new contracts across the world reflecting overall market growth and positive customer response to our innovative products and solutions.”

Ismael Guerrero, Corporate VP and President of Canadian Solar’s Recurrent Energy subsidiary, said, “As expected, we monetized a smaller number of projects in the first quarter, namely, around 5 MWp in Japan, reflecting typical fluctuations in the timing of project sales. Importantly, we formally unified our Global Energy platform under our Recurrent Energy brand, which now encompasses our global development and services businesses rather than just our North American business as before. Recurrent Energy is now one of the world’s largest platforms with a global development pipeline of 25 GWp of solar and 47 GWh of battery energy storage projects, of which 14 GWp and 12 GWh respectively have interconnections granted. With a large majority of our pipeline being developed from greenfield, and increasingly holding and owning more of the projects we develop, we expect to capture even more value created throughout the project development cycle.”

Dr. Huifeng Chang, Senior VP and CFO, added, “In the first quarter, we achieved $1.7 billion in revenue, a 18.7% gross margin, and net income of $1.19 per diluted share. We delivered positive operating cash flow, while we continue to build on solar modules and battery storage inventories to position our topline growth for the balance of 2023. We fortified our balance sheet in the quarter and remain well-positioned to support our planned strategic capacity expansion, drive growth and create additional value. Both the N-type TOPCon capacity and greater manufacturing vertical integration will drive further cost reductions and greater operating leverage with higher volumes.”

First Quarter 2023 Results

Total module shipments recognized as revenues in the first quarter of 2023 were 6.1 GW, up 66% yoy. Of the total, 90 MW were shipped to the Company’s own utility-scale solar power projects.

Net revenues in the first quarter of 2023 were up 36% yoy and down 14% quarter-over-quarter (“qoq”) to $1.7 billion. The sequential decrease reflects the expected decline in module average selling price (“ASP”), lower solar module shipment volume due to seasonality, and lower project sales. The yoy increase was mainly driven by a significant increase in solar module shipments, partially offset by lower module ASPs and lower revenues from utility-scale battery storage solutions and project sales due to the timing of projects.

Gross profit in the first quarter of 2023 was $318 million, up 76% yoy and down 9% qoq. Gross margin in the first quarter of 2023 was 18.7%, compared to 17.7% in the fourth quarter of 2022, within the guidance range of 18% to 20%. The gross margin improvement was mainly driven by lower manufacturing costs, partially offset by lower module ASPs.

Total operating expenses in the first quarter of 2023 were $172 million compared to $213 million in the fourth quarter of 2022 and $165 million in the first quarter of 2022. The sequential decrease was mainly driven by further declines in logistics costs, while the yoy increase was mainly driven by higher total logistics costs due to the significant increase in solar module shipments, partially offset by lower average logistics costs per unit.

Depreciation and amortization charges in the first quarter of 2023 were $68 million, compared to $50 million in the fourth quarter of 2022 and $66 million in the first quarter of 2022. The sequential increase was primarily driven by the Company’s previously outlined manufacturing capacity expansion as it works to meet anticipated higher demand levels.

Net interest expense in the first quarter of 2023 was $12 million, compared to $11 million in both the fourth and first quarters of 2022.

Net foreign exchange and derivative loss in the first quarter of 2023 was $13 million, compared to a net loss of $15 million in the fourth quarter of 2022 and a net gain of $3 million in the first quarter of 2022. The net foreign exchange loss and derivative was mainly due to a weaker U.S. dollar.

Net income attributable to Canadian Solar in the first quarter of 2023 was $84 million, or $1.19 per diluted share (“diluted EPS”), compared to net income of $78 million, or $1.11 per diluted share, in the fourth quarter of 2022, and net income of $9 million, or $0.14 per diluted share, in the first quarter of 2022.

Net cash flow provided by operating activities in the first quarter of 2023 was $47 million, compared to $397 million in the fourth quarter of 2022. The qoq decrease in operating cash flow primarily resulted from higher inventory in preparation for expected revenue growth.

Total debt was $3.0 billion as of March 31, 2023, compared to $2.6 billion as of December 31, 2022, and included $831 million and $684 million of debt related to Recurrent Energy as of March 31, 2023 and December 31, 2022, respectively. Non-recourse debt used to finance solar power systems and project assets increased to $410 million as of March 31, 2023 from $365 million as of December 31, 2022.

Total project assets as of March 31, 2023 were $864 million, compared to $824 million as of December 31, 2022. Project assets are projects that are developed and built for sale, as part of Recurrent Energy’s business model.

The net value of solar power systems as of March 31, 2023 was $472 million, compared to $365 million as of December 31, 2022. Solar power systems are projects that are developed and built to be held on the Company’s balance sheet.

Corporate Structure

The Company has two business segments: Recurrent Energy, formerly Global Energy, and CSI Solar. The two businesses operate as follows:  

  • Recurrent Energy (formerly Global Energy) is one of the world’s largest clean energy project development platforms with 14 years’ experience, having delivered nearly 9 GWp of solar power projects and 3 GWh of battery storage projects. It is vertically integrated and has strong expertise from greenfield origination, development, financing, execution, operations and maintenance, and asset management.
  • CSI Solar consists of solar module and battery storage manufacturing, and delivery of total system solutions, including inverters, solar system kits and EPC (engineering, procurement and construction) services. CSI Solar’s battery storage business includes both its utility-scale turnkey battery system solutions, as well as a small but growing residential battery storage business. These storage systems solutions are complemented with long-term service agreements, including future battery capacity augmentation services.

Recurrent Energy Segment (formerly Global Energy)

Recurrent Energy is one of the world’s largest and most geographically diversified utility-scale solar and energy storage project development platforms, with a 14-year track record of originating, developing, financing, and building nearly 9 GWp of solar power plants and 3 GWh of battery storage power plants across six continents. As of March 31, 2023, the Company had a leading position with a total global solar development pipeline of approximately 25 GWp and an energy storage development pipeline of over 47 GWh.

While Recurrent Energy’s business model was historically predominantly develop-to-sell, as previously communicated, the Company is in the process of adjusting its strategy to create greater asset value and retain greater ownership of projects in select markets to increase the revenues generated through recurring income, such as power sales, operations and maintenance, and asset management income.

The business model will consist of three key drivers:

  • Operating portfolio to drive stable, diversified cash flows in growth markets with stable currencies.
  • Project sales (or asset rotations) in the rest of the world, driving cash-efficient, funded growth model as value from project sales will help fund growth in operating assets.
  • Power services through long-term operations and maintenance (“O&M”) contracts, currently with 6 GW of contracted projects.  

Recurrent Energy is continuing to evaluate adjustments in its growth strategy to hold valuable solar assets for the longer term.

Project Development Pipeline – Solar

As of March 31, 2023, Recurrent Energy’s total solar project development pipeline was 24.6 GWp, including 1.7 GWp under construction, 5.2 GWp of backlog, and 17.7 GWp of projects in advanced and early-stage pipelines, defined as follows:  

  • Backlog projects are late-stage projects that have passed their risk cliff date and are expected to start construction in the next 1-4 years. A project’s risk cliff date is the date on which the project passes the last high-risk development stage and varies depending on the country where it is located. This is usually after the projects have received all the required environmental and regulatory approvals, and entered into interconnection agreements, feed-in tariff (“FIT”) arrangements and power purchase agreements (“PPAs”). Significant majority of projects in backlog are contracted (i.e., have secured a PPA or FIT), and the remaining are reasonably assured of securing PPAs.
  • Advanced pipeline projects are mid-stage projects that have secured or have more than 90% certainty of securing an interconnection agreement.
  • Early-stage pipeline projects are early-stage projects controlled by Recurrent Energy that are in the process of securing interconnection.

The following table presents Recurrent Energy’s total solar project development pipeline.

Solar Project Development Pipeline (as of March 31, 2023) – MWp*

Region

In
Construction

Backlog

Advanced
Pipeline

Early-Stage
Pipeline

Total

North America

422

1,977

4,656

7,055

Latin America

1,400**

2,397**

887

407

5,091

Europe, the Middle East and Africa
(“EMEA”)

89

1,236

3,194

3,267

7,786

Japan

4

141

12

46

203

China

250

971**

1,325

2,546

Asia Pacific excluding Japan and China

3

1,001

887

1,891

Total

1,743

5,170

7,071

10,588

24,572

*All numbers are gross MWp.

**Including 672 MWp in construction and 332 MWp in backlog that are owned by or already sold to third parties.

Project Development Pipeline – Battery Storage

As of March 31, 2023, Recurrent Energy’s total battery storage project development pipeline was 47.4 GWh, including 0.3 GWh under construction, 1.7 GWh of backlog, and 45.4 GWh of projects in advanced and early-stage pipelines.

The table below sets forth Recurrent Energy’s total storage project development pipeline.

Energy Storage Project Development Pipeline (as of March 31, 2023) – MWh

Region

In
Construction

Backlog

Advanced
Pipeline

Early-Stage

Pipeline

Total

North America

3,898

15,242

19,140

Latin America

1,100

2,040

970

4,110

EMEA

110

4,038

10,081

14,229

Japan

19

19

China

300

7,500

7,800

Asia Pacific excluding Japan and China

20

458

200

1,440

2,118

Total

320

1,668

10,176

35,252

47,416

Projects in Operation – Solar and Energy Storage Power Plants

As of March 31, 2023, Recurrent Energy’s solar power plants in operation totaled 609 MWp, with a combined estimated net resale value of approximately $700 million to Recurrent Energy. The estimated net resale value is based on selling prices that Recurrent Energy is currently negotiating or comparable asset sales.

Solar Power Plants in Operation – MWp*

Latin America

Japan

China

Asia Pacific

ex. Japan and China

Total

335

176

86

12

609

*All numbers are net MWp owned by Recurrent Energy; total gross MWp of projects is 1,063 MWp,
including volume that is already sold to third parties.

As of March 31, 2023, Recurrent Energy’s energy storage power plants in operation totaled 280 MWh, representing the 20% interest Recurrent Energy retains in the 1,400 MWh Crimson standalone battery energy storage project in California.

Operating Results

The following table presents select unaudited results of operations data of the Recurrent Energy segment for the periods indicated.

Recurrent Energy Segment Financial Results

(In Thousands of U.S. Dollars, Except Percentages)

Three Months Ended

March 31, 2023

December 31,
2022

March 31, 2022

Net revenues

20,052

73,650

92,966

Cost of revenues

12,843

57,686

75,130

Gross profit

7,209

15,964

17,836

Operating expenses

22,414

17,315

18,847

Loss from operations*

(15,205)

(1,351)

(1,011)

Gross margin

36.0 %

21.7 %

19.2 %

Operating margin

-75.8 %

-1.8 %

-1.1 %

*Loss from operations reflects management’s allocation and estimate as some services are shared by the Company’s
two business segments.

CSI Solar Segment

Solar Modules

CSI Solar shipped 6.1 GW of solar modules to more than 70 countries in the first quarter of 2023. For the first quarter of 2023, the top five markets ranked by shipments were China, Brazil, the U.S., Spain, and Germany.

CSI Solar’s 2024 solar capacity expansion targets are set forth below.

Solar Manufacturing Capacity, GW*

March 2023

Actual

June 2023

Plan

December 2023

Plan

March 2024

Plan

Ingot

20.4

20.4

20.4

50.4

Wafer

21.0

21.0

35.0

50.0

Cell

21.0

26.0

50.0

60.0

Module

36.2

36.7

50.0

75.0

*Nameplate annualized capacities at said point in time. Capacity expansion plans are subject to change without notice
based on market conditions and capital allocation plans.

Battery Storage Solutions

Within CSI Solar, the battery storage solutions team, namely CSI Energy Storage, provides customers with competitive turnkey, integrated, utility-scale battery storage solutions, including bankable, end-to-end, utility-scale, turnkey battery storage system solutions across various applications. System performance is complemented with long-term service agreements, which include future battery capacity augmentation services and bring in long-term, stable income.

As of March 31, 2023, CSI Energy Storage had a total project turnkey pipeline of 22.8 GWh, which includes both contracted and in construction projects, as well as projects at different stages of the negotiation process. CSI Energy Storage was also managing 2.3 GWh of projects under long-term service agreements, which are operational battery storage projects delivered by CSI Energy Storage that are under multi-year long-term service agreements and generate recurring earnings.

The total contracted turnkey pipeline was approximately $1.3 billion, which are contractual obligations with customers and provide significant earnings visibility over a multi-year period.

The table below sets forth CSI Energy Storage’s battery storage manufacturing capacity expansion targets.

Battery Storage Manufacturing
Capacity, GWh*

March 2023

Actual

December 2023

Plan

SolBank

2.5

10.0

*Nameplate annualized capacities at said point in time. Capacity expansion plans are subject to change without notice
based on market conditions and capital allocation plans.

Operating Results 

The following table presents select unaudited results of operations data of the CSI Solar segment for the periods indicated. 

CSI Solar Segment Financial Results* 

(In Thousands of U.S. Dollars, Except Percentages)

Three Months Ended

March 31, 2023

December 31,
2022

March 31, 2022

Net revenues

1,709,730

1,976,045

1,209,994

Cost of revenues

1,394,121

1,631,417

1,034,165

Gross profit

315,609

344,628

175,829

Operating expenses

146,151

192,099

143,931

Income from operations

169,458

152,529

31,898

Gross margin

18.5 %

17.4 %

14.5 %

Operating margin

9.9 %

7.7 %

2.6 %

*Include effects of both sales to third-party customers and to the Company’s Recurrent Energy segment. Please
refer to the attached financial tables for intercompany transaction elimination information. Income from operations
reflects management’s allocation and estimate as some services are shared by the Company’s two business
segments.

The table below provides the geographic distribution of the net revenues of CSI Solar:

CSI Solar Net Revenues Geographic Distribution* (In Millions of U.S. Dollars, Except Percentages)

Q1 2023

% of Net
Revenues

Q4 2022

% of Net
Revenues

Q1 2022

% of Net
Revenues

Asia

555

33

846

45

473

41

Americas

632

38

635

33

453

39

Europe and others

494

29

417

22

231

20

Total

1,681

100

1,898

100

1,157

100

*Excludes sales from CSI Solar to Recurrent Energy.

Business Outlook

The Company’s business outlook is based on management’s current views and estimates given factors such as existing market conditions, order book, production capacity, input material prices, foreign exchange fluctuations, anticipated timing of project sales, and the global economic environment. This outlook is subject to uncertainty with respect to, among other things, customer demand, project construction and sale schedules, product sales prices and costs, supply chain constraints, and geopolitical conflicts. Management’s views and estimates are subject to change without notice.

For the second quarter of 2023, the Company expects total revenue to be in the range of $2.4 billion to $2.6 billion. Gross margin is expected to be between 19% and 21%. Total module shipments recognized as revenues by CSI Solar are expected to be in the range of 8.1 GW to 8.4 GW, including approximately 60 MW to the Company’s own projects.  

For the full year of 2023, the Company reiterates its prior outlook for CSI Solar’s total module shipments to be in the range of 30 GW to 35 GW. CSI Solar’s battery storage shipments are expected to be in the range of 1.8 GWh to 2.0 GWh, representing this year’s transition from white label to own manufactured product. The Company’s total revenue is now expected to be in the range of $9.0 billion to $9.5 billion from the prior range of $8.5 billion to $9.5 billion.

Dr. Shawn Qu, Chairman and CEO, commented, “We expect significant revenue and profit growth in the second quarter driven by both higher volume in solar module shipments and project sales. In the CSI Solar segment, volume growth is picking up while costs continue to come down, albeit partially offset by gradual ASP declines. On the Recurrent Energy side, we expect the closing of a major project sale during the quarter to have a significantly positive impact on profit. Overall, we will continue to leverage our market leadership position and expect significant growth in 2023 and beyond across both our solar and battery storage businesses.”

Recent Developments

Recurrent Energy (formerly Global Energy)

On May 15, 2023, Canadian Solar announced its wholly-owned subsidiary Recurrent Energy signed an aggregated virtual power purchase agreement with EMD Electronics, Biogen Inc., Wayfair LLC, Autodesk, Inc. and a large healthcare company for 100% of the production capacity of the Liberty Solar Project. Recurrent Energy is currently developing the 100 MWac solar project in Liberty County, Texas, around 50 miles from Houston. The project is expected to be operational in 2024.

On April 10, 2023, Canadian Solar announced the rebranding of its wholly-owned Global Energy subsidiary as Recurrent Energy. Recurrent Energy, previously the Company’s North American utility-scale solar and energy storage project developer, will now encompass all its global development and services businesses.

CSI Solar

On May 17, 2023, Canadian Solar announced its majority-owned subsidiary CSI Solar’s CSI Energy Storage will deliver 363 MWh of battery energy products to an Aypa Power Project in Texas. The project is expected to reach commercial operation by Q2 2024.

On April 11, 2023, Canadian Solar announced its majority-owned subsidiary CSI Solar capacity expansion plans. Namely, CSI Solar intends to have 20.4 GW of ingot, 35 GW of wafer, 50 GW of cell and 50 GW of module capacities by the end of 2023 and is expected to have 50.4 GW of ingot, 50 GW of wafer, 60 GW of cell and 75 GW of module capacities by the end of Q1 2024.

Conference Call Information 

The Company will hold a conference call on Thursday, May 18, 2023, at 8:00 a.m. U.S. Eastern Daylight Time (8:00 p.m., Thursday, May 18, 2023, in Hong Kong) to discuss its first quarter 2023 results and business outlook. The dial-in phone number for the live audio call is +1-877-704-4453 (toll-free from the U.S.), 800-965-561 (toll-free from Hong Kong), 400-120-2840 (local dial-in from Mainland China) or +1-201-389-0920 from international locations. The conference ID is 13738337. A live webcast of the conference call will also be available on the investor relations section of Canadian Solar’s website at www.canadiansolar.com.

A replay of the call will be available 2 hours after the conclusion of the call until 11:00 p.m. U.S. Eastern Daylight Time on Thursday, June 1, 2023 (11:00 a.m., June 2, 2023, in Hong Kong) and can be accessed by +1-844-512-2921 (toll-free from the U.S.), or +1-412-317-6671 from international locations. The replay pin number is 13738337. A webcast replay will also be available on the investor relations section of Canadian Solar’s website at www.canadiansolar.com.

About Canadian Solar Inc.

Canadian Solar was founded in 2001 in Canada and is one of the world’s largest solar technology and renewable energy companies. It is a leading manufacturer of solar photovoltaic modules, provider of solar energy and battery storage solutions, and developer of utility-scale solar power and battery storage projects with a geographically diversified pipeline in various stages of development. Over the past 22 years, Canadian Solar has successfully delivered around 94 GW of premium-quality, solar photovoltaic modules to customers across the world. Likewise, since entering the project development business in 2010, Canadian Solar has developed, built and connected over 8.8 GWp in over 20 countries across the world. Currently, the Company has approximately 609 MWp of projects in operation, 6.9 GWp of projects under construction or in backlog (late-stage), and an additional 17.7 GWp of projects in advanced and early-stage pipeline. Canadian Solar is one of the most bankable companies in the solar and renewable energy industry, having been publicly listed on the NASDAQ since 2006. For additional information about the Company, follow Canadian Solar on LinkedIn or visit www.canadiansolar.com.

Safe Harbor/Forward-Looking Statements

Certain statements in this press release, including those regarding the Company’s expected future shipment volumes, revenues, gross margins and project sales are forward-looking statements that involve a number of risks and uncertainties that could cause actual results to differ materially. These statements are made under the “Safe Harbor” provisions of the U.S. Private Securities Litigation Reform Act of 1995. In some cases, you can identify forward-looking statements by such terms as “believes,” “expects,” “anticipates,” “intends,” “estimates,” the negative of these terms, or other comparable terminology. Factors that could cause actual results to differ include general business, regulatory and economic conditions and the state of the solar and battery storage market and industry; geopolitical tensions and conflicts, including impasses, sanctions and export controls; volatility, uncertainty, delays and disruptions related to the COVID-19 pandemic; supply chain disruptions; governmental support for the deployment of solar power; future available supplies of high-purity silicon; demand for end-use products by consumers and inventory levels of such products in the supply chain; changes in demand from significant customers; changes in demand from major markets such as Japan, the U.S., China, Brazil and Europe; changes in effective tax rates; changes in customer order patterns; changes in product mix; changes in corporate responsibility, especially environmental, social and governance (“ESG”) requirements; capacity utilization; level of competition; pricing pressure and declines in or failure to timely adjust average selling prices; delays in new product introduction; delays in utility-scale project approval process; delays in utility-scale project construction; delays in the completion of project sales; continued success in technological innovations and delivery of products with the features that customers demand; shortage in supply of materials or capacity requirements; availability of financing; exchange and inflation rate fluctuations; uncertainties related to the CSI Solar carve-out listing; litigation and other risks as described in the Company’s filings with the Securities and Exchange Commission, including its annual report on Form 20-F filed on April 18, 2023. Although the Company believes that the expectations reflected in the forward-looking statements are reasonable, it cannot guarantee future results, level of activity, performance, or achievements. Investors should not place undue reliance on these forward-looking statements. All information provided in this press release is as of today’s date, unless otherwise stated, and Canadian Solar undertakes no duty to update such information, except as required under applicable law.

Investor Relations Contacts:

FINANCIAL TABLES FOLLOW

The following tables provide unaudited select financial data for the Company’s CSI Solar and Recurrent Energy businesses.

Select Financial Data – CSI Solar and Recurrent Energy

Three Months Ended March 31, 2023

(In Thousands of U.S. Dollars, Except Percentages)

CSI Solar

Recurrent
Energy

Elimination
and
unallocated
items (1)

Total

Net revenues 

1,709,730

20,052

(28,501)

1,701,281

Cost of revenues

1,394,121

12,843

(23,684)

1,383,280

Gross profit

315,609

7,209

(4,817)

318,001

Gross margin

18.5 %

36.0 %

18.7 %

Income (loss) from
    operations
(2)

169,458

(15,205)

(8,649)

145,604

Select Financial Data – CSI Solar and Recurrent Energy

Three Months Ended March 31, 2022

(In Thousands of U.S. Dollars, Except Percentages)

CSI Solar

Recurrent

Energy

Elimination
and
unallocated
items (1)

Total

Net revenues 

1,209,994

92,966

(52,611)

1,250,349

Cost of revenues

1,034,165

75,130

(39,837)

1,069,458

Gross profit

175,829

17,836

(12,774)

180,891

Gross margin

14.5 %

19.2 %

14.5 %

Income (loss) from
    operations
(2)

31,898

(1,011)

(15,372)

15,515

(1) Includes inter-segment elimination, and unallocated corporate costs not considered part of management’s
evaluation of business segment operating performance.

(2) Income (loss) from operations reflects management’s allocation and estimate as some services are shared
by the Company’s two business segments.

Select Financial Data – CSI Solar and Recurrent Energy

Three Months
Ended

March 31, 2023

Three Months
Ended

December 31,
2022

Three Months
Ended

March 31, 2022

(In Thousands of U.S. Dollars)

CSI Solar Revenues:

Solar modules

1,454,876

1,642,144

963,045

Solar system kits

133,587

157,845

90,456

Utility-scale battery storage

9,815

48,992

82,500

Residential battery storage

4,995

686

EPC

49,023

20,933

5,323

Others

28,933

27,346

16,059

Subtotal

1,681,229

1,897,946

1,157,383

Recurrent Energy Revenues:

Solar and battery storage projects

4,621

58,504

78,392

O&M and asset management services

8,687

8,087

7,948

Others (includes electricity sales)

6,744

7,059

6,626

Subtotal

20,052

73,650

92,966

Total net revenues

1,701,281

1,971,596

1,250,349

Canadian Solar Inc.

Unaudited Condensed Consolidated Statements of Operations

(In Thousands of U.S. Dollars, Except Share and Per Share Data)

Three Months Ended

March 31,

December 31,

March 31,

2023

2022

2022

Net revenues

$ 1,701,281

$ 1,971,596

$ 1,250,349

Cost of revenues

1,383,280

1,622,967

1,069,458

Gross profit

318,001

348,629

180,891

Operating expenses:

Selling and distribution
expenses

88,371

126,313

108,845

General and administrative
expenses

78,648

89,207

62,810

Research and development
expenses

17,307

20,607

13,280

Other operating income,
net

(11,929)

(23,260)

(19,559)

Total operating expenses

172,397

212,867

165,376

Income from operations

145,604

135,762

15,515

Other income (expenses):

Interest expense

(20,448)

(20,195)

(15,302)

Interest income

7,956

9,287

4,212

Gain (loss) on change in
fair value of derivatives, net

7,601

(27,071)

(24,738)

Foreign exchange gain
(loss), net

(20,860)

11,610

27,862

Investment income (loss),

net

8,380

2,628

(5,524)

Total other expense

(17,371)

(23,741)

(13,490)

Income before income taxes
and equity in earnings of
affiliates

128,233

112,021

2,025

Income tax benefit (expense)

(28,715)

(21,850)

5,183

Equity in earnings of affiliates

7,311

8,653

1,726

Net income

106,829

98,824

8,934

Less: Net income (loss)
attributable to non-
controlling interests

23,117

20,990

(273)

Net income attributable to
Canadian Solar Inc.

$ 83,712

$ 77,834

$ 9,207

Earnings per share – basic

$   1.30

$   1.21

$   0.14

Shares used in computation –
basic

64,517,935

64,505,398

64,028,919

Earnings per share – diluted

$   1.19

$   1.11

$   0.14

Shares used in computation –
diluted

71,424,749

71,307,345

64,720,107

 Canadian Solar Inc.

Unaudited Condensed Consolidated Statement of Comprehensive Income

(In Thousands of U.S. Dollars)

 Three Months Ended

March 31,

December 31,

March 31,

2023

2022

2022

Net Income

$ 106,829

$ 98,824

$ 8,934

Other comprehensive income
(loss):

Foreign currency translation
adjustment

23,250

73,310

7,511

Gain on changes in fair value of
available-for-sale debt securities,
net of tax

339

306

Gain (loss) on interest rate swap,
net of tax

(105)

34

190

Share of gain (loss) on changes in
fair value of derivatives of affiliate,
net of tax

(610)

1,499

Comprehensive income

129,703

173,973

16,635

Less: comprehensive income
attributable to non-controlling
interests

25,162

30,631

1,127

Comprehensive income
attributable to Canadian Solar
Inc.

$ 104,541

$ 143,342

$ 15,508

Canadian Solar Inc.

Unaudited Condensed Consolidated Balance Sheets

(In Thousands of U.S. Dollars)

March 31,

December 31,

2023

2022

ASSETS

Current assets:

Cash and cash equivalents

$  848,035

$ 981,434

Restricted cash

1,207,573

978,116

Accounts receivable trade, net

991,168

970,950

Accounts receivable, unbilled

67,886

57,770

Amounts due from related parties

51,190

48,614

Inventories

1,671,544

1,524,095

Value added tax recoverable

192,810

158,773

Advances to suppliers, net

345,633

253,484

Derivative assets

7,761

17,516

Project assets

396,035

385,964

Prepaid expenses and other current assets

267,833

267,941

Total current assets

6,047,468

5,644,657

Restricted cash

19,925

9,953

Property, plant and equipment, net

1,986,335

1,826,643

Solar power systems, net

471,971

364,816

Deferred tax assets, net

226,765

229,226

Advances to suppliers, net

73,531

65,352

Investments in affiliates

136,449

115,784

Intangible assets, net

14,797

17,530

Project assets

467,567

438,529

Right-of-use assets

153,716

103,600

Amounts due from related parties

35,106

33,489

Other non-current assets

195,693

187,549

TOTAL ASSETS

$  9,829,323

$  9,037,128

Canadian Solar Inc.

Unaudited Condensed Consolidated Balance Sheets (Continued)

(In Thousands of U.S. Dollars)

March 31,

December 31,

2023

2022

Current liabilities:

Short-term borrowings

$  1,761,960

$ 1,443,816

Accounts payable

797,909

805,300

Short-term notes payable

1,620,475

1,493,399

Amounts due to related parties

16,736

89

Other payables

864,097

853,040

Advances from customers

335,207

334,943

Derivative liabilities

11,920

25,359

Operating lease liabilities

9,779

9,810

Other current liabilities

397,122

293,012

Total current liabilities

5,815,205

5,258,768

Long-term borrowings

862,759

813,406

Convertible notes

226,335

225,977

Liability for uncertain tax positions

5,730

5,730

Deferred tax liabilities

67,930

66,630

Loss contingency accruals

6,887

5,000

Operating lease liabilities

72,852

25,714

Other non-current liabilities

337,560

329,209

TOTAL LIABILITIES

7,395,258

6,730,434

Equity:

Common shares

835,543

835,543

Additional paid-in capital

2,785

1,127

Retained earnings

1,359,232

1,275,520

Accumulated other comprehensive loss

(149,722)

(170,551)

Total Canadian Solar Inc. shareholders’
equity

2,047,838

1,941,639

Non-controlling interests

386,227

365,055

TOTAL EQUITY

2,434,065

2,306,694

TOTAL LIABILITIES AND EQUITY

$ 9,829,323

$ 9,037,128

Source: Canadian Solar Inc.

Supermicro Leads the Industry with the First Eight-Socket and Four-Socket Servers for the Most Demanding Enterprise, Database, and Mission-Critical Workloads, Based On Intel CPUs

With Up To 480 Cores, 32TB of Memory, and 12 GPUs, These Systems Can Power Generative AI on SAP and Oracle Workflows in Real Time

SAN JOSE, Calif., May 10, 2023 /PRNewswire/ — Supermicro, Inc. (NASDAQ: SMCI), a Total IT Solution Provider for Cloud, AI/ML, Storage, and 5G/Edge, is introducing the most powerful server in its lineup for large-scale database and enterprise applications. The Multi-Processor product line includes the 8-socket server, ideal for in-memory databases requiring up to 480 cores and 32TB of DDR5 memory for maximum performance. In addition, the product line includes a 4-socket server, which is ideal for applications that require a single system image of up to 240 cores and 16TB of high-speed memory. These powerful systems all use 4th Gen Intel Xeon Scalable processors. Compared with the previous generation of 8-socket and 4-socket servers, the systems have 2X the core count, 1.33X the memory capacity, and 2X the memory bandwidth. Also, these systems deliver up to 4X the I/O bandwidth compared to previous generations of systems for connectivity to peripherals. The Supermicro 8-socket system has attained the highest performance ratings ever for a single system based on the SPECcpu2017 FP Rate benchmarks, for both the base and peak results. In addition, the Supermicro 8-socket and 4-socket servers demonstrate performance leadership on a wide range of SPEC benchmarks. Learn more about the SPEC benchmarks at: http://www.spec.org.

Versatile New 8-Socket and 4-Socket Servers for Scale-up Applications

“We continue to address the needs of our enterprise customers with our new 8-socket and 4-socket servers, the largest and most powerful servers in the industry today,” said Charles Liang, president, and CEO of Supermicro. “We are addressing the needs of the most demanding organizations worldwide, who require the simplicity and serviceability of a single system with up to 480 cores, 32TB of memory, and up to 12 NVIDIA H100 Tensor Core GPUs in a single enclosure. Our new 8-socket systems lead the entire industry in both floating point and integer performance for large MP systems. With our Building Block Solutions approach to server design allows us to bring a wide range of servers to market faster, from the edge to the corporate data center. Supermicro now delivers Rack Scale Solutions for our customers worldwide without constraints.”

Learn more about Supermicro X13 Multi-Processor Servers at: https://www.supermicro.com/en/products/mp?pro=generation_new%3DX13

Both the 8-socket and 4-socket servers have been certified for SAP HANA and Oracle Database and Applications. The large memory pools available to these systems allow superior SAP and Oracle performance as all workloads are scaled up in a single node without the latency of horizontally scaling across networks. In addition, the 4-socket system can host two double-width GPUs while the 8-socket system can host up to 12 double-width GPUs allowing for real-time or batch AI training and inferencing against SAP and Oracle datasets. The versatility and expandability of these systems futureproof  SAP and Oracle deployments for rapidly evolving generative AI automation of ERP workflows.

The new 8-socket and 4-socket servers reduce complexity when creating a high-performance data center for enterprise applications, such as Artificial Intelligence (AI), Databases, Analytics, Business Intelligence, ERP, CRM, and Scientific Visualization workloads. By bringing massive amounts of computing, memory, and storage resources together within a single instance of the operating system, the management of the system is reduced, as is the networking to other servers. The specifications of the two new systems:

  • SYS-681E-TR: Up to TDP 350W, 480 Cores, 32TB of DDR5 Memory, 12 Double-Wide GPUs and 24x 2.5″ Drives, 6U
  • SYS-241H-TNRTTP: Up to TDP 350W, 240 Cores, 16TB of DDR5 Memory, 4 Single-Wide GPUs and 8x 2.5″ Drives, 2U
  • SYS-241E-TNRTTP: Up to TDP 185W, 96 cores, 16TB of DDR5 Memory, 2 Double-Wide GPUs and 24x 2.5″ Drives, 2U

“Supermicro is a leader in developing scale-up systems that use the 4th Gen Intel Xeon Scalable processors. These systems are designed to accelerate enterprise applications with hundreds of cores and terabytes of memory,” stated Greg Ernst, Intel Americas corporate vice president and general manager. “We work closely with Supermicro to deliver innovative systems for large scale applications.”

About Super Micro Computer, Inc.

Supermicro (NASDAQ: SMCI) is a global leader in Application-Optimized Total IT Solutions. Founded and operating in San Jose, California, Supermicro is committed to delivering first to market innovation for Enterprise, Cloud, AI, and 5G Telco/Edge IT Infrastructure. We are transforming into a Total IT Solutions provider with server, AI, storage, IoT, and switch systems, software, and services while delivering advanced high-volume motherboard, power, and chassis products. The products are designed and manufactured in-house (in the US, Taiwan, and the Netherlands), leveraging global operations for scale and efficiency and optimized to improve TCO and reduce environmental impact (Green Computing). The award-winning portfolio of Server Building Block Solutions® allows customers to optimize for their exact workload and application by selecting from a broad family of systems built from our flexible and reusable building blocks that support a comprehensive set of form factors, processors, memory, GPUs, storage, networking, power, and cooling solutions (air-conditioned, free air cooling or liquid cooling).

Supermicro, Server Building Block Solutions, and We Keep IT Green are trademarks and/or registered trademarks of Super Micro Computer, Inc. 

Intel, the Intel logo, and other Intel marks are trademarks of Intel Corporation or its subsidiaries.

All other brands, names, and trademarks are the property of their respective owners.

Source: Super Micro Computer, Inc.

Omdia: Global display fabs capacity utilization recover to 74% in 2Q23 while OLED fabs are under 60% average

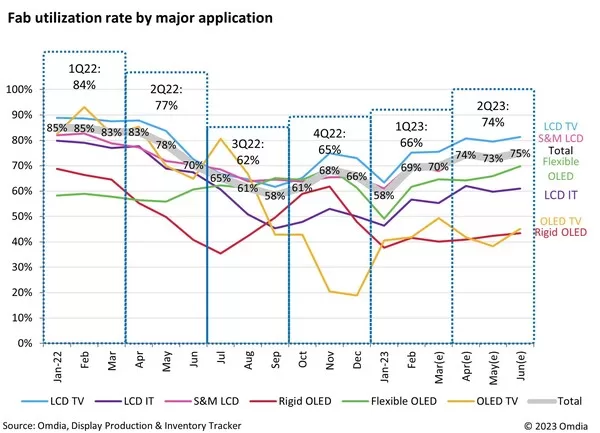
LONDON, April 18, 2023 /PRNewswire/ — New research from Omdia’s Display Production & Inventory Tracker reveals that total display fab capacity utilization is recovering from 66% in 1Q23 to 74% in 2Q23 thanks to surging orders of LCD TVs, notebooks, monitor panels and smart phone LCD panels. However, OLED fabs are still facing challenges to raise capacity utilization with average OLED fabs capacity utilization expected to be under 60% in the first six months of 2023.

Fab utilization rate by major application

2022’s over -supply has devastated LCD and OLED fabs capacity utilization. After low utilization in 1Q23, LCD fabs are gradually picking up the glass substrate input from 2Q23. LCD makers, especially in China, are gradually and cautiously raising their capacity utilization following disciplined capacity control to sustain panel prices.

In 2Q23, even with increasing orders and some rush demand surge, most LCD makers are setting up a roof of 80% capacity utilization rate. 

David Hsieh, Senior Director in Omdia’s Display research practice said: “OLED fabs are in lower capacity utilization than the mature, smoother running LCD fabs. Parameters for these include TFT array backplane throughput, OLED evaporation takt time, complex product switch, touch sensor patterning lead time, and the customization of OLED module form factor.”

On these parameters, the so-called full capacity utilization of LCD fabs can be viewed as 100% loading, but for OLED, 80%-90% on the total designed capacity can be viewed as full loading.

“The issue for OLED now is slow demand, rather than these process parameters,” added Hsieh.

Omdia forecasts that demand for smartphone OLED will not fully recover through 1H23 while OLED TV fabs will face slow market demand. OLED TV panel orders from LGE, Sony, Panasonic, TPV, Hisense, Samsung are not sufficient for the Gen8.5 OLED fabs to sustain a high-capacity utilization rate, and some China flexible Gen6 OLED fabs are suffering from unstable orders and a struggling throughput situation.

“While the recovery of LCD is receiving prominence and will obviously help uphold LCD prices and capacity utilization simultaneously, OLED will need to wait for further high-end consumer electronics demand recovery,” concludes Hsieh.

David Hsieh is presenting at Touch Taiwan 2023 and Taiwan Tech Conference 2023

About Omdia

Omdia, part of Informa Tech, is a technology research and advisory group. Our deep knowledge of tech markets combined with our actionable insights empower organizations to make smart growth decisions.

E: fasiha.khan@informa.com   

Delta Honored as “A” Grade Supplier Engagement Leader by CDP for Supply Chain Sustainability for the 3rd Consecutive Year

TAIPEI, March 24, 2023 /PRNewswire/ — CDP recently announced their 2022 Supplier Engagement Rating (SER), and named Delta the “Supplier Engagement Leader” with the highest scores, “A” rating, in key rating categories such as “Overall CDP Climate Change Performance”, “Supply Chain Engagement” and “Scope 3 Emissions”.  This is the third consecutive year that CDP has recognized Delta as Supplier Engagement Leader, after awarding Delta the Double A List Rating on “Climate Change” and “Water Security” last year. Delta’s efforts and action on climate issues are once again recognized by indicative assessment.

Jesse Chou, chief sustainability officer of Delta, stated that Delta has long been concerned about climate change and global warming, while proactively participating in international sustainability initiatives, and implementing energy-saving projects in daily operations. In 2021, Delta achieved its SBT target ahead of schedule and today the proportion of renewable electricity used at Delta’s global sites has reached 55%. Based on this achievement, Delta is committed to reaching RE100 and carbon neutrality by 2030 and has established a long-term strategy with plans to achieve net zero emissions by 2050 in response to global efforts to control global warming in line with the 1.5°C pathway. This makes Delta the first company in the technology hardware and equipment industry in Asia and the 125th company in the world to have passed the SBTi’s net-zero science-based target review*1.

To achieve the long-term target of net zero emissions in 2050, Delta has set a target to reduce Scope 3 emissions*2 by 25% in 2030 compared with a base year of 2021. Delta also strives to create a sustainable supply chain and demands its tier 1 suppliers to meet the ISO14064-1 greenhouse gas emissions standard by 2025. In addition to regularly providing ESG training for suppliers, Delta leads suppliers in carrying out carbon inventory, collaborates with more than 90% of its tier 1 suppliers every year on climate change related issues, and provides their energy-saving and carbon reduction experience to help suppliers implement carbon reduction. Delta also promotes a supply chain sustainability plan, helping long-term suppliers with energy-saving diagnosis and improvement, and at the same time promoting Delta’s energy-saving products and solutions in the process. Delta’s technical expertise has helped a semiconductor manufacturer implement energy-saving improvements with an overall investment of US$1.8 million and an annual electricity savings of 14 million kWh, equivalent to an annual savings of US$1.15 million*3.

Each year, Delta calculates the manufacturing carbon footprint for nearly 40 customers participating in the CDP supply chain program and provides energy-saving technologies and carbon reduction benefits to reduce greenhouse gas emissions at each manufacturing step. From 2010 to 2021, Delta’s high-efficiency products have helped global customers save a total of 35.9 billion kilowatt-hours of electricity, which is equivalent to reducing 19.01 million tons of carbon emissions. Since 2015, 11 energy-saving products shipped by Delta, including electronic ballasts, server power supplies, photovoltaic inverters, electric vehicle DC chargers, have been successively verified by ISAE 3000, demonstrating actual results in helping customers in carbon reduction. In addition, Delta’s main production plants were 100% compliant with ISO 14064-1 certification in both the scope 1 and scope 2 greenhouse gases emissions in 2021, and scope 3 has also been certified by a third party. The manufacturing plants and buildings have also implemented 80 water-saving programs and 64 waste reduction measures, saving a total of 165.8 thousand tons of water and 3,986 metric tons of waste*3.  All of Delta’s climate actions and actual results are in line with CDP SER’s target of carbon reduction through supplier engagement.

CDP’s annual environmental disclosure and scoring is recognized as an important standard for the transparency of corporate environmental sustainability. Its supply chain program has about 280 major members, with a total procurement expenditure of up to US$6.4 trillion. CDP conducts its annual SER assessment using each company’s response to questions on governance, targets, Scope 3 emissions, overall climate change project performance, and supply chain engagement in the CDP Climate Change questionnaire with companies on a supply chain program. In 2022, more than 18,500 companies participated in CDP disclosure.

Note 1.     The net-zero SBT set by Delta was approved by SBTi in December 2022 where the long-term target is to reduce Scope 1+2+3 greenhouse gas emissions by 2050 with the base year of 2021. At the same time, Delta establishes a new short-term target based on the 1.5°C pathway including a reduction of Scope 1+2 emissions by 90% in 2030, and a reduction of Scope 3 emissions by 25% compared with the base year of 2021, which is stricter than the SBTi 1.5°C requirement to reduce Scope 1+2 emissions by 42% in 2030.

Note 2.     Scope of Greenhouse Gas Emissions (Scope 1-3):
–  Scope 1: Direct emissions from the sources owned or controlled by an organization (such as diesel, gasoline, or natural gas)
–  Scope 2: Indirect emissions from an organization’s purchased electricity
–  Scope 3: Other indirect emissions from the upstream and downstream organizational activities of a company’s supply chain

Note 3.     Please refer to the 2021 Delta Electronics ESG Report.

About Delta

Delta, founded in 1971, is a global leader in switching power supplies and thermal management products with a thriving portfolio of smart energy-saving systems and solutions in the fields of industrial automation, building automation, telecom power, data center infrastructure, EV charging, renewable energy, energy storage and display, to nurture the development of smart manufacturing and sustainable cities. As a world-class corporate citizen guided by its mission statement, “To provide innovative, clean and energy-efficient solutions for a better tomorrow,” Delta leverages its core competence in high-efficiency power electronics and its ESG-embedded business model to address key environmental issues, such as climate change. Delta serves customers through its sales offices, R&D centers and manufacturing facilities spread over close to 200 locations across 5 continents.

Throughout its history, Delta has received various global awards and recognition for its business achievements, innovative technologies and dedication to ESG. Since 2011, Delta has been listed on the DJSI World Index of Dow Jones Sustainability™ Indices for 12 consecutive years. In 2022, Delta was also recognized by CDP with double A List for its substantial contribution to climate change and water security issues and named Supplier Engagement Leader for its continuous development of a sustainable value chain for the 3rd consecutive year.

For detailed information about Delta, please visit: www.deltaww.com