Tag Archives: ECM

Palma Ceia SemiDesign Announces Sampling for PCS11ax28, New 802.11ax Transceiver

SANTA CLARA, California, June 29, 2020 —  Palma Ceia SemiDesign, a fabless semiconductor company specializing in semiconductor chips and IP for next-generation wireless connectivity, today announced the PCS11ax28, its new chip for the 802.11ax Wi-Fi standard, is now available for customer sampling.

“We are very excited at the test outcomes for the PCS11ax28, our new 802.11ax transceiver – initial testing all came back with positive results,” said James Flowers, chief operating officer of Palma Ceia SemiDesign. “The advanced feature set of the PCS11ax28 is designed to support the ever-expanding universe of applications for the Internet of Things and our customers’ accelerating initiatives. Sample supply is initially limited due to greater than expected customer demand and we are working with our global partners to expand supply.”

The 802.11ax standard, also known as Wi-Fi 6, is the newest version of the 802.11 standard for wireless network transmissions commonly referred to as Wi-Fi. It offers greater maximum data rates than earlier standards, as well as higher network capacity to support greater numbers of IoT devices. Wi-Fi 6 is backward-compatible with the previous version of the Wi-Fi standard, 802.11ac.

Highlights of the new Wi-Fi 6 chip from Palma Ceia SemiDesign include:

  • Currently available in 1×1 MIMO configuration. Availability of 2X2 and 4X4 configurations is expected to begin Q3 2020
  • Supports Wi-Fi 6 channel bandwidths 20 MHz, 40MHz and 80MHz.
  • Supports all Wi-Fi 6 modulations up to 1024-QAM.
  • Analog I/O out can enable Bluetooth over 2.4 GHz channel.
  • Extremely low power consumption, with peak RX power consumption of only 195mW for the 1×1 configuration.
  • Based on high-performance 28-nm HPC technology

Requests for additional information and sample requests for the PCS11ax28 from Palma Ceia SemiDesign can be made via the Palma Ceia SemiDesign website or by email to wifi-for-iot@pcsemi.com.

About Palma Ceia SemiDesign

Palma Ceia SemiDesign (PCS) is a fabless semiconductor company and leading provider of communication chips and IP for next-generation Wi-Fi and cellular applications. With a focus on emerging Wi-Fi and LTE standards, PCS targets the design of ICs for broadband, wireless, medical and automotive applications. Palma Ceia SemiDesign solutions are differentiated by low-power, high-performance and ease of integration. With operational headquarters in Hong Kong, the company has design centers in Cambridge (United Kingdom), Hong Kong, and McKinney, Texas (United States). Additional sales and support activities are located in mainland China, Israel, Japan, Korea, and Taiwan. Visit Palma Ceia SemiDesign on the web at www.pcsemi.com.

Palma Ceia SemiDesign and the Palma Ceia SemiDesign logo are trademarks of Palma Ceia SemiDesign, a Cayman Islands corporation, and are protected by trademark laws of the United States and other jurisdictions. All other product and company names are trademarks or registered trademarks of their respective companies.

Palma Ceia SemiDesign Media Contact
John Molyneux
press@pcsemi.com

Logo – https://techent.tv/wp-content/uploads/2020/06/palma-ceia-semidesign-announces-sampling-for-pcs11ax28-new-802-11ax-transceiver.jpg

Related Links :

http://www.pcsemi.com

58.com Reports First Quarter 2020 Unaudited Financial Results

BEIJING, June 26, 2020 — 58.com Inc. (NYSE: WUBA) ("58.com" or the "Company"), China’s largest online classifieds marketplace, today reported its unaudited financial results for the first quarter ended March 31, 2020.

First Quarter 2020 Highlights

  • Total revenues were RMB2,560.3 million (US$361.4 million[1]), a 15.5% decrease from RMB3,028.3 million in the same quarter of 2019.
  • Total number of paying business users[2] was approximately 2.7 million in the first quarter of 2020, a 20.7% decrease from the same quarter of 2019.
  • Gross margin was 87.9% compared with 90.2% in the same quarter of 2019.
  • Loss from operations was RMB55.8 million (US$7.9 million), compared with income from operations of RMB281.3 million in the same quarter of 2019.
  • Non-GAAP income from operations[3] was RMB144.0 million (US$20.3 million), a 69.0% decrease from RMB465.1 million in the same quarter of 2019.
  • Net income attributable to 58.com Inc. ordinary shareholders was RMB1,638.6 million (US$231.3 million), a 134.7% increase from RMB698.2 million in the same quarter of 2019. This includes a net gain picked up from 58 Home of RMB2,683.2 million.
  • Non-GAAP net income attributable to 58.com Inc. ordinary shareholders [4] was RMB2,243.6 million (US$316.7 million), a 414.7% increase from RMB435.9 million in the same quarter of 2019. This includes a net gain picked up from 58 Home of RMB2,683.2 million.
  • Basic and diluted earnings per ADS attributable to ordinary shareholders were RMB10.95 (US$1.54) and RMB10.82 (US$1.53), respectively, representing 132.6% and 132.6% increases from RMB4.71 and RMB4.65, respectively, in the same quarter of 2019. One ADS represents two Class A ordinary shares.
  • Non-GAAP basic and diluted earnings per ADS[5] attributable to ordinary shareholders were RMB14.99 (US$2.12) and RMB14.81 (US$2.09), respectively, representing 410.0% and 410.1% increases from RMB2.94 and RMB2.90, respectively, in the same quarter of 2019.

First Quarter 2020 Financial Results

Revenues

Total revenues were RMB2,560.3 million (US$361.4 million), representing a decrease of 15.5% from RMB3,028.3 million in the same quarter of 2019.

Membership revenues were RMB815.6 million (US$115.1 million), a decrease of 16.9% from RMB982.0 million in the same quarter of 2019.

Online marketing services revenues were RMB1,595.4 million (US$225.2 million), a decrease of 17.8% from RMB1,940.9 million in the same quarter of 2019.

The decreases were mainly due to the adverse impact from the outbreak of COVID-19. To control the spread of COVID-19, the PRC government implemented a series of strict measures, including travel restrictions, quarantines, and a temporary shutdown of businesses which resulted in a decrease in activity level among paying business users. In particular, paying business users that require in-person meetings to conduct their business, including those in the secondary housing and rental real estate sector, used auto dealers, local service providers, and recruiters, have been adversely and materially affected by these interruptions and delayed business resumption. The Company’s revenues are generated primarily from these paying business users, most of whom are small and medium-sized local businesses, and the outbreak of COVID-19 and subsequent prevention and control measures have adversely affected their business operations and financial conditions in the first quarter of 2020. As a result, the Company’s revenues during the first quarter of 2020 declined significantly when compared with the same period in 2019.

Cost of Revenues

Cost of revenues was RMB309.3 million (US$43.7 million), an increase of 4.2% from RMB296.9 million in the same quarter of 2019.

The year-over-year increase was primarily driven by increases in the costs associated with "Premium Home Services" (到家精选), enhanced services that focus on partnering with high quality providers to further standardize their service quality and integrate service protection plans while establishing closed-loop transactions through the Company’s platforms, and an increase in the costs of goods sold and services provided on the Zhuan Zhuan platform which were partially offset by a decrease in traffic acquisition cost paid to advertising union partners.

Gross Profit and Gross Margin

Gross profit was RMB2,251.0 million (US$317.7 million), a decrease of 17.6% from RMB2,731.4 million during the same quarter of 2019.

Gross margin was 87.9% in the first quarter of 2020, compared with 90.2% during the same quarter of 2019.

Operating Expenses

Operating expenses were RMB2,306.8 million (US$325.6 million), a decrease of 5.8% from RMB2,450.1 million in the same quarter of 2019.

Sales and marketing expenses in the first quarter of 2020 were RMB1,577.5 million (US$222.7 million), a decrease of 12.0% from RMB1,793.0 million in the same quarter of 2019.

Within sales and marketing expenses, advertising expenses in the first quarter of 2020 were RMB712.2 million (US$100.5 million), a decrease of 19.7% from RMB886.5 million in the same quarter of 2019 as a result of the spread of COVID-19 which caused a decrease in advertising activities.

Non-advertising sales and marketing expenses in the first quarter of 2020 were RMB865.3 million (US$122.1 million), a decrease of 4.5% from RMB906.5 million in the same quarter of 2019.

Non-advertising sales and marketing expenses include salaries and benefits, commissions and share-based compensation expenses for the Company’s sales, sales support, customer service, marketing dealer management personnel, online and offline promotional expenses, and other operating expenses that are associated with sales and marketing activities.

Research and development expenses in the first quarter of 2020 were RMB497.0 million (US$70.1 million), essentially flat with RMB495.0 million in the same quarter of 2019.

General and administrative expenses in the first quarter of 2020 were RMB232.4 million (US$32.8 million), an increase of 43.3% from RMB162.2 million in the same quarter of 2019. The increase was mainly due to the adoption of the current expected credit losses methodology in estimating allowances for credit losses in the first quarter of 2020.

Income/(Loss) from Operations

Loss from operations was RMB55.8 million (US$7.9 million) in the first quarter of 2020, compared with income from operations of RMB281.3 million in the same quarter of 2019.

Operating margin, defined as income/(loss) from operations divided by total revenues, was negative 2.2% in the first quarter of 2020, compared with 9.3% in the same quarter of 2019.

Non-GAAP income from operations was RMB144.0 million (US$20.3 million) in the first quarter of 2020, a decrease of 69.0% from RMB465.1 million in the same quarter of 2019.

Non-GAAP operating margin, defined as non-GAAP income from operations divided by total revenues, was 5.6% in the first quarter of 2020, compared with 15.4% in the same quarter of 2019.

Other Income/(Expenses), net

Net other income in the first quarter of 2020 was RMB1,680.7 million (US$237.2 million), compared with net other income of RMB554.3 million in the same quarter of 2019.

Net other income in the first quarter of 2020 was primarily comprised of a RMB2,654.8 million gain in share of results of equity investees and RMB30.9 million in tax refunds and other government subsidies, offset by RMB1,054.3 million in a net investment loss.

Share of results of equity investees in the first quarter of 2020 was mainly attributed to RMB2,683.2 million net gain pick-up from 58 Home, which was mainly due to the Company’s proportionate share of one-time non-cash gain recognized by 58 Home for its deconsolidation of 58 Daojia Limited, a majority owned subsidiary of 58 Home, which was partially offset by the Company’s proportionate share of net loss attributable to 58 Home’s ordinary shareholders. 58 Home lost its control over 58 Daojia Limited and started to deconsolidate its financial statements when 58 Daojia Limited completed its Series B round of equity financing in February 2020, as certain Series B investors have substantive participating rights in the operational decision making of 58 Daojia Limited.

Net investment loss mainly included RMB683.3 million in impairment losses in long-term investments and RMB446.1 million losses in change in fair value of long-term investments and investments in convertible notes as the market value of certain fair value measured investments suffered downward adjustments in the first quarter of 2020.

There would have been net other expenses of RMB1,002.5 million (US$141.5 million) in the first quarter of 2020 if the RMB2,683.2 million net gain picked up from 58 Home was excluded.

Net Income Attributable to 58.com Inc. Ordinary Shareholders

Net income attributable to 58.com Inc. ordinary shareholders was RMB1,638.6 million (US$231.3 million) in the first quarter of 2020, an increase of 134.7% from RMB698.2 million in the same quarter of 2019. Excluding the RMB2,683.2 million net gain picked up from 58 Home, net loss attributable to 58.com Inc. ordinary shareholders in the first quarter of 2020 was RMB1,044.5 million (US$147.4 million).

Net margin, defined as net income attributable to 58.com Inc. ordinary shareholders divided by total revenues, was 64.0% in the first quarter of 2020, compared with 23.1% in the same quarter of 2019. Excluding the net gain picked up from 58 Home, net margin in the first quarter of 2020 was negative 40.8%.

Non-GAAP net income attributable to 58.com Inc. ordinary shareholders was RMB2,243.6 million (US$316.7 million) in the first quarter of 2020, an increase of 414.7% from RMB435.9 million in the same quarter of 2019. Excluding the net gain picked up from 58 Home, non-GAAP net loss attributable to 58.com Inc. ordinary shareholders in the first quarter of 2020 was RMB439.6 million (US$62.0 million).

Non-GAAP net margin, defined as non-GAAP net income attributable to 58.com Inc. ordinary shareholders divided by total revenues, was 87.6% in the first quarter of 2020, compared with 14.4% in the same quarter of 2019. Excluding the net gain picked up from 58 Home, non-GAAP net margin in the first quarter of 2020 was negative 17.2%.

Basic and Diluted Earnings per ADS

Basic and diluted earnings per ADS attributable to ordinary shareholders in the first quarter of 2020 were RMB10.95 (US$1.54) and RMB10.82 (US$1.53), respectively, representing 132.6% and 132.6% increases from RMB4.71 and RMB4.65, respectively, in the same quarter of 2019.

Non-GAAP basic and diluted earnings per ADS attributable to ordinary shareholders in the first quarter of 2020 were RMB14.99 (US$2.12) and RMB14.81 (US$2.09), respectively, representing 410.0% and 410.1% increases from RMB2.94 and RMB2.90, respectively, in the same quarter of 2019.

Cash Flow

Net cash used in operating activities was RMB379.4 million (US$53.6 million) in the first quarter of 2020, compared to net cash provided by operating activities of RMB564.9 million in the same quarter of 2019.

Cash and Cash Equivalents, Term Deposits, Restricted Cash and Short-term Investments 

As of March 31, 2020, the Company had cash and cash equivalents, term deposits, restricted cash and short-term investments of RMB12,547.3 million (US$1,770.9 million).

Shares Outstanding

As of March 31, 2020, the Company had a total of 299,728,769 ordinary shares (including 254,496,649 Class A and 45,232,120 Class B ordinary shares) issued and outstanding.

Non-GAAP Financial Measures     

To supplement the financial measures prepared in accordance with generally accepted accounting principles in the United States, or GAAP, this press release presents non-GAAP income/(loss) from operations, non-GAAP operating margin, non-GAAP net income/(loss) attributable to 58.com Inc. ordinary shareholders, non-GAAP net margin and non-GAAP basic and diluted earnings/(loss) per share and per ADS by excluding share-based compensation expenses, amortization of intangible assets resulting from business acquisitions, change in fair value of long-term investments and investments in convertible notes, share-based compensation expenses included in share of results of equity investees, income tax effects of above GAAP to non-GAAP reconciling items. The Company believes these non-GAAP financial measures are important to help investors understand the Company’s operating and financial performance, compare business trends among different reporting periods on a consistent basis and assess the Company’s core operating results, as they exclude certain expenses/gains that are not expected to result in cash payments/receipts. The use of the above non-GAAP financial measures has certain limitations. Share-based compensation expenses, amortization of intangible assets resulting from business acquisitions, non-cash gain or loss and income tax effects resulting from GAAP to non-GAAP reconciling items have been and will continue to be incurred in the future and are not reflected in the presentation of the non-GAAP financial measures, but should be considered in the overall evaluation of the Company’s results. The Company compensates for these limitations by providing the relevant disclosure of its share-based compensation expenses, amortization of intangible assets resulting from business acquisitions, change in fair value of long-term investments and investments in convertible notes, share-based compensation expenses included in share of results of equity investees, income tax effects of above GAAP to non-GAAP reconciling items, all of which should be considered when evaluating the Company’s performance. These non-GAAP financial measures should be considered in addition to financial measures prepared in accordance with GAAP, but should not be considered a substitute for, or superior to, financial measures prepared in accordance with GAAP. Reconciliation of each of these non-GAAP financial measures to the most directly comparable GAAP financial measure is set forth at the end of this release.

[1] This press release contains translations of certain Renminbi (RMB) amounts into U.S. dollars (US$) solely for the convenience of the readers. Unless otherwise specified, all translations of Renminbi amounts into US$ amounts in this press release are made at RMB7.0851 to US$1.00, which was the U.S. dollars middle rate announced by the PRC State Administration of Foreign Exchange on March 31, 2020. The percentages stated in this press release are calculated based on the Renminbi amounts. On June 24, 2020, such exchange rate was RMB7.0555 to US$1.00.

[2] Paying business users refer to users who are identified as business users with unique identity information such as business licenses or personal identification information and who used the Company’s subscription-based membership services or purchased at least one type of online marketing services in a given period. One paying business user can open up several paying user accounts on one or multiple online platforms. The number and the percentage calculation does not include paying business users on Ganji as the Company stopped selling stand-alone Ganji subscription-based membership services in 2018 or earlier in all of its content categories.

[3] Non-GAAP income from operations is defined as income from operations excluding share-based compensation expenses and amortization of intangible assets resulting from business acquisitions. See "Reconciliation of GAAP and Non-GAAP Results" at the end of this press release.

[4] Non-GAAP net income attributable to 58.com Inc. ordinary shareholders is defined as net income attributable to 58.com Inc. ordinary shareholders excluding share-based compensation expenses, amortization of intangible assets resulting from business acquisitions, change in fair value of long-term investments and investments in convertible notes, share-based compensation expenses included in share of results of equity investees, and income tax effects of GAAP to non-GAAP reconciling items. See "Reconciliation of GAAP and Non-GAAP Results" at the end of this press release. 

[5] Non-GAAP basic and diluted earnings per ADS is defined as non-GAAP net income attributable to 58.com Inc. ordinary shareholders divided by weighted average number of basic and diluted ADSs.

About 58.com Inc.

58.com Inc. (NYSE: WUBA) operates China’s largest online classifieds marketplace, as measured by monthly unique visitors on both its www.58.com website and mobile applications. The Company’s online marketplace enables local business users and consumer users to connect, share information and conduct business. 58.com’s broad, in-depth and high quality local information, combined with its easy-to-use website and mobile applications, has made it a trusted marketplace for consumers. 58.com’s strong brand recognition, large and growing user base, merchant network and massive database of local information create a powerful network effect. For more information on 58.com, please visit http://www.58.com.

Safe Harbor Statements

This press release contains forward-looking statements made under the "safe harbor" provisions of the U.S. Private Securities Litigation Reform Act of 1995. These forward-looking statements can be identified by terminology such as "will," "expects," "anticipates," "future," "intends," "plans," "believes," "estimates," "confident" and similar statements. 58.com may also make written or oral forward-looking statements in its reports filed with or furnished to the U.S. Securities and Exchange Commission, in its annual report to shareholders, in press releases and other written materials and in oral statements made by its officers, directors or employees to third parties. Any statements that are not historical facts, including statements about 58.com’s beliefs and expectations, are forward-looking statements that involve factors, risks and uncertainties that could cause actual results to differ materially from those in the forward-looking statements. Such factors and risks include, but not limited to the following: 58.com’s goals and strategies; its future business development, financial condition and results of operations; its ability to retain and grow its user base and network of local merchants for its online marketplace; the growth of, and trends in, the markets for its services in China; the outbreak of COVID-19 or other health epidemics in China or globally; the demand for and market acceptance of its brand and services; competition in its industry in China; its ability to maintain the network infrastructure necessary to operate its website and mobile applications; relevant government policies and regulations relating to the corporate structure, business and industry; and its ability to protect its users’ information and adequately address privacy concerns. Further information regarding these and other risks, uncertainties or factors is included in the Company’s filings with the U.S. Securities and Exchange Commission. All information provided in this press release is current as of the date of the press release, and 58.com does not undertake any obligation to update such information, except as required under applicable law.

For more information, please contact:

58.com Inc.
ir@58.com

Christensen

In China
Mr. Christian Arnell
Phone: +86-10-5900-1548
E-mail: carnell@christensenir.com

In US
Ms. Linda Bergkamp
Phone: +1-480-614-3004
Email: lbergkamp@ChristensenIR.com


58.com Inc.

UNAUDITED CONDENSED CONSOLIDATED BALANCE SHEETS

(in thousands, except share and per share data, unless otherwise)

As of

December 31, 2019

March 31, 2020

March 31, 2020

RMB

RMB

US$

ASSETS

Current assets:

Cash and cash equivalents…………………………………………………………………………………………………………………………………..

5,293,206

4,876,057

688,213

Restricted cash-current……………………………………………………………………………………………………………………………………….

477,099

538,724

76,036

Term deposits……………………………………………………………………………………………………………………………………………………

70,000

70,000

9,880

Short-term investments……………………………………………………………………………………………………………………………………….

8,414,348

7,062,554

996,818

Accounts receivable, net……………………………………………………………………………………………………………………………………..

1,209,251

1,105,326

156,007

Prepayments and other current assets……………………………………………………………………………………………………………………

2,326,920

2,830,994

399,570

Total current assets………………………………………………………………………………………………………………………………………….

17,790,824

16,483,655

2,326,524

Non-current assets:

Property and equipment, net………………………………………………………………………………………………………………………………..

1,305,793

1,285,024

181,369

Intangible assets, net…………………………………………………………………………………………………………………………………………..

886,565

840,901

118,686

Right-of-use assets, net………………………………………………………………………………………………………………………………………

275,459

253,408

35,766

Land use rights, net……………………………………………………………………………………………………………………………………………

3,532

3,512

496

Goodwill………………………………………………………………………………………………………………………………………………………….

15,874,220

15,874,220

2,240,508

Long-term investments……………………………………………………………………………………………………………………………………….

6,086,511

8,249,490

1,164,343

Investments in convertible notes…………………………………………………………………………………………………………………………..

669,715

817,270

115,351

Long-term prepayments and other non-current assets……………………………………………………………………………………………..

469,592

803,450

113,400

Total non-current assets…………………………………………………………………………………………………………………………………..

25,571,387

28,127,275

3,969,919

Total assets……………………………………………………………………………………………………………………………………………………..

43,362,211

44,610,930

6,296,443

LIABILITIES, MEZZANINE EQUITY AND
SHAREHOLDERS’ EQUITY

Current liabilities:

Accounts payable………………………………………………………………………………………………………………………………………………

1,042,697

1,387,244

195,797

Deferred revenues……………………………………………………………………………………………………………………………………………..

2,154,920

1,691,080

238,681

Customer advances…………………………………………………………………………………………………………………………………………….

1,986,108

1,970,655

278,141

Taxes payable……………………………………………………………………………………………………………………………………………………

698,104

362,025

51,097

Salary and welfare payable………………………………………………………………………………………………………………………………….

753,267

560,843

79,158

Operating lease liabilities, current…………………………………………………………………………………………………………………………

137,310

114,304

16,133

Accrued expenses and other current liabilities………………………………………………………………………………………………………..

1,053,007

1,082,811

152,829

Total current liabilities……………………………………………………………………………………………………………………………………..

7,825,413

7,168,962

1,011,836

Non-current liabilities:

Deferred tax liabilities…………………………………………………………………………………………………………………………………………

389,719

324,514

45,802

Operating lease liabilities, non-current…………………………………………………………………………………………………………………..

138,554

157,195

22,187

Total non-current liabilities………………………………………………………………………………………………………………………………

528,273

481,709

67,989

Total liabilities…………………………………………………………………………………………………………………………………………………

8,353,686

7,650,671

1,079,825

Mezzanine equity:

Mezzanine classified noncontrolling interests…………………………………………………………

3,668,876

3,815,512

538,526

Total mezzanine equity…………………………………………………………………………………………………………………………………….

3,668,876

3,815,512

538,526

Shareholders’ equity:

58.com Inc. shareholders’ equity:

Ordinary shares (US$0.00001 par value, 4,800,000,000 Class A and
    200,000,000 Class B shares authorized, 254,045,293 Class A and
    45,232,120 Class B shares issued and outstanding as of December 31,
    2019 and 254,496,649 Class A and 45,232,120 Class B shares issued
   
and outstanding as of March 31, 2020, respectively)


19


19


3

Additional paid-in capital…………………………………………………………………………………………………………………………………….

21,942,829

22,026,581

3,108,860

Retained earnings………………………………………………………………………………………………………………………………………………

8,892,773

10,529,706

1,486,176

Accumulated other comprehensive income…………………………………………………………………………………………………………….

95,903

178,710

25,223

Total 58.com Inc. shareholders’ equity……………………………………………………………………………………………………………..

30,931,524

32,735,016

4,620,262

Noncontrolling interests…………………………………………………………………………………………………………………………………..

408,125

409,731

57,830

Total shareholders’ equity……………………………………………………………………………………………………………………………….

31,339,649

33,144,747

4,678,092

Total liabilities, mezzanine equity and shareholders’ equity

43,362,211

44,610,930

6,296,443


58.com Inc.

UNAUDITED CONDENSED CONSOLIDATED STATEMENTS OF OPERATIONS

(in thousands, except share, per share and per ADS data, unless otherwise noted)

For the Three Months Ended

March 31,

2019

December 31,

2019

March 31,

2020

March 31,

2020

RMB

RMB

RMB

US$

Revenues:

Membership……………………………………………………………………………..

982,028

1,112,362

815,624

115,118

Online marketing services…………………………………………………………

1,940,900

2,713,807

1,595,421

225,180

E-commerce services………………………………………………………………..

28,023

53,722

8,744

1,234

Other revenues………………………………………………………………………….

77,302

275,643

140,553

19,838

Total revenues……………………………………………………………………………..

3,028,253

4,155,534

2,560,342

361,370

Cost of revenues(1)………………………………………………………………………..

(296,851)

(565,985)

(309,344)

(43,661)

Gross profit………………………………………………………………………………….

2,731,402

3,589,549

2,250,998

317,709

Operating expenses(1):

Sales and marketing expenses(2)……………………………………………….

(1,792,950)

(2,023,502)

(1,577,510)

(222,652)

Research and development expenses……………………………………….

(494,977)

(560,746)

(496,970)

(70,143)

General and administrative expenses……………………………………….

(162,168)

(264,172)

(232,361)

(32,796)

Total operating expenses…………………………………………………………….

(2,450,095)

(2,848,420)

(2,306,841)

(325,591)

Income/(loss) from operations……………………………………………………

281,307

741,129

(55,843)

(7,882)

Other income/(expenses):

Interest income, net…………………………………………………………………..

8,462

27,841

31,783

4,486

Investment income/(loss), net…………………………………………………..

544,570

1,924,195

(1,054,274)

(148,802)

Share of results of equity investees…………………………………………..

(10,571)

9,806

2,654,755

374,695

Foreign currency exchange gain/(loss), net……………………………….

2,949

(8,601)

9,900

1,397

Others, net…………………………………………………………………………………

8,928

134,871

38,488

5,432

Income before tax………………………………………………………………………..

835,645

2,829,241

1,624,809

229,326

Income tax benefit/(expenses)…………………………………………………

(106,109)

(158,122)

75,700

10,684

Net income……………………………………………………………………………………

729,536

2,671,119

1,700,509

240,010

Net loss attributable to noncontrolling interests………………………..

2,314

4,075

4,069

574

Net income attributable to 58.com Inc.………………………………………

731,850

2,675,194

1,704,578

240,584

Deemed dividend to mezzanine classified
noncontrolling interests……………………………………………………………………………………..

(33,700)


(65,428)

(65,955)

(9,309)

Net income attributable to 58.com Inc. ordinary
shareholders
..

698,150

2,609,766

1,638,623

231,275

Net earnings per ordinary share attributable to
ordinary shareholders – basic……………………………………………………………………….

2.35

8.72

5.47

0.77

Net earnings per ordinary share attributable to
ordinary shareholders – diluted…………………………………………………………………….

2.33

8.64

5.41

0.76

Net earnings per ADS attributable to ordinary
shareholders – basic (1 ADS represents 2 Class A
ordinary shares)……………………………….

4.71

17.45

10.95

1.54

Net earnings per ADS attributable to ordinary
shareholders – diluted (1 ADS represents 2 Class A
ordinary shares)……………………………….

4.65

17.28

10.82

1.53

Weighted average number of ordinary shares used in
computing basic earnings per share………………………………………………………………..

296,690,552


299,155,358

299,427,404

299,427,404

Weighted average number of ordinary shares used in
computing diluted earnings per share……………………………………………………………..

300,250,567


302,001,274

302,932,654

302,932,654


Note:

(1)  Share–based compensation expenses were allocated in cost of revenues and operating expenses as follows:

Cost of revenues……………………………………………………………………….

1,833

2,895

3,322

469

Sales and marketing expenses……………………………………………………..

28,520

31,612

29,909

4,221

Research and development expenses……………………………………………

51,220

62,520

65,681

9,270

General and administrative expenses……………………………………………

51,732

61,935

59,567

8,407

(2)  Amortization of intangible assets resulting from business acquisitions were allocated in operating expenses as follows:

Sales and marketing expenses………………………………………………..

42,954

43,087

42,954

6,063

Research and development expenses……………………………………….

11,997

12,015

2,433

343

(3)  Breakdown of sales and marketing expenses was as follows:

Advertising expenses……………………………………………………………

886,470

865,144

712,239

100,526

Non-advertising sales and marketing expenses…………………………

906,480

1,158,358

865,271

122,126


58.com Inc.

Reconciliation of GAAP and Non-GAAP Results

(in thousands, except share, ADS, per share and per ADS data, unless otherwise noted)

For the Three Months Ended

March 31,

2019

December 31,

2019

March 31,

2020

March 31,

2020

RMB

RMB

RMB

US$

GAAP income/(loss) from operations…………………………………………

281,307

741,129

(55,843)

(7,882)

Share-based compensation expenses[6]………………………………………

128,875

154,244

154,451

21,799

        Amortization of intangible assets resulting from
        business acquisitions………………………………………………………………………………..


54,951


55,102


45,387


6,406

Non-GAAP income from operations…………………………………………..

465,133

950,475

143,995

20,323

GAAP net income attributable to 58.com Inc.…………………………….

698,150

2,609,766

1,638,623

231,275

Share-based compensation expenses………………………………………..

128,875

154,244

154,451

21,799

        Amortization of intangible assets resulting from
        business acquisitions………………………………………………………………………………..


54,951


55,102


45,387


6,406

Change in fair value of long-term investments and
investments in convertible notes[7]…………………………………………………………………..

(508,950)

2,258,544

446,081

62,960

        Share-based compensation expenses included in share
        of results of equity investees…………………………………………………………………….


9


        Income tax effects of GAAP to non-GAAP reconciling
        items[8]…..


62,878


(200,057)


(40,949)


(5,780)

Non-GAAP net income attributable to 58.com Inc.…………………….

435,913

4,877,599

2,243,593

316,660

GAAP operating margin……………………………………………………………..

9.3%

17.8%

(2.2)%

(2.2)%

    Share-based compensation expenses………………………………………..

4.3%

3.7%

6.0%

6.0%

        Amortization of intangible assets resulting from
        business acquisitions………………………………………………………………………………..


1.8%


1.4%


1.8%


1.8%

Non-GAAP operating margin……………………………………………………..

15.4%

22.9%

5.6%

5.6%

GAAP net margin…………………………………………………………………………

23.1%

62.8%

64.0%

64.0%

    Share-based compensation expenses………………………………………..

4.3%

3.7%

6.0%

6.0%

        Amortization of intangible assets resulting from
        business acquisitions………………………………………………………………………………..

1.8%

1.4%

1.8%

1.8%

        Change in fair value of long-term investments and
        investments in convertible notes……………………………………………………………………

(16.8)%

54.4%

17.4%

17.4%

        Share-based compensation expenses included in share
        of results of equity investees…………………………………………………………………….

0.0%

0.0%

0.0%

0.0%

        Income tax effects of GAAP to non-GAAP reconciling
        items……

2.0%

(4.9)%

(1.6)%

(1.6)%

Non-GAAP net margin…………………………………………………………………

14.4%

117.4%

87.6%

87.6%

Weighted average number of ordinary shares used in
computing non-GAAP basic earnings per share………………………..

296,690,552


299,155,358

299,427,404

299,427,404

Weighted average number of ordinary shares used in
computing non-GAAP diluted earnings per share……………………..

300,250,567


302,001,274

302,932,654

302,932,654

Weighted average number of ADS used in computing
non-GAAP basic earnings per ADS…………………………………………………..

148,345,276

149,577,679

149,713,702

149,713,702

Weighted average number of ADS used in computing
non-GAAP diluted earnings per ADS………………………………………………..

150,125,284

151,000,637

151,466,327

151,466,327

Non-GAAP net earnings per ordinary share
attributable to ordinary shareholders – basic…………………………………………………….

1.47

16.30

7.49

1.06

Non-GAAP net earnings per ordinary share
attributable to ordinary shareholders – diluted………………………………………………….

1.45

16.15

7.41

1.05

Non-GAAP net earnings per ADS attributable to
ordinary shareholders – basic……………………………………………………………………

2.94

32.61

14.99

2.12

Non-GAAP net earnings per ADS attributable to
ordinary shareholders – diluted…………………………………………………………………

2.90

32.30

14.81

2.09


[6] Since the third quarter of 2017, certain share-based awards with redemption features granted to the Company’s employees were expected to be settled in cash and were classified as liabilities. The share-based compensation expenses recognized for this type of awards amounted to RMB4.4 million, RMB4.7 million and RMB4.0 million for the first and fourth quarter of 2019 and the first quarter of 2020, respectively, which were excluded from the GAAP to non-GAAP reconciliation accordingly.

[7] The purpose of this reconciliation is to exclude the unrealized gain or loss relating to changes in fair value of long-term investments and investments in convertible notes. The amount of realization of any previously recognized unrealized gain or loss in a given period is also included in this line item so that the non-GAAP net income would only include cumulative realized gain or loss.

[8] This is to exclude the income tax effects related to amortization of intangible assets resulting from business acquisitions and change in fair value of long-term investments and investments in convertible notes. Other GAAP to non-GAAP reconciling items have no income tax effect.


Related Links :

http://www.58.com

Klarna and Universal Music keep track of Australia’s lockdown buying habits with pop parody.

SYDNEY, June 26, 2020 — Leading shopping service and payments provider Klarna is helping Australians make smarter decisions about what to buy online during our ‘new normal’.

To encourage the entire country to buy only the things we really love and actually need, Klarna, in partnership with Universal Music Australia’s creative agency BRING, has today released a parody music video about Australia’s online shopping habits during lockdown.

Starring local favourites, The Inspired Unemployed, musicians Thandi Phoenix and TukaGet What I Love shines a big pink spotlight on all the things we’ve been buying, but never knew we really needed…hello Tiger King g-string!

An original R’n’B flavoured pop song which was written collaboratively over Zoom, Get What I Love is about finding fun ways to make use of the stuff we’ve bought during isolation, that in a different world may not have been added to our cart.

Klarna talks to shoppers on their terms and creates services, experiences and content which are very different from what people expect from a brand in the fintech, finance or banking space.

The pop parody allows Klarna to extend its support of local retailers to emerging homegrown artists in what is a tough time for the Australian entertainment industry.

Andrea Darling, Klarna’s Head of Marketing for Australia and New Zealand says:
“We are so excited about this collaboration and working with such amazing Australian talent. Klarna is all about the consumer experience and inviting customers into our world. This music video clip illustrates perfectly how we do things differently and in a fun way. It’s time for a new kind of shopping service that is genuinely interested in its customer and fits with their lifestyle.”

From swapping high heels for Uggs, buying bread makers to bake that insta-worthy sourdough, to grabbing the latest thigh master to tone that at-home bod, the video takes a light-hearted look at how our needs changed during COVID-19.

The music clip focuses on two flatmates (The Inspired Unemployed) stuck in lockdown in a studio style apartment. Each ‘week’ a new purchase is delivered to their door thanks to the simple shopping experience of Klarna. As time passes, our two stars continue to make use of the items delivered, sometimes in unexpected ways.

The Inspired Unemployed says: 
“This partnership with Klarna was an absolute pleasure to work on and it was truly a team effort to bring the vision to life with incredible creatives like Tuka and Thandi Phoenix, who we learnt a lot from. We are thrilled to see this project come to life after weeks of collaboration and we really hope Australians find it relatable, fun and entertaining and that it also serves as a reminder of the once in a lifetime lockdown experience.” 

Thandi Phoenix says:
“I had a such a good time working on this project for Klarna during lockdown. It was really nice to be able to collaborate with different creatives on this song and being able to make fun of some of the activities we’ve all been doing during isolation.” 

Tuka says:
“This project definitely saved me from the insane level of boredom we all experienced in lockdown. Thanks for getting me on board, Klarna has been a great brand to work with.”

Official Music Video

Embed the YouTube link:    https://youtu.be/GWNX256wchQ 
On set photos: https://www.dropbox.com/sh/rvey8xsk4qk0pas/AAAbNR55i_qAInOAlhWV2Cpra?dl=0 

The Inspired Unemployed: www.instagram.com/theinspiredunemployed/ 
Thandi Phoenix:                   www.instagram.com/thandiphoenix/ 
Tuka:                                      www.instagram.com/willrap4tuka/

About Klarna

We make shopping smoooth. With Klarna consumers can buy now and pay later, so they can get what they love today. Klarna’s offering to consumers and retailers include payments, social shopping, and personal finances. Over 205,000 merchants, including H&M, Adidas, IKEA, Expedia Group, Samsung, ASOS, Peloton, Abercrombie & Fitch, Nike and AliExpress have enabled Klarna’s innovative shopping experience online and in-store. Klarna is the most highly valued fintech in Europe with a valuation of $US5.5bn and one of the largest private fintechs globally. Klarna was founded in 2005, has over 2,700 employees and is active in 17 countries. For more information, visit klarna.com/au

About BRING
BRING are a creative agency born from Universal Music Australia and as such culture runs in their DNA. With their unrivalled access to talent, data, leading live and content production capabilities as well as a creative-driven approach to everything they do, BRING create ideas that make noise.  They have created brand platforms and campaigns including – Adobe, KFC, Nintendo, Oppo, Adidas, Lion, Optus, American Express, KFC and more. www.bring.com.au

Related Links :

https://www.klarna.com/au/

Huawei officially launches Huawei Pay mobile payment in Thailand

BANGKOK, June 26, 2020 — Huawei Mobile Services (HMS) collaborates with UnionPay to launch the Huawei Pay in Thailand. Huawei Pay is a mobile payment tool that provides contactless, cashless payment service for HUAWEI device users. In Thailand, Industrial and Commercial Bank of China (Thai) Public Company Limited is the first bank to support this service.

First introduced to the China market in August 2016, Huawei Pay is a mobile payment service rooted on HUAWEI Wallet, which provides contactless, cashless payment service for HUAWEI device users, as part of the Huawei Mobile Services (HMS).

“We are pleased to extend our partnership with UnionPay and Industrial and Commercial Bank of China to introduce Huawei Pay to the Thailand market. With Huawei Pay, users can turn their devices into an e-wallet to enjoy secure, easy and convenient payment experience,” said the Director of Huawei Asia Pacific Consumer Cloud Service, Shane Shan.

Huawei Pay is one of the key services under the HUAWEI Wallet app that supports the Near Field Communication (NFC) payments in retail stores. Users can enable Huawei Pay by adding their bank cards to HUAWEI Wallet app and transact conveniently by tapping their Huawei devices to the payment terminal.

Huawei Pay is designed with security in mind — it uses PIN or biometric authentication methods such as fingerprint recognition to authenticate customers for retail purchases. The HUAWEI Wallet app comes pre-installed in the newly launched HUAWEI P40 series, while for the existing HUAWEI smartphone models, the app can be downloaded from HUAWEI AppGallery, Huawei’s official app marketplace.

In Thailand, the local merchandises support Huawei Pay including Boots, Emporium, Jaymart, Major Cineplex, Mr. D.I.Y, Sushi Hiro, Swarovski, Tesco Lotus, The Face Shop and more.

About Huawei Mobile Services:

Huawei Mobile Services is part of HUAWEI Consumer Business Group which aims to provide complete mobile experience to HUAWEI device users. Our services include HUAWEI AppGallery, Mobile Cloud, Video, Themes, ScreenMagazine and more. Huawei Mobile Services covers 600 million users in over 170 countries, enabling a smart living for every HUAWEI device users. In the era of fully connected world, we continue to provide better user experience and fulfil our commitment to bring the world closer together.

To learn more about Huawei Mobile Services, please visit our official website: https://consumer.huawei.com/th/mobileservices/

Uploadcare Media Pipeline for Online Business Wins at Nanjing Tech Week Competition


WILMINGTON, Del., June 26, 2020 — Uploadcare became one of the three best cloud solutions at Nanjing Tech Week 2020 Competition. This is one of the biggest tech festival and contest in the world, uniting innovative companies from all countries and industries. The winners can develop business at the Chinese Market.

Uploadcare is a global end-to-end cloud platform designed to help businesses turn visual-first customer experience into revenue. This PaaS is featured with one of the world’s fastest file uploader, an automated storage, an AI-driven image transformations engine, and flexible content delivery solutions. This customer experience suit facilitates the complete media pipeline: from uploading files to delivering them adapted to the end-user context.

On 25th of June, 2020 Uploadcare took second place at Nanjing Tech Week Cloud Competition. In 2019 Uploadcare raised a $1.7 million seed round led by Runa Capital and Vendep Capital, with existing investors Vaizra Capital and LVL1 Group participating, as well.

"The deep understanding of developers, startups, and enterprises needs allows Uploadcare to offer its clients an all-in-one platform for online content optimization, delivering the proven business results," notes Jupe Arala, General Partner at Vendep Capital.

"With differentiated technology and a strong leadership team, we believe that Uploadcare is well-positioned to accelerate its growth and further solidify its leadership in the content delivery market," says Dmitry Chikhachev, General Partner at Runa Capital.

Uploadcare aims to grow together with actively enhancing digital industries, including e-commerce and e-learning. As the number of users increases, the pressure on these online platforms grows. The shortest delay in content delivery may turn into an increased bounce rate and significant revenue losses. So business owners have to successfully manage this traffic tidal wave while keeping customer experience satisfying.

New Uploadcare media pipeline help online platforms ensure fast and reliable digital learning experience while saving up to 92% on traffic and related costs. Modern file upload widget and Image CDN capable of image management and transformation help to easily handle content and automatically adapt it to user devices. On top of that, they can quickly scale their infrastructure according to the traffic load.

Uploadcare cloud platform driven by intelligence and featured with image uploader, CDN and optimizer can reduce the total image size by 80% due to smart image transformations. Such e-commerce CDN management reduced image hosting costs by 86% without any technical complications. Moreover, Uploadcare’s technology and backend support cut the development process by 3 months and made it $200,000 cheaper.

Uploadcare technology reduces not only image sizes, hosting costs, and development time, providing efficient file upload API and CDN image hosting. The company’s world’s fastest image resizing algorithm can save, roughly, 21.1 MWh energy annually, if it will replace every image resizing code on the planet.

"Our platform, featured with the fastest cloud uploader and the best image CDN, helps reduce tech costs and time spent on image optimization and manipulation. But at the end of the day, it helps turn the crisis into development," says Igor Debatur, CEO at Uploadcare.

About Uploadcare

Uploadcare is a global end-to-end cloud platform that covers the complete media pipeline, using one of the world’s fastest File Uploader, an automated Smart and Secure Storage, a supreme AI-driven Image Transformations Engine, Visual Intelligence Algorithms, and unique content delivery solutions.

Founded in 2011, Uploadcare became a technological partner in e-commerce, e-learning, SaaS, and healthcare industries for thousands of clients like Mozilla, L’Oreal, Sundance Institute, Paperless, Totango. In 2019 Uploadcare raised a $1.7 million seed round led by Runa Capital and Vendep Capital, with existing investors Vaizra Capital and LVL1 Group.

Logo – https://techent.tv/wp-content/uploads/2020/06/uploadcare-media-pipeline-for-online-business-wins-at-nanjing-tech-week-competition.jpg

Blue Hat Partners with Leading Chinese Multi-Channel Network to Build Live Streaming E-commerce Initiative

XIAMEN, China, June 25, 2020 — Blue Hat Interactive Entertainment Technology (“Blue Hat” or the “Company”) (NASDAQ: BHAT), a producer, developer and operator of augmented reality (“AR”) interactive entertainment games, toys and educational materials in China, today announced that it has partnered with Xiamen Xing Meng Wei Lai Culture Media Co. LTD (“Xing Meng Wei Lai“) , a leading Chinese multi-channel network (“MCN”) and internet content development agency, to build Direct-to-Consumer (“DTC”) social content marketing channels via short videos and live streaming. Through the partnership, Blue Hat expects to gradually release its product line on various popular short video and live streaming platforms, including Douyin (TikTok).

In recent years, content-driven e-commerce has been surging in China. Taobao Live, Alibaba Group’s dedicated livestreaming channel, thrived in 2019 with livestreaming-led transactions growing over 150% for three consecutive years. Live streaming has become one of the fastest growing forms of e-commerce in China with over 500 million Chinese users. A study by iiMedia Research shows that the market size of Chinese live streaming e-commerce reached RMB 433.8 billion ($61.5 billion) in 2019, and is projected to double to RMB867,6 billion ($123 billion) in 2020. In the past, the majority of toy product sales came from the offline market. The  COVID-19 pandemic has led to an increase in the amount of time parents and children interact at home on a daily basis. Accordingly, Blue Hat has been taking initiatives to shift its marketing focus to produce more social media and live stream content.

Based on Blue Hat’s product line, application scenarios and interactive features, Xing Meng Wei Lai intends to provide services from conception to execution, including customized planning for live streaming events, design and launch of online stores, and additional content-driven e-commerce promotions.

“Establishing a short video live streaming DTC sales model is a milestone for Blue Hat because it not only serves to increase our brand awareness, but also to broaden our market reach,” commented Mr. Xiaodong Chen, Chief Executive Officer of Blue Hat. “We believe that combining the power of short video live streaming with the reach of standard e-commerce platforms will be an important driver of Blue Hat’s online sales looking forward. With our comprehensive online and offline sales network, we believe we are building future revenue growth for our products.”

About Blue Hat

Blue Hat Interactive Entertainment Technology is a producer, developer and operator of AR interactive entertainment games and toys in China, including interactive educational materials, mobile games, and toys with mobile game features. The Company’s interactive entertainment platform creates unique user experiences by connecting physical items to mobile devices, which creates a rich visual and interactive environment for users through the integration of real objects and virtual scenery. Distinguished by its own proprietary technology, Blue Hat aims to create an engaging, interactive and immersive community for its users. For more information, please visit the Company’s investor relations website at http://ir.bluehatgroup.com.

Forward-Looking Statements

This release contains forward-looking statements within the meaning of Section 27A of the Securities Act of 1933, as amended and Section 21E of the Securities Exchange Act of 1934, as amended. All forward-looking statements are inherently uncertain as they are based on current expectations and assumptions concerning future events or future performance of the Company. Readers are cautioned not to place undue reliance on these forward-looking statements, which are only predictions and speak only as of the date hereof. In evaluating such statements, prospective investors should review carefully various risks and uncertainties identified in this release and matters set in the Company’s SEC filings. These risks and uncertainties could cause the Company’s actual results to differ materially from those indicated in the forward-looking statements.

Contacts:

Lexie Zhang
Blue Hat Interactive Entertainment Technology
Phone: +86 (592) 228-0010
Email: ir@bluehatgroup.net

Phil Lisio
The Foote Group
Phone: +86 135-0116-6560
Email: phil@thefootegroup.com

AfterShip Makes Shipping Software Free to Support E-Commerce Shipping Needs

Postmen, AfterShip’s global shipping API, allows companies to streamline and automate their e-commerce shipping process at scale

HONG KONG, June 24, 2020 — AfterShip, the leading shipping and tracking platform for online retailers, today announced the company is making Postmen, its e-commerce shipping API, completely free with no limit on shipping volumes. Postmen is a scalable shipping solution that allows e-commerce companies to automate and optimize their shipping processes with 60 couriers worldwide.

Because of COVID-19, businesses around the world have had to temporarily close their brick and mortar stores, forcing them to rapidly adjust operations. The shift away from in-person retail has led to unprecedented demand for e-commerce shipments, and many companies have needed to scale and adapt to a very different retail environment. AfterShip’s simple Postmen API helps companies of all sizes mitigate this challenge and reduce costs by seamlessly integrating courier selection, cost and delivery time estimates, and the printing of shipping labels into their existing shipping infrastructure at no added cost to the shipper. Since February 2020, AfterShip has seen an 85% increase in shipping volume, instead of the typical decrease in volume that occurs in the months after the holiday retail season.

“Many retailers and fulfillment providers are trying to simultaneously scale their shipping operations and manage costs as a result of safe-distancing requirements and other economic impacts of COVID-19,” said Andrew Chan, co-founder at AfterShip. “A user-friendly, efficient shipping tool is critical for survival both now and as we look ahead to an unpredictable future. Postmen offers an easy, free solution to quickly scale shipping processes to meet the heightened demand for e-commerce.”

With Postmen, shippers — whether they are a small, local retailer or a large fulfillment center — can quickly choose the best shipping and courier options and estimate delivery times and costs for each courier. The API is easy for developers to integrate into a retailer’s shipping operation and integrates with businesses’ existing shipping accounts so they can continue applying discounted rates they’ve negotiated with couriers. With the API, developers can integrate their shipping process with any courier Postmen supports, shortening their usual integration time — which can be months per courier — to two weeks for all couriers supported by Postmen. AfterShip’s integration with USPS provides customers access to a discounted USPS shipping rate, eliminating the need to negotiate with the courier.

Once a business chooses its preferred shipping method, Postmen generates and prints shipping and prepaid return labels in a PDF format. The labels are certified by couriers, and companies can print them in any desired size. Postmen can generate multiple labels using CSV upload to speed up the shipping process.

“Our postal shipping lead time used to be 7-14 days, but COVID-19 caused that lead time to balloon to as much as 60+ days. At the same time, our postal costs rose by almost 100%,” said Steven Suh, the co-founder of Floship, a global order fulfillment solutions provider for e-commerce businesses. “For our business to survive the pandemic, we need to offer express shipping with major carriers, and Postmen allows us to do so. Rather than building our own carrier integrations, we can go through Postmen’s catalog of existing carrier integrations and get express shipping up and running within 2-3 days. Without Postmen, we’d need to hire 3 additional full-time developers to manage and maintain our shipping process. Postmen has been a huge time-saver for us and has helped accelerate offering new and better solutions for our clients.”

AfterShip is committed to helping businesses grow and scale their shipping processes. Postmen is available for free to all interested companies. Learn more about the shipping API here

About AfterShip
AfterShip (aftership.com) is a shipment tracking platform for online retailers, supporting more than 683 couriers worldwide. AfterShip helps over 100,000 retailers improve their post-purchase experience by providing a branded tracking page and sending proactive delivery updates. AfterShip has 2 other products – Postmen (postmen.com) and Returns Center (returnscenter.com). Postmen provides a simple shipping application and API for retailers to ship easily with any couriers worldwide at the lowest shipping rates. AfterShip Returns Center enables retailers to provide a self-service returns experience to their customers. AfterShip partners with major shopping cart solutions, including Shopify, Magento, Squarespace, BigCommerce. AfterShip, headquartered in Hong Kong, has 130 employees globally. AfterShip was the winner of the 2011 Global Startup Battle and 2011 Hong Kong Startup Weekend.

Media Contact
Kate Riley
aftership@inkhouse.com

The China “618” Online Shopping Gala under the Epidemic

BEIJING, June 19, 2020 — In June, under the gloom of the epidemic, how to revive the economies has become the primary task for governments all around the world.

The China "618" Online Shopping Gala under the Epidemic
The China “618” Online Shopping Gala under the Epidemic


As the main force driving the Chinese economy, on Jun. 18th, the China “618” online shopping gala of Chinese e-commerce has attracted much attention from the world. Syntun Data provides you with an exclusive data report of 2020 “618” to help you understand the Chinese e-commerce market better. The report covers more than 2,000 categories that under FMCG and durable consumer goods industries etc.

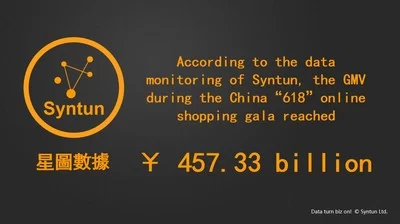
Syntun is a professional provider of big data products, services and solutions in the consumer sector. According to the data monitoring of Syntun, during the 2020 China “618” online shopping gala (from Jun. 1st to Jun. 18th), the GMV of the whole e-commerce network in China reached RMB 457.33 billion, with a year-on-year growth of 43.78 %.

For top e-commerce platform rankings and the most popular category rankings, etc., all data can be viewed here: https://photos.prnasia.com/prnk/20200619/2836061-1?lang=0

CONTACT:

Syntun Marketing Team
Tel: +86-10-5287-4212
Email: info@syntun.com


Related Links :

https://photos.prnasia.com/prnk/20200619/2836061-1

http://www.syntun.com

58.com Inc. to Report First Quarter 2020 Financial Results on June 26, 2020

BEIJING, June 19, 2020 — 58.com Inc. (NYSE: WUBA) (“58.com” or the “Company”), China’s largest online market place for classifieds, today announced that it plans to release its unaudited financial results for the first quarter ended March 31, 2020 before the open of U.S. markets on Friday, June 26, 2020.

About 58.com Inc.

58.com Inc. (NYSE: WUBA) operates China’s largest online market place for classifieds, as measured by monthly unique visitors on both its www.58.com website and mobile applications. The Company’s online marketplace enables local business users and consumer users to connect, share information and conduct business. 58.com’s broad, in-depth and high quality local information, combined with its easy-to-use website and mobile applications, has made it a trusted marketplace for consumers. 58.com’s strong brand recognition, large and growing user base, merchant network and massive database of local information create a powerful network effect. For more information on 58.com, please visit http://www.58.com.    

For more information, please contact:

58.com Inc.
ir@58.com  

Christensen
In China
Mr. Christian Arnell
Phone: +86-10-5900-1548
E-mail: carnell@christensenir.com  

In US
Ms. Linda Bergkamp
Phone: +1-480-614-3004
Email: lbergkamp@ChristensenIR.com

Related Links :

http://www.58.com

LightInTheBox Reports First Quarter 2020 Financial Results

BEIJING, June 19, 2020 — LightInTheBox Holding Co., Ltd. (NYSE: LITB) (“LightInTheBox” or the “Company”), a cross-border e-commerce platform that delivers products directly to consumers around the world, today announced its unaudited financial results for the first quarter ended March 31, 2020.

First Quarter 2020 Highlights

  • Total revenues increased 1.3% year-over-year to $51.5 million.
  • Gross margin expanded further to 46.4% from 40.4% last quarter and 34.8% in the same quarter of 2019.
  • Third consecutive quarter of GAAP profitability despite impact from COVID-19 pandemic with net income of $0.7 million, compared with a net loss of $14.1 million in the same quarter of 2019.
  • Adjusted EBITDA improved significantly, increasing to earnings of $1.4 million, compared with a loss of $7.9 million in the same quarter of 2019.

Mr. Jian He, Chief Executive Officer of LightInTheBox, commented, “We responded quickly and decisively to the outbreak of COVID-19 by implementing a number of strategic initiatives to provide us with the flexibility needed to adapt to a challenging global economic environment. Seasonally, the first quarter is generally the slowest quarter of the year, so the COVID-19 induced economic disruption made the operating environment even more difficult. We took advantage of the temporary slowdown to deepen relationships with high-quality suppliers, optimize our product portfolio and category mix, and improve order fulfillment speed. We also prioritized the health and safety of our employees to ensure business continuity and adequately prepare for the resumption of normal operations while demonstrating our commitment to corporate social responsibility by including free medical face masks in numerous orders shipped to markets that were being impacted heavily by the pandemic. Despite the challenging operational environment, our financial results this quarter are a reflection of our ability to adapt and is highlighted by our third and consecutive quarter of GAAP profitability which I believe demonstrates the long-term growth trajectory we are on. We remain focused on executing our strategy and are very encouraged by our improvements to date. We are already starting to see certain product categories regain strong growth momentum towards the end of the second quarter as global markets begin re-opening and expect that both our operating and financial results will continue to improve going forward.”

First Quarter 2020 Financial Results

Total revenues increased by 1.3% year-over-year to $51.5 million from $50.9 million in the same quarter of 2019. Revenues generated from product sales were $49.9 million, compared with $49.8 million in the same quarter of 2019. Revenues from service and others were $1.6 million, compared with $1.1 million in the same quarter of 2019.

The number of orders for product sales was 1.0 million in the first quarter of 2020, compared with 1.2 million in the same quarter of 2019. The number of customers for product sales was 0.8 million for the first quarter of 2020, compared with 0.6 million in the same quarter of 2019.

Revenues generated from product sales in the apparel category were $13.4 million in the first quarter of 2020, compared with $14.4 million in the same quarter of 2019. As a percentage of product sales, apparel revenues accounted for 26.8% in the first quarter of 2020, compared with 28.9% in the same quarter of 2019. Revenues generated from product sales from other general merchandise were $36.5 million in the first quarter of 2020.

Total cost of revenues was $27.6 million in the first quarter of 2020, compared with $33.2 million in the same quarter of 2019. Cost for product sales was $26.9 million in the first quarter of 2020, compared with $32.8 million in the same quarter of 2019. Cost for service and others was $0.7 million in the first quarter of 2020, compared with $0.4 million in the same quarter of 2019.

Gross profit in the first quarter of 2020 was $23.9 million, compared with $17.7 million in the same quarter of 2019. Gross margin was 46.4% in the first quarter of 2020, compared with 34.8% in the same quarter of 2019. The increase in gross margin was a result of the Company’s continuous efforts to drive revenues from categories with higher margins.

Total operating expenses in the first quarter of 2020 were $27.1 million, compared with $26.5 million in the same quarter of 2019.

  • Fulfillment expenses in the first quarter of 2020 were $5.0 million, compared with $5.2 million in the same quarter of 2019. As a percentage of total revenues, fulfillment expenses were 9.8% in the first quarter of 2020, compared with 10.2% in the same quarter of 2019 and 10.7% in the fourth quarter of 2019.
  • Selling and marketing expenses in the first quarter of 2020 were $14.8 million, compared with $9.3 million in the same quarter of 2019. As a percentage of total revenues, selling and marketing expenses were 28.7% for the first quarter of 2020, compared with 18.3% in the same quarter of 2019 and 23.9% in the fourth quarter of 2019.
  • G&A expenses in the first quarter of 2020 were $7.3 million, compared with $12.0 million in the same quarter of 2019. As a percentage of total revenues, G&A expenses were 14.1% for the first quarter of 2020, compared with 23.6% in the same quarter of 2019 and 11.8% in the fourth quarter of 2019. Included in G&A expenses, R&D expenses in the first quarter of 2020 were $3.5 million, compared with $4.2 million in the same quarter of 2019.

Net income was $0.7 million in the first quarter of 2020, compared with a net loss of $14.1 million in the same quarter of 2019.

Net income per American Depository Share (“ADS”) was $0.01 in the first quarter of 2020, compared with net loss per ADS of $0.21 in the same quarter of 2019. Each ADS represents two ordinary shares. The diluted net income per ADS was $0.01 in the first quarter of 2020, compared with the diluted net loss per ADS of $0.21 in the same quarter of 2019.

In the first quarter of 2020, the Company’s basic weighted average number of ADSs used in computing the net income per ADS was 102,240,901 and the diluted weighted average number of ADSs was 112,122,548.

Adjusted EBITDA, which represents gain  / (loss) from operations before share-based compensation expense, change in fair value of convertible promissory notes, interest income, interest expense, income tax expense and depreciation and amortization expenses, was earnings of $1.4 million in the first quarter of 2020, compared with a loss of  $7.9 million in the same quarter of 2019.

As of March 31, 2020, the Company had cash and cash equivalents and restricted cash of $35.6 million, compared with $40.4 million as of December 31, 2019.

Business Outlook

For the second quarter of 2020, based on current information available to the Company and business seasonality, the Company expects net revenues to be between $105 million and $120 million.

Non-GAAP Financial Measures

To supplement our consolidated financial statements, which are prepared and presented in accordance with U.S. GAAP, we use the following non-GAAP financial measures to help evaluate our operating performance:

“Adjusted EBITDA” represents gain /(loss) from operations before share-based compensation expense, change in fair value of convertible promissory notes, interest income, interest expense, income tax expense and depreciation and amortization expenses. Although other companies may calculate adjusted EBITDA differently or not present it at all, we believe that the adjusted EBITDA helps to identify underlying trends in our operating results, enhancing their understanding of the past performance and future prospects.

Conference Call

The Company will hold a conference call to discuss the results at 7:00 a.m. Eastern Time on June 19, 2020 (7:00 p.m. Beijing Time on the same day).

Preregistration Information

Participants can register for the conference call by navigating to http://apac.directeventreg.com/registration/event/8893322. Once preregistration has been complete, participants will receive dial-in numbers, an event passcode, and a unique registrant ID.

To join the conference, simply dial the number in the calendar invite you receive after preregistering, enter the event passcode followed by your unique registrant ID, and you will be joined to the conference instantly.

A telephone replay will be available two hours after the conclusion of the conference call through June 26, 2020. The dial-in details are:

US/Canada:

+1-855-452-5696

Hong Kong:

800-963-117

International:

+61-2-8199-0299

Passcode:

8893322

Additionally, a live and archived webcast of the conference call will be available on the Company’s Investor Relations website at http://ir.lightinthebox.com.

About LightInTheBox Holding Co., Ltd.

LightInTheBox is a cross-border e-commerce platform that delivers products directly to consumers around the world. The Company offers customers a convenient way to shop for a wide selection of products at attractive prices through its www.lightinthebox.com, www.miniinthebox.com, www.ezbuy.com and other websites and mobile applications, which are available in 23 major languages and cover more than 140 countries.

For more information, please visit www.lightinthebox.com.

Investor Relations Contact

Christensen
Ms. Xiaoyan Su
Tel: +86 (10) 5900 3429
Email:  ir@lightinthebox.com

OR
Christensen
Ms. Linda Bergkamp
Tel: +1-480-614-3004
Email: lbergkamp@ChristensenIR.com

Forward-Looking Statements

This announcement contains forward-looking statements. These statements are made under the “safe harbor” provisions of the U.S. Private Securities Litigation Reform Act of 1995. These forward-looking statements can be identified by terminology such as “will,” “expects,” “anticipates,” “future,” “intends,” “plans,” “believes,” “estimates,” “potential,” “continue,” “ongoing,” “targets” and similar statements. Among other things, statements that are not historical facts, including statements about LightInTheBox’s beliefs and expectations, the business outlook and quotations from management in this announcement, as well as LightInTheBox’s strategic and operational plans, are or contain forward-looking statements.

LightInTheBox may also make written or oral forward-looking statements in its periodic reports to the U.S. Securities and Exchange Commission (the “SEC”), in press releases and other written materials and in oral statements made by its officers, directors or employees to fourth parties. Forward-looking statements involve inherent risks and uncertainties. A number of factors could cause actual results to differ materially from those contained in any forward- looking statement, including but not limited to the following: LightInTheBox’s goals and strategies; LightInTheBox’s future business development, results of operations and financial condition; the expected growth of the global online retail market; LightInTheBox’s ability to attract customers and further enhance customer experience and product offerings; LightInTheBox’s ability to strengthen its supply chain efficiency and optimize its logistics network; LightInTheBox’s expectations regarding demand for and market acceptance of its products; competition; fluctuations in general economic and business conditions and assumptions underlying or related to any of the foregoing. Further information regarding these and other risks is included in LightInTheBox’s filings with the SEC. All information provided in this press release and in the attachments is as of the date of this press release, and LightInTheBox does not undertake any obligation to update any forward-looking statement, except as required under applicable law.

LightInTheBox Holding Co., Ltd.


Unaudited Condensed Consolidated Balance Sheets


(U.S. dollars in thousands, or otherwise noted)


As of December 31,


As of March 31,


2019


2020


ASSETS


Current Assets


Cash and cash equivalents


37,736


33,902


Restricted cash


2,709


1,684


Accounts receivable, net of allowance for doubtful accounts


1,356


1,411


Amounts due from related parties


4,600


2,802


Inventories


7,357


7,316


Prepaid expenses and other current assets


3,619


4,121


Total current assets


57,377


51,236


Property and equipment, net


3,502


3,245


Intangible assets, net


8,516


8,350


Goodwill


27,922


27,465


Operating lease right-of-use assets


12,233


13,504


Long-term rental deposits


778


723


Long-term investments


2,873


6,634


TOTAL ASSETS


113,201


111,157


LIABILITIES AND EQUITY


Current Liabilities


Accounts payable


17,643


11,957


Amounts due to related parties


186


167


Advance from customers


21,731


28,921


Operating lease liabilities


3,470


4,642


Accrued expenses and other current liabilities


28,642


24,273


Total current liabilities


71,672


69,960


Operating lease liabilities


8,801


9,173


Long-term payable


847


726


TOTAL LIABILITIES


81,320


79,859


EQUITY


Ordinary shares


14


17


Additional paid-in capital


262,888


278,804


Forward contracts


15,769


Treasury shares, at cost


(27,512)


(28,268)


Accumulated other comprehensive loss


(1,444)


(2,165)


Accumulated deficit


(217,888)


(217,267)


Non-controlling interests


54


177


TOTAL EQUITY


31,881


31,298


TOTAL LIABILITIES AND EQUITY


113,201


111,157


LightInTheBox Holding Co., Ltd.


Unaudited Condensed Consolidated Statements of Operations


(U.S. dollars in thousands, except per share data, or otherwise noted)


Three-month Period Ended


March 31,


March 31,


2019


2020


Revenues


Product sales


49,789


49,936


Services and others


1,084


1,582


Total revenues


50,873


51,518


Cost of revenues


Product sales


(32,785)


(26,905)


Services and others


(357)


(712)


Total Cost of revenues


(33,142)


(27,617)


Gross profit


17,731


23,901


Operating expenses


Fulfillment


(5,265)


(5,049)


Selling and marketing


(9,269)


(14,780)


General and administrative


(11,984)


(7,268)


Other operating income


13


Total operating expenses


(26,518)


(27,084)


Loss from operations


(8,787)


(3,183)


Interest income


123


47


Interest expense


(20)


(30)


Change in fair value of convertible promissory notes


(5,337)


Other Income,net


3,913


Total other (loss) / income


(5,234)


3,930


(Loss) / Income before income taxes and gain from an equity method investment


(14,021)


747


Income tax expense


(216)


(3)


Gain from an equity method investment


127


Net (loss) / income


(14,110)


744


Less: Net income attributable to non-controlling interests


32


123


Net (loss) /income attributable to LightInTheBox Holding Co., Ltd.


(14,142)


621


Weighted average numbers of shares used in calculating (loss) / income per ordinary share


—Basic


134,458,170


204,481,801


—Diluted


134,458,170


224,245,096


Net (loss) / income per ordinary share


—Basic


(0.11)


0.00


—Diluted


(0.11)


0.00


Net (loss) / income per ADS (2 ordinary shares equal to 1 ADS)


—Basic


(0.21)


0.01


—Diluted


(0.21)


0.01


LightInTheBox Holding Co., Ltd.


Unaudited Reconciliations of GAAP and Non-GAAP Results


(U.S. dollars in thousands, or otherwise noted)


Three-month Period Ended


March 31,


March 31,


2019


2020


Net (loss) / income


(14,110)


744


Less: Interest income


123


47


Interest expense


(20)


(30)


Income tax expense


(216)


(3)


Depreciation and amortization


(628)


(551)


EBITDA


(13,369)


1,281


Less: Share-based compensation


(157)


(149)


Change in fair value of convertible promissory notes


(5,337)


Adjusted EBITDA*


(7,875)


1,430


* Adjusted EBITDA represents gain /(loss) from operations before share-based compensation expense, change in fair value of
convertible promissory notes, interest income, interest expense, income tax expense and depreciation and amortization expenses.

Related Links :

http://ir.lightinthebox.com/