Tag Archives: ECM

ICZOOM Announces Upgrade The Risk Control Of The SAAS System To Improve Service Quality And Security

HONG KONG, March 19, 2024 /PRNewswire/ — ICZOOM Group Inc. (Nasdaq: IZM) (the “Company” or “ICZOOM”), a B2B electronic component products e-commerce platform, announced today that the Company has upgraded the risk control of its SAAS system to enhance its customer service capabilities and improve the quality and security of customer transactions.

ICZOOM’s electronic trading platform has undergone a system upgrade to provide a more secured trading environment for clients on the trading platform by improving the company’s business risk deployment and control nodes. The update includes without limitation enhanced credential analysis on customers, behavior analysis on trading activities and adds-on of a number of risk control nodes. The Company believes that the update could significantly improve the security protection and efficiency of transactions for the customers, therefore advance the operation of the business.

ICZOOM’s CEO, Mr. Lei Xia, commented, “We are striving to help more small and medium-sized microelectronics enterprise customers purchase electronic components more conveniently, reduce procurement costs and improve procurement efficiency as well as enhancing the security protection by upgrading our own platform services. This system upgrade will help us build and consolidate our competitive advantage, and we intend to continue to invest in research and development, strive to improve the quality of our technology and services, and continue to create value for our shareholders.”

About ICZOOM Group Inc.

ICZOOM Group Inc. (Nasdaq: IZM) is primarily engaged in sales of electronic component products to customers in Hong Kong and mainland China through its B2B e-commerce platform. These products are primarily used by China based small and medium-sized enterprises (“SMEs”) in the consumer electronic industry, Internet of Things (“IoT”), automotive electronics and industry control segments. By utilizing latest technologies, the Company’s platform collects, optimizes and presents product offering information from suppliers of all sizes, all transparent and available to its SME customers to compare and select. In addition to the sales of electronic component products, the Company also provides services to customers such as temporary warehousing, logistic and shipping, and customs clearance. For more information, please visit the Company’s website: http://ir.iczoomex.com/index.html.

Forward-Looking Statements

Certain statements in this announcement are forward-looking statements. These forward-looking statements involve known and unknown risks and uncertainties and are based on the Company’s current expectations and projections about future events that the Company believes may affect its financial condition, results of operations, business strategy and financial needs. Investors can identify these forward-looking statements by words or phrases such as “anticipate,” “estimate,” “plan,” “project,” “continuing,” “ongoing,” “expect,” “we believe,” “we intend,” “may,” “should,” “will,” “could” and similar expressions. The Company undertakes no obligation to update or revise publicly any forward-looking statements to reflect subsequent occurring events or circumstances, or changes in its expectations, except as may be required by law. Although the Company believes that the expectations expressed in these forward-looking statements are reasonable, it cannot assure you that such expectations will turn out to be correct, and the Company cautions investors that actual results may differ materially from the anticipated results and encourages investors to review other factors that may affect its future results in the Company’s registration statement and other filings with the U.S. Securities and Exchange Commission.

For more information, please contact:

ICZOOM Group Inc.

Investor Relations Department

Email: investors@iczoom.com

Source: ICZOOM Group Inc.

Locus Robotics Partners With Booktopia To Revolutionise Its Customer Order Fulfilment


Cutting-edge robotic technology will enhance efficiency and fulfilment speed in Booktopia’s new state-of-the-art customer fulfilment centre

WILMINGTON, Mass., March 6, 2024 /PRNewswire/ — Locus Robotics, a global leader in autonomous mobile robots (AMRs) for fulfilment warehouses, has partnered with leading online Australian book retailer, Booktopia, to enhance its customer order fulfilment processes at its new customer fulfilment centre at South Strathfield in Sydney.

The strategic collaboration marks a significant milestone in Australia’s e-commerce landscape, as Booktopia becomes one of the first companies in the country to leverage the power of Locus AMRs to significantly optimise its order fulfilment processes, enabling a reduction in handling time and faster delivery to customers.

Locus Robotics’ cutting-edge AMR technology will propel Booktopia’s fulfilment operations into the future, increasing efficiency, accuracy, and speed within its new distribution centre. The partnership aims to enhance Booktopia’s existing capabilities while meeting the ever-increasing demands of the online retail landscape. Locus Robotics’ adaptable and intelligent robots have begun seamlessly navigating the warehouse floors, working collaboratively with human counterparts to ensure timely and precise order processing.

Rick Faulk, CEO, Locus Robotics, said: “This partnership reflects Booktopia’s innovative forward-looking view of robotics and automation technology. Booktopia is uniquely positioned to optimise its fulfilment processes and seamlessly scale for growth using our powerful AMR solution. We are thrilled to partner with a leader in Australian e-commerce as they push boundaries through fulfilment automation.”

David Nenke, CEO, Booktopia said: “Our partnership with Locus provides the technology that enables us to take a significant step forward with our customer fulfilment operations and support our overarching commitment to delivering a first class experience for customers looking to buy books and gifts. The Locus team shares our dedication to operational excellence through their cutting-edge capabilities and desire to put the customer first. Thanks to technology like this, we have been able to deliver an even better service for our customers including through the busy festive retail period at the end of 2023.”

This collaboration underscores Booktopia’s commitment to investing in state-of-the-art solutions to support its future aspirations across its ANZ operations and cement its role as a leader in Australia’s e-commerce and logistics landscape.

–ENDS–

About Locus Robotics:
Locus Robotics is a global leader in autonomous mobile robots for fulfilment warehouses. The company’s innovative solutions enhance operational efficiency, increase productivity, and streamline order fulfilment processes. By seamlessly integrating advanced robotics with human expertise, Locus Robotics empowers businesses to meet the challenges of modern commerce head-on.

About Booktopia Group Ltd:
Booktopia is a leading Australian online bookstore, listed on the Australian Stock Exchange (ASX:BKG), selling books, ebooks, etexts, games & puzzles, stationery, e-readers, and audiobooks, delivering to every corner of Australia and New Zealand.

Booktopia has access to over 6 million books in its database and thousands of books in stock and ready to ship from its Sydney distribution centre, offering Australian readers a wide variety of international and local publishers. Proudly locally operated, Booktopia is Australia’s local bookstore.

###

For more information or enquiries about Booktopia:

Adam Freedman
Chief Brand and Communications Officer
adamf@booktopia.com.au
0429 493 313

For information or enquiries about Locus Robotics:

Kary Zate
Sr. Director Marketing Communications
kzate@locusrobotics.com
+1-774-249-4477

Pocket PangPang, Korea’s new concept shopping platform, has launched in Thailand

Officially launched a 200 Baht single-price mobile shopping mall service in Thailand

SEOUL, South Korea, Dec. 29, 2023 /PRNewswire/ — Pocket PangPang, Korea’s single-price mobile shopping platform, officially began its service in Thailand in December 2023.


Millions of individuals in Korea currently utilize single-price mobile shopping.

Pocket PangPang is a new kind of mobile shopping mall that took the grand prize in the 2023 Korea Consumer Satisfaction Index Awards among single-price shopping malls in Korea. Thanks to popular demand, Pocket PangPang app has already established itself as a prominent entertainment retail and app tech platform in Korea.

HONEST TRADING (CEO Jeslyn Sooin Kim), a logistics distribution company based in Bangkok, Thailand, and BUDA Co., Ltd., a Korean Pocket PangPang operator, collaborated to launch Pocket PangPang in Thailand.

Pocket PangPang automatically matches a customer with one product from a selection of food, household items, cosmetics, smartphones, and luxury designer goods for a single price of 200 Baht. All items sold at Pocket PangPang have a retail price of 200 Baht or more, and customers can instantly check what they have purchased. This is what sets Pocket PangPang apart from Mystery Box. If the customer does not like or need the matched product, it may be returned in the form of app points, swapped.

Pocket PangPang announced that it would continue to update diverse goods and brand items, as well as host events for Thai users. To celebrate the release in Thailand, Pocket PangPang is presently hosting an event in which all users who sign up for Pocket PangPang will get free points to buy product boxes.

Pocket PangPang is available for download from the Google Play Store and the Apple App Store.

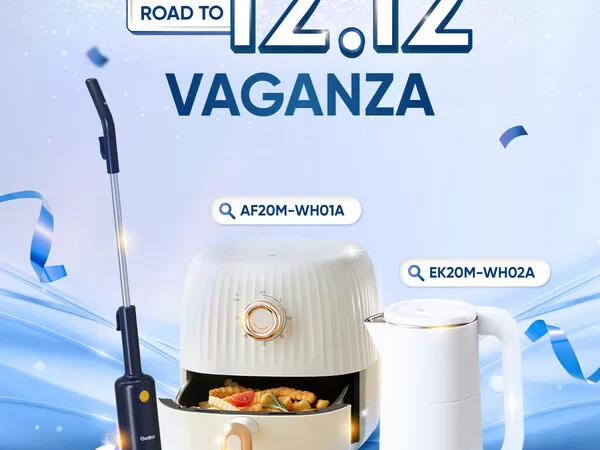
GAABOR LAUNCHES YEAR END SALE 12.12 VAGANZA

JAKARTA, Indonesia, Dec. 10, 2023 /PRNewswire/ — Gaabor, as a leading household appliance brand in Southeast Asia, always wants to provide an interesting experience with each of its quality products. Join and make life easier with more than one million Indonesians.

To complete the range of promotions at this 12.12 shopping party, Gaabor is also providing attractive promotions through superior products such as the Airfryer (AF20M), this Airfryer with a 2 liter capacity provides practicality and ease of cooking without oil, apart from that Gaabor also presents an electric kettle (EK20M-WH02A) able to provide the hot water quickly and save energy, and to complete the cleaning needs in the residence, Gaabor also provides a promo for a vacuum cleaner product (VCW14M-BE01A) to make it easier for customers to clean their favorite room.

This December, in conjunction with the 12.12 campaign, Gaabor is providing discount promos of up to millions of rupiah, additional vouchers and attractive prizes for customers to add to cart only for the period 12 to 15 December 2023.

This is the opportunity can’t be missed to own Gaabor at an affordable price and stunning quality. Get it only on the favorite online platforms.

Enhulk 930 by AiDot Unveils the Ultimate Power in Handheld Leaf Blowers

LOS ANGELES, Nov. 25, 2023 /PRNewswire/ — As the seasons shift and outdoor tasks take precedence, Enhulk by AiDot introduces a game-changing addition to the seasonal toolkit. Meet the Enhulk 930CFM Handheld Leaf Blower, a powerhouse redefining leaf-clearing efficiency.

Enhulk 930 by AiDot Unveils the Ultimate Power in Handheld Leaf Blowers

With an unmatched airflow rate of 930CFM and a powerful 58V battery, the Enhulk 930 delivers superior cleaning efficiency and durability. Designed for comfort and efficiency, it provides up to 120 minutes of uninterrupted cleaning, making it an ideal solution for yard, patio, and driveway maintenance.

“At Enhulk, power is ingrained in our DNA,” says Luke Lin, Chief Executive Officer at AiDot. “The Enhulk 930 is not just a leaf blower; it represents our commitment to continuously challenging the status quo of OPE (outdoor power equipment) industry by offering our users the most efficient and affordable products for their yard maintenance needs.”

Unmatched Airflow Rate: Setting the Standard

The Enhulk 930 stands out with its unmatched 930CFM airflow rate, which is credited to its aviation-level turbine technology and patented siphon nozzle design. The turbine, featuring advanced aerodynamics and robust materials, generates high-speed airflow, enhancing cleaning efficiency and durability. The patented siphon nozzle’s innovative design optimally guides and directs airflow, contributing to the exceptional performance of the Enhulk 930.

58V Battery Pack: Unleashing Nature’s Might

The Enhulk 930 comes equipped with a formidable 58V battery, boasting an impressive 120-minute runtime in variable speed mode on a single charge. Additionally, the battery belongs to the 58V Max Pro series and is interchangeable with other products within the same series, such as string trimmers, chain saws, and more. This functionality offers users extended operational periods and a seamless transition between tools, eliminating the hassle of dealing with multiple batteries.

EZ HMI™ and Ergonomics: Where Convenience Meets Comfort

Beyond its impressive airflow rate and battery performance, the Enhulk 930 ensures a user-friendly and comfortable experience. Users can easily manage the blower with three buttons for variable speed, turbo mode, and cruise control, while staying informed through the smart LED panel. Additionally, they can revel in the ergonomic design that includes a lightweight body, extended handle, and balanced control, providing the ultimate convenience.

Product Specifications:

  • 930 CFM max air volume and 200 MPH max air speed
  • 58V 5.0AH battery, 120 min runtime
  • Variable Speed & Turbo Mode
  • One-click Cruise Control
  • EZ-HMI LED control panel for mode and status
  • COOLBLAST™ System effectively lowers temperatures by as much as 12℉
  • High-power brushless motor
  • Ergonomic Design
  • Low-Noise Design

“At 930 CFMs, the Enhulk is almost unrealistically strong. Even most backpack leaf blowers don’t get up to this level of air volume, so to see this in a handheld blower is absolutely insane.” said Alex Kronk, editor of The Lawn Review

Price and Availability

In response to hot sales since its launch, Enhulk 930 shows appreciation to supporters with the #BeyondBlowing campaign on Amazon. Originally $299.99, an exclusive offer of $189.99, inclusive of the battery pack and charger, is accessible with the code ‘enhulk9d.’

For those seeking a compact solution for smaller yards, the Enhulk 730 proves to be an ideal choice, being 17% lighter than Enhulk 930. This model is conveniently available on both the AiDot website and Amazon, priced at $169.99, inclusive of the battery pack and charger.

About Enhulk:

Enhulk, a brand of AiDot, is a leading innovator in outdoor power tools, offering homeowners the most powerful heavy-duty tools, including a leaf blower, string trimmer, chainsaw, hedge trimmer, lawn mower, and more. Enhulk provides comprehensive solutions that boost productivity, maximize compatibility, and ultimately result in substantial savings.

For more information about Enhulk, please visit: https://enhulktools.com/

PR Contact: talia.qiu@aidot.com

Jowell Global Ltd. Announces First Half 2023 Unaudited Financial Results

— First Half Revenue of $84.4 million, down 15.9% year-over-year —
— First Half GMV of $115.5 million, down 20.6% year-over-year —

SHANGHAI, Nov. 25, 2023 /PRNewswire/ — Jowell Global Ltd. (“Jowell” or the “Company”) (NASDAQ: JWEL), one of the leading cosmetics, health and nutritional supplements, and household products e-commerce platforms in China, today announced its unaudited financial results for the six months ended June 30, 2023.

First Half 2023 Financial and Operational Highlights

  • Total revenues were $84.4 million, a decrease of 15.9% from $100.4 million in the same period of 2022.
  • Net loss was $7.1 million, a decrease of 11.4% compared to a net loss of $8.0 million in the same period of 2022.
  • Total GMV (Gross Merchandise Value) transacted in our online shopping mall was $115.5 million, a decrease of 20.6% from $145.5 million in the same period of 2022.
  • Total VIP members1 as of June 30, 2023 were approximately 2.5 million, an increase of 3.7% compared to approximately 2.4 million as of June 30, 2022.
  • Total LHH stores2 as of June 30, 2023 were 26,528, an increase of 1.2% compared to 26,224 as of June 30, 2022.

Mr. Haiting Li, Chief Executive Officer and Chairman of the Company, commented:

“Although we experienced a challenging first half of 2023, we believe that we continue to be well positioned to weather what has been a challenging and changing consumer demands. Our business operates in four distinct distribution channels that covers the wide range of consumer engagements and we are confident that this diversification will enable us to meet the current consumer needs for household products as well as what we believe will be pent-up consumer demand when a more vibrant economic cycle emerges. We are particularly buoyed by our select partnerships with third-party merchants and our online presence which helped to mitigate what could have been a further decline resulting from the economic consequences of the pandemic.”

“We plan upon enacting a strategic plan across all of our distribution platforms that we believe will have the synergistic effect of boosting revenue for all of our product lines. As an example, in this changing economic environment, our household goods segment showed strong growth and became our biggest product revenue producer and was up 56% for the first six months of the year as compared to the year-ago period. We are intent upon deploying creative and highly engaging promotional and marketing strategies to the products with good value and build confidence of our customers that they can always find what they need on our platform in different economic environments and to sustain their brand loyalty over the long term.” Mr. Li continued.

“We believe that our consumer brands are among the best available and are bullish on the resurgence of consumer retail spending in China. We remain confident about our execution capabilities across all of our platforms as well as our ability to create long-term value for our shareholders.” Mr. Li concluded.

1 “Total VIP members refers to the total number of members registered on Jowell’s platform as of June 30, 2023.

2 LHH stores: the brand name of “Love Home Store”. Authorized retailers may operate as independent stores or store-in-shop (an integrated store), selling products they purchased through Jowell’s online platform LHH Mall under their retailer accounts which provides them with major discounts.

First Half 2023 Financial Results

Total Revenues

Total revenues for the first half 2023 were $84.4 million, representing a decrease of 15.9% from $100.4 million in the same period of 2022, primarily due to a decrease in the weighted average unit price of our products sold and a decrease in our sales volume. Our weighted average unit price was $4.95 per unit for the first half of 2023, which represented a decrease of 12.5% as compared to $5.66 per unit for the same period of 2022. Health and nutritional supplements products led the decline in weighted average unit pricing, with a period-over-period decrease of 68.8% due to product mix change. The decrease in the volume of products sold was mainly due to the overall market downturn which resulted in a decline in consumer spending as compared to the same period of 2022. The volume of Health and nutritional supplements declined the most, with a period-over-period decrease of 15.4%.

Our household products revenue for the first half 2023 increased by about $17.4 million or 56.1% as compared to the same period of 2022. The increase in home products revenue was mainly due to the increase in sales of premium brand home appliances and kitchenware products. We have stepped up our promotions on these items during holidays in the first half of 2023 in an attempt to offer more promotional discounts in response to the overall market downturn.

First Half Ended June 30

%

2023

2022

change

Revenues (in thousands, except for percentages)

US$

US$

YoY*

Product sales

  – Cosmetic products

29,495.5

46,135.7

-36.1

%

  – Health and nutritional supplements

6,094.2

23,048.1

-73.6

%

  – Household products

48,473.1

31,053.2

56.1

%

  – Others

343.4

170.0

102.0

%

Total

84,406.2

100,407.0

-15.9

%

*

YOY—year over year

Total cost and operating expenses were $91.0 million in the first half of 2023, a decrease of 16.5% from $108.9 million in the same period of 2022.

  • Costs of revenues were $83.8 million in the first half of 2023, a decrease of 13.2% from $96.5 million in the same period of 2022, which including a decrease of $16.3 million in cosmetic products and $16.1 million in health and nutritional supplements and partially offset by an increase of $19.7 million in household products. The decrease is attributable to a decrease in the weighted average unit cost and a decrease in sales volume of cosmetic products and health and nutritional supplements. The weighted average unit cost of cosmetic products decreased from $4.45 in the first half of 2022 to $2.94 in the first half of 2023, and weighted average unit cost of health and nutritional supplements decreased from $14.05 in the first half of 2022 to $4.42 in the first half of 2023, a decrease of 68.5%, both decreases mainly due to reduced customers discretionary spendings on premium brands and their preference to low cost and low price as well as necessary household products as compared to the same period of 2022. The health and nutritional supplements sales volume declined the most, with a decrease of 15.4%.
     
    Cost of revenues of household products for the first half 2023 increased about 67.0% as compared to the same period of 2022. The increase was primarily due to a 71.0% increase in weighted average unit cost. The increase in weighted average unit costs for our household products is mainly because we offered and sold more higher unit price products in the first half 2023 than the same period of 2022.
     
  • Fulfillment expenses primarily consist of costs related to order fulfillment, including expenses paid for order preparing, packaging, outbound freight, and physical storage. Fulfillment expenses were $1.9 million in the first half of 2023, an increase of 10.9% from the $1.8 million in the same period of 2022. Fulfillment expenses as a percentage of total revenues were 2.3% in the first half of 2023, up from 1.7% in the first half of 2022. The increase was mainly due to an increase in warehouse rent by 78.6% or $0.3 million as the Company expanded its temporary storage space for new variety of household products at the beginning of 2023 to meet the demands of our customers.
     
  • Marketing expenses primarily consist of targeted online advertising, and payroll and related expenses for personnel engaged in marketing and selling activities. Marketing expenses were $3.3 million in the first half of 2023, a decrease of 46.7% from the $6.2 million in the same period of 2022. The decrease was primarily due to a decrease in our marketing and promotion activities. Marketing expense as percentage of total revenues was 3.9% in the first half of 2023, down from 6.2% in the same period of 2022.
     
  • General and administrative expenses mainly consist of payroll, depreciation, office supplies and upkeep. General expenses and administration expenses were $2.0 million in the first half of 2023, a decrease of 55.6% from $4.5 million in the same period of 2022. The decrease was primarily due to a $0.9 million decrease in bad debt expense and $1.0 million decreased in share-based compensation of services provided. General and administration expenses as percentage of total revenues was 2.3% in the first half of 2023, down from 4.4% in the same period of 2022.

Operating Loss

Operating loss was $6.6 million, compared with an operating loss of $8.5 million in the same period of 2022, which was mainly due the overall market downturn, which resulted in a decline in consumer spending, as mentioned above.

Net Loss

Net loss was $7.1 million, a decrease of 11.4% compared with net loss of $8.0 million in the same period of 2022, which was mainly due the overall market downturn, which resulted in a decline in consumer spending, as mentioned above.

Loss per Share

The Company computes earnings (loss) per share (“EPS”) in accordance with ASC 260, “Earnings per Share” (“ASC 260”). Each of the Company’s Preferred Share has voting rights equal to two Ordinary Shares of the Company and each Preferred Share is convertible into one Ordinary Share at any time. Except for voting rights and conversion rights, the Ordinary Shares and the Preferred Shares rank pari passu with one another and have the same rights, preferences, privileges and restrictions. For the first half ended June 30, 2023 and 2022, respectively, the Company had no potential ordinary shares outstanding that could potentially dilute EPS in the future.

Cash and Cash Equivalents

For the first half of 2023, the Company reported a net loss of $7.1 million, a negative operating cash flow of $9.9 million and an accumulated deficit of approximately $21.7 million. The Company’s principal sources of liquidity are proceeds from its public offering, a private placement and a registered direct offering. As of June 30, 2023, the Company had cash and restricted cash of approximately $2.0 million, held by the variable interest entity (VIE) Shanghai Juhao Information Technology Co., Ltd. (“Shanghai Juhao”) with banks and financial institutions inside China as the Company conducts its operations primarily through the consolidated VIE in China; the Company’s working capital as of June 30, 2023 was $21.1 million. Due to the uncertainty of the current market environment, management believes it is necessary to enhance the collection of its outstanding accounts receivable and other receivables, and to be cautious in terms of its operational decisions and project selections. As of October 31, 2023, approximately $2.9 million, or 66%, of its accounts receivable balance as of June 30, 2023 were collected, approximately $3.0 million or 100% of its due from affiliate balance as of June 30, 2023 were collected, and approximately $2.1 million or 52% of its advances to supplier balance as of June 30, 2023 were utilized. In addition, the Company’s Form F-3 registration was declared effective on August 31, 2022, and the Company may also seek equity financing from outside investors if necessary.

Based on the latest business plan of the Company, Shanghai Juhao has reduced its promotion efforts and marketing expenditures since the second half of 2022, which reduced the cash used in operating activities. Management believes that the above-mentioned factors, including cash on hand of approximately $2.0 million, will provide sufficient liquidity for the Company to meet its future liquidity and capital requirements for at least the next twelve months.

About Jowell Global Ltd

Jowell Global Ltd. (the “Company”) is one of the leading cosmetics, health and nutritional supplements and household products e-commerce platforms in China. We offer our own brand products to customers and also sell and distribute health and nutritional supplements, cosmetic products and certain household products from other companies on our platform. In addition, we allow third parties to open their own stores on our platform for a service fee based upon sale revenues generated from their online stores and we provide them with our unique and valuable information about market needs, enabling them to better manage their sales effort, as well as an effective platform to promote their brands. The Company also sells its products through authorized retail stores all across China, which operate under the brand names of “Love Home Store” or “LHH Store” and “Best Choice Store”. For more information, please visit http://ir.1juhao.com/.

Exchange Rate

The Company’s financial information is presented in U.S. dollars (“USD”). The functional currency of the Company is the Chinese Yuan, Renminbi (“RMB”), the currency of the PRC. Any transactions which are denominated in currencies other than RMB are translated into RMB at the exchange rate quoted by the People’s Bank of China prevailing at the dates of the transactions, and exchange gains and losses are included in the statements of operations as foreign currency transaction gain or loss. The consolidated financial statements of the Company have been translated into U.S. dollars in accordance with ASC 830, “Foreign Currency Matters”.

This press release contains translations of certain RMB amounts into U.S. dollars (“USD” or “$”) at specified rates solely for the convenience of the reader. The exchange rates in effect as of June 30, 2023 and December 31, 2022 were RMB1 for $0.1378 and $0.1450, respectively. The average exchange rates for the six months ended June 30, 2023 and 2022 were RMB1 for $0.1444 and $0.1543, respectively.

Safe Harbor Statement

This press release contains forward-looking statements. These statements are made under the “safe harbor” provisions of the U.S. Private Securities Litigation Reform Act of 1995. Statements that are not historical facts, including statements about the Company’s beliefs and expectations, are forward-looking statements. Forward-looking statements involve inherent risks and uncertainties, and a number of factors could cause actual results to differ materially from those contained in any forward-looking statement. In some cases, forward-looking statements can be identified by words or phrases such as “may,” “will,” “expect,” “anticipate,” “target,” “aim,” “estimate,” “intend,” “plan,” “believe,” “potential,” “continue,” “is/are likely to” or other similar expressions. The Company may also make written or oral forward-looking statements in its reports filed with, or furnished to, the U.S. Securities and Exchange Commission, in its annual reports to shareholders, in press releases and other written materials and in oral statements made by its officers, directors or employees to third parties. These statements are subject to uncertainties and risks including, but not limited to, the following: the Company’s goals and strategies; the Company’s future business development; financial condition and results of operations; product and service demand and acceptance; reputation and brand; the impact of competition and pricing; changes in technology; government regulations; fluctuations in general economic and business conditions in China and assumptions underlying or related to any of the foregoing and other risks contained in reports filed by the Company with the SEC. For these reasons, among others, investors are cautioned not to place undue reliance upon any forward-looking statements in this press release. Additional factors are discussed in the Company’s filings with the SEC, which are available for review at www.sec.gov. The Company undertakes no obligation to publicly revise these forward-looking statements to reflect events or circumstances that arise after the date hereof.

For investor and media inquiries, please contact:

Jowell Global Ltd.
Ms. Jessie Zhao
Email: IR@1juhao.com 

Jowell Global Ltd.

CONDENSED CONSOLIDATED BALANCE SHEETS

June 30,

December 31,

2023

2022

(Unaudited)

ASSETS

Current Assets:

Cash

$

1,983,830

$

13,718,102

Restricted cash

3,000,000

Accounts receivable, net

4,308,925

6,208,606

Accounts receivable – related parties

31,098

285,530

Advance to suppliers

3,782,626

21,742,495

Advance to suppliers – related parties

172,528

Inventories

17,179,507

13,278,205

Due from affiliate

3,032,141

Prepaid expenses and other current assets

1,854,645

1,668,775

Total current assets

32,345,300

59,901,713

Long-term investment

3,774,477

4,454,993

Property and equipment, net

808,801

1,019,720

Intangible assets, net

718,830

855,112

Right of use lease assets, net

2,601,351

3,389,536

Other non-current asset

874,429

919,720

Deferred tax assets

629,108

661,692

Total Assets

$

41,752,296

$

71,202,486

LIABILITIES AND STOCKHOLDERS’ EQUITY

Current Liabilities:

Short-term loan

$

620,211

$

2,464,375

Accounts payable

5,793,828

6,331,437

Accounts payable – related parties

277,486

1,806,352

Deferred revenue

2,372,970

18,395,244

Deferred revenue – related parties

81,688

74,088

Current portion of operating lease liabilities

1,012,176

1,179,237

Accrued expenses and other liabilities

640,477

1,105,241

Due to related parties

377,856

178,816

Taxes payable

109,817

102,359

Total current liabilities

11,286,509

31,637,149

Non-current portion of operating lease liabilities

1,484,085

2,099,430

Total liabilities

12,770,594

33,736,579

Commitments and contingencies

Equity

Common stock, $0.0016 par value, 450,000,000 shares authorized, 2,135,879 and
   2,132,785 issued and outstanding at June 30, 2023 and December 31, 2022,
   respectively *

3,418

3,413

Preferred stock, $0.0016 par value, 50,000,000 shares authorized, 46,875 issued and
   outstanding at June 30, 2023 and December 31, 2022, respectively *

75

75

Additional paid-in capital

52,687,237

52,557,552

Statutory reserves

394,541

394,541

Accumulated deficit

(21,662,306)

(14,572,425)

Accumulated other comprehensive loss

(2,485,202)

(950,720)

Total Jowell Global Ltd. Stockholders’ Equity

28,937,763

37,432,436

Noncontrolling interest

43,939

33,471

Total Equity

28,981,702

37,465,907

Total Liabilities and Equity

$

41,752,296

$

71,202,486

* On October 25, 2023, the Company consolidated its ordinary shares at the ratio of one-for-sixteen (“Share Consolidation”). Immediately following the Share Consolidation, the Company increased the authorized share capital to $800,000 divided into shares of which (i) 450,000,000 shares are designated as ordinary shares with a nominal or par value of $0.0016 per share, and (ii) 50,000,000 shares are designated as preferred shares with a nominal or par value of $0.0016 per share. All shares and per share data for all the periods presented have been retroactively restated.

Jowell Global Ltd.

CONDENSED CONSOLIDATED STATEMENTS OF OPERATIONS AND COMPREHENSIVE LOSS

(Unaudited)

For the Six Months
Ended June 30,

2023

2022

Net Revenues

$

84,406,244

$

100,407,042

Cost and Operating Expenses:

Cost of revenues

(83,763,353)

(96,499,119)

Fulfillment expenses

(1,942,595)

(1,751,330)

Marketing expenses

(3,306,812)

(6,209,824)

General and administrative expenses

(1,981,967)

(4,463,950)

Total cost and operating expenses

(90,994,727)

(108,924,223)

Loss From Operations

(6,588,483)

(8,517,181)

Other Income (Expenses), net

Interest expense

(39,388)

(60,013)

Investment income (loss)

(483,214)

172,416

Other income (expense), net

(2,118)

58,780

Other Income (expenses), net

(524,720)

171,183

Loss Before Income Taxes

(7,113,203)

(8,345,998)

Provision (Benefit) for Income Taxes

2,761

(311,028)

Net Loss

(7,115,964)

(8,034,970)

Less: net loss attributable to noncontrolling interest

(26,083)

Net Loss Attributable to Ordinary Shareholders of Jowell Global Ltd.

$

(7,089,881)

$

(8,034,970)

Loss Per share – Basic and Diluted

$

(3.33)

$

(4.87)

Weighted Average Shares Outstanding – Basic and diluted*

2,135,574

1,650,279

Net Loss

$

(7,115,964)

$

(8,034,970)

Other Comprehensive Loss, net of tax

Foreign currency translation loss

(1,534,036)

(1,597,147)

Total Comprehensive Loss

(8,650,000)

(9,632,117)

Less: comprehensive income attributable to non-controlling interest

(25,637)

Comprehensive Loss Attributable to Ordinary Shareholders of Jowell Global
Ltd.

$

(8,624,363)

$

(9,632,117)

* On October 25, 2023, the Company consolidated its ordinary shares at the ratio of one-for-sixteen (“Share Consolidation”). Immediately following the Share Consolidation, the Company increased the authorized share capital to $800,000 divided into shares of which (i) 450,000,000 shares are designated as ordinary shares with a nominal or par value of $0.0016 per share, and (ii) 50,000,000 shares are designated as preferred shares with a nominal or par value of $0.0016 per share. All shares and per share data for all the periods presented have been retroactively restated.

Jowell Global Ltd.

CONDENSED CONSOLIDATED STATEMENTS OF CHANGES IN STOCKHOLDERS’ EQUITY

FOR THE SIX MONTHS ENDED JUNE 30, 2023 AND 2022

(Unaudited)

Common Stock*

Preferred Stock*

Additional
Paid-in

Statutory

Retained
Earnings
(Accumulated

Accumulated
Other
Comprehensive

Total Jowell
Global Ltd.
Stockholders’

Noncontrolling

Total 

Shares

Amount

Shares

Amount

Capital

Reserves

deficit)

Income (loss)

Equity

interest

Equity

Balance at
   January 1,
   2022

1,604,873

2,568

46,875

$

75

40,827,231

$

394,541

(3,036,045)

1,495,081

39,683,451

39,683,451

Private
 placements
 issuance

326,875

523

6,275,477

6,276,000

6,276,000

Share-based
 compensation

34,390

55

1,157,925

1,157,980

1,157,980

Net loss for
 the period

(8,034,970)

(8,034,970)

(8,034,970)

Foreign
 currency
 translation
 loss

(1,597,147)

(1,597,147)

(1,597,147)

Balance at
   June 30,
   2022

1,966,138

3,146

46,875

$

75

48,260,633

$

394,541

(11,071,015)

(102,066)

37,485,314

37,485,314

Balance at
   January 1,
   2023

2,132,785

3,413

46,875

$

75

52,557,552

$

394,541

(14,572,425)

(950,720)

37,432,436

33,471

37,465,907

Share-based
 compensation

3,094

5

129,685

129,690

129,690

Capital
 contributed
 by minority
 shareholder

36,105

36,105

Net loss for
 the period

(7,089,881)

(7,089,881)

(26,083)

(7,115,964)

Foreign
 currency
 translation
 loss

(1,534,482)

(1,534,482)

446

(1,534,036)

Balance at
   June 30,
   2023

2,135,879

3,418

46,875

$

75

52,687,237

$

394,541

(21,662,306)

(2,485,202)

28,937,763

43,939

28,981,702

* On October 25, 2023, the Company consolidated its ordinary shares at the ratio of one-for-sixteen (“Share Consolidation”). Immediately following the Share Consolidation, the Company increased the authorized share capital to $800,000 divided into shares of which (i) 450,000,000 shares are designated as ordinary shares with a nominal or par value of $0.0016 per share, and (ii) 50,000,000 shares are designated as preferred shares with a nominal or par value of $0.0016 per share. All shares and per share data for all the periods presented have been retroactively restated.

Jowell Global Ltd.

CONDENSED CONSOLIDATED STATEMENTS OF CASH FLOWS

(Unaudited)

For the Six Months
Ended June 30,

2023

2022

Cash flows from operating activities:

Net loss

$

(7,115,964)

$

(8,034,970)

Adjustments to reconcile net loss to net cash provided by (used in) operating
activities:

Depreciation and amortization

202,822

195,420

Loss (income) from long-term investment

483,214

(172,416)

Credit loss for doubtful accounts

906,484

Amortization of operating lease right-of-use assets

552,702

663,044

Inventory reserve

337,630

Deferred income taxes

(311,028)

Share-based compensation

129,690

1,157,980

Changes in operating assets and liabilities:

Accounts receivables

1,670,275

(442,472)

Accounts receivable – related Parties

251,882

193,809

Inventories

(4,785,784)

(1,731,202)

Advance to suppliers

17,698,012

(1,155,484)

Advance to suppliers – related parties

(180,791)

(10,228,261)

Prepaid expenses and other current assets

(280,888)

36,012

Accounts payables

(236,633)

2,633,562

Accounts payables – related parties

(1,508,872)

(2,186,368)

Deferred revenue

(15,828,565)

2,107,320

Operating lease liabilities

(552,367)

(678,538)

Taxes payable

13,098

330,050

Accrued expenses and other liabilities

(429,988)

192,449

Net cash used in operating activities

(9,918,157)

(16,186,979)

Cash flows from investing activities:

Due from affiliate

(3,177,354)

Purchase of intangible assets

(4,950)

Disposal of equipment

81,469

Purchase of equipment

(12,260)

(686,560)

Net cash used in investing activities

(3,113,095)

(686,560)

Cash flows from financing activities:

Private placements issuance

6,276,000

Proceeds from short-term loans

649,913

Repayment of short-term loans

(2,455,228)

Proceeds from related party loans

205,846

48,372

Net cash provided by (used in) financing activities

(1,599,469)

6,324,372

Effect of exchange rate changes on cash and restricted cash

(103,551)

(405,752)

Net decrease in cash and restricted cash

(14,734,272)

(10,954,919)

Cash and restricted cash, beginning of period

16,718,102

21,249,727

Cash and restricted cash, end of period

$

1,983,830

$

10,294,808

Reconciliation of cash and restricted cash to the consolidated balance sheets

Cash

1,983,830

7,294,808

Restricted cash

3,000,000

Total cash and restricted cash

$

1,983,830

$

10,294,808

Supplemental disclosure information:

Cash paid for income tax

$

2,761

$

Cash paid for interest

$

39,388

$

60,013

Supplemental non-cash activities:

Cash paid in prior year for purchase of intangible assets

$

$

794,010

Right of use assets obtained in exchange for operating lease obligations

$

(98,320)

$

35,341

Source: Jowell Global Ltd.

MINISO Group Announces September Quarter 2023 Unaudited Financial Results

GUANGZHOU, China, Nov. 21, 2023 /PRNewswire/ — MINISO Group Holding Limited (NYSE: MNSO; HKEX: 9896) (“MINISO”, “MINISO Group” or the “Company”), a global value retailer offering a variety of trendy lifestyle products featuring IP design, today announced its unaudited financial results for September quarter 2023.

Financial Highlights for the First Quarter of Fiscal Year 2024 ended September 30, 2023

  • Revenue was RMB3,791.2 million (US$519.6 million), representing an increase of 36.7% year over year and 16.6% quarter over quarter.
  • Gross profit was RMB1,583.7 million (US$217.1 million), representing an increase of 60.2% year over year and 22.2% quarter over quarter.
  • Gross margin was 41.8%, compared to 35.7% in the same period of 2022 and 39.8% in the previous quarter.
  • Operating profit was RMB788.3 million (US$108.0 million), representing an increase of 54.7% year over year and 14.2% quarter over quarter.
  • Profit for the period was RMB618.3 million (US$84.7 million), representing an increase of 53.0% year over year and 13.0% quarter over quarter.
  • Adjusted net profit(1) was RMB642.0 million (US$88.0 million), representing an increase of 53.8% year over year and 12.4% quarter over quarter.
  • Adjusted net margin(1) was 16.9%, compared to 15.1% in the same period of 2022 and 17.6% in the previous quarter.
  • Adjusted EBITDA(1) was RMB1,014.3 million (US$139.0 million), representing an increase of 52.8% year over year and 18.6% quarter over quarter.
  • Adjusted EBITDA margin(1) was 26.8%, compared to 23.9% in the same period of 2022 and 26.3% in the previous quarter.

Operational Highlights for the First Quarter of Fiscal Year 2024 ended September 30, 2023

  • Number of MINISO stores surpassed 6,000 for the first time and reached 6,115 as of September 30, 2023, increasing by 819 stores year over year and 324 stores quarter over quarter, respectively.
  • Number of MINISO stores in China was 3,802 as of September 30, 2023, increasing by 533 stores year over year and 198 stores quarter over quarter, respectively.
  • Number of MINISO stores in overseas markets was 2,313 as of September 30, 2023, increasing by 286 stores year over year and 126 stores quarter over quarter, respectively.
  • Number of TOP TOY stores was 122 as of September 30, 2023, increasing by 13 stores year over year and 4 stores quarter over quarter, respectively.

Note:

(1)     See the sections titled “Non-IFRS Financial Measures” and “Reconciliation of Non-IFRS Financial Measures” in this press release for more information.

The following table provides a breakdown of the number of MINISO and TOP TOY stores as well as their year-over-year and quarter-over-quarter changes as of the relevant dates:

As of

 September 30, 2022

 June 30, 2023

 September 30, 2023

YoY

QoQ

Number of MINISO stores(1)

5,296

5,791

6,115

819

324

China

3,269

3,604

3,802

533

198

—Directly operated stores

19

15

20

1

5

—Third-party stores

3,250

3,589

3,782

532

193

Overseas

2,027

2,187

2,313

286

126

—Directly operated stores

131

176

202

71

26

—Third-party stores

1,896

2,011

2,111

215

100

Number of TOP TOY stores(2)

109

118

122

13

4

—Directly operated stores

8

9

9

1

—Third-party stores

101

109

113

12

4

Notes:

(1) “MINISO stores” refers to the offline stores operated under the “MINISO” brand, including those directly operated by the Company, and those operated by third parties under the MINISO Retail Partner model and the distributor model.

(2) “TOP TOY stores” refers to the offline stores operated under the “TOP TOY” brand, including those directly operated by the Company, and those operated by third parties under the MINISO Retail Partner model.

For more information about MINISO stores, please refer to “Unaudited Additional Information” in this press release.

Mr. Guofu Ye, Founder, Chairman, and Chief Executive Officer of MINISO, commented, “We delivered another strong quarter, demonstrating resilience of our business model and huge potential of our globalization strategy. Core MINISO business including both MINISO offline China and overseas, increased by more than 40% year over year, supported by mid-twenties growth in GMV per MINISO store both in China and overseas. With a more normalized offline travel in this year, we are able to dedicate more resources into our overseas directly operated markets, the revenue of which has increased by more than 80% for two consecutive quarters. In addition, we are encouraged by our developments in our emerging markets such as the North America market, revenue of which increased by nearly 160% in this quarter year over year. Entering Holiday Season, we see this high-growth trend continues in our directly operated markets as we see more value-seeking behavior by overseas consumers and more favorable product mix from us.”

“In many ways, this September quarter was our best quarter so far, with historical highs in revenue, net profit and net store opening. It also marked an important milestone for MINISO as our global store network surpassed 6,000 for the first time. As of September 30, we had opened 477 new MINISO stores in China, accomplishing our full-year plan of 350-450 stores a quarter ahead of schedule. We currently expect to add another 100-200 new stores on a net basis in China in the remaining calendar year of 2023, and we will strive to deliver our target of opening 350 to 450 stores in overseas markets. Going forward, we will continue to focus on our long-term strategic goals of delivering on our globalization strategy, bolstering the strength of our product offerings and continuously optimizing our store network.”

Mr. Eason Zhang, Chief Financial Officer and Vice President of MINISO, commented, “Gross margin for this September quarter reached 41.8%, increasing by more than 6 percentage points from 35.7% in the same quarter last year, setting another historical high, thanks to our solid execution of MINISO’s brand upgrade strategy and more favorable revenue mix, with directly operated market contributed 46% of overseas revenue. In longer term, we are confident to increase gross margin steadily by leveraging our core capabilities in product development, supply chain integration and glocalization.”

“Adjusted net profit increased by 54% year over year to RMB642 million, and adjusted net margin reached 16.9% in this quarter. Excluding foreign exchange impacts, adjusted net margin in this quarter would be 17.1%, compared to 13.2% during the same quarter of 2022, and 15.5% in the previous quarter. Looking forward into the December quarter, we expect our sales to continue to grow strongly on a year-over-year basis, driven by better store-level performance and store network expansion. Meanwhile, our margin profile will continue to optimize on a year-over-year basis.”

Recent Developments

Operational Update

According to the Company’s preliminary estimates, its major operations achieved the following updates:

October 2023: GMV of MINISO’s offline stores in China increased by over 40% year over year, driven primarily by around 11% increase of average GMV per MINISO store. GMV of MINISO’s overseas business increased by around 30% year over year.

Unaudited Financial Results for the First Quarter of Fiscal Year 2024 ended September 30, 2023

Revenue was RMB3,791.2 million (US$519.6 million), representing an increase of 36.7% year over year, primarily driven by a 34.7% year-over-year increase in revenue from China, and a 40.8% year-over-year increase in revenue from overseas markets.

Revenue from China was RMB2,495.8 million (US$342.1 million), 34.7% higher than RMB1,852.3 million in the same period of 2022. The year-over-year increase was primarily driven by (i) an increase of 41.2% in revenue from MINISO’s offline stores in China, which was the result of a 14.0% year-over-year growth in average store count and a 23.8% year-over-year growth in average revenue per MINISO store in China, and (ii) an increase of 46.1% in revenue from TOP TOY, which was the result of a 16.5% year-over-year growth in average store count and a 25.4% year-over-year growth in average revenue per TOP TOY store.

Revenue from overseas markets was RMB1,295.4 million (US$177.5 million), representing an increase of 40.8% year over year. The year-over-year increase was primarily due to a year-over-year increase of 12.5% in average store count and a year-over-year growth of 25.1% in average revenue per MINISO store in overseas markets. Revenue from overseas markets contributed 34.2% of our total revenue in the September quarter of 2023, compared to 33.2% in the same period of 2022 and 34.3% in the previous quarter of 2023.

For more information on the composition and year-over-year change of revenue, please refer to the “Unaudited Additional Information” in this press release.

Cost of sales was RMB2,207.5 million (US$302.6 million), representing an increase of 23.7% year over year.

Gross profit was RMB1,583.7 million (US$217.1 million), representing an increase of 60.2% year over year.

Gross margin was 41.8%, compared to 35.7% in the same period of 2022. The year-over-year increase was primarily attributable to (i) higher gross margin in overseas markets contributed by product optimization and higher revenue contribution from directly operated markets which accounted for 45.7% of revenue from overseas markets, compared to 34.1% in the same period of 2022, (ii) higher gross margin in China contributed by newly launched products in relation to our execution of strategic brand upgrade of MINISO, and the cost-saving measures the Company adopted to reduce the costs of certain products, and (iii) higher gross margin of TOP TOY  due to a shift in product mix towards more profitable products.

Other income was RMB13.4 million (US$1.8 million), compared to RMB6.4 million in the same period of 2022.

Selling and distribution expenses were RMB640.9 million (US$87.8 million), representing an increase of 68.1% year over year. Excluding share-based compensation expenses, selling and distribution expenses were RMB620.8 million (US$85.1 million), representing an increase of 66.6% year over year. The year-over-year increase was mainly attributable to (i) increased personnel-related expenses in relation to the growth of our business, (ii) increased promotion and advertising expenses, mainly in connection with our execution of strategic brand upgrade of MINISO in China, and (iii) increased licensing expenses in relation to our growing IP library and enriched offerings of IP products.

General and administrative expenses were RMB170.6 million (US$23.4 million), representing an increase of 1.7% year over year. Excluding share-based compensation expenses, general and administrative expenses were RMB166.9 million (US$22.9 million), representing an increase of 2.3% year over year. As a percentage of revenue, general and administrative expenses (excluding share-based compensation expenses) for this quarter accounted for 4.4%, decreased from 5.9% in the same period of 2022 thanks to operating leverage.

Other net income was RMB1.0 million (US$0.1 million), compared to RMB64.0 million in the same period of 2022. Other net income mainly consists of investment income from wealth management products, net foreign exchange gain/loss and others. The year-over-year change was mainly attributable to a net foreign exchange loss of RMB7.1 million in this quarter, compared to a net foreign exchange gain of RMB52.3 million in the same period of 2022.

Operating profit was RMB788.3 million (US$108.0 million), representing an increase of 54.7% year over year.

Net finance income was RMB57.9 million (US$7.9 million), representing an increase of 130.9% year over year, mainly due to an increase in interest income of bank deposits.

Profit for the period was RMB618.3 million (US$84.7 million), representing an increase of 53.0% year over year.

Adjusted net profit, which represents profit for the period excluding equity-settled share-based payment expenses, was RMB642.0 million (US$88.0 million), representing an increase of 53.8% year over year.

Adjusted net margin was 16.9%, compared to 15.1% in the same period of 2022.

Adjusted EBITDA was RMB1,014.3 million (US$139.0 million), representing an increase of 52.8% year over year.

Adjusted EBITDA margin was 26.8%, compared to 23.9% in the same period of 2022.

Basic and diluted earnings per ADS were both RMB1.96 (US$0.27) in this quarter, representing an increase of 48.5% year over year from RMB1.32 in the same period of 2022. Each ADS represents four of the Company’s ordinary shares.

Adjusted basic and diluted earnings per ADS were both RMB2.04 (US$0.28) in this quarter, representing an increase of 50.0% year over year from RMB1.36 in the same period of 2022.

Conference Call

The Company’s management will hold an earnings conference call at 4:00 A.M. Eastern Standard Time on Tuesday, November 21, 2023 (5:00 P.M. Beijing Time on the same day) to discuss the financial results. The conference call can be accessed by the following Zoom link or dialing the following numbers:

Access 1

Join Zoom meeting.

Zoom link: https://dooyle.zoom.us/j/83537975392?pwd=EH04HZUn0J49ezZi7m0bymGArajiFZ.1

Meeting Number: 835 3797 5392

Meeting Passcode: 9896

Access 2

Listeners may access the call by dialing the following numbers by using the same meeting number and passcode with access 1.

United States:                          +1 213 338 8477 (or +1 646 518 9805)

Mainland China:                       400 182 3168 (or 400 616 8835)

Hong Kong, China:                  +852 5803 3730 (or +852 5803 3731)

United Kingdom:                      +44 203 481 5237 (or +44 131 460 1196)

France:                                    +33 1 7037 9729 (or +33 1 7037 2246)

Singapore:                               +65 3158 7288 (or +65 3165 1065)

Canada:                                   +1 438 809 7799 (or +1 204 272 7920)

Access 3

Listeners can also access the meeting through the Company’s investor relations website at https://ir.miniso.com/.

The replay will be available approximately two hours after the conclusion of the live event at the Company’s investor relations website at https://ir.miniso.com/.

About MINISO Group

MINISO Group is a global value retailer offering a variety of trendy lifestyle products featuring IP design. The Company serves consumers primarily through its large network of MINISO stores, and promotes a relaxing, treasure-hunting and engaging shopping experience full of delightful surprises that appeals to all demographics. Aesthetically pleasing design, quality and affordability are at the core of every product in MINISO’s wide product portfolio, and the Company continually and frequently rolls out products with these qualities. Since the opening of its first store in China in 2013, the Company has built its flagship brand “MINISO” as a globally recognized retail brand and established a massive store network worldwide. For more information, please visit https://ir.miniso.com/.

Exchange Rate

The U.S. dollar (US$) amounts disclosed in this press release, except for those transaction amounts that were actually settled in U.S. dollars, are presented solely for the convenience of the readers. The conversion of Renminbi (RMB) into US$ in this press release is based on the exchange rate set forth in the H.10 statistical release of the Board of Governors of the Federal Reserve System as of September 29, 2023, which was RMB7.2960 to US$1.0000. The percentages stated in this press release are calculated based on the RMB amounts.

Non-IFRS Financial Measures

In evaluating the business, MINISO considers and uses adjusted net profit, adjusted net margin, adjusted EBITDA, adjusted EBITDA margin, adjusted basic and diluted net earnings per share and adjusted basic and diluted net earnings per ADS as supplemental measures to review and assess its operating performance. The presentation of these non-IFRS financial measures is not intended to be considered in isolation or as a substitute for the financial information prepared and presented in accordance with IFRS. MINISO defines adjusted net profit as profit for the period excluding equity-settled share-based payment expenses. MINISO calculates adjusted net margin by dividing adjusted net profit by revenue for the same period. MINISO defines adjusted EBITDA as adjusted net profit plus depreciation and amortization, finance costs and income tax expense. Adjusted EBITDA margin is computed by dividing adjusted EBITDA by revenue for the period. MINISO computes adjusted basic and diluted net earnings per ADS by dividing adjusted net profit attributable to the equity shareholders of the Company by the number of ADSs represented by the number of ordinary shares used in the basic and diluted earnings per share calculation on an IFRS basis. MINISO computes adjusted basic and diluted net earnings per share in the same way as it calculates adjusted basic and diluted net earnings per ADS, except that it uses the number of ordinary shares used in the basic and diluted earnings per share calculation on an IFRS basis as the denominator instead of the number of ADSs represented by these ordinary shares.

MINISO presents these non-IFRS financial measures because they are used by the management to evaluate its operating performance and formulate business plans. These non-IFRS financial measures enable the management to assess its operating results without considering the impacts of the aforementioned non-cash and other adjustment items that MINISO does not consider to be indicative of its operating performance in the future. Accordingly, MINISO believes that the use of these non-IFRS financial measures provides useful information to investors and others in understanding and evaluating its operating results in the same manner as the management and board of directors.

These non-IFRS financial measures are not defined under IFRS and are not presented in accordance with IFRS. These non-IFRS financial measures have limitations as analytical tools. One of the key limitations of using these non-IFRS financial measures is that they do not reflect all items of income and expense that affect MINISO’s operations. Further, these non-IFRS financial measures may differ from the non-IFRS information used by other companies, including peer companies, and therefore their comparability may be limited.

These non-IFRS financial measures should not be considered in isolation or construed as alternatives to profit, net profit margin, basic and diluted earnings per share and basic and diluted earnings per ADS, as applicable, or any other measures of performance or as indicators of MINISO’s operating performance. Investors are encouraged to review MINISO’s historical non-IFRS financial measures in light of the most directly comparable IFRS measures, as shown below. The non-IFRS financial measures presented here may not be comparable to similarly titled measures presented by other companies. Other companies may calculate similarly titled measures differently, limiting the usefulness of such measures when analyzing MINISO’s data comparatively. MINISO encourages you to review its financial information in its entirety and not rely on a single financial measure.

For more information on the non-IFRS financial measures, please see the table captioned “Reconciliation of Non-IFRS Financial Measures” set forth at the end of this press release.

Safe Harbor Statement

This announcement contains forward-looking statements. These statements are made under the “safe harbor” provisions of the U.S. Private Securities Litigation Reform Act of 1995. These forward-looking statements can be identified by words or phrases such as “may,” “will,” “expect,” “anticipate,” “aim,” “estimate,” “intend,” “plan,” “believe,” “is/are likely to,”, “potential,” “continue” or other similar expressions. Among other things, the quotations from management in this announcement, as well as MINISO’s strategic and operational plans, contain forward-looking statements. MINISO may also make written or oral forward-looking statements in its periodic reports to the U.S. Securities and Exchange Commission (the “SEC“) and The Stock Exchange of Hong Kong Limited (the “HKEX“), in its annual report to shareholders, in press releases and other written materials and in oral statements made by its officers, directors or employees to third parties. Statements that are not historical facts, including statements about MINISO’s beliefs and expectations, are forward-looking statements. Forward-looking statements involve inherent risks and uncertainties. A number of factors could cause actual results to differ materially from those contained in any forward-looking statement, including but not limited to the following: MINISO’s mission, goals and strategies; future business development, financial conditions and results of operations; the expected growth of the retail market and the market of branded variety retail of lifestyle products in China and globally; expectations regarding demand for and market acceptance of MINISO’s products; expectations regarding MINISO’s relationships with consumers, suppliers, MINISO Retail Partners, local distributors, and other business partners; competition in the industry; proposed use of proceeds; and relevant government policies and regulations relating to MINISO’s business and the industry. Further information regarding these and other risks is included in MINISO’s filings with the SEC and the HKEX. All information provided in this press release and in the attachments is as of the date of this press release, and MINISO undertakes no obligation to update any forward-looking statement, except as required under applicable law.

MINISO GROUP HOLDING LIMITED

UNAUDITED CONDENSED CONSOLIDATED STATEMENTS OF FINANCIAL POSITION

(Expressed in thousands)

As at

As at

June 30, 2023

September 30, 2023

(Audited)

(Unaudited)

RMB’000

RMB’000

US$’000

ASSETS

Non-current assets

Property, plant and equipment

534,634

654,331

89,684

Right-of-use assets

2,552,600

2,669,901

365,940

Intangible assets

25,277

21,292

2,918

Goodwill

21,069

21,170

2,902

Deferred tax assets

161,617

151,415

20,753

Other investments

73,870

73,870

10,125

Other receivables

74,641

87,510

11,994

Term deposits

100,000

100,000

13,706

3,543,708

3,779,489

518,022

Current assets

Other investments

205,329

301,361

41,305

Inventories

1,450,519

1,858,935

254,788

Trade and other receivables

1,150,156

1,323,950

181,462

Cash and cash equivalents

6,489,213

6,079,746

833,299

Restricted cash

27,073

34,738

4,761

Term deposits 

581,715

267,927

36,723

9,904,005


9,866,657

1,352,338

Total assets

13,447,713

13,646,146

1,870,360

EQUITY

Share capital

95

95

13

Additional paid-in capital

7,254,871

6,331,304

867,777

Other reserves

1,106,718

1,114,470

152,751

Retained earnings

539,331

1,151,922

157,884

Equity attributable to equity shareholders of the Company

8,901,015

8,597,791

1,178,425

Non-controlling interests

17,253

21,074

2,889

Total equity

8,918,268

8,618,865

1,181,314

LIABILITIES

Non-current liabilities

Contract liabilities

46,754

41,425

5,678

Loans and borrowings

7,215

6,391

876

Lease liabilities

556,801

648,904

88,939

Deferred income

33,080

31,160

4,271

643,850

727,880

99,764

Current liabilities

Loans and borrowings

710

97

Trade and other payables

3,019,302

3,372,587

462,252

Contract liabilities

292,887

278,915

38,228

Lease liabilities

328,933

335,886

46,037

Deferred income

6,778

6,735

923

Current taxation

237,695

304,568

41,745

3,885,595

4,299,401

589,282

Total liabilities

4,529,445

5,027,281

689,046

Total equity and liabilities

13,447,713

13,646,146

1,870,360

MINISO GROUP HOLDING LIMITED

UNAUDITED CONDENSED CONSOLIDATED STATEMENTS OF PROFIT OR LOSS

(Expressed in thousands, except for per share and per ADS data)

Three months ended September 30,

2022

2023

(Unaudited)

(Unaudited)

RMB’000

RMB’000

US$’000

Revenue

2,772,444

3,791,154

519,621

Cost of sales

(1,783,865)

(2,207,456)

(302,557)

Gross profit

988,579

1,583,698

217,064

Other income

6,419

13,437

1,842

Selling and distribution expenses

(381,345)

(640,889)

(87,841)

General and administrative expenses

(167,626)

(170,552)

(23,376)

Other net income

64,035

953

130

(Credit loss)/reversal of credit loss on trade and other receivables

(554)

1,666

228

Operating profit

509,508

788,313

108,047

Finance income

32,255

69,366

9,508

Finance costs

(7,184)

(11,481)

(1,574)

Net finance income 

25,071

57,885

7,934

Profit before taxation

534,579

846,198

115,981

Income tax expense

(130,435)

(227,923)

(31,239)

Profit for the period

404,144

618,275

84,742

Attributable to:

Equity shareholders of the Company

411,634

612,591

83,963

Non-controlling interests

(7,490)

5,684

779

Earnings per share for ordinary shares

-Basic

0.33

0.49

0.07

-Diluted

0.33

0.49

0.07

Earnings per ADS

(Each ADS represents 4 ordinary shares)

-Basic

1.32

1.96

0.27

-Diluted

1.32

1.96

0.27

Three months ended September 30,

2022

2023

(Unaudited)

(Unaudited)

RMB’000

RMB’000

US$’000

Profit for the period

404,144

618,275

84,742

Items that may be reclassified subsequently to profit or loss:

Exchange differences on translation of financial statements of foreign operations

26,476

(17,880)

(2,451)

Other comprehensive income/(loss) for the period

26,476

(17,880)

(2,451)

Total comprehensive income for the period

430,620

600,395

82,291

Attributable to:

Equity shareholders of the Company

432,208

596,574

81,767

Non-controlling interests

(1,588)

3,821

524

MINISO GROUP HOLDING LIMITED

RECONCILIATION OF NON-IFRS FINANCIAL MEASURES

(Expressed in thousands, except for per share and per ADS data)

Three months ended September 30,

2022

2023

(Unaudited)

(Unaudited)

RMB’000

RMB’000

US$’000

Reconciliation of profit for the period to adjusted net profit:

Profit for the period

404,144

618,275

84,742

Add back:

Equity-settled share-based payment expenses

13,227

23,769

3,258

Adjusted net profit

417,371

642,044

88,000

Attributable to:

Equity shareholders of the Company

424,861

636,360

87,221

Non-controlling interests

(7,490)

5,684

779

Adjusted net earnings per share for ordinary shares(1)

-Basic

0.34

0.51

0.07

-Diluted

0.34

0.51

0.07

Adjusted net earnings per ADS

(Each ADS represents 4 ordinary shares)


1.36


2.04


0.28

-Basic

-Diluted

1.36

2.04

0.28

Reconciliation of adjusted net profit for the period to adjusted EBITDA:

Adjusted net profit

417,371

642,044

88,000

Add back:

Depreciation and amortization

108,657

132,868

18,211

Finance costs

7,184

11,481

1,574

Income tax expense

130,435

227,923

31,239

Adjusted EBITDA

663,647

1,014,316

139,024

Adjusted EBITDA margin

23.9 %

26.8 %

26.8 %

Note:

(1) Adjusted basic and diluted net earnings per share are computed by dividing adjusted net profit attributable to the equity shareholders of the Company by the number of ordinary shares used in the basic and diluted earnings per share calculation on an IFRS basis.

MINISO GROUP HOLDING LIMITED

UNAUDITED ADDITIONAL INFORMATION

(Expressed in millions, except for percentages)

Three months ended September 30,

2022

2023

YoY

RMB

RMB

US$

Revenue

Domestic Operations

1,852

2,496

342

35 %

-MINISO Brand

1,700

2,307

316

36 %

-TOP TOY Brand

124

181

25

46 %

-Others

28

8

1

(71) %

International Operations

920

1,295

178

41 %

2,772

3,791

520

37 %

MINISO GROUP HOLDING LIMITED

UNAUDITED ADDITIONAL INFORMATION

As of

September 30,
2022

June 30,
 2023

September 30,
2023

YoY

QoQ

Number of MINISO stores in China

First-tier cities

464

474

499

35

25

Second-tier cities

1,369

1,496

1,554

185

58

Third- or lower-tier cities

1,436

1,634

1,749

313

115

Total

3,269

3,604

3,802

533

198

MINISO GROUP HOLDING LIMITED

UNAUDITED ADDITIONAL INFORMATION

As of

September 30,
 2022

June 30,
 2023

September30, 
2023

YoY

QoQ

Number of MINISO stores in overseas markets

Asian countries excluding China

1,108

1,206

1,264

156

58

Americas

556

615

654

98

39

Europe

169

198

218

49

20

Others

194

168

177

(17)

9

Total

2,027

2,187

2,313

286

126

Score big savings on NOMVDIC projectors this Black Friday


WEST COVINA, Calif., Nov. 11, 2023 /PRNewswire/ — NOMVDIC has launched projectors for different use cases: portable, gaming, home theater. With Black Friday coming up, NOMVDIC is offering all customers the best value for their money during 11/20 to 11/27.

The P2000 UST-RGB 4K UST Triple Laser TV Projector is the latest model with premium features for all home theater seekers. With incomparable 4K resolution, HDR & HLG support, and 100% BT. 2020 color gamut coverage, the P2000 is in the top class for visual performance. The audio performance of the P2000 incorporates dual Harman/Kardon speakers. Dolby Audio and DTS decoding are also supported. The P2000 is discounted for $2,299 (23% off) from 11/20 to 11/27. 

If you’re looking for something more compact, check out the P1000 4K UHD Home Projector. It’s not only good for viewing movies, but also perfect for gamers. The P1000 offers a 4.2 ms low input lag under 1080p, 240hz. Incorporating 4K UHD high resolution and 150″ big screen, the P1000 makes gaming even more exhilarating. The auto keystone and auto focus feature that elevates the experience to a new level. Grab your P1000 this Black Friday (11/20 – 11/27) for just $1,299 (24% off).

The L500 Portable RGB Triple Laser Projector is smaller in size but is just as powerful as the previous models. Powered by the RGB triple laser technology, the L500 boasts a 100% BT. 2020 wide color gamut that offers the most accurate colors human eyes can perceive. First introduced on Kickstarter as a crowdfunding project, the L500 received an all-around success in achieving 640% of the funding goal. The L500 will be on sale for $699, a 30% discount.

R150 Smart Portable LED Projector, the most popular model from NOMVDIC due to its portability, is offered at $209, which is 48% off its regular price. With the size of a water bottle and a built-in battery that lasts up to 4 hrs of play time, the R150 is perfect for social gathering. Another highlight of the R150 is the rotating lens that makes projection at any angle possible.

Another portable model with an additional touch of aesthetics is the X300 Smart Portable Speaker & Projector. With a retro speaker-like appearance, the X300 is a 2-in-1 entertainment on-the-go. Combining a Full HD projector and custom Harman Kardon speakers, the X300 gives you the best of both worlds. Equipped with a built-in battery, the X300 is a great companion for the outdoors. The X300 will be on sale for $399, a massive 50% discount.

NOMVDIC projectors were built to provide entertainment in all moments of life, regardless of time and space. Take this opportunity to enjoy NOMVDIC’s Black Friday deals (11/20 – 11/27) and see how NOMVDIC projectors could change home entertainments for you.

ABOUT NOMVDIC

NOMVDIC is an innovator in the field of home entertainment technology. With a passion for pushing the boundaries of visual and audio experiences, NOMVDIC strives to create groundbreaking products that revolutionize the way we enjoy entertainment. For more information about NOMVDIC and their products, please visit: https://nomvdic.io/

Media Contact:
Ariel Li
+1-(092) 515-8510
ariel.hh.li@nomvdic.io

Monport Laser Announces Second Wave of 2023 Black Friday Events on Laser Engraver

LOS ANGELES, Nov. 10, 2023 /PRNewswire/ — Monport’s Black Friday event has gained a lot of attention, literally millions of page-views have been garnered. Monport, a leading provider of laser engraving machine, is excited to announce the start of its second wave of Black Friday events.

New in this second wave of the Monport Black Friday Event is an irresistible bonus. Customers can take advantage of limited-time offers and discounts of up to 60% on an extensive selection of laser engraving and cutting machines. In addition, subscribe now to Monport’s online shop and receive immediately a $80 gift card. Click here to subscribe and start the Monport journey.

Only 3 Opportunities Remain- Flash Sale For the 55W Desktop CO2 Laser Cutter

The Monport exclusive flash sale for the highly sought-after 55W Desktop CO2 Laser Cutter continues. For a limited time, the first 10 buyers have the incredible opportunity to save a whopping $1000 off the original price. This state-of-the-art laser cutter boasts exceptional precision and versatility, allowing you to bring your creative visions to life with ease.

This compact and high-quality 55W CO2 Laser Cutter machine from Monport offers powerful performance, a safer engraving experience, and the ability to produce perfect works of art. With its high speeds, good resolution, and remarkable cut quality, you can effortlessly work with various materials, including wood, plastic, and glass. The machine features a built-in water chiller system for effective cooling and improved cutting results. With only 3 more opportunities left, customers are urged to act fast and take advantage of this unique discount.

Buy One Get 2 Free Accessories or Gift Card

In recognition of the diverse needs and preferences of its customers, Monport is providing a range of choices to further enhance its engraving journey. With every machine purchase, customers are given the opportunity to select either two optional accessories or a gift card valued at an impressive $150. By offering this enticing bonus, Monport is not only demonstrating its commitment to customer satisfaction but also reflecting its dedication to providing unparalleled value. The complementary accessories, carefully curated to complement the engraving machines, ensure that customers have the necessary tools and enhancements to optimize their engraving experience. Alternatively, the gift card adds a touch of flexibility, enabling customers to explore and select from a wide range of engraving-related items that best suit their unique preferences. This bonus is applicable to all fiber laser engraving machines and CO2 laser engraving machines above 80W.

Save Up To 60% On Monport Laser Engraver

Get ready to save up to a remarkable 60% off the regular prices, making this the perfect time to invest in high-quality engraving equipment.

During this limited-time promotion, customers can enjoy substantial price reductions of up to $2,000 on all Monport laser engraving machines. What’s even better is that upon checking out, customers are eligible for an additional reduction of up to $900. From small-scale hobbyists to professional artists and businesses, there’s a laser engraving machine to suit every need and budget at Monport.

At the checkout stage, customers can take advantage of varying discounts based on their order value. Here’s a breakdown of the savings:

Orders over $100: Save $10
Orders over $200: Save $20
Orders over $400: Save $40
Orders over $600: Save $70
Orders over $800: Save $100
Orders over $2,000: Save $200
Orders over $4,000: Save $400
Orders over $5,000: Save $600
Orders over $7,000: Enjoy an incredible reduction of $900

These discounts present an excellent opportunity for individuals and businesses alike to enhance their engraving capabilities without breaking the bank.

Monport Half-Price Lucky Draw – Try Your Luck and Have Fun

The Monport Lucky Draw is a special event that adds an exciting element of thrill to your Black Friday shopping experience. When you make a purchase on Monport’s website between November 7th and November 30th, you will automatically qualify for the draw. The Monport Lucky Draw will take place during a live broadcast on YouTube, where five lucky winners will be randomly selected. What’s the draw? These fortunate individuals will be eligible to receive an astounding reward where half of the payment amount will be returned to their account!

But that’s not all. In addition, during the live broadcast, 10 other lucky customers will be selected at random to receive consumables as a special gift. This is a fantastic opportunity to receive additional engraving supplies that complement your new engraving machine’s capabilities.

About Monport Laser:

Monport Laser is a renowned provider of laser engraving and cutting machines, offering innovative solutions to businesses and individuals worldwide. With a commitment to excellence, Monport aims to deliver high-quality machines that enable customers to unleash their creativity and achieve outstanding results.

Company: Monport Laser
Contact email: official@monportlaser.com
Pre-sales Phone: (+1)332-251-1208
Monport Laser Website: https://monportlaser.com/
Monport Address: Monport Tech Inc. 300 LENORA ST 878, SEATTLE, WA, 98121-2411, UNITED STATES

ICZOOM Named Outstanding e-Commerce Platform of the Year at Prestigious Global IC & Component Exhibition and Conference, IIC Shenzhen 2023; Company Also Wins Global Electronic Component Distributor Excellence Award


HONG KONG, Nov. 9, 2023 /PRNewswire/ — ICZOOM Group Inc. (Nasdaq: IZM) (the “Company” or “ICZOOM”), a B2B electronic component products e-commerce platform, announced today that the Company was named Outstanding e-Commerce Platform of the Year at the prestigious Global IC & Component Exhibition and Conference, IIC Shenzhen 2023. This marks the seventh consecutive year the Company has been named Outstanding e-Commerce Platform of the Year by the major global IC and component exhibition and conference. Separately, the Company’s subsidiary Hjet Supply Chain won top honors with the important Global Electronic Component Distributor Excellence Award.

ICZOOM’s CEO, Mr. Lei Xia commented, “We are honored to be named Outstanding e-Commerce Platform of the Year and to receive the Global Electronic Component Distributor Excellence Award from the prestigious IIC Shenzhen. This is in recognition of our entire team’s hard work and dedication to providing our customers with increased efficiencies, broader and faster access to the components they need, and pricing transparency. This important industry-wide recognition underscores our leadership and unwavering commitment to further success as we continue to meet the needs of our customers and build value for our shareholders.”

IIC Shenzhen 2023 combines industry exchanges, multi-channel interaction, and resources aggregation, and brings together annual innovative product display, technology exchange, high-end forum, and industry summit. The exhibition sets up high-end exhibition areas such as IC design and application area, distributor area, and semiconductor comprehensive exhibition area, etc., to display IC design, EDA\IP, Internet of Things, AI, automotive electronics, green energy, smart industry, wireless technology, and other major emerging technologies and products. For more information please visit https://iic.eet-china.com/index_en.html.

At this year’s event, experts from upstream and downstream enterprises from across leading semiconductor OEMs, distributors, solution providers, and terminal factories (EMS/OEM/ODM) focused on supply chain security issues, elaborated on innovative thinking and insight into market trends, and deeply interpreted supply chain development trends and opportunities under semiconductor cycle variables.

About ICZOOM Group Inc.

ICZOOM Group Inc. (Nasdaq: IZM) is primarily engaged in sales of electronic component products to customers in Hong Kong and mainland China through its B2B e-commerce platform. These products are primarily used by China based small and medium-sized enterprises (“SMEs”) in the consumer electronic industry, Internet of Things (“IoT”), automotive electronics and industry control segments. By utilizing latest technologies, the Company’s platform collects, optimizes and presents product offering information from suppliers of all sizes, all transparent and available to its SME customers to compare and select. In addition to the sales of electronic component products, the Company also provides services to customers such as temporary warehousing, logistic and shipping, and customs clearance. For more information, please visit the Company’s website: http://ir.iczoomex.com/index.html.

Forward-Looking Statements

Certain statements in this announcement are forward-looking statements. These forward-looking statements involve known and unknown risks and uncertainties and are based on the Company’s current expectations and projections about future events that the Company believes may affect its financial condition, results of operations, business strategy and financial needs. Investors can identify these forward-looking statements by words or phrases such as “anticipate,” “estimate,” “plan,” “project,” “continuing,” “ongoing,” “expect,” “we believe,” “we intend,” “may,” “should,” “will,” “could” and similar expressions. The Company undertakes no obligation to update or revise publicly any forward-looking statements to reflect subsequent occurring events or circumstances, or changes in its expectations, except as may be required by law. Although the Company believes that the expectations expressed in these forward-looking statements are reasonable, it cannot assure you that such expectations will turn out to be correct, and the Company cautions investors that actual results may differ materially from the anticipated results and encourages investors to review other factors that may affect its future results in the Company’s registration statement and other filings with the U.S. Securities and Exchange Commission.