Category Archives: PR Newswire

58.com to Hold Extraordinary General Meeting of Shareholders

BEIJING, Aug. 7, 2020 — 58.com Inc. (NYSE: WUBA) ("58.com" or the "Company"), China’s largest online market place for classifieds, today announced it has called an extraordinary general meeting of shareholders (the "EGM"), to be held on September 7, 2020 at 10:30 a.m. (Beijing time), at Building 105, 10 Jiuxianqiao North Road Jia, Chaoyang District, Beijing, China, to consider and vote on, among other things, the proposal to authorize and approve the previously announced agreement and plan of merger (the "Merger Agreement") , dated June 15, 2020, among the Company, Quantum Bloom Group Ltd, an exempted company with limited liability incorporated under the law of the Cayman Islands ("Parent"), and Quantum Bloom Company Ltd, an exempted company with limited liability incorporated under the law of the Cayman Islands and a wholly-owned subsidiary of Parent ("Merger Sub"), the plan of merger required to be filed with the Registrar of Companies of the Cayman Islands (the "Plan of Merger") and the transactions contemplated thereby, including the Merger (as defined below).

Pursuant to the Merger Agreement and the Plan of Merger, at the effective time of the Merger, Merger Sub will merge with and into the Company and cease to exist, with the Company being the surviving company and becoming a wholly-owned subsidiary of Parent (the "Merger"). If consummated, the Merger would result in the Company becoming a privately held company and its American depositary shares (each representing two Class A ordinary shares, par value US$0.00001 per share) (the "ADSs") would no longer be listed or traded on any stock exchange, including the New York Stock Exchange and the Company’s ADS program would be terminated. In addition, the Company’s ADSs and Class A ordinary shares represented by the ADSs will cease to be registered under Section 12 of the Securities Exchange Act of 1934 following the consummation of the Merger.

The Company’s board of directors (the "Board"), acting upon the unanimous recommendation of a committee of the Board, composed solely of directors who are unaffiliated to the management of the Company, or to any person participating as a buyer or rollover shareholder in the Merger, authorized and approved the execution, delivery and performance of the Merger Agreement, the Plan of Merger and the consummation of the transactions contemplated thereby, including the Merger,  and  recommends that the Company’s shareholders and ADS holders vote FOR, among other things, the proposal to authorize and approve the execution, delivery and performance of the Merger Agreement, the Plan of Merger and the consummation of the transactions contemplated thereby, including the Merger.

Shareholders of record at the close of business in the Cayman Islands on August 14, 2020 will be entitled to attend and vote at the EGM and any adjournment thereof. ADS holders as of the close of business in New York City on August 10, 2020 will be entitled to instruct Citibank, N.A., the ADS depositary, to vote the Class A ordinary shares represented by the ADSs at the EGM.

Additional information regarding the EGM and the Merger Agreement can be found in the transaction statement on Schedule 13E-3 and the definitive proxy statement attached as Exhibit (a)-(1) thereto, as amended, filed with the U.S. Securities and Exchange Commission (the "SEC"), which can be obtained, along with other filings containing information about the Company, the proposed Merger and related matters, without charge, from the SEC’s website www.sec.gov. Requests for additional copies of the definitive proxy statement should be directed to Morrow Sodali, the proxy solicitor, at +1 (800) 662-5200 (U.S. Toll-Free) or +1 (203) 658-9400 (Non-U.S. Direct), or by email at 58@investor.morrowsodali.com.

SHAREHOLDERS AND ADS HOLDERS ARE URGED TO READ CAREFULLY AND IN THEIR ENTIRETY THESE MATERIALS AND OTHER MATERIALS FILED WITH OR FURNISHED TO THE SEC WHEN THEY BECOME AVAILABLE, AS THEY WILL CONTAIN IMPORTANT INFORMATION ABOUT THE COMPANY, THE PROPOSED MERGER AND RELATED MATTERS.

The Company and certain of its directors and executive officers may, under SEC rules, be deemed to be "participants" in the solicitation of proxies from the shareholders with respect to the proposed Merger. Information regarding the persons who may be considered "participants" in the solicitation of proxies is set forth in the Schedule 13E-3 transaction statement relating to the proposed Merger and the definitive proxy statement attached thereto. Further information regarding persons who may be deemed participants, including any direct or indirect interests they may have, is also set forth in the definitive proxy statement.

This announcement is for information purposes only and does not constitute an offer to purchase or the solicitation of an offer to sell any securities or a solicitation of any proxy, vote or approval with respect to the proposed transaction or otherwise, nor shall it be a substitute for any proxy statement or other filings that have been or will be made with the SEC.

About 58.com Inc.

58.com Inc. (NYSE: WUBA) operates China’s largest online market place for classifieds, as measured by monthly unique visitors on both its www.58.com website and mobile applications. The Company’s online marketplace enables local business users and consumer users to connect, share information and conduct business. 58.com’s broad, in-depth and high quality local information, combined with its easy-to-use website and mobile applications, has made it a trusted marketplace for consumers. 58.com’s strong brand recognition, large and growing user base, merchant network and massive database of local information create a powerful network effect. For more information on 58.com, please visit http://www.58.com.

Forward-looking Statements

This press release contains forward-looking statements made under the "safe harbor" provisions of the U.S. Private Securities Litigation Reform Act of 1995. These forward-looking statements can be identified by terminology such as "will," "expects," "anticipates," "future," "intends," "plans," "believes," "estimates," "confident" and similar statements. Any statements that are not historical facts, including statements about 58.com’s beliefs and expectations, are forward-looking statements that involve factors, risks and uncertainties that could cause actual results to differ materially from those in the forward-looking statements. Such factors and risks include, but not limited to the following: uncertainties as to how the Company’s shareholders will vote at the meeting of shareholders; the possibility that competing offers will be made; the possibility that financing may not be available; the possibility that various closing conditions for the transaction may not be satisfied or waived; and other risks and uncertainties discussed in documents filed with the SEC by the Company, as well as the Schedule 13E-3 transaction statement and the proxy statement filed by the Company. Further information regarding these and other risks, uncertainties or factors is included in the Company’s filings with the SEC. All information provided in this press release is current as of the date of the press release, and 58.com does not undertake any obligation to update such information, except as required under applicable law.

For more information, please contact:

58.com Inc.
ir@58.com

Christensen
In China
Mr. Eric Yuan
Phone: +86-10-5900-1548
E-mail:
Eyuan@christensenir.com

In the U.S.
Ms. Linda Bergkamp
Phone: +1-480-614-3004
Email: lbergkamp@ChristensenIR.com

Related Links :

http://www.58.com

AppGallery Continues to Thrive in Thailand’s Market

Thailand’s AppGallery is continuing growing, bringing a greater variety of relevant and quality apps to Thailand users.

In recognition of its committed partners in Thailand, AppGallery has demonstrated the power of regional marketing to six of its most popular apps.

SHENZHEN, China, Aug. 7, 2020 — Providing its customers with the most innovative new apps, Thailand’s AppGallery has continued to grow over the past year. In celebration of this local-market success, seven partners have been selected to experience the value of regional marketing as part of a global campaign. Inspiring developers to realize their app’s business potential with AppGallery, the campaign is taking place across 20 countries, including Thailand.

AppGallery: An App Marketplace that Aggregates Quality Global and Local Applications

One of the top three app marketplaces globally, AppGallery prioritizes the diverse needs of its worldwide audience by providing the best, new apps on both a global and local scale. AppGallery’s 460 million active users across 170 regions demonstrate the platform’s growth, with consumer needs a key focal point.

Huawei looks to local developers, inviting them to list their apps on AppGallery to meet the demand of consumers while supporting the local market. With innovative technology offerings and advanced marketing support, AppGallery offers a competitive route for developers.

Being one of AppGallery’s key markets, Thailand has seen an acceleration of local app onboarding. Thailand’s AppGallery has been able to provide customers with access to some of the most popular local apps and services they need. Specifically, the top three e-commerce platforms including Lazada, Shopee, and AliExpress have arrived on AppGallery. Consumers can also enjoy apps such as LINE, K PLUS, SCB EASY, Trip.com and Agoda, all available on AppGallery.

Assisting Partners to Grow through Regional Promotion

Demonstrating AppGallery’s commitment to growth in the Thailand market, as part of the global scale campaign, six of the country’s most popular apps have been selected for additional regional promotion to further enhance brand influence. 

Encouraging partners to realize their business potential through targeted marketing, the campaign demonstrates the value of AppGallery’s supporting promotion. The seven partners were promoted across television commercials and AppGallery’s regional platforms, featuring specially created video footage and supporting imagery.

AppGallery continues to thrive in Thailand market

As part of the wider campaign, AppGallery partners in Thailand benefited from enhanced brand awareness in the local market, leading to an increase in app downloads and engagement.

Capitalizing on extensive marketing capabilities, the following apps received the additional support as part of the campaign:

  • Lazada continuing to grow in popularity, Lazada offers consumers an effortless shopping experience and claims to be one of the leading apps in ecommerce.
  • Shopee a popular shopping app where consumers can buy and sell, Shopee has millions of customers looking to list products and shop for deals and discounts online.
  • Lords Mobile one of Huawei’s most popular gaming options, Lords Mobile boasts of high scoring reviews due to its original, adventure-driven style.
  • Foodpanda host to some of the most popular restaurants and cafes, this delivery-based app allows its users to conveniently browse and order from local outlets based on location.
  • Dahmakan another food delivery option for consumers, Dahmakan works directly with its local chefs to provide a top selection of popular food options for delivery.
  • Huawei Video an increasingly popular entertainment platform, Huawei Video provides users with access to the latest films, TV shows and series.

Each partner experienced a surge in user downloads, with AppGallery’s regional marketing resources driving this progression.

AppGallery’s Commitment

Through its commitment to Thailand’s market, AppGallery has driven download figures and consumer engagement on local apps. By supporting developers in key market regions, AppGallery can ensure its customers are provided with the best possible app selection. 

AppGallery is dedicated to listening to its customers. Through its ‘Wish List’ service, users can submit the apps they would like to see on AppGallery, receiving a notification once it’s available. Since January 2019, AppGallery has onboarded over 580 apps in response to Wish List.

For more information, visit: https://developer.huawei.com/consumer/en/huaweihealth

For more partnership stories and discussions, visit the HUAWEI Developer Forum: https://forums.developer.huawei.com/forumPortal/en/home?fid=0101246461018590361

Photo – https://photos.prnasia.com/prnh/20200807/2879598-1?lang=0


Related Links :

http://huawei.com

AGM Group Holdings Inc. Signs LOI to Acquire Hong Kong-Based Financial Services Company with Type 1, 2, 4, 5, and 9 Licenses

BEIJING, Aug. 7, 2020 — AGM Group Holdings Inc. ("AGMH" or the "Company") (NASDAQ: AGMH), an application software company providing accounting and ERP software, fintech software, and trading education software and website service, is pleased to announced that through its wholly-owned subsidiary, AGM Technology Limited ("AGM Technology"), the Company has entered into a letter of intent ("LOI") on August 7, 2020, with the shareholders of Safe Gold Financial Holdings Limited ("Safe Gold") to acquire 100 percent equity interest in Safe Gold and its wholly owned subsidiary Safe Gold Securities and Futures Limited ("Safe Gold SF").

Safe Gold is a Hong Kong-based financial services company which, through its wholly-owned subsidiary Safe Gold SF, holds Hong Kong Financial Services Licenses Type 1 (Dealing of Securities), Type 2 (Dealing in Futures Contracts), Type 4 (Advertising on Securities), Type 5 (Advertising on Futures Contracts), and Type 9 (Asset Management). Safe Gold is also a participant and trading right holder of both HKEX and HKFE.

Pursuant to the LOI, the total consideration of the proposed all-cash transaction is set to equal the combined net asset value for Safe Gold and Safe Gold SF as of June 30, 2020, plus a premium of HK$8.5 million, deducting a due from shareholders of HK$14 million, subject to certain adjustments and definitive agreements at the closing. 

About AGM Group Holdings Inc.

Incorporated in April 2015 and headquartered in Beijing, China, AGM Group Holdings Inc. is an application software company, currently conducting three main business: 1) accounting and ERP software, 2) fintech software, and 3) trading education software and website service. For more information, please visit www.agmprime.com.

Forward Looking Statements

This news release contains "forward-looking statements" within the meaning of Section 27A of the Securities Act of 1933, as amended, and Section 21E of the Securities Exchange Act of 1934, as amended, and as defined in the U.S. Private Securities Litigation Reform Act of 1995. These forward-looking statements can be identified by terminology such as "will," "expects," "anticipates," "future," "intends," "plans," "believes," "estimates" and similar statements. All statements other than statements of historical fact in this press release are forward-looking statements and involve certain risks and uncertainties that could cause actual results to differ materially from those in the forward-looking statements. These forward-looking statements are based on management’s current expectations, assumptions, estimates and projections about the Company and the industry in which the Company operates, but involve a number of unknown risks and uncertainties, Further information regarding these and other risks is included in the Company’s filings with the U.S. Securities and Exchange Commission. The Company undertakes no obligation to update forward-looking statements to reflect subsequent occurring events or circumstances, or changes in its expectations, except as may be required by law. Although the Company believes that the expectations expressed in these forward-looking statements are reasonable, it cannot assure you that such expectations will turn out to be correct, and actual results may differ materially from the anticipated results. You are urged to consider these factors carefully in evaluating the forward-looking statements contained herein and are cautioned not to place undue reliance on such forward-looking statements, which are qualified in their entirety by these cautionary statements.

For more information, please contact:

At the Company:
Email: ir@agmprime.com

Investor Relations:
Tony Tian, CFA         
Weitian Group LLC
Email: ttian@weitianco.com
Phone: +1-732-910-9692

Related Links :

http://www.agmprime.com

The Fifth China Shenyang International Robot Conference is Held in Shenyang

SHENYANG, China, Aug. 7, 2020 — To promote the rapid development of Shenyang robot industry, the Fifth China Shenyang International Robot Conference sponsored by Shenyang Municipal People’s Government started on August 3rd. The conference is held by "Commerce Advancement Cloud Platform" of China Commerce Advancement Association and Shenyang Creative Zone online and offline.

The fifth China Shenyang International Robot Conference is held in Shenyang.

The theme of the conference is "smart fusion and creative future", and it consists of opening ceremony, keynote speech, industry project propaganda, online exhibition and so forth.

Toshiba Corporation (China), NACHI-FUJIKOSHI(CHINA)CO., LTD., Hangzhou Unitree, Shenzhen Gaogong Robot Co. Ltd. and other well-known robot enterprises at home and abroad will show cutting-edge technology, innovative pattern, quintessential cases and interpret "ice and fire" (slack and boom season) of China robot industry in 2020.

2020 China Shenyang International Robot Digital Exhibition will be held from August 3rd to August 7th in the corresponding time period of "Commerce Advancement Cloud Platform". 120 robot enterprises will participate in online exhibition, including SIASUN Robot & Automation CO., LTD, Beijing Kangliyoulan Robot, Hangzhou Hazhi Robot, which will show latest achievements and application. Amongst them, Shenyang enterprises account for 53%.

The conference will further innovate exhibition pattern, endeavor to decrease the negative effect of coronavirus upon economic development, combine offline and online pattern, utilize the feature of short period, low cost, unlimited time and space, and friendly sharing, in order to boost the development of Shenyang robot industry and bring about new economic increase constantly. The conference depends on national digital platform to transfer "face to face" interaction to "screen to screen" and "line to line" and become international communication and cooperation platform of Shenyang robot industry.

Image Attachments Links:
Link: http://asianetnews.net/view-attachment?attach-id=368823
Caption: The fifth China Shenyang International Robot Conference is held in Shenyang.

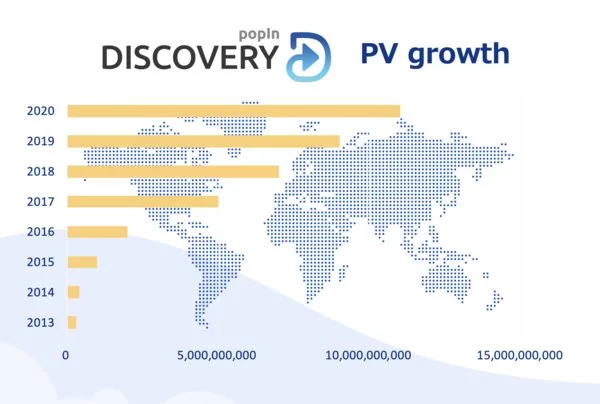
Native Ad Network “popIn Discovery” Exceeds 10 Billion Monthly Page Views

New milestone for Asia’s largest native ad network

BANGKOK, Aug. 7, 2020 — popIn Inc. (Headquarters: Minato-ku, Tokyo; President: Tao Cheng, hereinafter referred to as popIn), which operates the largest native ad networks in Asia called "popIn Discovery" and "popin Discovery Global", has announced that it has reached a new milestone of 10 billion monthly page views in July 2020.

popIn Discovery, which is focused solely on Japan, and popIn Discovery Global, are one-stop native ad platforms that together cover Japan, South Korea, Greater China, Malaysia, Thailand, Singapore and Indonesia. The platforms offers multilingual ad management services and settlement in Japanese Yen. By partnering with local media sources in each area, the popIn Discovery networks enable advertisers to secure high-quality placements and localized ad creatives that match the cultural tastes of different audiences.

popIn
popIn

* popIn Discovery is a native ad network that offers ads in the format of "recommended articles". Because these content-type advertisements closely match the subject matter of an article, they can be used to enhance brand recognition for companies and products.

Features of popIn Discovery Global (https://www.popin.cc/home/global.html)

Asia’s biggest native ad platform
Operational scope: Japan, Korea, Greater China, Malaysia, Thailand, Singapore and Indonesia.

Payments
PopIn accepts payments in Japanese Yen for advertisements in Greater China, South Korea, Malaysia, Thailand, Singapore and Indonesia.

* Advertising costs will be converted based on the current exchange rate.

Support for multilingual account management
Currently, we support Traditional Chinese, Simplified Chinese, Korean, English, Thai and Indonesian.

Analysis index
In order to measure a user’s satisfaction with the content of an article, it is necessary to understand the read status of the article (whether or not it has been read carefully). PopIn’s "READ (*)" algorithm determines whether or not the article content is viewable by a user, and measures the read status based on the elapsed read time and the amount of information in the article. This proprietary method offers a clear estimation of the amount of content that is actually being read as opposed to being skimmed past.

*In August 2015, READ patents were granted in Japan, Korea, and Greater China. Patent number: Patent No. 5797871

Other info

  • PopIn has offices in Japan, Greater China, South Korea, Thailand, Singapore and Indonesia, and can support creative and distribution planning tailored to the entire Asian market.
  • Creative translation is also available as an option.

popIn Corporation Company Profile
Head office location: Roppongi Hills Mori Tower 39th floor, 6-10-1, Roppongi, Minato-ku, Tokyo
President: Tao Cheng   
Established: July 2008
Company URL: https://www.popin.cc/

Main business mission and scope: With the mission of making information more intelligent, we have developed and sold "popIn Discovery", a content discovery platform that supports native advertisements, and the world’s first projector ceiling light "popIn Aladdin", as an IoT business starting in 2017. Currently, we are developing a new AI-powered image recognition service called "popIn Action".

Photo – https://photos.prnasia.com/prnh/20200807/2879554-1?lang=0

Related Links :

HOME

JinkoSolar reshapes PV technology scenarios with its new N-Type Tiger Pro 610W unveiled at SNEC 2020

SHANGRAO, China, Aug. 7, 2020 — JinkoSolar Holding Co., Ltd. ("JinkoSolar" or "Company") (NYSE: JKS) one of the world’s largest and most innovative module manufacturers in the world, today launched its new generation of 610W Tiger Pro High-efficiency monocrystalline TR solar module and its BIPV solutions, Building Integrated Photovoltaics product series, which will be unveiled at SNEC 2020 in Shanghai.

As a PV company that has ranked first in global modules shipments for four consecutive years, JinkoSolar has always been committed to providing global customers with high-efficiency, top quality, and extremely reliable solar modules. The key behind the success of Tiger Pro 610W is the N-Type HOT 2.0 high-efficiency cell technology, independently developed by JinkoSolar. Thanks to the introduction of new technologies, such as HOT tunneling layer passivated contact and advanced metallization, the cell efficiency has reached 24.79%, setting once again a world record for the efficiency of large area N-Type monocrystalline silicon solar cells. At the same time, the use of 78 cell design and of TR technology, which helps reduce significantly the cell gap, as well as lower the electricity cost and improve the system compatibility, represents another milestone for the PV industry in its quest for grid parity.

JinkoSolar’s module series have continuously broken the conversion efficiency record, starting from 2018, JinkoSolar Eagle PERC high-efficiency monocrystalline series, with a power of 390W and a conversion efficiency of 19.8%, followed by the Tiger HOT 1.0 high-efficiency monocrystalline series delivering a power output up to 475W and a conversion efficiency of 20.87%. The newest Tiger Pro HOT2.0, high-efficiency monocrystalline series, with its maximum output of 610W and a conversion efficiency of 22.3%, is setting once again new-standards for the industry and positioning JinkoSolar far ahead from its competitors.

Moreover, thanks to the great improvements made with the smart combination "PV + Architecture", during this edition of SNEC, JinkoSolar also unveiled its first version of colored BIPV module series. With a power output of up to 550W, this product series is available in a variety of colors and levels of translucence, incorporating modern architectural aesthetics for use as a building component.

Dr. Jin Hao, CTO of JinkoSolar, commented: "Reducing costs and increasing efficiency is the goal that the industry has always been striving for. JinkoSolar has always been committed to providing global customers with high-efficiency, top quality, and extremely reliable solar modules. We will increase our investment in R&D to ensure constant innovation in our technology, improve our products performance, and ensure the highest system compatibility. This will allow us to fulfill our commitment to offer the best service to our global customers and to allow the application of our solar modules in a variety of scenarios, further empowering the solar PV industry and achieving grid parity."

About JinkoSolar Holding Co., Ltd.

JinkoSolar (NYSE: JKS) is one of the largest and most innovative solar module manufacturers in the world. JinkoSolar distributes its solar products and sells its solutions and services to a diversified international utility, commercial and residential customer base in China, the United States, Japan, Germany, the United Kingdom, Chile, South Africa, India, Mexico, Brazil, the United Arab Emirates, Italy, Spain, France, Belgium, and other countries and regions. JinkoSolar has built a vertically integrated solar product value chain, with an integrated annual capacity of 17.5 GW for mono wafers, 10.6 GW for solar cells, and 16 GW for solar modules, as of March 31, 2020.

JinkoSolar has over 15,000 employees across its 7 productions facilities globally, 14 overseas subsidiaries in Japan, South Korea, Vietnam, India, Turkey, Germany, Italy, Switzerland, United States, Mexico, Brazil, Chile and Australia, and global sales teams in China, United Kingdom, France, Spain, Bulgaria, Greece, Ukraine, Jordan, Saudi Arabia, Tunisia, Morocco, Kenya, South Africa, Costa Rica, Colombia, Panama, Kazakhstan, Malaysia, Myanmar, Sri Lanka, Thailand, Vietnam, Poland and Argentina.

To find out more, please see: www.jinkosolar.com

Safe Harbor Statement

This press release contains forward-looking statements. These statements constitute "forward-looking" statements within the meaning of Section 27A of the Securities Act of 1933, as amended, and Section 21E of the Securities Exchange Act of 1934, as amended, and as defined in the U.S. Private Securities Litigation Reform Act of 1995. These forward-looking statements can be identified by terminology such as "will," "expects," "anticipates," "future," "intends, "plans," "believes," "estimates" and similar statements. Among other things, the quotations from management in this press release and the Company’s operations and business outlook, contain forward-looking statements. Such statements involve certain risks and uncertainties that could cause actual results to differ materially from those in the forward-looking statements. Further information regarding these and other risks is included in JinkoSolar’s filings with the U.S. Securities and Exchange Commission, including its annual report on Form 20-F. Except as required by law, the Company does not undertake any obligation to update any forward-looking statements, whether as a result of new information, future events or otherwise.

For investor and media inquiries, please contact:

Ms. Ripple Zhang
JinkoSolar Holding Co., Ltd.
Tel: +86 21-5183-3105
Email: pr@jinkosolar.com

Related Links :

http://www.jinkosolar.com

Canadian Solar Reports Second Quarter 2020 Results

GUELPH, ON, Aug. 7, 2020 — Canadian Solar Inc. ("Canadian Solar" or the "Company") (NASDAQ: CSIQ) today announced financial results for the quarter ended June 30, 2020.

Second Quarter 2020 Highlights

  • 31% sequential increase in total module shipments to 2.9 GW, exceeding guidance of 2.5 GW to 2.7 GW.
  • Net revenue of $696 million exceeding guidance of $630 million to $680 million.
  • Gross margin of 21.2% exceeding guidance of 18.5% to 20.5%.
  • 17% reduction in operating expenses compared to the second quarter of 2019.
  • Net income attributable to Canadian Solar of $20.6 million or $0.34 per diluted share.
  • Updated shipment guidance to 11 GW to 12 GW for 2020, and 18 GW to 20 GW for 2021.

Dr. Shawn Qu, Chairman and CEO, commented, "Despite challenging market conditions, second quarter results exceeded expectations both on revenue and profits. Over the past 19 years, we have built a strong foundation and track record based on technology innovation, all-around product execution, robust customer channels and prudent capital deployment. This foundation has helped us to dynamically adjust to changing market environments and consistently deliver a market-leading return on capital and equity.

Last week, we announced the plan to list our Module and System Solutions ("MSS") business on China’s stock market. If successful, it will give us greater access to additional, lower-cost sources of capital and allow us to grow faster at a time when we believe growth in the solar industry and market consolidation are both set to accelerate. We have started the pre-IPO capital raising process to bring in new partners to our MSS business and convert it into a Sino-foreign joint stock company, which is required by Chinese security regulations for listing in China’s stock market. This investment round is expected to be completed by the end of September, and will also allow us to immediately expand our manufacturing capacity using the best available technologies and equipment to support our newly set module shipment plan for 2021.

In addition, we believe the listing will help us unlock value for shareholders by addressing our valuation gap relative to China-listed solar companies. Meanwhile, as a Canadian-based global company, we remain fully committed to our NASDAQ listing and remain focused on expanding our Energy business worldwide by growing our high-quality project pipeline and sales, and increasing our partial ownership of select solar and storage projects."

Yan Zhuang, President and COO, said, "We are benefiting from a demand rebound across most of our markets, with our order backlog for the second half of 2020 and even next year already exceeding our previous expectations. While the current polysilicon supply disruption and shortage presents a near-term challenge, we are positioning ourselves for long-term growth. On the one hand, we will expand capacity and increase the level of vertical integration in our module business, which will allow us to capture more global market share, enhance pricing power, control costs and improve profitability in an industry that is rapidly consolidating. On the other hand, we are building our technological capabilities in the solar PV plus storage space, gearing up for new growth opportunities as adoption of clean solar energy accelerates."

Dr. Huifeng Chang, Senior VP and CFO, added, "As the industry demand and capital market conditions are both improving, we are working to strike a balance between investing for long-term growth and preserving cash. In the near term, uncertainties remain around the impact of the ongoing pandemic, geopolitical and policy risks. In the medium- to longer-term, the plan to list our MSS business in China’s stock market will give us the additional resources to deliver higher future earnings growth and return on capital. We remain disciplined in our capital allocation decisions, as always, and will continue to monitor the market and adjust to changes."

Second Quarter 2020 Results

Total module shipments in the second quarter of 2020 increased to 2,905 MW from 2,214 MW in the first quarter of 2020, and 2,143 MW in the second quarter of 2019. Growth in shipments was driven by moderate market share gains. Of the total, 281 MW was shipped to the Company’s utility-scale solar power projects in the second quarter of 2020.

Net revenue in the second quarter of 2020 was $696 million, compared to $826 million in the first quarter of 2020, and $1,036 million in the second quarter of 2019. Growth in module shipments and EPC service revenues were offset by lower average module selling prices ("ASP") and limited project sales. Project execution and sales schedules have been delayed due to the impact of COVID-19. That said, the Company is making headway and recently announced the financial closing of the 367 MWp Maplewood projects in Texas, for example.

Gross profit in the second quarter of 2020 was $147 million, compared to $223 million in the first quarter of 2020, and $183 million in the second quarter of 2019. Gross margin in the second quarter of 2020 was 21.2%, compared to 27.0% in the first quarter of 2020, and 17.6% in the second quarter of 2019. Gross margin was 18.2% excluding the benefit of a U.S. anti-dumping ("AD") and countervailing duty ("CVD") true-up of $20.4 million. The lower gross margin was anticipated given the significant decline in ASPs, partially offset by lower manufacturing costs.

Income from operations in the second quarter of 2020 was $45 million, compared to $113 million in the first quarter of 2020, and $61 million in the second quarter of 2019. The decline was partially offset by a 17% year-over-year reduction in the Company’s operating expenses to $102 million in the second quarter of 2020.

Non-cash depreciation and amortization charges in the second quarter of 2020 were $48 million, compared to $45 million in the first quarter of 2020, and $40 million in the second quarter of 2019.

Net foreign exchange loss in the second quarter was $4.5 million, compared to a net loss of $1 million in the first quarter of 2020 and a net gain of $4 million in the second quarter of 2019. The higher foreign exchange loss was mainly due to unfavorable moves in the Brazilian Real and the Thai Baht.

Income tax expense in the second quarter of 2020 was $9 million, compared to an income tax benefit of $29 million in the first quarter of 2020 and an income tax expense of $14 million in the second quarter of 2019.

Net income attributable to Canadian Solar in the second quarter of 2020 was $20.6 million, or $0.34 per diluted share, compared to net income of $110.6 million, or $1.84 per diluted share in the first quarter of 2020, and net income of $62.7 million, or $1.04 per diluted share in the second quarter of 2019.

Net cash used in operating activities in the second quarter of 2020 was approximately $114 million, compared to $105 million in the first quarter of 2019.

Module and System Solutions (MSS) Business Segment

Manufacturing Capacity

The table below sets forth the Company’s manufacturing capacity expansion plan until September 30, 2020. The Company is working on its new 2021 capacity expansion plans and will provide an update in the next quarter.

Manufacturing Capacity (MW)

June 30, 2020

Actual

September 30,
2020

Planned

December 31,
2020

Planned

Ingot

1,850

1,920

1,920

Wafer

5,000

5,000

5,500

Cell

9,700

10,050

10,150

Module

13,950

14,010

16,060

The Company’s manufacturing capacity expansion plan is subject to change based on market conditions and the Company’s capital allocation plan.

Operating Results 

The following table presents unaudited select results of operations data of the Company’s MSS business segment for the periods indicated.

MSS Business Segment Financial Results* 

(In Thousands of U.S. Dollars, Except Percentages and Unless Otherwise Stated)

Three Months Ended

Six Months Ended

June 30, 2020

March 31, 2020

June 30, 2019

June 30, 2020

June 30, 2019

Net revenues

706,155

689,799

673,116

1,395,954

1,142,017

Cost of revenues

557,263

540,931

519,376

1,098,194

889,040

Gross profit

148,892

148,868

153,740

297,760

252,977

Operating expenses

85,670

87,370

95,303

173,040

173,799

Income (loss) from operations

63,222

61,498

58,437

124,720

79,178

Gross margin

21.1%

21.6%

22.8%

21.3%

22.2%

Operating margin

9.0%

8.9%

8.7%

8.9%

6.9%

*Includes effects of both sales to third party customers and to the Company’s Energy Business Segment. Please refer to the attached
financial tables for intercompany transaction elimination information. Income from operations reflect management’s allocation and
estimate as some services are shared by the Company’s two business segments.


The table below provides the geographic distribution of the net revenue of the MSS business:

MSS Net Revenues Geographic Distribution* (In Millions of U.S. Dollars, Except Percentages)

Q2 2020

% of Net Revenues

Q1 2020

% of Net Revenues

Q2 2019

% of Net Revenues

Asia

261

39

175

30

236

36

Americas

215

32

252

43

181

27

Europe and others

193

29

161

27

244

37

Total

669

100

588

100

661

100

*Excludes sales from the MSS business to the Energy business.

Canadian Solar shipped 2.9 GW of modules to more than 80 countries in the second quarter of 2020. The top five markets of the MSS business ranked by revenues were the U.S., Japan, China, Spain and Australia.

Multi-crystalline modules accounted for 65% of the Company’s module shipments in the second quarter of 2020, and mono-crystalline modules accounted for 35%. The Company has the flexibility to produce both multi-crystalline and mono-crystalline modules, with the mix decision depending on the relative profitability and levelized cost of electricity ("LCOE") of the alternative products.

Energy Business Segment

Energy Business Strategy

Canadian Solar has one of the world’s largest utility-scale solar project development platforms, with a track record of originating, developing, financing, building and bringing into commercial operation over 5.6 GWp of solar power plants across six continents. As a first mover, the Company has acquired extensive experience and built a leadership position in solar project development, with a current total project backlog and pipeline of 15.1 GWp.

Traditionally, the operating model for the Company’s Energy business has been to sell projects when they reach either their notice to proceed date ("NTP") or commercial operation date ("COD"), depending on the optimal exit point for each project based on its specific risk and return profile. In certain cases, the Company has retained a minority ownership interest in order to capture additional operational value throughout the partial ownership holding period, while accelerating capital turnover into developing new solar projects. An example of this is the Canadian Solar Infrastructure Fund ("CSIF"), a publicly traded investment fund akin to a real estate investment trust, holding operating solar assets in Japan. CSIF has been listed on the Tokyo Stock Exchange since 2017 and remains 15%-owned by the Company. In addition to continuing to grow its project backlog and pipeline, the Company is evaluating ways to replicate its successful Japanese strategy in other markets, focusing on those regions with strong energy demand, attractive power prices and project returns, and stable capital markets. There are two key benefits to this approach:

  • It will permit Canadian Solar to capture higher margins while recycling a large portion of capital. Meanwhile, it will allow the Company to build a base of stable and long-term cash flows from power sales, operations and maintenance ("O&M"), asset management and other services; and create new growth opportunities, including energy storage systems integration and optimization.
  • Over time, the addition of more predictable and stable revenues and cash flows from power sales, O&M, asset management and other services will help smooth typical lumpiness associated with the development and sale of solar power projects.

Management targets are to achieve the following project sales and accumulated project ownership retained in the next 5 years:

Energy Business Targets

2020

2021

2022

2023

2024

Annual Project Sales, GWp

1.1-1.3

1.8-2.3

2.4-2.9

3.2-3.7

3.6-4.1

Cumulative Projects Retained (including inventory to be sold), MWp

~30

~130

~410

~760

~960


Note: There are uncertainties regarding the closing dates of project sales in 2020 due to COVID-19 disruptions. Forecasts for annual project sales
include both projects sold at NTP and COD, which have a significant impact on revenue but more limited impact on profits. Final timing and
recognition of project sales may be impacted by various external factors. These targets are subject to change without notice.

To help finance this business strategy, the Company is evaluating ways to create capital partnerships with investors seeking long-term stable cash flows through investments in clean, profitable and countercyclical solar energy infrastructure investments, via public or private investment vehicles. Given the low interest rate environment, management believes the Company’s solar assets are highly attractive to investors seeking stable yields, which will help build sustainable long-term value for Canadian Solar’s shareholders. The Company will make further progress updates as it executes on this strategy.

Project Backlog and Pipeline

As of June 30, 2020, the Company’s total project backlog and pipeline totaled 15.1 GWp, of which the project backlog totaled 4.2 GWp. The backlog includes projects that have passed their Cliff Risk Date and are expected to be built in the next one to four years. A project’s Cliff Risk Date depends on the country where the project is located and is defined as the date on which the project passes the last of the high-risk development stages. This is usually the receipt of all required environmental and regulatory approvals, interconnection agreements, feed-in tariff ("FIT") arrangements and power purchase agreements ("PPAs"). All projects in the current backlog have secured a PPA or FIT or are reasonably assured of securing one.

The Company’s project pipeline totaled 10.9 GWp as of June 30, 2020. The pipeline includes early- to mid-stage project opportunities currently under development but that are yet to be de-risked.

Project Backlog and Pipeline (as of June 30, 2020)

Region

Backlog

Pipeline

Total

North America

1,544

4,101

5,645

Latin America

1,539

3,657

5,196

Europe, the Middle East and Africa ("EMEA")

383

2,148

2,531

Japan

220

0

220

Asia Pacific excluding Japan

547

927

1,474

China

0

80

80

Total

4,233

10,913

15,146

Note: Backlog represents the gross MWp size of projects, including 63 MWp in Latin America and 124
MWp in EMEA that have already been sold to third parties or are not owned by Canadian Solar.


The Company believes there are significant growth opportunities in the solar plus storage market, given declining battery storage costs, higher capacity needs and accelerating retirements of fossil fuel power plants. The Company further believes it is uniquely positioned to deliver solar plus storage solutions to its customers given its integrated business model as a top-tier module technology manufacturer and global project developer, and is committed to expanding its presence in this space.

The table below sets forth the Company’s storage project backlog and pipeline as of June 30, 2020, which almost doubled compared to the previous quarter.

Backlog

Pipeline

Total

Storage (MWh)

1,201

3,482

4,683

Projects in Construction

In addition to its project backlog and pipeline, the Company has 839 MWp of solar projects in construction.

Projects in Construction (as of June 30, 2020)

Region

MWp

Expected COD

North America

32

2020-21

Latin America

732

2020-21

Japan

70

2020-21

Asia Pacific ex. Japan

5

2020

Total

839

Note: Latin America portfolio includes 508 MWp of projects already
sold at NTP, with milestone revenue recognition over the 2019-2021
period.

The Company has a sizable amount of premium, high FIT projects in Japan. The table below sets forth the expected COD schedule of the Company’s project backlog in development and construction in Japan, as of June 30, 2020:

Expected COD Schedule (MWp) 

2020

2021

2022 and
Thereafter

Total

13

66

211

290

Solar Power Plants in Operation

As of June 30, 2020, the Company’s power plants in operation totaled 956 MWp, with an estimated total resale value of approximately $773 million to Canadian Solar. The estimated resale value is based on selling prices that Canadian Solar is currently negotiating or transaction prices of similar assets in the relevant markets.

North America

Latin America

Japan

Asia Pacific ex. Japan

China

Total

216

100

85

96

459

956

Note: The table represents the gross MWp size of the power plants in operation, including 108 MWp in North
America and 26 MWp in Asia Pacific, excluding Japan, already sold to third parties.

Operating Results

The following table presents unaudited select results of operations data of the Company’s Energy business segment for the periods indicated.

Energy Business Segment Financial Results

(In Thousands of U.S. Dollars, Except Percentages and Unless Otherwise Stated)

Three Months Ended

Six Months Ended

June 30, 2020

March 31, 2020

June 30, 2019

June 30, 2020

June 30, 2019

Net revenues

26,661

238,088

374,938

264,749

406,525

Cost of revenues

15,083

148,339

353,529

163,422

375,703

Gross profit

11,578

89,749

21,409

101,327

30,822

Operating expenses

16,074

22,391

26,597

38,465

48,935

Income (loss) from operations

(4,496)

67,358

(5,188)

62,862

(18,113)

Gross margin

43.4%

37.7%

5.7%

38.3%

7.6%

Operating margin

-16.9%

28.3%

-1.4%

23.7%

-4.5%

Business Outlook

The Company’s business outlook is based on management’s current views and estimates given existing market conditions, order book, production capacity, anticipated timing of project sales, and the global economic environment. This outlook is subject to uncertainty with respect to, among other things, final customer demand, project construction and sale schedules, and the global impact of the ongoing COVID-19 pandemic. Management’s views and estimates are subject to change without notice.

For the third quarter of 2020, the Company expects total module shipments to be in the range of 2.9 GW to 3.1 GW, including approximately 300 MW of module shipments to the Company’s own projects that may not be immediately recognized as revenues. Total revenues are expected to be in the range of $840 million to $890 million, with gross margin expected to be between 14% and 16%.

For the full year of 2020, the Company now expects shipments to be in the range of 11 GW to 12 GW.

Management expects the demand in 2021 to be strong, according to various research reports and Canadian Solar’s own sales feedback. At the same time, industry consolidation is set to accelerate as customer preferences become more sophisticated around quality and service, increasingly choosing top tier solar brands.

As a result, Canadian Solar is positioning itself more assertively for returns-accretive growth. The Company is currently planning for 18 GW to 20 GW of shipments in 2021.

Dr. Shawn Qu, Chairman and CEO, commented, "We are encouraged to see demand rebounding globally, as more companies and consumers worldwide insist on sustainable power sources. For our Energy Business, our pipeline growth and project execution are making progress, although uncertainty remains around the timing and recognition of certain project sales. On the MSS side, we expect near-term margin pressure given cost increases from polysilicon supply shortages; however, given our leadership position in premium markets, we are able to share a portion of the higher costs with customers. Importantly, we expect the impact of the polysilicon supply disruption to lessen over the coming quarters as polysilicon suppliers restore their temporarily shut-down capacities and restart some of the currently idled, higher-cost capacities.

We plan to expand our market share as we increase our low-cost manufacturing capacity of high-quality modules, which will be supported by the pre-IPO round of capital raising for our MSS business. The improved access to capital through the expected China listing will help us to further capitalize on accelerating secular growth in solar demand, and to unlock sustainable value for our shareholders."

Changes to the Board of Directors

Mr. Karl Olsoni was nominated by the Company and approved by shareholders as a new independent director during the 2020 Annual Meeting of Shareholders. He will serve on the Audit and Compensation Committees. Mr. Olsoni has served as a strategic advisor to the Board of Directors since January 2020.

Furthermore, the Board of Directors has accepted the resignation of Mr. Robert K. McDermott, who has played an instrumental role in the Company’s success since his appointment as lead independent director in 2006. "On behalf of our Board of Directors and the Company, I thank Bob for his valuable service and contributions and wish him well in future endeavors," said Dr. Qu.

Recent Developments

On August 4, 2020, Canadian Solar announced that it commenced the construction of a 10 MWp solar power plant in Germany.

On July 27, 2020, Canadian Solar announced that a special committee of independent directors of the Company, with the assistance of outside financial and legal advisors, completed a review of strategic alternatives available to the Company and the board of directors of the Company decided to pursue a listing of the Company’s MSS business on either the Shanghai Stock Exchange’s Science and Technology Innovation Board or the Shenzhen Stock Exchange’s ChiNext Market.

On July 21, 2020, Canadian Solar announced its wholly-owned subsidiary Recurrent Energy closed $282 million of debt financing to construct its Maplewood and Maplewood 2 solar power projects totaling 367 MWp in Texas.

On June 23, 2020, Canadian Solar announced it signed two private power purchase agreements with Braskem S.A. and COPEL Energia for a total of 274 MWp of solar power projects in Brazil.

Conference Call Information

The Company will hold a conference call at 8:00 a.m. U.S. Eastern Daylight Time on August 7, 2020 (8:00 p.m., August 7, 2020 in Hong Kong) to discuss the Company’s second quarter 2020 results and business outlook. The dial-in phone number for the live audio call is 1-866-519-4004 (toll-free from the U.S.), +852-3018-6771 (local dial-in from Hong Kong) or +1 845-675-0437 (from international locations). The passcode for the call is 8068256.  A live webcast of the conference call will also be available on the Investor Relations section of Canadian Solar’s website at www.canadiansolar.com.

A replay of the call will be available two hours after the conclusion of the call until 9:00 a.m. U.S. Eastern Daylight Time on Saturday, August 15, 2020 (9:00 p.m., August 15, 2020 in Hong Kong) and can be accessed by dialing +1-855-452-5696 (toll-free from the U.S.), +852-3051-2780 (local dial-in from Hong Kong) or +1-646-254-3697 (from international locations), with passcode 8068256.  A webcast replay will also be available on the investor relations section of Canadian Solar’s at www.canadiansolar.com.

About Canadian Solar Inc.

Canadian Solar was founded in 2001 in Canada and is one of the world’s largest solar power companies. It is a leading manufacturer of solar photovoltaic modules and provider of solar energy solutions and has a geographically diversified pipeline of utility-scale solar power projects in various stages of development. Over the past 19 years, Canadian Solar has successfully delivered over 46 GW of premium-quality, solar photovoltaic modules to customers in over 150 countries. Canadian Solar is one of the most bankable companies in the solar industry, having been publicly listed on NASDAQ since 2006. For additional information about the Company, follow Canadian Solar on LinkedIn or visit www.canadiansolar.com.

Safe Harbor/Forward-Looking Statements

Certain statements in this press release regarding the Company’s expected future shipment volumes, gross margins are forward-looking statements that involve a number of risks and uncertainties that could cause actual results to differ materially. These statements are made under the "Safe Harbor" provisions of the U.S. Private Securities Litigation Reform Act of 1995. In some cases, you can identify forward-looking statements by such terms as "believes," "expects," "anticipates," "intends," "estimates," the negative of these terms, or other comparable terminology. Factors that could cause actual results to differ include general business and economic conditions and the state of the solar industry; volatility, uncertainty, delays and disruptions related to the COVID-19 pandemic; governmental support for the deployment of solar power; future available supplies of high-purity silicon; demand for end-use products by consumers and inventory levels of such products in the supply chain; changes in demand from significant customers; changes in demand from major markets such as Japan, the U.S., India, China and Brazil; changes in customer order patterns; changes in product mix; capacity utilization; level of competition; pricing pressure and declines in average selling prices; delays in new product introduction; delays in utility-scale project approval process; delays in utility-scale project construction; delays in the completion of project sales; continued success in technological innovations and delivery of products with the features customers demand; shortage in supply of materials or capacity requirements; availability of financing; exchange rate fluctuations; litigation and other risks as described in the Company’s SEC filings, including its annual report on Form 20-F filed on April 28, 2020. Although the Company believes that the expectations reflected in the forward-looking statements are reasonable, it cannot guarantee future results, level of activity, performance, or achievements. Investors should not place undue reliance on these forward-looking statements. All information provided in this press release is as of today’s date, unless otherwise stated, and Canadian Solar undertakes no duty to update such information, except as required under applicable law.

FINANCIAL TABLES FOLLOW


The following tables provide unaudited select financial data for the Company’s Module and System Solutions
("MSS") and Energy businesses:

Select Financial Data – Module and System Solutions, and Energy

Three Months Ended June 30, 2020
(In Thousands of U.S. Dollars, Except Percentages)

MSS

Energy

Elimination

Total

Net revenues 

$706,155

$26,661

($36,970)

$695,846

Cost of revenues

557,263

15,083

(23,712)

548,634

Gross profit

148,892

11,578

(13,258)

147,212

Gross margin

21.1%

43.4%

21.2%

Income (loss) from
  operations

63,222

(4,496)

(13,258)

45,468

Select Financial Data – Module and System Solutions, and
Energy

Six Months Ended June 30, 2020
(In Thousands of U.S. Dollars, Except Percentages)

MSS

Energy

Elimination

Total

Net revenues 

$1,395,954

$264,749

($139,222)

$1,521,481

Cost of revenues

1,098,194

163,422

(110,544)

1,151,072

Gross profit

297,760

101,327

(28,678)

370,409

Gross margin

21.3%

38.3%

24.3%

Income (loss) from
  operations

124,720

62,862

(28,678)

158,904


Select Financial Data – Module and System Solutions, and Energy

Three Months Ended

June 30, 2020 

Six Months Ended

June 30, 2020

(In Thousands of U.S. Dollars)

MSS Revenues:

Solar modules and other solar power
products

$ 613,068

$ 1,158,962

Solar system kits

42,901

72,098

EPC services

3,164

3,922

Others (materials and components)

10,052

21,750

Subtotal

$ 669,185

$ 1,256,732

Energy Revenues:

Solar power projects

$ 2,685

$ 230,439

Electricity

1,882

2,930

O&M services

5,027

10,213

Others (EPC and development services)

17,067

21,167

Subtotal

$ 26,661

$ 264,749

Total net revenues

$ 695,846

$ 1,521,481


Canadian Solar Inc.

Unaudited Condensed Consolidated Statements of Operations

(In Thousands of U.S. Dollars, Except Share and Per Share Data and Unless Otherwise Stated)

Three Months Ended

Six Months Ended

June 30,

March 31,

June 30,

June 30,

June 30,

2020

2020

2019

2020

2019

Net revenues

$ 695,846

$ 825,635

$ 1,036,275

$ 1,521,481

$ 1,520,994

Cost of revenues

548,634

602,438

853,633

1,151,072

1,230,913

Gross profit

147,212

223,197

182,642

370,409

290,081

Operating expenses:

Selling expenses

53,463

52,659

45,361

106,122

83,292

General and administrative
expenses

46,354

52,961

65,735

99,315

117,159

Research and development
expenses

10,924

10,056

12,133

20,980

25,298

Other operating income

(8,997)

(5,915)

(1,329)

(14,912)

(3,015)

Total operating expenses

101,744

109,761

121,900

211,505

222,734

Income from operations

45,468

113,436

60,742

158,904

67,347

Other income (expenses):

Interest expense

(16,960)

(19,013)

(20,654)

(35,973)

(42,352)

Interest income

2,081

2,779

4,452

4,859

6,481

Gain (loss) on change in
fair value of derivatives, net

(2,349)

33,109

(12,489)

30,759

(13,748)

Foreign exchange gain
(loss), net

(2,192)

(34,119)

16,415

(36,311)

3,828

Investment income (loss)

1,525

(14,012)

2,002

(12,487)

2,547

Other expenses, net

(17,895)

(31,256)

(10,274)

(49,153)

(43,244)

Income before income taxes and
equity in earnings of
unconsolidated investees

27,573

82,180

50,468

109,751

24,103

Income tax benefit (expense)

(8,899)

29,051

(13,951)

20,154

(6,423)

Equity in earnings of
unconsolidated investees

1,739

16

23,740

1,755

25,721

Net income

20,413

111,247

60,257

131,660

43,401

Less: Net income (loss)
attributable to non-controlling
interests

(191)

616

(2,425)

425

(2,116)

Net income attributable to
Canadian Solar Inc.

$ 20,604

$ 110,631

$ 62,682

$ 131,235

$ 45,517

Earnings per share – basic

$   0.35

$   1.86

$   1.05

$ 2.20

$   0.77

Shares used in computation – basic

59,371,856

59,376,332

59,547,209

59,539,092

59,389,975

Earnings per share – diluted

$   0.34

$   1.84

$   1.04

$ 2.18

$   0.76

Shares used in computation –
diluted

59,793,196

60,084,298

60,260,410

60,127,369

60,272,536


Canadian Solar Inc.

Unaudited Condensed Consolidated Statement of Comprehensive Income

(In Thousands of U.S. Dollars)

 Three Months Ended

Six Months Ended

June 30,

March 31,

June 30,

June 30,

June 30,

2020

2020

2019

2020

2019

Net Income

20,413

111,247

60,257

131,660

43,401

Other comprehensive income (net
of tax of nil):

Foreign currency translation
adjustment

30,997

(45,971)

(11,170)

(14,974)

4,815

De-recognition of commodity hedge
and interest rate swap

4,439

4,439

Loss on changes in fair value of
derivatives

(104)

(4,011)

(3,310)

(4,115)

(5,680)

Comprehensive income

55,745

61,265

45,777

117,010

42,536

Less: comprehensive income(loss)
attributable to non-controlling
interests

3,802

(1,441)

(1,028)

2,361

(5,355)

Comprehensive income
attributable to Canadian Solar Inc.

51,943

62,706

46,805

114,649

47,891


Canadian Solar Inc.

Unaudited Condensed Consolidated Balance Sheets

(In Thousands of U.S. Dollars)

June 30,

December 31,

2020

2019

ASSETS

Current assets:

Cash and cash equivalents

$    578,815

$     668,770

Restricted cash

398,739

526,723

Accounts receivable trade, net

421,691

436,815

Accounts receivable, unbilled

16,096

15,256

Amounts due from related parties

18,052

31,232

Inventories

547,106

554,070

Value added tax recoverable

109,358

108,920

Advances to suppliers

49,504

47,978

Derivative assets

5,989

5,547

Project assets

653,750

604,083

Prepaid expenses and other current assets

397,300

253,542

Total current assets

3,196,400

3,252,936

Restricted cash

16,766

9,927

Property, plant and equipment, net

970,065

1,046,035

Solar power systems, net

49,654

52,957

Deferred tax assets, net

136,267

153,963

Advances to suppliers

41,484

40,897

Prepaid land use right

58,800

60,836

Investments in affiliates

79,322

152,828

Intangible assets, net

22,430

22,791

Project assets

492,519

483,051

Right-of-use assets

30,162

37,733

Other non-current assets

164,661

153,253

TOTAL ASSETS

$    5,258,530

$       5,467,207


Canadian Solar Inc.

Unaudited Condensed Consolidated Balance Sheets (Continued)

(In Thousands of U.S. Dollars)

June 30,

December 31,

2020

2019

Current liabilities:

Short-term borrowings

$    1,015,749

$    933,120

Long-term borrowings on project assets –
current

179,978

286,173

Accounts payable

460,817

585,601

Notes payable

472,000

544,991

Amounts due to related parties

3,989

10,077

Other payables

448,973

446,454

Advance from customers

69,546

134,806

Derivative liabilities

10,461

10,481

Operating lease liabilities

17,218

18,767

Other current liabilities

112,496

121,527

Total current liabilities

2,791,227

3,091,997

Accrued warranty costs

47,280

55,878

Long-term borrowings

580,442

619,477

Derivatives liabilities

5,374

1,841

Liability for uncertain tax positions

15,543

15,353

Deferred tax liabilities

54,689

56,463

Loss contingency accruals

26,828

28,513

Operating lease liabilities

15,523

20,718

Financing liabilities

75,457

76,575

Other non-current liabilities

97,207

75,334

Total LIABILITIES

3,709,570

4,042,149

Equity:

Common shares

686,425

703,806

Treasury stock

(11,845)

Additional paid-in capital

22,989

17,179

Retained earnings

924,836

793,601

Accumulated other comprehensive loss

(126,193)

(109,607)

Total Canadian Solar Inc. shareholders’ equity

1,508,057

1,393,134

Non-controlling interests in subsidiaries

40,903

31,924

TOTAL EQUITY

1,548,960

1,425,058

TOTAL LIABILITIES AND EQUITY

$    5,258,530

$     5,467,207


About Non-GAAP Financial Measures

To supplement its financial disclosures presented in accordance with GAAP, the Company uses non-GAAP measures which are adjusted from the most comparable GAAP measures for certain items as described below. The Company presents non-GAAP net income and diluted earnings per share so that readers can better understand the underlying operating performance of the business before the impact of AD/CVD true-up provisions. The non-GAAP numbers are not measures of financial performance under U.S. GAAP, and should not be considered in isolation or as an alternative to other measures determined in accordance with GAAP. These non-GAAP measures may differ from non-GAAP measures used by other companies, and therefore their comparability may be limited.

Statement of Operations Data:

(In Thousands of U.S. Dollars, Except Share and Per Share Data)

Three Months Ended

Six Months Ended

June 30,

2020

June 30,

2019

June 30,

2020

June 30,

2019

GAAP net income attributable to Canadian
Solar Inc.

20,604

62,682

131,235

45,517

Non-GAAP income adjustment items:

AD/CVD provision true-up

(20,397)

(21,617)

(20,397)

(21,617)

Tax impact

5,054

5,365

5,054

5,365

Non-GAAP net income attributable to
Canadian Solar Inc.

5,261

46,430

115,892

29,265

GAAP income per share – diluted

$ 0.34

$ 1.04

$ 2.18

$ 0.76

Non-GAAP income per share – diluted

$ 0.09

$ 0.77

$ 1.93

$ 0.49

Shares used in computation – diluted

59,793,196

60,260,410

60,127,369

60,272,536


Related Links :

http://www.canadiansolar.com

Guiyang Advocates the Integration of Big Data and Local Industries

GUIYANG, China, Aug. 7, 2020At Guizhou Xingdaxing Building Material Co., Ltd., a worker was controlling three production lines through a big data platform."Today we have produced 939.38 cubic meters, and 0.48 cubic meters are left," he told the journalist of Huanqiu.com.

This system the staff operates is called High-Performance Concrete Smart Manufacturing Big Data Cloud Platform, which demonstrates how Guiyang leverages big data to develop industries.

Guiyang, a previously less developed city in Southwest China, has been known for the application of big data to a great variety of sectors in recent years. As China’s "Big Data Valley", how Guiyang utilizes big data in industries? The journalist of Huanqiu.com interviewed several players in local industries.

As the administrative director of Xingdaxing, Li Fuhui told Huanqiu.com, "launched in 2018, this big data system has become the first high-performance concrete big data project in China. Thanks to the platform, big data has been integrated into all aspects of enterprise production and management. We can monitor and track the whole production cycle, including ordering, manufacturing and delivering."

The corporation currently gains unprecedented visibility into its operations. On this basis, Xingdaxing can immediately spot a market trend and accordingly optimize the value chain, thus maximizing the profit and minimizing the costs.

Li said to Huanqiu.com, "Our production efficiency has increased by 10 percent. Moreover, transaction costs, management costs and product development costs have separately reduced by 40 percent, 50 percent and 40 percent."

It notes that Xingdaxing has advocated the intersection of big data with traditional building material industry. The company derives insight from data-driven solutions to boost productivity and profitability.

In addition to the building material industry, big data solutions can also be employed in the pharmaceutical industry to improve product quality and production efficiency. Guizhou Hanfang Pharmaceutical Co., Ltd. is a case in point.

As director of the Hanfang Pharmaceutical Technology Innovation Center, Zhang Shilin was sitting in the extraction workshop, where a large screen displays the real-time process flow, production parameters and the temperature.

Through automatic detection equipment such as temperature control probes and sensors, the workers can monitor and operate the production line in real time.

He pointed to the screen and told Huanqiu.com, "You can imagine how hard it is to control a two-storey high medicine extraction tank with a storage capacity of six tons. But thanks to the data-driven system, the pharmaceutical temperature range can be accurately controlled within two degrees Celsius, guaranteeing the quality of the medicine."

Furthermore, armed with big data, the workers can save time costs to a large extent. According to Zhang, in the past, it required a great number of manual efforts to submit applications and get instructions.

By comparison, Hanfang has built a data warehouse that gathers information in the production, sales, marketing, testing, management and other links of the entire industry chain.

Guizhou Hanfang Pharmaceutical Co., Ltd. has built a data warehouse that gathers information in the entire industry chain.

In order to complete the production process, the staff currently just need to log in to the production management system, enter the necessary information. Therefore, the manufacturing operation can be simplified to a great extent, which facilitates efficiency.

It can be seen that the big data solution replaces the previous manual method, hence effectively improving the product quality and production efficiency.

In fact, the successful utilization of big data in local industries is inseparable from government support. As China’s Big Data Valley, Guiyang has accelerated the advancement of smart manufacturing and promoted the intersection of industries with big data in recent years.

In 2019, the local government completed 25 bench-marking projects and 308 demonstration projects for big data, and 7 provincial smart manufacturing pilot projects. Major equipment manufacturing projects include Evergrande new energy vehicles, BYD smart manufacturing and Guiyang Geely engines.

According to the municipal government, in the future, Guiyang will continue the in-depth integration of big data with local industries.

On one hand, the government will cultivate new industries, strengthen the real economy and adhere to supply-side structural reform. In 2020, it plans to introduce more than 120 emerging industrial projects, ensuring the output value of new industries accounts for over 20 percent of the total industrial output value.

On the other hand, Guiyang will take advantage of big data to transform and upgrade traditional industries. In 2020, the local government will implement an internal network transformation of more than 50 industrial enterprises, organize over 20 key service providers to build industrial Internet service resource pools.

Photo – https://photos.prnasia.com/prnh/20200807/2879476-1?lang=0

Related Links :

http://www.huanqiu.com

IAS First to Integrate with Google Ads Data Hub for Viewability and Brand Safety, Bringing Advertisers Privacy-Centric Metrics Across YouTube


JAKARTA, Indonesia, Aug. 7, 2020 —  Integral Ad Science (IAS), the global leader in digital ad verification, today announced it is the first verification company to integrate with Google Ads Data Hub (ADH), Google’s privacy-focused data platform for advertisers. The IAS integration provides advertisers viewability, ad fraud, and brand safety measurement for YouTube via ADH.

While IAS does not collect or use any private audience data for delivering its verification services, being the first with this new integration will help lead the way for setting new data privacy best practices. Ultimately, ADH will enable advertisers to easily access a broader suite of privacy-protected data and measurement services.

"IAS is thrilled to be the first partner to provide advanced viewability, fraud, and brand safety metrics via Google’s Ads Data Hub," said Lisa Utzschneider, CEO at IAS. "Marketers are now even better equipped to provide quality advertising experiences for YouTube audiences while maintaining a high degree of data privacy."

Google Ads Data Hub ensures end-user privacy by enforcing privacy checks and aggregating within the solution prior to data output. Combining advertiser data with event-level data from ad campaigns allows marketers to unlock insights, improve advertising efficiency, help achieve data-driven business goals, and yield more effective campaign optimization.

"Marketers have made clear that they see a future where we are delivering consumer insights and media measurement that are both actionable and privacy-centric. We’re pleased to have IAS measurement solutions available to advertisers in Ads Data Hub in our continued effort and commitment to supporting third-party measurement on YouTube," said Prema Sampath, Senior Product Manager at Google.

IAS was selected as a preferred partner of the YouTube Measurement Program (YTMP) and is accredited to provide both Brand Suitability and Brand Safety services (including for Google’s premium YouTube Select inventory). IAS was also the first provider to be certified for Pre-Screened YouTube Select Lineups under the new YTMP announcement in April 2020.

For more information on IAS integration of Google’s Ads Data Hub please reach out to press@integralads.com 

Logo – https://techent.tv/wp-content/uploads/2020/08/ias-first-to-integrate-with-google-ads-data-hub-for-viewability-and-brand-safety-bringing-advertisers-privacy-centric-metrics-across-youtube.jpg


Related Links :

Home

Thentia Closes Series A With BDC to Bring Advanced Tech to Regulation

TORONTO, Aug. 7, 2020 — Thentia, a global leader in regulatory software, has closed Series A equity financing from the Business Development Bank of Canada’s Industrial, Clean and Energy Venture Fund. Thentia, which has a major presence in the regulatory and licensure market, will use this equity financing to expand its sales and marketing activities worldwide and further innovate its Thentia Cloud platform for its rapidly growing number of clients.

"Thentia’s mission is to bring best-in-class technological capabilities, such as internet-scale, high-performance records management, predictive analytics, machine learning, data science and graph-based data exploration to its customers," said Julian Cardarelli, CEO of Thentia. "The regulatory industry is strongly rooted in academics with many visionary leaders working tirelessly to protect the public. Thentia is equally tirelessly focused on providing the technology platform and tools needed to fully realize this vision."

Founded in Canada with clients all-across North America, Thentia was created by technology experts with a strong alignment on the principles and values associated with public protection. Because of this alignment, Thentia has become a leader in providing B2B software-as-a-service solutions to the regulatory industry in support of this mission. Regulatory bodies, licensees, and registrants have come to rely on Thentia for its innovative software technology, its highly knowledgeable and sympathetic on-boarding and success teams, and its unrivaled ability to streamline regulatory operations for its clients in accordance with best-in-class methodologies such as Right Touch Regulation. 

"Thentia has established itself as a leading provider of cloud software solutions for regulated industries," said Sean Brownlee. "We were impressed by the team’s ability to develop innovative solutions which solve customer challenges while increasing productivity. Our investment will help to propel Thentia to the next level as it continues to deliver world class solutions."

The equity financing from BDC will help Thentia continue to develop Thentia Cloud, which is Thentia’s software-as-a-service platform. Thentia Cloud provides a comprehensive collection of regulatory modules. These include modules to track licensing or registration issuance and renewals, continuing education, public complaints, investigation and enforcement, auditing, data analytics, governance and much more.

About Thentia:
Based in Toronto, Canada, Thentia Corporation is an industry leader in using proprietary technology to help regulatory bodies efficiently fulfill their regulatory obligations. Thentia services a wide variety of clients throughout Canada and the United States using cutting-edge software and industry-leading expertise in regulatory standards.

About BDC:
The Business Development Bank of Canada is a Crown corporation wholly owned by the government of Canada. Founded in 1944, BDC provides financing through complementary lending, equity, and venture capital, as well as advisory services to small and medium-sized businesses based in Canada. BDC is committed to supporting Canadian entrepreneurs at all stages of business development.

For more information, please contact:

Julian Cardarelli
CEO, Thentia Corporation
T: (800) 961- 1549
E: investor@thentia.com

Related Images

thentia-closed-their-series-a-with.jpg
Thentia closed their Series A with the BDC’s Industrial, Clean and Energy Venture Fund
An image of the Business Development Bank of Canada’s headquarters.

Related Links

Read more from Thentia

About the Industrial, Clean and Energy Technology (ICE) Venture Fund


Related Links :

https://www.thentia.com