Huawei’s Cross-Licensing with Ericsson and Kirin Chip Resurrection

Huawei is making headlines once again with two significant developments that promise to reshape its future trajectory. From securing a cross-licensing agreement with Ericsson to the exciting resurrection of Kirin chips, Huawei is demonstrating its commitment to collaboration and innovation.

Cross-Licensing Agreement with Ericsson

image 4
Huawei partners up with Ericcson via cross-licensing. Image source: GSMArena

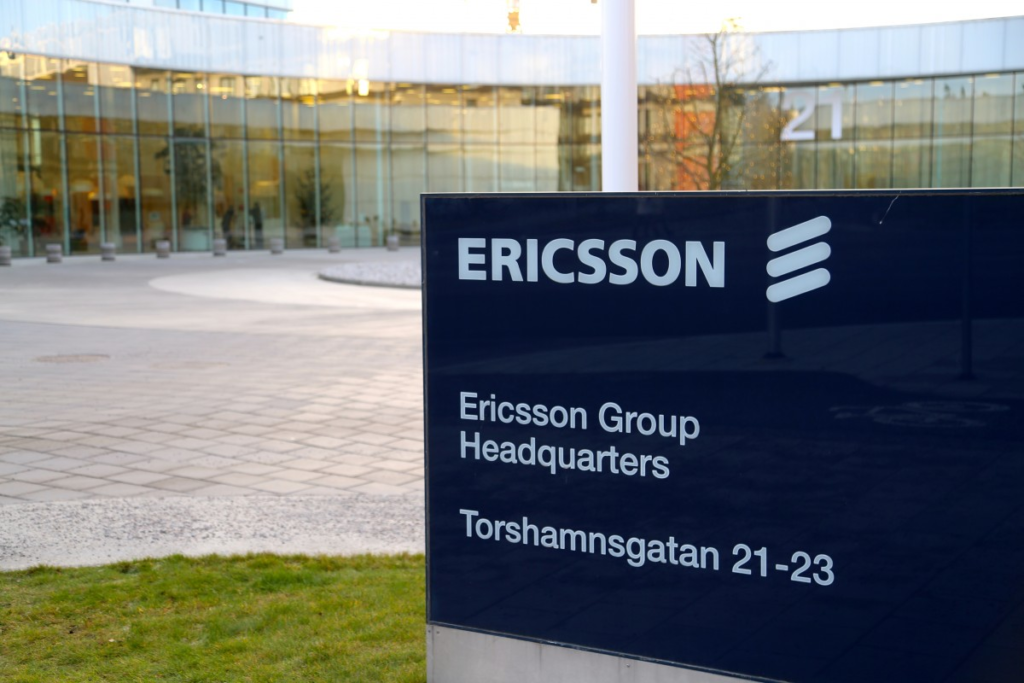
Huawei, a global technology giant, recently inked a cross-licensing agreement with Ericsson, a leading telecommunications equipment provider. This move is poised to have far-reaching implications in the realm of essential telecommunication standards. But what exactly does this agreement entail?

Simply put, a cross-licensing agreement allows both Huawei and Ericsson to access each other’s patents and technologies, fostering a spirit of cooperation rather than competition. The agreement covers the sharing of technologies between the two giants that covers standards such as 3GPP, ITU, IEEE, and IETF for 3G, 4G, and 5G cellular technologies.

One of the primary benefits of this agreement is the potential to reduce patent-related disputes and legal battles, which have plagued the tech industry in recent years. By sharing their intellectual property, Huawei and Ericsson aim to accelerate the pace of innovation and ensure that consumers worldwide benefit from cutting-edge technologies without unnecessary hindrances.

The Resurrection of Kirin Chips

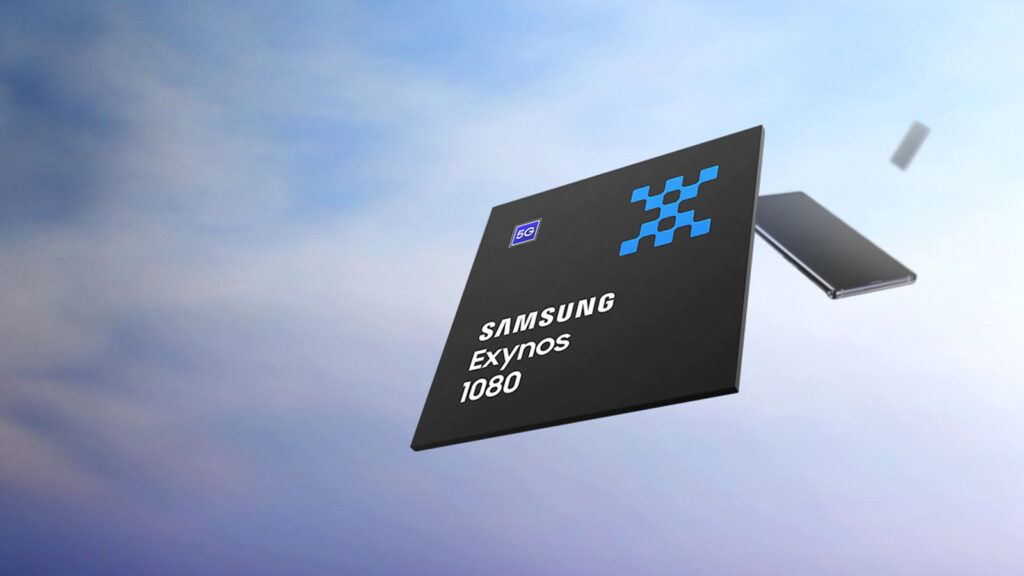
In another intriguing twist, Huawei is reportedly reviving its Kirin chipset series. The Kirin chips were highly regarded for their impressive performance and power efficiency until they faced disruptions due to U.S. sanctions. Now, Huawei is making strides to reintroduce these chips into the market.

image 3

The resurrection of Kirin chips marks Huawei’s determination to regain its foothold in the smartphone industry. These chips are known for their exceptional AI capabilities, which contribute to improved device performance and energy efficiency. Huawei’s decision to revive Kirin reflects its commitment to providing consumers with top-tier, in-house developed hardware.

Huawei strategic moves to become an industry leader

In conclusion, Huawei’s recent moves demonstrate its strategic vision and commitment to advancing technology in collaboration with industry peers. The cross-licensing agreement with Ericsson paves the way for smoother cooperation in essential telecommunication standards. This fosters innovation between both companies while reducing potential patent disputes. Simultaneously, the revival of Kirin chips signifies Huawei’s determination to remain a significant player in the smartphone industry, promising exciting possibilities for tech enthusiasts and consumers alike.

Sources: GSMArena, PhoneArena

Play Your PS5 Games Remotely with the PlayStation Portal

While Sony might not be making dedicated gaming handhelds anymore (RIP PS Vita), their commitment to delivering top-notch gaming experiences remains unwavering. Sony’s Remote Play feature, which allows gamers to stream their console games locally, has been available for over a decade. And now, Sony is taking it to the next level with the PlayStation Portal, a device designed to bring your PS5 gaming experience wherever you go.

This handheld, teased earlier this year as Project Q, is designed to make your PS5 gaming experience portable without compromising on quality. Equipped with an impressive eight-inch 1080p LCD display, it can stream games at up to 60fps.

Playstation Portal 3

This isn’t your run-of-the-mill handheld console; it’s a dedicated remote-play device that’s ready to extend your PS5 gaming experience. Sporting controllers that mirror the design and functionality of the PS5’s DualSense controllers, the PlayStation Portal ensures you get that familiar haptic feedback and adaptive triggers, making your gaming experience seamless and consistent.

One crucial aspect that gamers often worry about when it comes to remote play is latency. Will there be a lag that ruins the experience? According to IGN’s review, the PlayStation Portal does an excellent job in this department, offering minimal latency during gameplay.

However, there’s a catch. The PlayStation Portal isn’t a standalone gaming device. Instead, it’s your gateway to streaming games from your PS5 using Wi-Fi. You can only play games that are already installed on your PS5 console; it won’t support PS VR2 games or games streamed through PlayStation Plus Premium’s cloud streaming.

Playstation Portal 1

Sony has made an interesting move in the audio department. Instead of offering Bluetooth audio support, they’re introducing their proprietary PlayStation Link wireless technology. It promises lossless, lag-free audio, but it also means the PlayStation Portal won’t work with existing wireless headsets. You’ll need Sony’s new wireless headphones and earbuds, which are launching alongside the Portal.

As for battery life, Sony is aiming for a duration similar to its DualSense controller, which typically lasts around seven to nine hours. Sony hasn’t revealed all the details yet, but they’re targeting a release “later this year.”

Pricing & Availability

The PlayStation Portal will be priced at USD$199.99 (MYR932.42), EUR219.99 (MYR1,101.99), GBP199.99 (MYR1,171.15) and JPY29,980 (MYR949.36).

Playstation Portal 2

The handheld remote play device is now available for pre-order in select markets, including the U.S., U.K., France, Germany, Austria, Belgium, Luxembourg, Netherlands, Italy, Spain, and Portugal. Availability in other regions will be announced as they become available.

It will officially launch on November 15, 2023.

Samsung’s Upcoming Mid-Range Galaxy Phones to Get a Boost from AMD RDNA-based Graphics

Samsung’s collaboration with AMD goes beyond flagships.

Not long ago, Samsung and AMD decided to work together to bring better graphics performance to Samsung’s Exynos chipsets. Since then, only the Galaxy S22 models, powered by Samsung’s Exynos 2200 chipset, were equipped with AMD GPUs (graphics processing units). While Samsung may have opted for Qualcomm chips for their next flagship Galaxy S family, the partnership is far from over. In fact, it’s set to extend to mid-range smartphones.

AMD Radeon Graphics dl1
Source: Samsung

Revegnus (@Tech_Reve), a reliable leaker, has dropped some intriguing information about Samsung’s plans for their upcoming mid-range devices. These smartphones, expected to be announced and released next year, will feature AMD graphics technology. Specifically, the mid-range Exynos chipsets like the 1480 and 1430 will be equipped with mRDNA AMD GPUs.

Now, what makes this move particularly interesting is that these GPUs won’t primarily focus on gaming. While AMD GPUs are known for their prowess in gaming, Samsung’s strategy for their mid-range phones is different. Instead of amping up gaming capabilities, these GPUs will concentrate on improving image signal processing (ISP).

Source: Samsung

This strategic shift aligns with the mid-range smartphone market. Unlike flagship devices, mid-range phones typically don’t boast the hardware required for an enhanced gaming experience – think powerful CPUs, advanced cooling systems, and high-refresh-rate displays. Therefore, focusing on enhancing the ISP is a wise move and would provide a significant performance boost when it comes to smartphone performance.

If these rumours are true, Samsung could leverage the performance improvements from incorporating AMD’s mRDNA technology to bolster its already popular midrange Galaxy A series. As mid-range phones continue to gain popularity, it’s a smart strategy that could pay off handsomely.

OPPO A38 Brings SUPERVOOC Charging & 50-megapixel Camera for less then MYR600

OPPO Malaysia has introduced a new offering into their entry-level lineup – the OPPO A38. The new smartphone brings OPPO’s now signature SUPERVOOC charging to its lower-end devices. However, the new A38 is still packing the heat when it comes to the cameras.

OPPO A38 04

The OPPO A38 comes with a design akin to the one we’ve seen on OPPO’s A78 and A98. Sleek, slender and ergonomically angled are the best descriptors for the A-series this year. The A38 has a sleek body and a textured back to help with grip and ergonomics. The back is also etched with OPPO’s Glow design technique that makes the smartphone shimmer under the light. It’s also got a matte finish to ensure that fingerprints don’t soil the details of the smartphone.

It’s not just about the design when it comes to the A38. OPPO is packing the entry-level device with enough features to make Santa Claus look stingy. When it comes to biometrics, the OPPO A38 comes with a side-mounted fingerprint reader which is embedded into the power button. The volume rocker and power buttons are also slightly raised for tactility.

OPPO A38 06

The display on the smartphone is a 6.56-inch IPS LCD display. It has an HD+ resolution of 720×1612 pixels, a peak brightness of 720 nits and a 90Hz refresh rate. OPPO’s Sunlight Display also allows for better visibility under harsh lighting conditions and covers 96% of the DCI-P3 colour gamut for close-to-life colour reproduction.

On the back is a dual camera setup with a 50-megapixel main sensor. This is complemented by a 2-megapixel depth sensor. Up front, is a 5-megapixel selfie camera. The A38’s cameras are also feature-packed with AI-enabled features such as Portrait mode. The main camera sensor also uses pixel-binning technology for more detailed pictures even in low light. On the A38, this technology combines 4 individual pixels into a single pixel allowing more details to be observed by the sensor for better details in the picture.

The OPPO A38 is running on the Mediatek Helio G85 platform. The processor features two high-performance Cortex-A75 cores and six Cortex-A55 cores which allow it to strike a balance between performance and power efficiency. This is complemented with 4GB of RAM and 128GB of onboard storage.

OPPO A38 07

OPPO touts an all-day battery with the smartphone’s large 5,000mAh battery. If you’re ever in need of a top-up, the 33W SUPERVOOC charging gives you a full charge in about 75 minutes. Oh… did we forget? It also has IP54 dust and water resistance.

Pricing & Availability

The OPPO A38 is already available in stores in Malaysia. The smartphone will be available in 2 shades: Glowing Gold and Glowing Black. It will cost MYR599.

Nippon Express (China) Named One of “Top 50 Chinese Logistics Companies” in 2023 for Seventh Consecutive Year

TOKYO, Sept. 5, 2023 /PRNewswire/ — Nippon Express (China) Co., Ltd. (hereinafter “NX China”), a group company of NIPPON EXPRESS HOLDINGS, INC., was designated one of the “Top 50 Chinese Logistics Companies for 2023,” the only Japanese company to be so honored, at the China Logistics Situation Development Analysis Conference and Top 50 Logistics Enterprises Forum jointly hosted by the China Federation of Logistics & Purchasing and Hebei Transportation Investment Group Corporation in Wuhan, China, on August 3.

Logo: https://kyodonewsprwire.jp/img/202308298606-O1-7HuK79tp 

Image:
https://cdn.kyodonewsprwire.jp/prwfile/release/M103866/202308298606/_prw_PI2fl_7SaH3Q9O.jpg 

This event has been held annually since 2005 by the China Federation of Logistics & Purchasing to select the “Top 50 Chinese Logistics Companies” from among tens of thousands of Chinese and foreign logistics companies in China based on statistical logistics revenue data. Inclusion among the Top 50 is determined by such management benchmarks as sales, company size, growth potential and profitability. Approximately 600 logistics company representatives and experts from all over China participated in this year’s event, and NX China placed among the Top 50 for the seventh consecutive year since 2017.

The Nippon Express Group will continue helping customers develop their business activities by offering international transport services utilizing its global network and further expanding its logistics functions within China to realize its long-term vision of becoming a logistics company with a strong presence in the global market.

Nippon Express website: https://www.nipponexpress.com/ 

Nippon Express Group’s official LinkedIn account:
https://www.linkedin.com/company/nippon-express-group/ 

Source: NIPPON EXPRESS HOLDINGS, INC.

Trip.com Group Limited Reports Unaudited Second Quarter and First Half of 2023 Financial Results

SHANGHAI, Sept. 5, 2023 /PRNewswire/ — Trip.com Group Limited (Nasdaq: TCOM; HKEX: 9961) (“Trip.com Group” or the “Company”), a leading one-stop travel service provider of accommodation reservation, transportation ticketing, packaged tours, and corporate travel management, today announced its unaudited financial results for the second quarter and first half of 2023.

Key Highlights for the Second Quarter of 2023

  • Domestic and international business continued to show robust recovery in the second quarter of 2023

– Domestic hotel bookings grew by 170% year over year and by over 60% compared to the pre-COVID level for the same period in 2019.
– Outbound hotel and air reservations recovered to over 60% of the pre-COVID level for the same period in 2019, surpassing the industry-wide recovery rate of 37% in terms of international air passenger volume for the same period.
– Air ticket bookings on the Company’s global OTA platform grew by over 120% year over year and nearly doubled compared to the pre-COVID level for the same period in 2019.

  • The Company delivered strong results in the second quarter of 2023 

– Total net revenue increased by 180% year over year and exceeded the pre-COVID level for the same period in 2019 by 29%.
– Net income for the second quarter was RMB648 million (US$91 million), which improved from RMB43 million for the same period in 2022.
– Adjusted EBITDA for the second quarter was RMB3.7 billion (US$507 million). Adjusted EBITDA margin was 33%, compared to 9% for the same period in 2022 and 31% for the previous quarter.

“During the second quarter of 2023, the demand for both domestic and international travel remained resilient.” said James Liang, Executive Chairman. “Despite limited air capacity recovery, the robust rebound of travel activities reflects travelers’ strong desire to explore the world. We remain optimistic about the enduring demand for travel and the long-term market outlook.”

“We are encouraged by our solid results in the second quarter,” said Jane Sun, Chief Executive Officer. “With the thriving market demand and our outstanding performance, we are poised to take the lead in driving the industry’s recovery and actively creating an abundance of job opportunities alongside our esteemed business partners.”

Second Quarter of 2023 Financial Results and Business Updates

The Company’s business continued to recover significantly since the pent-up demand for travel remains strong, which led to an increasing volume of travel bookings.

For the second quarter of 2023, Trip.com Group reported net revenue of RMB11.2 billion (US$1.6 billion), representing a 180% increase from the same period in 2022 and a 22% increase from the previous quarter, primarily due to the substantial recovery of travel market.

Accommodation reservation revenue for the second quarter of 2023 was RMB4.3 billion (US$591 million), representing a 216% increase from the same period in 2022 and a 23% increase from the previous quarter, primarily due to the substantial recovery of travel market.

Transportation ticketing revenue for the second quarter of 2023 was RMB4.8 billion (US$664 million), representing a 173% increase from the same period in 2022 and a 16% increase from the previous quarter, primarily due to the substantial recovery of travel market.

Packaged-tour revenue for the second quarter of 2023 was RMB722 million (US$100 million), representing a 492% increase from the same period in 2022 and an 87% increase from the previous quarter, primarily due to the substantial recovery of travel market.

Corporate travel revenue for the second quarter of 2023 was RMB584 million (US$81 million), representing a 178% increase from the same period in 2022 and a 31% increase from the previous quarter, primarily due to the substantial recovery of travel market.

Cost of revenue for the second quarter of 2023 increased by 106% to RMB2.0 billion (US$277 million) from the same period in 2022 and increased by 23% from the previous quarter, primarily due to the substantial recovery of travel market. Cost of revenue as a percentage of net revenue was 18% for the second quarter of 2023.

Product development expenses for the second quarter of 2023 increased by 67% to RMB3.0 billion (US$407 million) from the same period in 2022 and increased by 10% from the previous quarter, primarily due to an increase in product development personnel related expenses. Product development expenses as a percentage of net revenue was 26% for the second quarter of 2023.

Sales and marketing expenses for the second quarter of 2023 increased by 185% to RMB2.4 billion (US$325 million) from the same period in 2022 and increased by 34% from the previous quarter, primarily due to an increase in expenses relating to sales and marketing promotion activities. Sales and marketing expenses as a percentage of net revenue was 21% for the second quarter of 2023.

General and administrative expenses for the second quarter of 2023 increased by 58% to RMB955 million (US$132 million) from the same period in 2022 primarily due to an increase in general and administrative personnel related expenses and increased by 7% from the previous quarter. General and administrative expenses as a percentage of net revenue was 8% for the second quarter of 2023.

Income tax expense for the second quarter of 2023 was RMB562 million (US$77 million), compared to RMB173 million for the same period in 2022 and RMB341 million for the previous quarter. The change in Trip.com Group’s effective tax rate was primarily due to the combined impacts of changes in respective profitability of its subsidiaries with different tax rates, certain non-taxable income or loss resulting from the fair value changes in equity securities investments and exchangeable senior notes, and changes in valuation allowance provided for deferred tax assets.

Net income for the second quarter of 2023 was RMB648 million (US$91 million), compared to RMB43 million for the same period in 2022 and RMB3.4 billion for the previous quarter. Adjusted EBITDA for the second quarter of 2023 was RMB3.7 billion (US$507 million), compared to RMB355 million for the same period in 2022 and RMB2.8 billion for the previous quarter. Adjusted EBITDA margin was 33% for the second quarter of 2023, compared to 9% for the same period in 2022 and 31% for the previous quarter.

Net income attributable to Trip.com Group’s shareholders for the second quarter of 2023 was RMB631 million (US$89 million), compared to RMB69 million for the same period in 2022 and RMB3.4 billion for the previous quarter. Excluding share-based compensation charges, fair value changes of equity securities investments and exchangeable senior notes recorded in other income/(expense) and their tax effects, non-GAAP net income attributable to Trip.com Group’s shareholders for the second quarter of 2023 was RMB3.4 billion (US$475 million), compared to non-GAAP net loss attributable to Trip.com Group’s shareholders of RMB203 million for the same period in 2022 and non-GAAP net income attributable to Trip.com Group’s shareholders of RMB2.1 billion for the previous quarter.

Diluted earnings per ordinary share and per ADS was RMB0.94 (US$0.13) for the second quarter of 2023. Excluding share-based compensation charges, fair value changes of equity securities investments and exchangeable senior notes and their tax effects, non-GAAP diluted earnings per ordinary share and per ADS was RMB5.11 (US$0.70) for the second quarter of 2023. Each ADS currently represents one ordinary share of the Company.

As of June 30, 2023, the balance of cash and cash equivalents, restricted cash, short-term investment, held to maturity time deposit and financial products was RMB75.0 billion (US$10.3 billion).

Conference Call

Trip.com Group’s management team will host a conference call at 8:00 PM EST on September 4, 2023 (or 8:00 AM CST on September 5, 2023) following this announcement.

The conference call will be available live on Webcast and for replay at: https://investors.trip.com. The call will be archived for twelve months on our website.

All participants must pre-register to join this conference call using the Participant Registration link below:
https://register.vevent.com/register/BI90bc7b46919e4b55a896bf30b59d4a4a 

Upon registration, each participant will receive details for this conference call, including dial-in numbers and a unique access PIN. To join the conference, please dial the number provided, enter your PIN, and you will join the conference instantly.

Safe Harbor Statement

This announcement contains forward-looking statements. These statements are made under the “safe harbor” provisions of the U.S. Private Securities Litigation Reform Act of 1995. These forward-looking statements can be identified by terminology such as “may,” “will,” “expect,” “anticipate,” “future,” “intend,” “plan,” “believe,” “estimate,” “is/are likely to,” “confident” or other similar statements. Among other things, quotations from management in this press release, as well as Trip.com Group’s strategic and operational plans, contain forward-looking statements. Forward-looking statements involve inherent risks and uncertainties. A number of important factors could cause actual results to differ materially from those contained in any forward-looking statement. Potential risks and uncertainties include, but are not limited to, severe or prolonged downturn in the global or Chinese economy, general declines or disruptions in the travel industry, volatility in the trading price of Trip.com Group’s ADSs or shares, Trip.com Group’s reliance on its relationships and contractual arrangements with travel suppliers and strategic alliances, failure to compete against new and existing competitors, failure to successfully manage current growth and potential future growth, risks associated with any strategic investments or acquisitions, seasonality in the travel industry in the relevant jurisdictions where Trip.com Group operates, failure to successfully develop Trip.com Group’s existing or future business lines, damage to or failure of Trip.com Group’s infrastructure and technology, loss of services of Trip.com Group’s key executives, the impact of COVID-19 to Trip.com Group’s business operations, adverse changes in economic and political policies of the PRC government, inflation in China, risks and uncertainties associated with PRC laws and regulations with respect to the ownership structure of the variable interest entities and the contractual arrangements among Trip.com Group, the variable interest entities and their shareholders, and other risks outlined in Trip.com Group’s filings with the U.S. Securities and Exchange Commission or the Stock Exchange of Hong Kong Limited. All information provided in this press release and in the attachments is as of the date of the issuance, and Trip.com Group does not undertake any obligation to update any forward-looking statement, except as required under applicable law.

About Non-GAAP Financial Measures

To supplement Trip.com Group’s consolidated financial statements, which are prepared and presented in accordance with United States Generally Accepted Accounting Principles (“GAAP”), Trip.com Group uses non-GAAP financial information related to adjusted net income attributable to Trip.com Group Limited, adjusted EBITDA, adjusted EBITDA margin, and adjusted diluted earnings per ordinary share and per ADS, each of which is adjusted from the most comparable GAAP result to exclude the share-based compensation charges that are not tax deductible, fair value changes of equity securities investments and exchangeable senior notes, net of tax, and other applicable items. Trip.com Group’s management believes the non-GAAP financial measures facilitate better understanding of operating results from quarter to quarter and provide management with a better capability to plan and forecast future periods.

Non-GAAP information is not prepared in accordance with GAAP, does not have a standardized meaning under GAAP, and may be different from non-GAAP methods of accounting and reporting used by other companies. The presentation of this additional information should not be considered a substitute for GAAP results. A limitation of using non-GAAP financial measures is that non-GAAP measures exclude share-based compensation charges, fair value changes of equity securities investments and exchangeable senior notes and their tax effects that have been and will continue to be significant recurring expenses in Trip.com Group’s business for the foreseeable future.

Reconciliations of Trip.com Group’s non-GAAP financial data to the most comparable GAAP data included in the consolidated statement of operations are included at the end of this press release.

About Trip.com Group Limited

Trip.com Group Limited (Nasdaq: TCOM; HKEX: 9961) is a leading global one-stop travel platform, integrating a comprehensive suite of travel products and services and differentiated travel content. It is the go-to destination for travelers in China, and increasingly for travelers around the world, to explore travel, get inspired, make informed and cost-effective travel bookings, enjoy hassle-free on-the-go support, and share travel experience. Founded in 1999 and listed on Nasdaq in 2003 and HKEX in 2021, the Company currently operates under a portfolio of brands, including Ctrip, Qunar, Trip.com, and Skyscanner, with the mission “to pursue the perfect trip for a better world.”

For further information, please contact:

Investor Relations

Trip.com Group Limited
Tel: +86 (21) 3406-4880 X 12229
Email: iremail@trip.com

Trip.com Group Limited

Unaudited Consolidated Balance Sheets

(In millions, except share and per share data)

December 31, 2022

June 30, 2023

June 30, 2023

RMB (million)

RMB (million)

USD (million)

ASSETS

Current assets:

Cash, cash equivalents and restricted cash

18,487

36,843

5,080

Short-term investments

25,545

18,532

2,556

Accounts receivable, net 

5,486

10,689

1,474

Prepayments and other current assets 

11,917

17,028

2,348

Total current assets

61,435

83,092

11,458

Property, equipment and software

5,204

5,192

716

Intangible assets and land use rights

12,825

12,738

1,757

Right-of-use asset

819

715

99

Investments (Includes held to maturity time deposit and
financial products of RMB15,527 million and RMB19,581
million as of December 31,2022 and June 30, 2023,
respectively)

50,177

54,757

7,551

Goodwill

59,337

59,382

8,189

Other long-term assets

570

624

86

Deferred tax asset

1,324

1,716

237

Total assets

191,691

218,216

30,093

LIABILITIES

Current liabilities:

Short-term debt and current portion of long-term debt

32,674

32,414

4,470

Accounts payable

7,569

14,729

2,031

Advances from customers

8,278

13,505

1,862

Other current liabilities

12,718

15,029

2,073

Total current liabilities

61,239

75,677

10,436

Deferred tax liability

3,487

3,647

503

Long-term debt

13,177

19,697

2,716

Long-term lease liability

534

484

67

Other long-term liabilities

235

310

43

Total liabilities

78,672

99,815

13,765

SHAREHOLDERS’ EQUITY

Total Trip.com Group Limited shareholders’ equity

112,283

117,649

16,224

Non-controlling interests

736

752

104

Total shareholders’ equity

113,019

118,401

16,328

Total liabilities and shareholders’ equity

191,691

218,216

30,093

Trip.com Group Limited

Unaudited Consolidated Statements of Income/(Loss)

(In millions, except share and per share data)

Three Months Ended

Six Months Ended

June 30, 2022

March 31, 2023

June 30, 2023

June 30, 2023

June 30, 2022

June 30, 2023

June 30, 2023

RMB (million)

RMB (million)

RMB (million)

USD (million)

RMB (million)

RMB (million)

USD (million)

Revenue:

Accommodation reservation 

1,357

3,480

4,285

591

2,807

7,765

1,071

Transportation ticketing 

1,763

4,156

4,814

664

3,426

8,970

1,237

Packaged-tour 

122

386

722

100

246

1,108

153

Corporate travel

210

445

584

81

432

1,029

142

Others

564

744

857

118

1,216

1,601

221

Total revenue

4,016

9,211

11,262

1,554

8,127

20,473

2,824

Less: Sales tax and surcharges

(5)

(13)

(15)

(2)

(7)

(28)

(4)

Net revenue

4,011

9,198

11,247

1,552

8,120

20,445

2,820

Cost of revenue

(976)

(1,637)

(2,007)

(277)

(2,043)

(3,644)

(502)

Gross profit

3,035

7,561

9,240

1,275

6,077

16,801

2,318

Operating expenses:

Product development *

(1,772)

(2,674)

(2,953)

(407)

(3,746)

(5,627)

(776)

Sales and marketing *

(826)

(1,755)

(2,355)

(325)

(1,669)

(4,110)

(567)

General and administrative *

(604)

(891)

(955)

(132)

(1,188)

(1,846)

(255)

Total operating expenses

(3,202)

(5,320)

(6,263)

(864)

(6,603)

(11,583)

(1,598)

(Loss)/income from operations

(167)

2,241

2,977

411

(526)

5,218

720

Interest income 

544

441

513

71

1,135

954

132

Interest expense

(351)

(486)

(555)

(77)

(692)

(1,041)

(144)

Other income/(expense)

469

1,652

(1,961)

(270)

(238)

(309)

(43)

Income/(loss) before income
tax expense and equity in
income of affiliates

495

3,848

974

135

(321)

4,822

665

Income tax expense

(173)

(341)

(562)

(77)

(159)

(903)

(124)

Equity in (loss)/gain of affiliates

(279)

(133)

236

33

(478)

103

14

Net income/(loss)

43

3,374

648

91

(958)

4,022

555

Net loss/(income) attributable to non-
controlling interests

26

1

(17)

(2)

38

(16)

(2)

Net income/(loss) attributable
to Trip.com Group Limited

69

3,375

631

89

(920)

4,006

553

Earnings/(losses) per ordinary share 

– Basic

0.10

5.18

0.97

0.13

(1.42)

6.14

0.85

– Diluted

0.10

5.02

0.94

0.13

(1.42)

5.98

0.82

Earnings/(losses) per ADS 

– Basic

0.10

5.18

0.97

0.13

(1.42)

6.14

0.85

– Diluted

0.10

5.02

0.94

0.13

(1.42)

5.98

0.82

Weighted average ordinary shares outstanding 

– Basic

647,866,001

651,849,468

653,392,956

653,392,956

647,843,829

652,625,256

652,625,256

– Diluted

650,906,465

672,743,729

671,942,381

671,942,381

647,843,829

670,838,392

670,838,392

* Share-based compensation included in Operating expenses above is as follows:

  Product development 

146

179

234

32

253

413

57

  Sales and marketing 

28

31

44

6

46

75

10

  General and administrative 

130

168

219

30

228

387

53

Trip.com Group Limited

Unaudited Reconciliation of  GAAP and Non-GAAP Results

(In millions, except %, share and per share data)

Three Months Ended

Six Months Ended

June 30, 2022

March 31, 2023

June 30, 2023

June 30, 2023

June 30, 2022

June 30, 2023

June 30, 2023

RMB (million)

RMB (million)

RMB (million)

USD (million)

RMB (million)

RMB (million)

USD (million)

Net income/(loss)

43

3,374

648

91

(958)

4,022

555

Less: Interest income

(544)

(441)

(513)

(71)

(1,135)

(954)

(132)

Add: Interest expense

351

486

555

77

692

1,041

144

Add: Other (income)/expense

(469)

(1,652)

1,961

270

238

309

43

Add: Income tax expense

173

341

562

77

159

903

124

Add: Equity in loss/(income) of affiliates

279

133

(236)

(33)

478

(103)

(14)

(Loss)/income from operations

(167)

2,241

2,977

411

(526)

5,218

720

Add: Share-based compensation

304

378

497

68

527

875

120

Add: Depreciation and amortization

218

201

204

28

445

405

56

Adjusted EBITDA

355

2,820

3,678

507

446

6,498

896

Adjusted EBITDA margin

9 %

31 %

33 %

33 %

5 %

32 %

32 %

Net income/(loss) attributable to Trip.com Group Limited

69

3,375

631

89

(920)

4,006

553

Add: Share-based compensation

304

378

497

68

527

875

120

Add: (Gain)/loss from fair value changes of equity securities
investments and exchangeable senior notes

(668)

(1,648)

2,351

324

117

703

97

Add: Tax effects on fair value changes of equity securities
investments and exchangeable senior notes

92

(40)

(45)

(6)

37

(85)

(12)

Non-GAAP net (loss)/income attributable to Trip.com Group
Limited

(203)

2,065

3,434

475

(239)

5,499

758

Weighted average ordinary shares outstanding-
 Diluted-non GAAP 

647,866,001

672,743,729

672,031,445

672,031,445

647,843,829

670,838,392

670,838,392

Non-GAAP Diluted (losses)/income per share 

(0.31)

3.07

5.11

0.70

(0.37)

8.20

1.13

Non-GAAP Diluted (losses)/income per ADS 

(0.31)

3.07

5.11

0.70

(0.37)

8.20

1.13

Notes for all the condensed consolidated financial schedules presented:

Note 1: The conversion of Renminbi (RMB) into U.S. dollars (USD) is based on the certified exchange rate of USD1.00=RMB7.2513 on June 30, 2023 published by the Federal Reserve Board.

“With Saudi, Go Global” Huawei Cloud Launches Services in Saudi Arabia

RIYADH, Saudi Arabia, Sept. 4, 2023 /PRNewswire/ — Huawei Cloud announced the launch of the Huawei Cloud Riyadh Region today at the Huawei Cloud Summit Saudi Arabia 2023. This Region will help promote digital-led economic growth in the country.

The launch of the Huawei Cloud Riyadh Region announced that the Saudi Arabia Region will be Huawei Cloud’s focus in serving the Middle East, Central Asia and Africa, providing innovative, reliable, secure, and sustainable cloud services. This achievement underscores Huawei CLOUD’s unwavering dedication to supporting Saudi Arabia’s Vision 2030, aligned with the nation’s ambitious technological advancement, leadership, and innovation goals.

H.E. Eng. Haitham bin Abdul Rahman Al-Ohali, Vice Minister at the Ministry of Communications and Information Technology (MCIT) in Saudi Arabia, shared his perspective on this monumental achievement: “Huawei is a proud partner in our country’s technological progress having worked with the Ministry, service providers, enterprises and universities in various collective efforts towards digital transformation. We look forward to the transformative impact the Huawei Cloud Riyadh Region will have on our digital ecosystem, creating new avenues for innovation and growth.

The Riyadh Region provides several benefits to customers. First, this region translates Huawei’s global expertise on digital transformation into industries’ excellence, making innovation easier and faster. Huawei Cloud Saudi Region is located in Riyadh and through a 3AZ (availability zone) architecture, it will provide highly available and secure cloud services, ensuring the stable operations of various services. In addition, the Region can provide full-stack cloud services, including infrastructure, databases, containers, big data, and AI services to meet the requirements of various industries.

Based on the 3AZ high-reliability architecture, the Riyadh Region provides low latency, covering all existing carriers’ networks powered by STC, Zain, and Mobily. The local data center will store data locally in line with local data regulations. The company will also launch 68 cloud services in three categories – data, AI, and cloud native.

Steven Yi, Senior Vice President of Huawei and President of Huawei Middle East and Central Asia Region, said: “I’ve cherished numerous unforgettable moments in this extraordinary country. Just yesterday, walking through the newly renovated Diriyah evoked my deep emotions. It brought to mind an old Chinese saying: ‘Build the right nest, and a Phoenix will come.’ The essence is clear: create an inviting environment, and you’ll attract the best. This is undeniably true for Saudi, a nation that consistently attracts top investors.”

The company revealed that Huawei Cloud will utilize a number of industry-leading technologies to advance intelligence for Saudi Arabia, including the Pangu Models 3.0, which address AI adoption challenges, leveraging industry insights to enhance AI capabilities across sectors like finance, government, manufacturing, and more. Pangu Models 3.0 will usher in a new era of innovation in the Kingdom while accelerating economic diversification.

At the Huawei Cloud Summit Saudi Arabia 2023, the company also released the “Saudi Arabia Go Cloud Go Global” program to connect Chinese and Saudi enterprises, fostering growth and innovation. The company will leverage its strong experience of working in more than 170 countries and regions, various industries, advanced technologies, and solutions to help Chinese enterprises enter Saudi Arabia and enhance partnerships with local stakeholders.

Jacqueline Shi, President of Huawei Cloud Global Marketing and Sales Service, said, “Huawei Cloud aims high, aims global, and aims here in Saudi Arabia. Saudi Arabia Region will be our focus in serving the Middle East, Central Asia and Africa, providing innovative, reliable, secure, and sustainable cloud services. We hope to create a better choice for advancing intelligence. This cloud gives you more choices to stay innovative, inclusive, and open.  This cloud will help you succeed in the digital and intelligent era. This cloud is for everyone.”

At the event, the company also announced that Huawei Cloud will train 200,000 developers in Saudi Arabia in the next five years. It will also build joint solutions with 1,000 local partners and launch the Huawei Cloud Startup Program to help 2,000 startups grow.

Eric Yang, CEO of Huawei Saudi Arabia, said: “We are proudly launching Huawei Cloud Riyadh Region today. It has been a great journey for us in Saudi Arabia for the last 20 years. Huawei is a constructor for an intelligent society, contributor to a thriving economy, and cultivator for a prosperous talent ecosystem. Towards 2030, we will stay dedicated to continuously providing ubiquitous connectivity, green energy, pervasive cloud computing and AI capabilities for Saudi Arabia to unlock unlimited opportunities of the new digital era.”

Huawei Saudi Arabia was founded in 2002 and has played a pivotal role in the digital transformation in Saudi Arabia. Over the course of 19 years, Huawei has collaborated with regional communication service providers (CSPs) to provide reliable network assurance for the Hajj pilgrimage in Saudi Arabia without incidents. The company also supported the roll-out of 5G in the Kingdom, enabling the country to become one of the world’s pioneer 5G markets. Huawei has helped connect 3.5 million people in rural areas, created 20,000 local jobs, and cultivated 10,000 ICT talents for Saudi Arabia.

Under its “Everything as a Service” strategy, Huawei Cloud is focused on becoming the cloud foundation and enabler of industry digitalization, providing services for customers in more than 170 countries and regions worldwide.

Apple’s Next Event Will Unveil the Latest iPhone

apple15

Apple fans, mark your calendars! Apple is expected to unveil the latest iPhone on 12 September in a livestream event broadcasted from Apple Park. While the official invitation included some cryptic clues, we’re here to decode the details for you.

The invitation sent to the media featured a mysterious image and a single intriguing word: “Wonderlust.” While it doesn’t explicitly state that the event will revolve around the iPhone, history suggests this is precisely what we can expect. As the theme alludes to a sense of wanderlust, it’s safe to say whatever they’ll be announcing that day will be something for travelling enthusiasts.

So far, leaks and insider reports have given us a glimpse into the upcoming iPhone. Anticipate significant changes, including the long-awaited shift from Lightning to USB-C, upgraded processors, the introduction of the Dynamic Island feature on non-Pro models, and a transition from stainless steel to titanium finish for the Pro models.

If you want to catch the announcements live, you can visit the apple.com website on 13 September at 1 AM (Malaysia time). In the meantime, we’ll hold on to our seats for these exciting updates. Watch this space for more news!

[IFA 2023] JBL Shows Off JBL Authentics Series

HARMAN International showed off a brand new line of speakers at IFA 2023. The JBL Authentics range of home speakers brings a sense of style complete with JBL’s signature sound tuning. JBL isn’t just harmonising tunes, it’s harmonizing two giants, Google Assistant and Amazon Alexa, in one seamless audio experience.

In today’s audio landscape, immersion is key. According to a recent HARMAN survey, 75% of respondents highlighted the importance of audio quality in conveying the true emotions of music. High-quality audio aids concentration, relaxation, and a deeper emotional connection to the content. To cater to this demand, JBL Authentics is engineered to deliver stadium-like sound in your living room. This collection consists of three distinct models: Authentics 200, 300, and 500. While the Authentics 200 and 300 cater to indoor and outdoor needs, the Authentics 500 stands tall as a powerhouse.

497045 JBL Authentics 500 Lifestyle 1ffaab original 1692268829

The JBL Authentics lineup also employs technologies like Spatial audio to provide a true sense of immersion. The inclusion of this technology isn’t something new for JBL as the company has been producing products like the JBL BAR which employs the same technology to deliver 3D soundscapes. The expertise is put to good use across the JBL Authentics line with the Authentics 200, Authentics 300, and the Authentics 500. The Authentics 500, in particular, leverages Dolby Atmos encoding and HARMAN’s patented Constant Sound Field technology. This combination expands the sound stage, enveloping your room in a rich auditory experience.

Three Models for Any User to Choose From

The JBL Authentics 300, designed for both indoor and outdoor use, boasts impressive audio specs. It features a pair of one-inch tweeters, a full-range 5.25-inch woofer, and a 6.5-inch downward-firing passive bass radiator. This configuration promises a slightly bass-forward sound profile with clear mids and highs.

  • 497034 JBL AUTHENTICS 300 a6e819 original 1692267256
  • 497035 JBL AUTHENTICS 500 4263fd original 1692267257
  • 497033 JBL AUTHENTICS 200 a6e1e4 original 1692267250

For those seeking even more power, the Authentics 500 is a 270W beast with three 1-inch tweeters, three 2.75-inch midrange woofers, and a 6.5-inch downward-firing subwoofer. It also supports Dolby Atmos for a 3D audio experience that will transport you into the heart of your entertainment. The JBL Authentics 200 rounds up the trio with an assembly of entry-level specifications with a similar configuration to the 300: two one-inch tweeters, a full-range five-inch woofer, and a six-inch passive radiator.

A Symphony of Voice Assistants

What sets the JBL Authentics range apart is its ability to simultaneously access and operate both Google Assistant and Amazon Alexa. Unlike some speakers that require you to choose one assistant over the other, JBL’s innovation allows for a seamless interplay between the two. Imagine setting a timer with Google Assistant and having Amazon Alexa stop it – these speakers make it possible.

This dual functionality extends to music playback as well. You can start a song with one voice assistant and pause it with the other, eliminating the need to remember which assistant initiated the action. It’s a game-changer for households with multiple smart devices and users who prefer different voice assistants.

497044 JBL Authentics 300 Lifestyle e5304c original 1692268828

With these voice giants at your command, you can effortlessly control music, smart home devices, set timers, and more, hands-free. The flexibility to choose between Google Assistant and Alexa for different tasks empowers users like never before.

Designed to Bring Vintage to the Future

Vintage design has gained immense popularity, with 64% of survey respondents valuing design in their audio devices. Authentics marries the best of the past and present, drawing inspiration from the iconic JBL L-100 home speakers of the 1970s. Vintage echoes blend seamlessly with modern materials, colours, and textures, creating a unique design that captivates.

Sustainability is also at the core of Authentics, with recycled aluminium cabinets and handles, along with internal parts crafted from recycled plastic.

Pricing & Availability

The JBL Authentics speakers will be available in Europe on September 15 and North America on September 17.

  • JBL Authentics 200 – USD$329.99 (MYR1,629.23)
  • JBL Authentics 300 – USD$429.99 (MYR2,001.64)
  • JBL Authentics 500 – USD$699.99 (MYR3,258.48)

For those willing to take the plunge, Whether you’re after stunning sound quality, seamless voice assistant integration, or a fusion of vintage and modern design, the JBL Authentics range promises to deliver an authentic and immersive audio experience.

[IFA 2023] Signify Introduces Philips Hue Secure & Matter Connectivity to Portfolio

Signify has unveiled a security tech suite under its Philips Hue brand. While maintaining a focus on lighting innovation, Philips Hue now integrates smart cameras, sensors, and app-controlled security features.

Keep Watch with Philips Hue Secure Cameras

The Philips Hue Secure camera lineup offers both wired and battery-powered options, ensuring versatile home monitoring. These cameras provide a clear 1080p HD video feed with night vision capabilities for real-time surveillance, both indoors and outdoors. Instant motion notifications keep you informed about any activity around your home.

Unique to Philips Hue Secure is its integration of smart lighting and sound alarms. In response to detected motion, these cameras can trigger a combination of light and sound alarms to deter intruders. Additionally, two-way communication allows you to interact with visitors or delivery personnel remotely.

Screenshot 2023 09 04 at 19 03 30 Hue Secure wired camera Philips Hue US 1

Security and privacy are paramount. Philips Hue Secure cameras feature end-to-end encryption by default. All video clips, snapshots, and live feeds remain private, ensuring your data’s protection. Notably, the cameras perform person, pet, or package recognition locally, preserving your privacy without relying on cloud processing.

Versatile Options for Indoor and Outdoor Use

Philips Hue Secure offers flexibility with both wired and battery-powered camera versions, available in black or white. The Secure-wired camera comes with a desktop stand for easy placement, while the battery-powered option provides the freedom to position cameras anywhere. For outdoor surveillance, a camera mount with a ground spike is available.

Enhanced Security with Contact Sensors & Philips Hue App

Complementing the camera system is the Philips Hue Secure contact sensor, compatible with doors, windows, cabinets, and more. These sensors send real-time notifications when opened or closed. Use them to automate your lights when doors are opened, enhancing security and convenience.

The Philips Hue app will also come with features of a Security Center for comprehensive control of your smart home security system. Receive notifications, trigger light and sound alarms, or contact local authorities directly from the app. You can also personalize camera settings, create blackout zones for privacy, and set activity zones to avoid unnecessary notifications.

Subscription Plans for Added Features

Philips Hue Secure offers two subscription plans for enhanced functionality. The Basic plan, priced at $3.99 per month or $39.99 per year per camera, provides 30 days of video history. The Plus plan, priced at $9.99 per month or $99.99 per year for multiple cameras, offers 60 days of video history and additional features.

New Lighting Innovations

9af5a4e44f9c40d4810db01a0093a44d

Philips Hue continues its commitment to lighting innovation with new products:

  • Philips Hue Festavia String Lights: Suitable for both indoor and outdoor use, these string lights offer a cosy ambience with customizable colours. Available in three cord lengths and featuring new light effects.
  • Philips Hue MR16 Smart Bulb: Bring smart lighting to conventional spotlights with this 12V smart bulb, compatible with most transformers.
  • Perifo Track Lighting and Hue Centris Indoor Spotlight: Explore new lighting possibilities with these additions to the Philips Hue lineup.

Interoperability with Matter Standard

An upcoming software update to the Philips Hue Bridge, set to launch in September 2023, will enable compatibility with the Matter standard. This update ensures seamless integration with other Matter-compatible smart home devices and apps.

Pricing & Availability

ProductPrice (EUR)Price (USD)
Philips Hue Secure Wired CameraEUR 199.99USD 199.99
Philips Hue Secure Wired Camera with Desktop StandEUR 229.99USD 229.99
Philips Hue Secure battery cameraEUR 249.99USD 249.99
Philips Hue Secure floodlight cameraEUR 349.99USD 349.99
Philips Hue Secure contact sensorEUR 39.99 (1-pack)
EUR 69.99 (2-pack)
USD 39.99 (1-pack)
USD 69.99 (2-pack)
Philips Hue Secure camera mount with ground spikeEUR 39.99USD 39.99
Philips Hue Secure desktop standEUR 49.99USD 49.99
Philips Hue Secure low-voltage outdoor charging cableEUR 29.99USD 29.99
Philips Hue Secure anti-drop cableEUR 14.99USD 14.99
Philips Hue Festavia string lights (100LEDs)EUR 119.99USD 119.99
Philips Hue Festavia string lights (250LEDs)EUR 219.99USD 219.99
Philips Hue Festavia string lights (500LEDs)EUR 359.99USD 99.99 (2-pack White and color ambience)
Philips Hue MR16 White ambianceEUR 64.99 (1-pack White and colour ambience)
EUR 109.99 (2-pack White and colour ambience)
N/A
Philips Hue MR16 White and Color AmbianceEUR 64.99 (1-pack White and colour ambience)
EUR 109.99 (2-pack White and colour ambience)
USD 99.99 (2-pack White and colour ambience)