Trip.com Group and Qatar Tourism Sign a Memorandum of Understanding to Promote Qatar as Leading Family-Friendly Tourism Destination


  • Qatar Tourism and Trip.com Group – one of the world’s leading travel service providers – sign Memorandum of Understanding to promote Qatar as the Middle East’s leading choice for family-friendly tourism
  • Partnership will see campaigns focused on China and India markets, as well as global campaigns
  • Latest agreement forms part of Qatar’s long-term goal to welcome six million visitors a year by 2030

SINGAPORE, Nov. 16, 2022 /PRNewswire/ — Qatar Tourism (QT) and online travel service providers, Trip.com Group, signed a Memorandum of Understanding to promote Qatar across the globe as an ideal choice for family-friendly tourism.


The one-year agreement will see Qatar extensively promoted through a series of marketing campaigns, across Trip.com Group’s world-leading brands and associated assets, which include Ctrip.com (China), Trip.com (global), MakeMyTrip.com (India), and Skyscanner.com (global).

Commenting on the new partnership, the Chairman of Qatar Tourism and Qatar Airways Group Chief Executive, His Excellency Mr. Akbar Al Baker, said: “We believe that this new partnership with Trip.com Group will further promote Qatar as the Middle East’s ultimate destination choice for families, through their expansive network of globally recognised travel brands. From Qatar’s thrilling theme parks to adventures in the soaring desert dunescapes, and cultural districts with the ultimate shopping and dining experiences, a trip to Qatar offers something for the whole family.”

Commenting on the new partnership, Chairman and Co-Founder of Trip.com Group, James Liang, said: “I’m excited to strengthen cooperation through this new strategic partnership and bring awareness to a charming destination where tradition meets modernity. This month, the football World Cup will arrive, offering tourists a family-friendly atmosphere to explore and understand this unique destination. To sustain awareness and momentum for Qatar, Trip.com Group will utilise its strong brands and compelling content marketing capabilities to deliver a strong competitive advantage to the destination.”

About Trip.com Group

Trip.com Group is a leading global travel service provider comprising of Trip.com, Ctrip, Skyscanner, Qunar and TrainPal. Across its platforms, Trip.com Group helps travellers around the world make informed and cost-effective bookings for travel products and services and enables partners to connect their offerings with users through the aggregation of comprehensive travel-related content and resources, and an advanced transaction platform consisting of apps, websites and 24/7 customer service centres. Founded in 1999 and listed on NASDAQ in 2003 and HKEX in 2021, Trip.com Group has become one of the best-known travel groups in the world, with the mission “to pursue the perfect trip for a better world”. Find out more about Trip.com Group here: group.trip.com

Follow us on: Twitter, Facebook, LinkedIn, and YouTube.

About Qatar Tourism

Qatar Tourism’s mission is to establish Qatar as a place where cultural authenticity meets modernity, and where people of the world come together to experience unique offerings in culture, sports, business and family entertainment, rooted in Service Excellence. Qatar Tourism will regulate and develop the tourism industry, encouraging investment from the private sector. It will set the national strategy for the tourism sector, reviewing it periodically and overseeing its implementation, with the aim of diversifying tourism offerings in the country and increasing visitor spend. Through our network of international offices in priority markets, and cutting-edge digital platforms, Qatar Tourism is expanding Qatar’s presence globally and enhancing the tourism sector.  

Web: www.visitqatar.qa

CCTV+: China-Africa Media Cooperation under the concept of “Sincerity, Real Results, Amity and Good Faith”

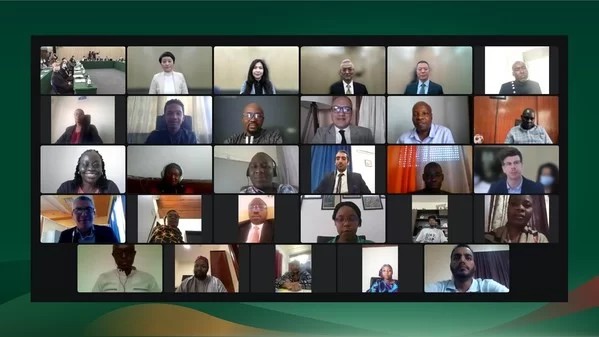
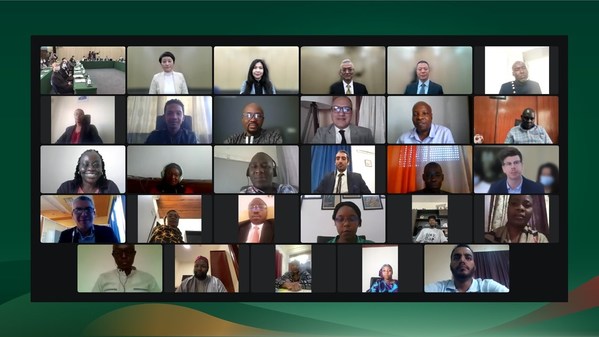
BEIJING, Nov. 16, 2022 /PRNewswire/ — The 6th Africa Link Union (ALU) Annual Meeting was held in Beijing on Monday, gathering 26 media representatives from 19 countries and regions to help strengthen media cooperation between China and Africa.

A group photo of media representatives.

Hosted by the CCTV Video News Agency (CCTV+), participants shared their views on how to deepen collaboration under the theme of “Sincerity, Real Results, Amity and Good Faith, Strengthening China-Africa Media Cooperation”.

In his opening address, Mr. Teng Yunping, president of CCTV+, gave a warm welcome to attendees from across the African continent and said ChinaAfrica media cooperation has played an essential role in furthering relations between the two sides.

“The working mechanism of the ALU has brought us closer and closer, and has also built a bridge for people-to-people connections in terms of media communications between China and Africa,” said Teng, adding that the ALU has made positive contributions to the comprehensive development of ChinaAfrica relations.

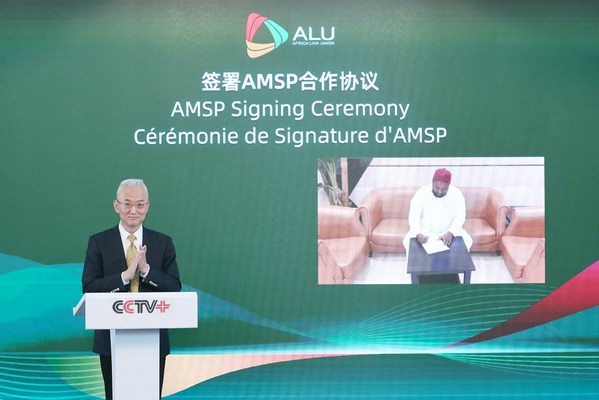
The meeting also saw the signing of the Cooperation Agreement on AMSP (All Media Service Platform) between Teng Yunping, CCTV+ president, and Ousman Abdelmoumine Bechir, CEO of Tchad 24.

Mr. Teng Yunping signed the Cooperation Agreement on AMSP with the CEO of Tchad 24.

Ms. Song Jianing, Deputy Director of the China Global Television Network (CGTN), said: “For better aggregating the news content of the world’s main media and creating effective in-depth diversified international cooperative media in the long-term, CGTN is willing to provide African media partners with more media public products in the future, and to conduct closer exchanges and cooperation.”

“CCTV plus has become a significant source of news content for our station,” said Ms. Susan Ng‘ong’a, Chief Executive Officer of Kenyan broadcaster Switch TV.

“Switch media looks to further build alliances within the African Link Union through creating a world class product of professional news content and strengthening the partnership for years to come,” she said.

“Thanks to the China Media Group, CGTN, CCTV+ for the collaboration. We have learned from you, we have adapted to new working methods such as the AMSP platform for example,” said Mr. Martin Ngningaye, Chief Executive Officer of Afrique Média from Cameroon. He said the exchanges of audiovisual content have allowed audiences to discover the truth about China and learn more about the splendor, cultural diversity and tourism sites in the respective countries, and especially to realize the neutrality and rigor in the processing of information.

Media representatives also shared their opinions on covering significant international events and their future plans for Chinese and African media cooperation after the 20th National Congress of the Communist Party of China (CPC), as well as further development of the ALU at the meeting.

The event also saw the winners of the ALU News Awards from 2021 to 2022 being announced, honoring members that have made outstanding contributions to the development of the cooperation platform over the past year.

The ALU was initiated by CCTV+ and media organizations across Africa in 2016, aiming to promote media cooperation and exchanges between China and Africa.

Microsoft surfaces pre-orders for Surface Pro 9 and Laptop 5

Microsoft is ushering in the “new era of computing” for Windows PC by unveiling the latest iterations of Surface devices.

image 13
image 14
The Surface Pro 9, available for pre-order Nov 8th in, new Sapphire (top) and Forest (bottom) colors.

Surface Pro 9 with Intel and SQ®3 platform choice, two new colors and pre-order goodies

From 8th November to 28th November 2022, the Surface Pro 9 will be available for pre-order in Malaysia. Microsoft has also announced two new color variants, Sapphire and Forest, for more variety. To sweeten the deal, a Surface Pro Signature keyboard and other free gifts (worth up to RM1288) will be given along with every pre-order. Every purchase of the Surface Pro 9, pre-order or otherwise, will receive a one-month subscription to Microsoft 365.

The Surface Pro 9 now comes with two platform choices. There is the Intel Evo platform powered by the 12th Gen Intel® Core processor with Thunderbolt™ 4. The other is the Microsoft SQ®3 platform powered by Qualcomm Snapdragon with 5G connectivity, exclusive for Surface for Business users.

Both Intel and Qualcomm variants of the Surface Pro 9 will share the same build quality and core features. This includes the 13.3-inch PixelSense Display with up to 120Hz refresh rate and Microsoft’s custom G6 chip that enhances the inking experience with tactile feedback. The Surface Pro 9 comes with options of Intel i5, i7 or SQ®3 processors, 8GB or 16GB of RAM and 128GB, 256GB and 512GB of storage, with prices starting at RM5299.

New line of Surface Laptop 5 now with Thunderbolt 4 and more pre-order goodies

image 15
Microsoft Surface Laptop 5 now with Thunderbolt™ 4

Microsoft also unveiled the new range of Surface Laptop 5, available for pre-order from 8th November 2022 in Malaysia. All pre-orders will receive a free Microsoft Arc Mouse and other free gifts (worth up to RM998). All purchases of the Surface Laptop 5 will receive a a one-month subscription to Microsoft 365 as well.

With prices starting from RM5299, the Surface Laptop 5 comes in 13.5-inch and 15-inch variants. Variants have options of 12th Gen Intel i5 and i7 processors, 8GB or 16GB of RAM and 128GB, 256GB or 512GB of SSD storage. All Surface Laptop 5 comes with the signature 3:2 PixelSense display and now with Thunderbolt™ 4 to further boost productivity.

How to pre-order?

Pre-orders for the Surface Pro 9 and Laptop 5 are available in Malaysia starting 8th November 2022. Visit commercial authorized reseller Maxis and authorized retailers including All ITGloo by SNS NetworkHarvey Norman, Lazada Flagship StorePC ImageSenheng, Shopee Authorised Store and TMT by Thundermatch.

The ASUS TUF Gaming Radeon RX 7900 and Radeon RX 7900 XTX Are Here!

AMD’s RDNA 3 GPU architecture has just launched less than two weeks ago. While details are still quite scarce, the new GPUs launched in their livestream looked promising. There was not to say plenty in terms of variety in their launch too.

They launched two flagship class GPUs within the Radeon family. You can say hello to AMD’s Radeon RX 7900 and RX 7900 XTX. In their launch, they say that their flagship RX 7900 XTX performs at least 15% better than the older RX 6950 XT in games. Thanks to RDNA 3 technology, which is also an evolution from RDNA 2, AMD’s latest GPUs can maintain and even lower the GPUs’ power consumption while delivering the same amount of processing power. At the same time, AMD has upgraded its encoders to ensure that the new GPUs can work with videos and rendering much better than the RX 6000 series Radeon GPUs.

Of course, you do not only have to buy the GPU directly from AMD. You can get your hands on AMD’s Radeon RX 7900 XT and RX 7900 XTX from AMD’s board partners like ASUS and their new TUF Gaming line up of AMD GPUs. Welcome to the TUF Gaming Radeon RX 7000 series GPUs.

The basic construction and design of ASUS’ TUF Gaming GPUs are not completely different from AMD Radeon’s original design. Like AMD’s reference GPU, the ASUS TUF Gaming Radeon RX 7900 XT has the same 20GB of GDDR6 RAM. If you want something more cutting edge, the Radeon RX 7900 XTX offers 24GB in GDDR6 RAM.

TUF Gaming Radeon RX 7900 XTX

TUF Gaming Radeon RX 7900 XTX RX 7900 XT Gr
Source: ASUS

It is a big card, this one. In its entirety, the GPU takes up to 3.63 slots within your desktop PC. All that cooling is required to keep the 6,144 stream processors with 384-bt memory interface. But this much weight is never good on a PCB. That is why ASUS built the GPU with a die-cast frame holding a solid aluminium backplate and shroud to ensure that the weight does not stress the PCB out too much. For even more security, there is a GPU stand that is included when you buy the Radeon RX 7900 XTX.

The large structure houses a combination of large heatsinks and fan designs that allows for up to 13.8% more airflow and up to 8% more static pressure over TUF Gaming’s last generation AMD Radeon flagship card even at lower fan speeds allowing for a quieter card despite its power. You can also choose between two BIOS presets for either a quieter experience or more powerful performance mode.

The new RDNA 3 GPU packs an HDMI 2.1 port for up to 8K 165Hz display connections. You will not get that kind of graphics for most AAA games played on the GPU though, even if you can find a display to match that. Still, it is nice to know that you are futureproofed. You also get three DisplayPort 2.1, which is technically even better than HDMI 2.1 currently. Unlike NVIDIA’s latest and greatest, the AMD GPU still needs three 8-pin connectors from your PSU to work.

TUF Gaming Radeon RX 7900 XT

TUF Gaming Radeon RX 7900 XTX RX 7900 XT Gr 2
Source: ASUS

The new high-end AMD GPU packs just a little under 800 stream processors at 5,379. It is still anything but a slouch though. It is paired with 20GB of GDDR6 RAM and 320-bit memory interface, which is still a plenty and rather fast.

The Radeon RX 7900 XT also features a 3.63-slot design that houses plenty of cooling capabilities while remaining quiet. At the same power draw, the GPU runs faster, cooler, and quieter than the older Radeon RX 6900 GPU. That also means that if you truly want to overclock the GPU, you have even more headroom than before.

Price and Availability

While ASUS has announced and unveiled the new AMD GPUs, there are no official dates teased by the board makers. There is also currently no official pricing from them just yet. We are expecting them to be available sometime soon after the AMD Radeon RX 7900 XT and Radeon RX 7900 XTX reference GPUs arrive in Malaysian shores. You can expect prices to be higher than the reference cards too thanks to the beefier cooling solution that the TUF Gaming variants offer. More on the new AMD Radeon GPUs from ASUS can be found on their website.

CGTN: China and UAE collaboration for a shared future

BEIJING, Nov. 15, 2022 /PRNewswire/ — China and the United Arab Emirates’ diplomatic ties are nearing four decades, but their economic and cultural ties go back far deeper, in the times of the ancient Silk Road. Stationing in Beijing since 2017, Ali Al Dhaheri, the UAE’s Ambassador to China, has extensive insights into China’s development.

H.E. Dhaheri speaks highly of remarkable achievements China made in the past decade in improving people’s livelihood and maintaining long-range economic growth. Today, China has become a powerhouse for global growth and a hub for technological innovation. In his opinion, China’s success is unprecedented and a testament of CPC’s firm leadership.

According to H.E. Dhaheri, China’s enormous and positive changes are not only taking place in cities but also villages. In his trip to Malipo county, Yunnan Province, he saw singing and dancing villagers live in happiness and satisfaction. This experience left him deep understanding of China’s approach of poverty alleviation which he believes is a model for other developing countries to emulate. In addition, he believes that as China is laying out an ambitious blueprint for future transformation with its Fourteenth Five-Year Plan, the country’s high quality development will be truly historic with positive repercussions throughout the world.

H.E. Dhaheri says, as Comprehensive Strategic Partners, the UAE and China share similar development paths, concepts, and goals. And their partnership has many milestones. One is healthcare, especially manufacturing a new vaccine in the UAE in collaboration. This partnership can therefore serve as a model for developing countries to explore paths to modernization.

China is the UAE’s largest trading partner, and the UAE is China’s largest non-oil trading partner in the Middle East and North Africa. The latter is also among the first countries to join the Belt and Road Initiative, reviving the ancient Silk Road ties. The two countries benefit from strong mutual trust, multilateralism, and international collaboration.

H.E. Dhaheri stresses that countries around the world should remain committed to a shared vision of commonality, comprehensiveness, and cooperation. He expects more cooperation between the UAE and China in the future, and he himself, is delighted to be a bridge builder between the two countries and the two peoples.

https://news.cgtn.com/news/2022-11-13/China-and-UAE-collaboration-for-a-shared-future-1eVyS6nqMk8/index.html

Google Launches Google Wallet in Malaysia

eWallets and digital payments have become a norm nowadays. We’re paying for things using apps and smartphones with increasing frequency; even things like boarding passes and tickets are increasingly digital. Wouldn’t it be nice if all these items were stored in a single app or platform? That’s exactly what Google is offering with their Google Wallet app.

Google Wallet was announced at Google I/O 2022 back in May. While you may be wondering – didn’t Google Wallet already exist? The simple answer is yes. However,, Google has reworked the platform from the ground up to support more than digital wallets. The app now houses not only your credit and debit cards, it can support loyalty cards and even your boarding passes for travel.

Google Wallet GIF EN Landscape

The best part? Google Wallet is now available in Malaysia. Users in Malaysia will be able to add their credit cards from CIMB, Hong Leong Bank, Hong Leong Islamic Bank, and Public Bank o Google Wallet. HSBC and HSBC Amanah will be joining the fray soon with their credit card offerings. The same can be done with a majority of debit cards as well. These cards can then be used to pay for online purchases on platforms like Shopee with a single click. In addition, users will be able to add their boarding passes for AirAsia flights at launch with Malaysia Airlines to follow suit.

Adding items like credit cards and debit cards to Google Wallet is simple. If you already have eligible cards attached to your Google account, these cards will be automatically imported to Google Wallet. Users will just need to enable contactless payment for these card on the app. Otherwise, all you have to do is click the “add card” option and follow the steps on screen after which the card will be added and tokenized for use. Cards attached to Google Wallet will be verified by the issuing bank before it can be used on the app.

  • 06 TNP UI1
  • 06 TNP UI
  • 09 Boarding pass detail view
  • 01 Home Screen1
  • 01 Home Screen
  • 04 Contextual notif flight delay1
  • 04 Contextual notif flight delay
  • 05 alt 1P integrations Transaction details1
  • 05 alt 1P integrations Transaction details

Adding your flight boarding passes is equally as easy. With the airasia SuperApp, it’s as simple as clicking the “add to Google Wallet” option when you book tickets on the app. When you do, you’ll be able to see your ticket in Google Wallet.

Transactions done on Google Wallet are secured using industry standard tokenization. This means that every transaction done with a card on Google Wallet will be completed by a unique, device specific alternate card number which is associated with a dynamic security code that changes with each transaction.

This works on top of Android’s native security features such as its lock screen passcode and biometric verification. Using these features, you will be able to prevent unauthorised access. If you lose or misplace your android phone, you will be able to remotely lock or wipe it from Find My Device.

Users in Malaysia can download Google Wallet from the Google Play Store today.

Compatible Cards are listed below:

BankDebit CardCredit Card
CIMBN/AMastercard
Hong Leong BankMastercardVisa
Hong Leong Islamic BankMastercardN/A
Public BankVisaVisa
HSBC*N/AMastercard
HSBC Amanah*N/AVisa & Mastercards
*coming soon

ENTREPRENEUR UNIVERSE BRIGHT GROUP Announces 2022 Q3 Financial Results

XI’AN, China, Nov. 15, 2022 /PRNewswire/ — ENTREPRENEUR UNIVERSE BRIGHT GROUP (“EUBG” or the “Company”) (OTCBB: EUBG), a digital marketing consulting company, today announced its unaudited financial results for the third quarter ended September 30, 2022.

Mr. Guolin Tao, CEO of Entrepreneur Universe Bright Group commented, “During the third quarter, our business and operations continued to be materially and negatively impacted by the COVID-19 situation in China. The decrease of our business was mainly due to the drop of our consultancy services income, generated from clients who engaged in online courses business. These end customers became more patient and cautious in choosing online courses. We are continuing to seek out different business opportunities to stabilize our income streams.”

“As of September 30, 2022, the COVID-19 pandemic situation in China continues to be dynamic, and near-term challenges across the economy remain. Substantially all of our revenues and operations are concentrated in China and demand for our consulting services by small and medium-sized enterprises were adversely affected due to widespread economic disruptions during the COVID-19 outbreak. Specifically, as a result of government mandated closures of non-essential business in China, many of our customers’ business were suspended while others permanently closed their businesses,” Mr. Tao added.

Third Quarter 2022 Unaudited Financial Results

Three months ended
September 30,

2022

2021

Revenue

$

801,784

$

1,622,471

Cost of revenue

(140,009)

(870,967)

Gross profit

661,775

751,504

Selling expenses

(10,043)

(54,921)

General and administrative expenses

(423,931)

(326,090)

Total other (expenses) income, net

(124,016)

38,847

Income before income tax

103,785

409,340

Income tax expense

(135,784)

(201,789)

Net (loss) income

$

(31,999)

$

207,551

  • Revenue decreased by 50.6% to $801,784 due to the decrease our consultancy services and sourcing and marketing services income
  • Gross profit decreased by 11.9% to $661,775
  • Net income decreased by $239,550 to a net loss of $31,999

Revenue and cost of revenue: During the three months ended September 30, 2022, we generated revenue of $801,784 compared to $1,622,471 for the three months ended September 30, 2021, representing a decrease of $820,687 or 50.6% as compared with the prior period.

Cost of revenue was $140,009 for the three months ended September 30, 2022 compared to $870,967 for the three months ended September 30, 2021. The decrease of cost of revenue for the three months ended September 30, 2022 was mainly due to our senior management no longer directly involved in performing the services but focused on management work. Therefore, less direct senior management costs were incurred in the consultancy services and souring and marketing service.

Gross profit: We generated a gross profit of $661,775 and $751,504 for the three months ended September 30, 2022 and 2021, respectively.

Net (loss) income: As a result of the above, we resulted a net loss of $31,999 and generated a net income of $207,551 for the three months ended September 30, 2022 and 2021, respectively.

Cash and cash equivalents. As of September 30, 2022 and December 31, 2021, $6,330,431 and $7,649,129 of the Company’s cash and cash equivalents, respectively were held at financial institutions and online payment platforms located in the PRC and Hong Kong that management believes to be of high credit quality.

Nine months ended September 30, 2022 Financial Results

Nine months ended
September 30,

2022

2021

Revenue

$

2,851,656

$

4,479,415

Cost of revenue

(565,820)

(1,289,739)

Gross profit

2,285,836

3,189,676

Selling expenses

(34,957)

(224,935)

General and administrative expenses

(1,066,604)

(905,391)

Total other income, net

35,905

108,941

Income before income tax

1,220,180

2,168,291

Income tax expense

(595,156)

(872,063)

Net income

$

625,024

$

1,296,228

  • Revenue decreased by 36.3% to $2,851,656 due to the decrease in our consultancy services income
  • Gross profit decreased by 28.3% to $2,285,836
  • Net income decreased by $671,204 to $625,024

Revenue and cost of revenue: During the nine months ended September 30, 2022, we generated revenue of $2,851,656 compared to $4,479,415 for the nine months ended September 30, 2021, representing a decrease of $1,627,759 or 36.3% as compared with the prior period. The decrease was mainly due to our consultancy services income, generated from clients who engaged in online courses business, dropped by $2,405,874 as compared with last period.

During the nine months ended September 30, 2022, we generated $267,874 from our new digital training related services and $911,733 from our consultancy services to a customer who engaged in live streaming business. However, these new income streams only compensated a part of the revenue reduction in current period. The digital training related services with Jade Bird remain suspended as of today. Therefore, we expected the new revenue will not be available to compensate the revenue reduction until further notice.

Cost of revenue was $565,820 for the nine months ended September 30, 2022 compared to $1,289,739 for the nine months ended September 30, 2021. For the nine months ended September 30, 2022, the cost of revenue mainly represented the staff costs for our consulting services and the agency fees for our digital training related services.

Gross profit: We generated a gross profit of $2,285,836 and $3,189,676 for the nine months ended September 30, 2022 and 2021, respectively. 

Net income: As a result of the above, we generated a net income of $625,024 and $1,296,228 for the nine months ended September 30, 2022 and 2021, respectively.

About ENTREPRENEUR UNIVERSE BRIGHT GROUP

ENTREPRENEUR UNIVERSE BRIGHT GROUP is a digital marketing consultation company with its main operation in China, providing marketing consulting services to Chinese start-up companies. The company provides consulting services, sourcing and marketing services in China through its PRC subsidiary with support from its HK subsidiary. Its PRC subsidiary provides services aimed at connecting businesses with e-commerce platforms.  The integrated service platform focuses on strategic marketing and consulting. The company’s mission is to help start-up companies and small-size companies and guide these companies’ founders in utilizing the company’s digital marketing consulting plan to reach their business goals. For more information about the Company, please visit: http://www.eubggroup.com/

Safe Harbor Statement

This press release contains forward-looking statements as defined by the Private Securities Litigation Reform Act of 1995. Forward-looking statements include statements concerning plans, objectives, goals, strategies, future events or performance, and underlying assumptions and other statements that are other than statements of historical facts. When the Company uses words such as “may, “will, “intend,” “should,” “believe,” “expect,” “anticipate,” “project,” “estimate” or similar expressions that do not relate solely to historical matters, it is making forward-looking statements.  Specifically, the Company’s statements regarding trading on the OTCBB market and closing the initial public offering are forward-looking statements.  Forward-looking statements are not guarantees of future performance and involve risks and uncertainties that may cause the actual results to differ materially from the Company’s expectations discussed in the forward-looking statements. These statements are subject to uncertainties and risks including, but not limited to, the following:  the Company’s goals and strategies; the Company’s future business development; financial condition and results of operations; product and service demand and acceptance; reputation and brand; the impact of competition and pricing; changes in technology; government regulations; fluctuations in general economic and business conditions in China and assumptions underlying or related to any of the foregoing and other risks contained in reports filed by the Company with the SEC.  For these reasons, among others, investors are cautioned not to place undue reliance upon any forward-looking statements in this press release. Additional factors are discussed in the Company’s filings with the SEC, which are available for review at www.sec.gov. The Company undertakes no obligation to publicly revise these forward–looking statements to reflect events or circumstances that arise after the date hereof.

For more information, please contact:

The Company:

Jianyong Li
Email: lijianyong@eubggroup.com
Phone: +86-(029) 86100263

Investor Relations:

Hana Yin
EverGreen Consulting Inc.
Email: IR@changqingconsulting.com
Phone: +1-949-416-8888 (from U.S.)
+86 185-0119-2929 (from China)

ENTREPRENEUR UNIVERSE BRIGHT GROUP

CONDENSED CONSOLIDATED BALANCE SHEETS

(UNAUDITED)

(In U.S. dollars except for number of shares)

September 30,
2022

December 31,
2021

ASSETS

CURRENT ASSETS

Cash and cash equivalents

$

6,330,431

$

7,649,129

Accounts receivable

287,436

67,940

Loan and interest receivables

983,699

Other receivables and prepayments

41,068

55,925

Total current assets

7,642,634

7,772,994

NON-CURRENT ASSETS

Plant and equipment, net

202,431

281,448

Operating lease right-of-use assets, net

93,387

146,698

Total non-current assets

295,818

428,146

TOTAL ASSETS

$

7,938,452

$

8,201,140

LIABILITIES AND STOCKHOLDERS’ EQUITY

CURRENT LIABILITIES

Accounts payable

$

$

115,833

Other payables and accrued liabilities

225,119

402,158

Contract liabilities

216,142

Receipt in advance

5,161

Operating lease liabilities, current

51,119

59,370

Tax payables

133,931

39,545

Amount due to a director

167,935

171,443

Total current liabilities

578,104

1,009,652

NON-CURRENT LIABILITY

Deferred tax liabilities

297,200

342,546

Operating lease liabilities, non-current

42,269

87,328

Total non-current liabilities

339,469

429,874

TOTAL LIABILITIES

917,573

1,439,526

COMMITMENTS AND CONTINGENCIES

STOCKHOLDERS’ EQUITY

Preferred stock, par value $0.0001 per share, 1,100,000 shares authorized, Nil (December 31, 2021: Nil)
shares issued and outstanding as of September 30, 2022 

Common stock, par value $0.0001 per share; 1,800,000,000 shares authorized, 1,701,181,423
(December 31, 2021: 1,701,181,423) shares issued and outstanding as of September 30, 2022

170,118

170,118

Additional paid-in capital

6,453,048

6,453,048

Statutory reserves

65,911

65,911

Retained earnings (accumulated deficit)

267,621

(357,403)

Accumulated other comprehensive income

64,181

429,940

Total stockholders’ equity

7,020,879

6,761,614

TOTAL LIABILITIES AND STOCKHOLDERS’ EQUITY

$

7,938,452

$

8,201,140

ENTREPRENEUR UNIVERSE BRIGHT GROUP

CONDENSED CONSOLIDATED STATEMENTS OF OPERATIONS AND COMPREHENSIVE INCOME

(UNAUDITED)

(In U.S. dollars except for number of shares)

For the three months ended
September 30,

For the nine months ended
September 30,

2022

2021

2022

2021

Revenue

801,784

1,622,471

$

2,851,656

$

4,479,415

Cost of revenue

(140,009

)

(870,967

)

(565,820

)

(1,289,739

)

Gross profit

661,775

751,504

2,285,836

3,189,676

Selling expenses

(10,043

)

(54,921

)

(34,957

)

(224,935

)

General and administrative expenses

(423,931

)

(326,090

)

(1,066,604

)

(905,391

)

Profit from operations

227,801

370,493

1,184,275

2,059,350

Other income (expenses):

Interest income

10,522

15,934

33,489

66,213

Exchange gain (loss)

(135,842

)

8,957

(107,920

)

(3,088

)

Sundry income

1,304

13,956

110,336

45,816

Total other income (expenses), net

(124,016

)

38,847

35,905

108,941

Income before income tax

103,785

409,340

1,220,180

2,168,291

Income tax expense

(135,784

)

(201,789

)

(595,156

)

(872,063

)

Net (loss) income

$

(31,999

)

207,551

$

625,024

$

1,296,228

Other comprehensive (loss) income

Foreign currency translation adjustment

(128,843

)

(2,946

)

(365,759

)

63,036

Total comprehensive (loss) income

$

(160,842

)

204,605

$

259,265

$

1,359,264

Net (loss) income per share – Basic and diluted

$

0.00

*

0.00

*

$

0.00

*

$

0.00

*

Weighted average number of common shares outstanding

– Basic and Diluted

1,701,181,423

1,701,181,423

1,701,181,423

1,701,181,423

*

Less than $0.01 per share

ENTREPRENEUR UNIVERSE BRIGHT GROUP

CONDENSED CONSOLIDATED STATEMENT OF CASH FLOWS

(UNAUDITED)

(In U.S. dollars)

Nine months ended
September 30,

2022

2021

Cash flows from operating activities

Net income

$

625,024

$

1,296,228

Adjustments to reconcile net income to cash used in operating activities:

Depreciation

62,516

62,222

Amortization of operating lease right-of-use assets

40,575

39,248

Deferred tax

(33,117)

(319,660)

Changes in operating assets and liabilities:

Other receivables and prepayments

11,128

(179,961)

Accounts receivable

(244,432)

95,800

Accounts payable

(111,527)

431,690

Other payables and accrued liabilities

(159,123)

(284,226)

Tax payables

106,699

(445,713)

Contract liabilities

(208,106)

4,158

Receipt in advance

(4,969)

(34,318)

Operating lease liabilities

(40,574)

(43,614)

Net cash generated from operating activities

44,094

621,854

Cash flows from investing activities

Purchase of property, plant and equipment

(9,746)

Acquisition of debt products

(2,781,482)

Redemption of debt products

5,872,017

Loan receivables to unrelated third parties

(1,060,394)

(499,554)

Loan to a related company

(123,621)

Repayment from a related company

312,401

Repayment from a unrelated third party

499,554

Net cash (used in) generated from investing activities

(1,070,140)

3,279,315

Cash flows from financing activities

Repayment of borrowings from a director

(3,490)

(128,751)

Advance from a director

67,882

Net cash used in financing activities

(3,490)

(60,869)

Effect of exchange rates on cash

(289,162)

37,171

Net (decrease) increase in cash and cash equivalents

(1,318,698)

3,877,471

Cash and cash equivalents at beginning of period

7,649,129

3,846,470

Cash and cash equivalents at end of period

$

6,330,431

$

7,723,941

Supplemental cash flow information

Cash paid during the period for:

Income taxes

$

369,878

$

1,115,659

Withholding tax paid

$

151,485

$

517,145

Cision View original content:https://www.prnewswire.com/news-releases/entrepreneur-universe-bright-group-announces-2022-q3-financial-results-301677368.html

CBAK Energy Reports Third Quarter 2022 Unaudited Financial Results

–Net Revenues up 504% year over year in the third quarter –

DALIAN, China, Nov. 14, 2022 /PRNewswire/ — CBAK Energy Technology, Inc. (NASDAQ: CBAT) (“CBAK Energy,” or the “Company”) a leading lithium-ion battery manufacturer and electric energy solution provider in China, today reported its unaudited financial results for the third quarter of 2022 ended September 30, 2022.

Third Quarter of 2022 Financial Highlights

  • Net revenues were $57.7 million, an increase of 504% from $9.6 million for the same period of 2021.
  • Gross profit was $3.5 million, representing an increase of 206%, for the three months ended September 30, 2022, from gross profit of $1.1 million for the same period of 2021.
  • Net loss attributable to shareholders of CBAK Energy (after deducting change in fair value of warrants) was narrowed to $0.9 million from $3.0 million for the same period of 2021, reduced by 68.6%.

Yunfei Li, Chairman and Chief Executive Officer of the Company, commented: “Our company managed to maintain a strong momentum in the growth of revenues in the third quarter of 2022. Our efforts to develop the electric vehicle (“EV”) & light electric vehicle(“LEV”) market have achieved noticeable progress. Our revenues contributed from the EV & LEV market in the third quarter grew by 413% compared to the same period in 2021. Our strategic partnership with JinPeng Group, one of China’s biggest LEV manufacturers, and its EV manufacturing unit, Jemmell, brings our battery products to an increasing number of electric vehicles. With our cooperation with more EV/LEV manufacturers, we anticipate to see our products be applied to more electric vehicles and revenues from this market segment grow at a faster pace.” 

Mr. Li continued: “We are also glad to see that there is an increasing global demand for green energy, which substantially boost our energy storage business. We believe that our clients with businesses all over the world will keep a strong demand for our battery products in the near future.” 

Xiangyu Pei, Interim Chief Financial Officer of the Company, noted: “In the first nine months of 2022, we managed to achieve a year-over-year increase of 681% in revenues to $194 million. During this period, revenues from our battery business grew by 168% to $66.6 million as compared to the same period of 2021, of which revenues from the LEV/EV sector have posted a strong increase of 341%. Given the strong demand for our battery products, we are very positive about our growth and development in the near term.”

Third Quarter of 2022 Business Highlights & Recent Developments

  • In August 2022, CBAK Energy announced a strategic partnership agreement with Welson Power, a China-based new energy company that has a broad sales network in India, to sell CBAK Energy’s model 32140 batteries in the Indian market.
  • In September 2022, CBAK Energy announced that it obtained a battery order worth of approximately EUR 28.4 million ($27.8 million) from a leading European provider of heating, cooling and renewable energy systems. This new order will bring the total order value that CBAK Energy has received from the Customer in 2022 to approximately EUR 59.6 million.

Third Quarter of 2022 Financial Results

Net revenues were $57.7 million, an increase of 504% from $9.6 million for the same period of 2021. This was driven mostly by strong sales of high-power lithium batteries as well as from sales of materials for use in manufacturing lithium battery, a new operating segment as a result of the acquisition of Zhejiang Hitrans Lithium Battery Technology Co., Ltd (“Hitrans”) in November 2021. The table below breaks down our net revenues by segment, and further breaks down the battery segment by end application and the materials segment by product type.

Net Revenues by End-product Applications
($ thousands)

2021

Third

Quarter

2022
Third

Quarter

% Change
YoY

Segment 1

High power lithium batteries used in:

    Uninterruptible supplies

$9,335

$24,680

164 %

    Light electric vehicles

227

1,146

404 %

    Electric vehicles

20

Trading of raw materials used in lithium batteries

9,562

25,846

170 %

Segment 2

Materials for use in manufacturing of lithium battery cell

 Precursor                                                      

     Cathode


20,681

11,195


31,876

Total

$9,562

$57,722

504 %

Cost of revenues was $54.3 million, an increase of 544% from $8.4 million for the same period of 2021. This was in line with the increased net revenues.

Gross profit was $3.5 million, representing an increase of 206% from $1.1 million in the same period of 2021. Gross Margin was 6%, a decrease of 6% from 12% in the same period of 2021. The decrease in gross profits was primarily due to the increase in raw material prices and the fact that our materials segment has a lower profit margin. 

Total operating expenses were $4.9 million, an increase of 14.8% from $4.3 million in the same period of 2021. Most of the increase in all expense categories was the revenue growth and was largely attributable to an increase in headcount as result of the acquisition of Hitrans and additional hires in our new facility in Nanjing.

  • Research and development expenses were $2.4 million, an increase of 31% from $1.8 million for the same period of 2021.
  • Sales and marketing expenses were $0.8 million, an increase of 64% from $0.5 million for the same period of 2021.
  • General and administrative expenses were $1.9 million, a decrease of 14% from $2.2 million for the same period of 2021. 
  • Recovery of doubtful accounts was $0.2 million, compared to $0.2 million for the same period of 2021.

Operating loss was $1.5 million, compared to $3.2 million for the same period of 2021, representing a decrease of 53.3%.

Finance income, net was $0.7 million, compared to $0.1 million for the same period of 2021, representing an increase of 433%.

Change in fair value of warrants was $0.9 million, compared to $23.0 million for the same period of 2021. The change in the fair value of the warrants liability is mainly due to share price movement.

Net loss attributable to shareholders of CBAK Energy was $290, compared to net income attributable to shareholders of CBAK Energy of $20.0 million for the same period of 2021.

Basic and diluted loss per share were both nil. In comparison, basic and diluted income per share for the same period of 2021 were both $0.23.

Conference Call

CBAK’s management will host an earnings conference call at 8:00 AM U.S. Eastern Time on Monday, November 14, 2022 (9:00 PM Beijing/Hong Kong Time on November 14, 2022).

For participants who wish to join our call online, please visit:
https://edge.media-server.com/mmc/p/jtk2vobi

Participants who plan to ask questions at the call will need to register at least 15 minutes prior to the scheduled call start time using the link provided below. Upon registration, participants will receive the conference call access information, including dial-in numbers, a personal pin and an email with detailed instructions.

Participant Online Registration: 
https://register.vevent.com/register/BI1d48d566e44b4cc3b22602d7960df36c

Once completing the registration, please dial-in at least 10 minutes before the scheduled start time of the conference call and enter the personal pin as instructed to connect to the call.

A replay of the conference call may be accessed within seven days after the conclusion of the live call at the following website:

https://edge.media-server.com/mmc/p/jtk2vobi

About CBAK Energy

CBAK Energy Technology, Inc. (NASDAQ: CBAT) is a leading high-tech enterprise in China engaged in the development, manufacturing, and sales of new energy high power lithium batteries and raw materials for use in manufacturing high power lithium batteries. The applications of the Company’s products and solutions include electric vehicles, light electric vehicles, electric tools, energy storage, uninterruptible power supply (UPS), and other high-power applications. In January 2006, CBAK Energy became the first lithium battery manufacturer in China listed on the Nasdaq Stock Market. CBAK Energy has multiple operating subsidiaries in Dalian, Nanjing and Shaoxing, as well as a large-scale R&D and production base in Dalian.

For more information, please visit www.cbak.com.cn.

Safe Harbor Statement

This press release contains “forward-looking statements” that involve substantial risks and uncertainties. All statements other than statements of historical facts contained in this press release, including statements regarding our future results of operations and financial position, strategy and plans, and our expectations for future operations, are forward-looking statements within the meaning of Section 27A of the Securities Act of 1933, as amended and Section 21E of the Securities Exchange Act of 1934, as amended. We have attempted to identify forward-looking statements by terminology including “anticipates,” “believes,” “can,” “continue,” “could,” “estimates,” “expects,” “intends,” “may,” “plans,” “potential,” “predicts,” “should,” or “will” or the negative of these terms or other comparable terminology. Our actual results may differ materially or perhaps significantly from those discussed herein, or implied by, these forward-looking statements.

Any forward-looking statements contained in this press release are only estimates or predictions of future events based on information currently available to our management and management’s current beliefs about the potential outcome of future events. Whether these future events will occur as management anticipates, whether we will achieve our business objectives, and whether our revenues, operating results, or financial condition will improve in future periods are subject to numerous risks.  There are a significant number of factors that could cause actual results to differ materially from statements made in this press release, including: significant legal and operational risks associated with having substantially all of our business operations in China, the Chinese government may exercise significant oversight and discretion over the conduct of our business and may intervene in or influence our operations at any time, which could result in a material change in our operations and/or the value of our securities or could significantly limit or completely hinder our ability to offer or continue to offer securities to investors and could cause the value of such securities to significantly decline or be worthless, trading in our securities may be prohibited under the Holding Foreign Companies Accountable Act if the PCAOB subsequently determines our audit work is performed by auditors that the PCAOB is unable to inspect or investigate completely for three consecutive years, the effects of the global Covid-19 pandemic, changes in domestic and foreign laws, regulations and taxes, uncertainties related to China’s legal system and economic, political and social events in China, the volatility of the securities markets; and other risks including, but not limited to, the ability of the Company to meet its contractual obligations, the uncertain market for the Company’s lithium battery cells and business, macroeconomic, technological, regulatory, or other factors affecting the profitability of our products and solutions that we discussed or referred to in the Company’s disclosure documents filed with the U.S. Securities and Exchange Commission (the “SEC”) available on the SEC’s website at www.sec.gov, including the Company’s most recent Annual Report on Form 10-K as well as in our other reports filed or furnished from time to time with the SEC. You should read these factors and the other cautionary statements made in this press release. If one or more of these factors materialize, or if any underlying assumptions prove incorrect, our actual results, performance or achievements may vary materially from any future results, performance or achievements expressed or implied by these forward-looking statements. The forward-looking statements included in this press release are made as of the date of this press release and the Company undertakes no obligation to publicly update or revise any forward-looking statements, other than as required by applicable law.

For investor and media inquiries, please contact:

CBAK Energy Technology, Inc.
Investor Relations Department
Mr. Thierry Jiewei Li
Phone: 86-18675423231
Email: ir@cbak.com.cn

CBAK Energy Technology, Inc. and Subsidiaries

Unaudited Condensed Consolidated Balance Sheets

(In $ except for number of shares)


December 31,

September 30,

2021

2022

Assets

Current assets

Cash and cash equivalents

$

7,357,875

4,045,329

Pledged deposits

18,996,749

37,591,281

Trade and bills receivable, net

49,907,129

21,902,180

Inventories

30,133,340

52,709,868

Prepayments and other receivables

12,746,990

5,457,532

Receivables from former subsidiary

2,263,955

6,341,988

Amount due from non-controlling interest, current

125,883

112,424

Amount due from related party

472,061

210,796

Income tax recoverable

47,189

56,251

Investment in sales-type lease, net

790,516

815,013

Total current assets

122,841,687

129,242,662

Property, plant and equipment, net

90,042,773

88,154,577

Construction in progress

27,343,092

15,839,191

Long-term investments, net

712,930

917,768

Prepaid land use right- non current

13,797,230

12,081,968

Intangible assets, net

1,961,739

1,383,789

Operating lease right-of-use assets, net

1,968,032

571,851

Investment in sales-type lease, net

838,528

317,279

Amount due from non-controlling interest, non-current

62,941

56,212

Deferred tax assets, net

1,403,813

1,175,624

Goodwill

1,645,232

1,470,904

Total assets

$

262,617,997

$

251,211,825

Liabilities

Current liabilities

Trade and bills payable

$

65,376,212

$

70,532,360

Short-term bank loans

8,811,820

17,573,866

Other short-term loans

4,679,122

3,482,583

Accrued expenses and other payables

22,963,700

19,602,212

Payables to former subsidiaries, net

326,507

368,772

Deferred government grants, current

3,834,481

1,613,838

Product warranty provisions

127,837

104,053

Operating lease liability, current

801,797

304,574

Finance lease liability, current

1,173,589

Warrants liability

5,846,000

1,147,000

Total current liabilities

112,767,476

115,902,847

Deferred government grants, non-current

6,189,196

5,809,485

Operating lease liability

876,323

120,101

Product warranty provision

1,900,429

1,776,912

Total liabilities

121,733,424

123,609,345

Commitments and contingencies

Shareholders’ equity

Common stock $0.001 par value; 500,000,000 authorized; 88,849,222
issued and 88,705,016 outstanding as of December 31, 2021, 89,135,064
issued and 88,990,858 outstanding as of September 30, 2022

88,849

89,135

Donated shares

14,101,689

14,101,689

Additional paid-in capital

241,946,362

243,053,288

Statutory reserves

1,230,511

1,230,511

Accumulated deficit

(122,498,259)

(121,248,906)

Accumulated other comprehensive income (loss)

2,489,017

(12,382,483)

137,358,169

124,843,234

Less: Treasury shares

(4,066,610)

(4,066,610)

Total shareholders’ equities

133,291,559

120,776,624

Non-controlling interests

7,593,014

6,825,856

Total of equities

140,884,573

127,602,480

Total liabilities and shareholders’ equity

262,617,997

251,211,825


CBAK Energy Technology, Inc. and Subsidiaries

Unaudited Condensed Consolidated Statements of Operations and Comprehensive Income (Loss)

(In $ except for number of shares)


Three months ended

Nine months ended

September 30,

September 30,

2021

2022

2021

2022

Net revenues

$

9,562,190

57,721,692

$

24,867,393

$

194,267,650

Cost of revenues

(8,430,808)

(54,261,244)

(20,798,931)

(179,955,540)

Gross profit

1,131,382

3,460,448

4,068,462

14,312,110

Operating expenses:

Research and development expenses

(1,815,756)

(2,385,591)

(3,344,817)

(7,998,181)

Sales and marketing expenses

(510,386)

(834,501)

(1,262,999)

(2,361,839)

General and administrative expenses

(2,158,183)

(1,866,055)

(5,823,560)

(6,556,944)

Recovery of (provision for) doubtful accounts

178,897

142,966

437,475

(68,651)

Total operating expenses

(4,305,428)

(4,943,181)

(9,993,901)

(16,985,615)

Operating loss

(3,174,046)

(1,482,733)

(5,925,439)

(2,673,505)

Finance income, net

129,340

687,345

174,442

71,869

Other income (expenses), net

69,970

(991,352)

1,619,194

(1,165,094)

Impairment of non-marketable equity securities

(43)

(690,585)

Change in fair value of warrants

22,998,000

936,000

57,174,000

4,699,000

Income (loss) before income tax

20,023,221

(850,740)

52,351,612

932,270

Income tax credit (expenses)

2,012

(84,230)

Net income (loss)

20,023,221

(848,728)

52,351,612

848,040

Less: Net (income) loss attributable to non-
     controlling interests

(3,487)

848,438

(21,995)

401,313

Net income (loss) attributable to
     shareholders of CBAK Energy Technology, Inc.

$

20,019,734

(290)

$

52,329,617

$

1,249,353

Other comprehensive income (loss)

Net income (loss)

20,023,221

(848,728)

52,351,612

848,040

– Foreign currency translation adjustment

243,258

(8,925,745)

1,473,992

(15,620,472)

Comprehensive income (loss)

20,266,479

(9,774,473)

53,825,604

(14,772,432)

Less: Comprehensive loss (income)
     attributable to non-controlling interests

(3,404)

1,632,419

(16,024)

1,150,285

Comprehensive income (loss) attributable
      to CBAK Energy Technology, Inc.

$

20,263,075

(8,142,054)

$

53,809,580

$

(13,622,147)

Income (Loss) per share

– Basic

$

0.23

$

0.00

*

$

0.60

$

0.01

– Diluted

$

0.23

$

0.00

*

$

0.60

$

0.01

Weighted average number of shares of common stock:

– Basic

88,419,998

88,996,692

87,043,490

88,900,977

– Diluted

88,709,210

89,996,692

87,349,010

88,923,265

*

Less than $0.01 per share

Cision View original content:https://www.prnewswire.com/news-releases/cbak-energy-reports-third-quarter-2022-unaudited-financial-results-301676651.html

Source: CBAK Energy Technology, Inc.

ZOWIE’s XL2566K Packs TN 360Hz DyAc­+ Technology for the Best FPS Experience Ever

In the world of fast-paced First Person Shooter (FPS) games, resolution is not everything. You want a display that responds as fast as you can move, you want everything to be fluid and clear as you pan your mouse everywhere to get your targets and still be precise. Since your opponents will be moving, a sharp image while you move is crucial for you to get the kill and be as accurate as possible. Of course, you want a fast-responding display too, one with the least input lag possible.

ZOWIE XL2566K 1
Source: BenQ

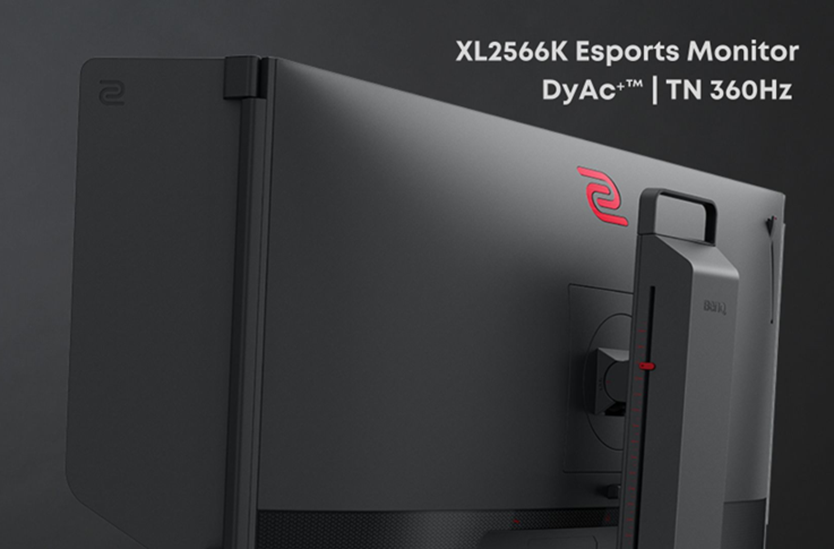
The XL2566K is BenQ’s latest ZOWIE gaming monitor made specifically with competitive FPS gamers and the big stage in mind. It is their flagship esports monitor which will no doubt find its way to competitive stages around the world. It packs 360Hz, which also means that CS:GO players can be even sharper than before with up to 360 frames every second projecting on their display.

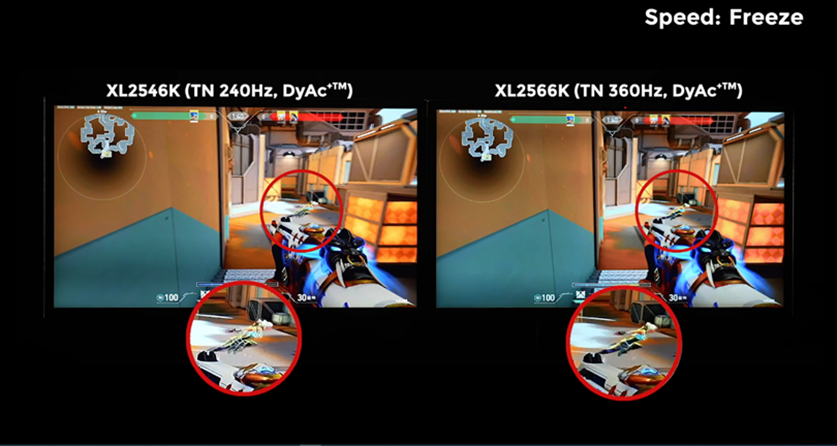
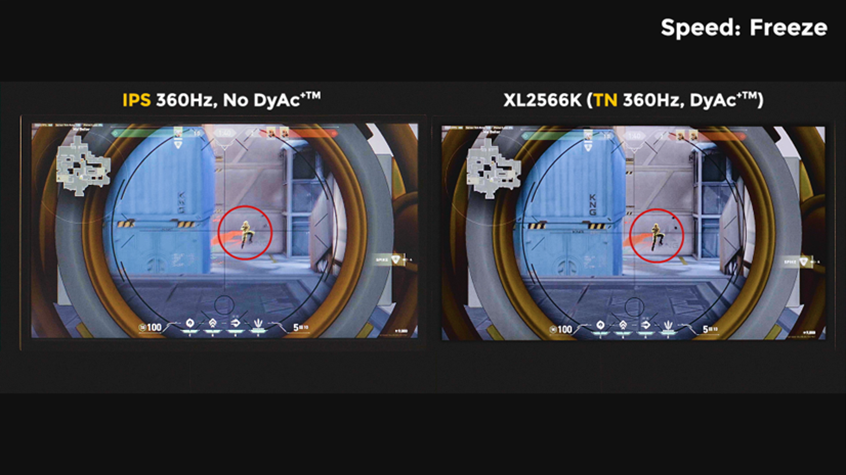
Then there is DyAc+ technology that is proprietary to ZOWIE. It offers an added clarity in fast motions. Often, just refresh rate alone is not enough to ensure that your image is crystal clear and razor sharp in fast movements. You need a clever sharpening technology like DyAC+ to clean out your image and offer you extra details in the image. The result is a sharper image all around even when your target is at a distance.

It is not an IPS display though, instead you get the less premium TN and there is good reason for that. IPS displays can hit 360Hz in refresh rate, but there are disadvantages to IPS displays. Firstly, it’s response time is slower than that of TN panels. TN panels are also cheaper to produce, making the ZOWIE monitor a little more accessible. Secondly, TN panels offer a better and more reliable response times to IPS displays. The expense? Your picture quality and colours suffer a little bit. But this is the world of competitive FPS gaming. That means that your picture quality matters less, and performance is what you want.

  • ZOWIE XL2566K 1
  • ZOWIE XL2566K 2
  • ZOWIE XL2566K 3
  • ZOWIE XL2566K 4
  • ZOWIE XL2566K 5
  • ZOWIE XL2566K 6

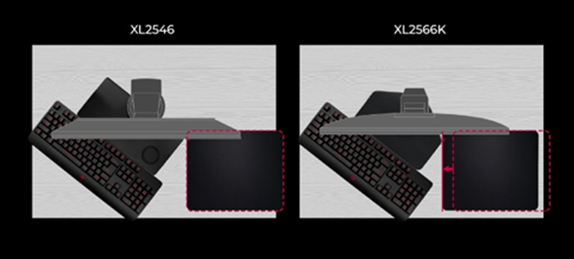
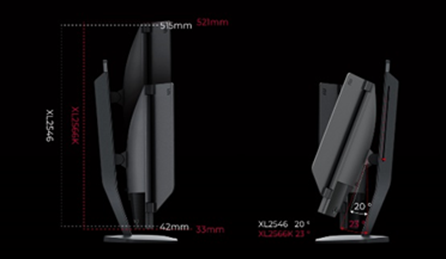
They have also put a lot of thought in designing the product to be as ergonomic as possible for FPS gamers. The 24.5-inch display features a sturdy base that is optimally shaped to allow for a tighter mouse configuration. That not only allow FPS gamers to have a tighter set up for more precision, you take up less space on your desk too. Of course, the stand is height adjustable with tilt adjustment too. You can swivel it a little bit to create more room for your mousepad. It also comes with two side shield panels to ensure that you minimize glare from other light sources.

ZOWIE’s XL2566K is now available on BenQ’s official stores on Shopee and Lazada. You can get your hands on one as well at BenQ’s authorized resellers across the nation. It will set you back MYR 2,949, which is pretty steep for a Full HD monitor understandably. It is a rather niche display though, if you think about it. It serves a very specific purpose, that is to ensure that you are competitive. More information n the new ZOWIE XL2566K TN 360Hz DyAc+ monitor can be found on their website.

Making Upskilling a MOOC Point with Stackable Continuous Learning

We’ve heard the same song for years on end: “The market is changing, and digital skills are needed to address the gaps and jobs that will emerge in the near future.” However, the song hasn’t changed nor has the landscape – until very recently thanks to the global pandemic. The pandemic has accelerated not only medical technology but also transformed our work-life relationship and the landscape of corporate life entirely. We’ve seen the acceleration of remote and hybrid work in its wake and the increasing demand for remote and continuous learning. In fact, Coursera CEO, Jeff Maggioncalda says that the “future is characterized by uncertainty and dynamism” and this is exactly what we’re seeing in a world where automation is replacing a lot of the jobs that we’ve been accustomed to over the past decades. The big question now is: Where does that leave us now?

An Emerging Need to Rethink Education and Enable Universally Accessible Education

In the simplest terms, we’re at a crossroads; one that will see the emergence of new norms, new methods and approaches, and a new need for universally accessible education that addresses the needs of emerging jobs in a new market. However, that doesn’t mean that we forget the knowledge and know-how from the past, it just means that we’ve got to adapt and look at it from a different perspective.

library high angle photro
Photo by Pixabay on Pexels.com

It’s been historically proven that quality education has driven cultural and civilizational prosperity. However, in recent years, we’ve been seeing an increase in the number of companies looking for “soft skills” rather than a “paper qualifications”. In this light, it has become more apparent that our current approach to academia, training and education is quickly failing to provide the skills and industrial know-how to address the needs of various industries. It necessitates a rethinking and a realignment of strategies in addressing the rapidly growing needs of a world that is continually and swiftly changing.

Realizing this, the founders behind Coursera, Andrew Ng and Daphne Koller, developed a platform that has grown rapidly into the go-to place for industry-relevant courses. What initially started as a platform for upskilling and training in computer sciences has become a universally accessible platform to learn and develop new skills. In the years since its founding in 2015, Coursera has collaborated with industry leaders like Google and Meta as well as reputable academic institutions like the University of California Los Angeles (UCLA), Harvard University and Massachusetts Institute of Technology (MIT) to develop accessible, industry-relevant courses and qualifications which are rapidly changing lives for the better.

MOOC-ing the Future with Stackable Courses

Massively Open Online Courses (MOOC) have become the cornerstone of Coursera’s vision of accessible education. What started as small, bite-sized, short courses have become weeks’ long certifiable courses. However, Coursera has taken it a step further by creating an environment where these MOOCs are stackable. Simply put – take a number of these courses over the span of two to three years and earn yourself a diploma or degree from a reputable institution. With this approach, the concerns of upskilling a workforce or population become an issue that is continually addressed by the evolving courses available.

Adoption of this form of learning and learning online has been driven by a generation that has realised and been sensitized to a growing gap between philosophically driven academia and skills-driven industry. This is supported by their own statistics which show a larger portion of learners from younger populations across the world. The average age of learners on the platform is about 30 years of age.

Coursera platforms

The advent of online learning has not only led to a more accessible advent of online learning has not only led to a more accessible form of tertiary learning, but it’s also disproportionately empowered women to pursue degrees in STEM (Science, Technology, Engineering and Mathematics) related fields. In Malaysia alone, women account for 46% of Coursera’s 58,000 learners. This and the added flexibility of planning your education around your life empowers even the most burdened individuals like single mothers to upskill themselves to better their financial outlook.

Coursera isn’t just making it more accessible; it’s helping institutes of higher learning rethink qualifications for their courses. This falls in line with many companies adopting skills-based qualifications instead of more theoretical qualifications. MOOCs on Coursera are used to not only give learners a taste or trial of the course they’re getting into, but they are also increasingly used to ascertain the aptitude of learners for courses. Scoring well in certain MOOCs can open new pathways of learning to those who have otherwise been turned down by academia. With this approach, learners are not only qualifying for their degree or course, but they also earn the required credits and prerequisites to their degree or master’s.

Dealing with Stigma & Accreditation

When online degrees and masters were first introduced by institutions in response to platforms like Coursera, there was a stigma that arose together with it. Are online degrees and masters up to scratch? Are these degrees bought? While they may be less prevalent now, there are some who haven’t embraced the change just yet.

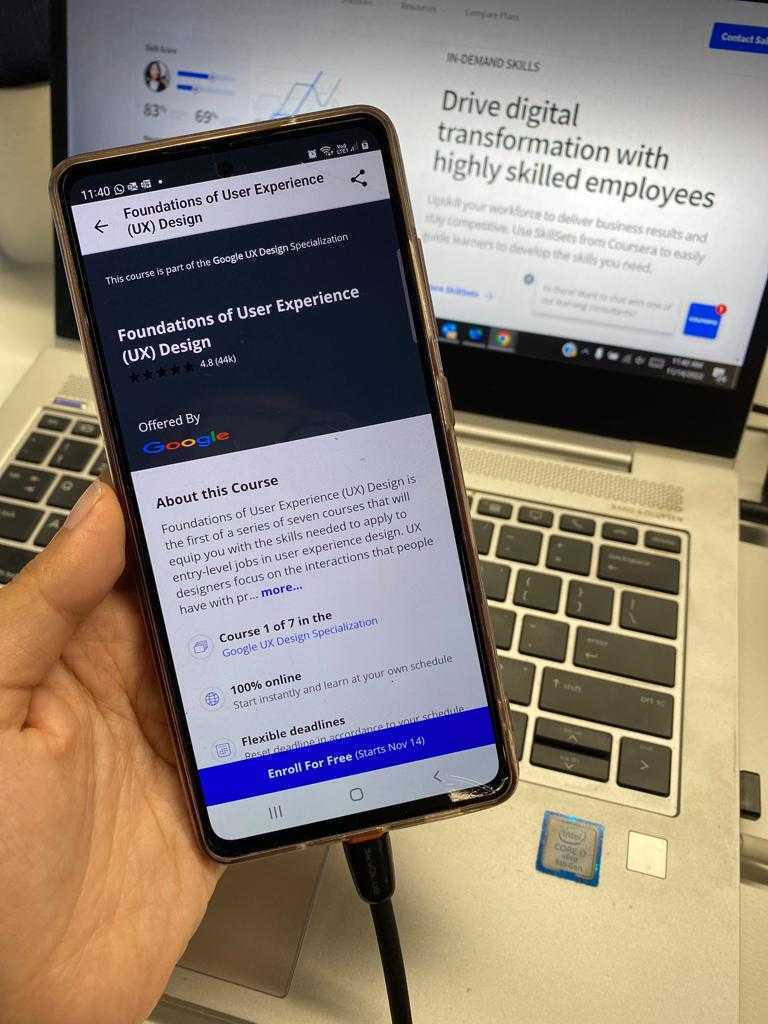
Coursera app Google 1
Source: Coursera

However, an increasing number of well-known universities are beginning to embrace hybrid learning. In fact, some of these universities offer their courses on Coursera itself. They’ve created learning experiences that empower online learners with the same access and facilities as on-campus students. Library access, access to resources like journals and even access to teaching staff are now part and parcel of the learning experience even for online learners. Study groups and student participation via tools like zoom or online forums are being factored into the final grade of online learners.

That said, these degrees and master’s programs are still subject to stringent standards of boards like the Malaysian Qualifications Agency (MQA) or the Higher Learning Commission (HLC) in the U.S..  With regular universities, courses are put through the accreditation process every two to three years, while this used to work before, with the ever-changing digital industry landscape and the skills-based hiring practices becoming prevalent it leaves the institutions handicapped and ill-equipped to address the needs of industries they train for.

With MOOCs and hybrid learning becoming more mainstream, Coursera has been working with relevant partners and agencies to rethink and better adapt the accreditation processes to allow both conventional and online learners to benefit. As the process is optimized, academia will be better equipped to respond to the changing job landscape. Online learning and MOOCs are accelerating the rate at which the workforce is being equipped with skills needed for new, digital skills-based jobs. With conventional learning institutions joining the fray, the skills gap will be all but moot.

Adapted for & Developed with Industry

However, it’s worth pointing out that it’s a continual process of developing and adapting learning modules to address new, novel concepts and approaches. This is something that is being continually done when it comes to MOOCs. Institutions that provide these MOOCs and platforms like Coursera regularly improve and innovate based on learner feedback and development of courses with leading players like Meta, Google, CISCO and more.

These mechanisms of improvement not only allow Coursera and its partners to work towards better learning outcomes, but it also allows them to develop tools and coursework that better illustrate the application of theoretical concepts in industrial practice. Feedback from industry players bridges a currently widening gap between academia and industry which has led to our currently worsening skills gap.


Jeff Maggioncalda CEO Coursera
Source: Coursera

“Strong industry-academia-government collaboration that focuses on the rapid deployment of high-quality digital and human skills training will be key to ensuring that the Malaysian workforce remains resilient and competitive amid rapid technological transformation

Jeff Maggioncalda, CEO at Coursera


Coursera is already the interjection of academia and industry; it, therefore, really comes as no surprise that companies are also adopting Coursera as a partner for their internal training and upskilling programs. Naturally, some of these courses include the adoption of courses from other partners. In fact, partners like Panasonic Appliances Marketing Asia Pacific have already curated online learning programs which have seen successful adoption among their staff. Panasonic’s program alone boasts more than 1,200 enrollments with over 10 learning hours each.

Embracing the Future of Learning by Embracing the Future of Work

It should already be apparent that learning and work are intricately linked. With the advent of technology, both have taken similar paths in their evolution. This has only been accelerated by the recent pandemic. As the world is continuing to work both remotely and in hybrid, so too must learning and education. In fact, globalization isn’t just something happening in the commercial market, it’s happening even when it comes to work. Jobs are no longer bound by physical boundaries and location. You can be in Malaysia and work for a company based in the United Kingdom or vice versa. Jobs will go to the most qualified and no longer to the one who is nearest to the office.

Coursera learners are living proof of this. Many of them are hired by partners for remote jobs outside their country of residence. Coursera itself is a company that works nearly exclusively remotely. This is just a glimpse of an inevitable future that we are seeing unfold. It goes without saying that learning should and will inevitably take the same course. In fact, it is already with MOOCs and micro-credentials looking to outperform degrees when it comes to employability in the near future.