ACE Money Transfer and Bank Alfalah Giving Away SIX Kia Sportage Alpha


MANCHESTER, England, April 28, 2022 /PRNewswire/ –The partnership between Bank Alfalah, one of the largest commercial banks in Pakistan and ACE Money Transfer, a leading online remittance provider, is all set to reach new heights with their latest marketing campaign. Overseas Pakistanis using legal remittance channels to the country will get a chance to win one of six KIA Sportage Alpha. ACE Money Transfer and Bank Alfalah, through the launch of this campaign, remain committed to facilitating overseas Pakistanis with fast, secure and convenient remittance options.

As part of this promotional campaign, customers sending remittances between 1st April to 30th June 2022 from the UK, Europe, Switzerland, Canada, and Australia to any Bank Alfalah account or for cash pickup at any of the 790 Alfalah branches across Pakistan will be eligible to win one of six brand new KIA Sportage Alpha.

Mr Rashid Ashraf, CEO of ACE Money Transfer said, “Pakistan remains a key payout corridor for us, and we are excited to continue our partnership with Bank Alfalah. Today’s customer is always on the lookout for a solution that provides security, and convenience and saves them time. With Bank Alfalah’s vast network of branches across the country and state of the art technology, we are able to provide seamless money transfer to millions of Pakistanis living around the globe.”

“Inward remittance is one of the backbones of Pakistan and Bank Alfalah is working persistently for its continuous growth,” said Saad Ur Rahman Khan, Group Head – Corporate, Investment Banking & International Business of Bank Alfalah. “We offer innovative and convenient solutions to our customers and encourage them to remit money through legal channels. This promotional campaign will reward our valued customers for sending remittances through ACE Money Transfer.”

For details, visit: https://acemoneytransfer.com/promotion/alfalah-kia-sportage

About ACE Money Transfer

ACE Money Transfer (registered name “Aftab Currency Exchange Limited”), based out of Manchester, the UK, is a growing remittance provider. It offers impeccable online money transfer services to millions of Pakistani expatriates with an extensive network of 350,000+ locations spread across 100+ countries worldwide.

About Bank Alfalah

Bank Alfalah is among the largest private banks in Pakistan, with a network of over 790 branches in more than 200 cities across Pakistan, with an international presence in Bangladesh, Afghanistan, Bahrain, and UAE. The Bank is owned and operated by the Abu Dhabi Group.

Media Contact:
marketing@acemoneytransfer.com
+44 161 3936 999 

Video: https://www.youtube.com/watch?v=Rb9SlXL66Wc


POINT ZERO FORUM UNVEILS AGENDA


ZURICH and SINGAPORE, April 28, 2022 /PRNewswire/ — Today, the Swiss Secretariat for International Finance (SIF) and Elevandi announced the programme and speaker line-up for the inaugural Point Zero Forum, taking place on June 21-23 in Zurich, Switzerland. Point Zero Forum will serve as the starting point for engaging investors and policymakers with innovators to advance the future of financial services (FOFS).

The Forum is an exclusive invite-only, in-person gathering of select global leaders, founders and investors with the purpose of:

  • Developing new ideas to advance the FOFS – decentralised finance and Web 3.0, embedded finance, and sustainable finance.
  • Driving investment activity by bringing together leading founders with VCs, private banking clients, family offices, and PE houses.
  • Dissecting regulatory considerations related to each FOFS development by bringing together public and private sector leaders.

The Forum will be two days of in-depth plenary sessions, deep-dive private roundtables and workshops, and exclusive sessions between founders and investors focusing on two significant new market opportunities built on Web 3.0 architecture. The Forum will be graced by Heng Swee Keat (Singapore’s Deputy Prime Minister and Coordinating Minister for Economic Policies) and Ueli Maurer (Switzerland’s Federal Councillor and Head of the Federal Department of Finance).

  1. The Crypto Market Opportunity: US$2.5 trillion market cap[1]: Sessions will explore the progress made by firms in building digital asset infrastructure, operating trusted digital exchanges, and unlocking the internet of value ; embedding financial services in customer interactions across sectors such as gaming and social networks.
    1. There will be spotlight discussions on:
      1. Cyber risk
      2. Financial crime,
      3. Regulatory compliance
  2. The Sustainable Finance Opportunity: $35 trillion invested[2]: Sessions will explore the challenges and the progress of market solutions to address the infrastructure and service needs of enabling ESG compliance and boosting green financing.
    1. There will be spotlight discussions on:
      1. Accessing credible and verified data from the real economy
      2. Building trusted infrastructure and regulatory compliance for data disclosure
      3. Impact

ESG and Crypto Sector Influencers Include : Urban Angehrn, CEO of the Swiss Financial Market Supervisory Authority FINMA; Sam Bankman-Fried (CEO, FTX); Stephen Bird (CEO, abrdn); Agustín Carstens (General Manager, Bank for international Settlements BIS); Umar Farooq (CEO, Onyx by JP Morgan); Doug Feagin (Senior Vice President, Global Strategic Partnerships and Investments, Ant Group); Ralph Hamers (CEO, UBS); Thomas Jordan (Chairman of the Governing Board of the Swiss National Bank SNB); Eric Lim, (Chief Sustainability Officer, UOB); Kris Marszalek (CEO, Crypto.com); David Marcus (Former Head of Novi and Messenger at Meta, Co-creator of Diem); Ravi Menon (MD, Monetary Authority of Singapore  (MAS)); Hiromichi Mizuno (Special Envoy of U.N. Secretary-General on Innovative Finance and Sustainable Investments); Roman Regelman (CEO, Asset Servicing and Head of Digital, BNY Mellon); Philipp Rickenbacher (Chief Executive Officer, Julius Baer); Julian Sawyer (CEO, Bitstamp); Julian Teicke (Founder and CEO, wefox); Jason Thompson (CEO, Partior); Dmitry Tokarev (Founder, Copper); Robby Yeung (CEO, Animoca Brands); Changpeng Zhao (CEO, Binance); Ben Zhou (CEO, Bybit).

Deep-dive private roundtables include:

  1. ‘Shared Responsibility: The Future of Green Financing’
    Hosted by: Milken Institute
    Facilitated by: Hiromichi Mizuno, Special Envoy of U.N. Secretary-General on Innovative Finance and Sustainable Investments and Laura Deal Lacey, Milken Institute.
  2. ‘Multilateral CBDCs’
    Hosted by: BIS Innovation Hub (BIS)
    Facilitated by: Andrew McCormack, Centre Head, BIS Innovation Hub Singapore, Bank for International Settlements (BIS)
  3. ‘Open Finance’
    Hosted by: State Secretariat for International Finance (SIF)
    Facilitated by: Nicolas Bruegger, Senior Policy Advisor at State Secretariat for International Finance (SIF)
  4. ‘Swiss Climate Scores – Introducing Best Practice Transparency on the Paris-alignment of Investments’
    Hosted by: State Secretariat for International Finance (SIF)
    Facilitated by: Christoph Baumann, Head of Taskforce on Sustainable Finance at State Secretariat for International Finance (SIF)
  5. ‘Growth stage FinTechs’
    Hosted by: Heng Swee Keat, Singapore’s Deputy Prime Minister and Coordinating Minister for Economic Policies
    Facilitated by: Monetary Authority of Singapore (MAS) and Economic Development Board (EDB)
  6. ‘Stablecoins’
    Hosted by: Monetary Authority of Singapore (MAS)
    Facilitated by: Jo Yeo, Head, Payments Development and Data Connectivity Office, Monetary Authority of Singapore (MAS)

Speakers include:

Agustín Carstens, General Manager, Bank for international Settlements (BIS);
Ben Zhou, CEO, Bybit;
Chen Leiming, Senior Vice President, Ant Group
Changpeng Zhao, CEO, Binance
David Marcus, Former Head of Novi and Messenger at Meta, Co-creator of Diem
David Rutter, Founder and CEO, R3
Marc Bukki (CEO of Swissquote, Founder of Swissquote group)
Dmitry Tokarev, Founder, Copper;
Doug Feagin, Senior Vice President, Global Strategic Partnerships and Investments, Ant Group;
Dr. Gabriela Maria Payer, Vice-Chairwoman, Sygnum;
Dr. Iwa Salami, Reader (Associate Professor), Centre of FinTech, Department of Law & Criminology, Royal Docks School of Business and Law;
Eric Lim, Chief Sustainability Officer, UOB;
Ericson Chan, Chief Information and Digital Officer, Zurich Insurance;
Heng Swee Keat, Singapore’s Deputy Prime Minister and Coordinating Minister for Economic Policies;
Hiromichi Mizuno, Special Envoy of U.N. Secretary-General on Innovative Finance and Sustainable Investments;
James Smith, Founder, Elliptic;
Jason Thompson, CEO, Partior;
Jo Ann Barefoot, CEO & Co-Founder, Barefoot Innovation;
Joanne Hannaford, Chief Technology & Operations Officer and Executive Board Member, Credit Suisse;
Jos Dijsselhof, CEO, SIX Group;
Julian Sawyer, CEO, Bitstamp;
Julian Teicke, Founder and CEO, wefox;
Kris Marszalek, CEO, Crypto.com;
Manisha Tank, TV Anchor & Correspondent, CNN International;
Mary Ellen Iskenderian, President & CEO, Women’s World Banking;
Nicolas Bruegger, Senior Policy Advisor at State Secretariat for International Finance (SIF);
Oliver Bussmann, CEO & Founder of Bussmann Advisory;
Philipp Rickenbacher, Chief Executive Officer, Julius Baer;
Pinar Özcan, Professor of Entrepreneurship and Innovation, Oxford University
Rahul Banerjee, Founder & CEO, Bondevalue;
Ralph Hamers, CEO, UBS;
Raphael Bianchi, President and Board Member, OpenWealth Association;
Ravi Menon, MD, Monetary Authority of Singapore (MAS);
Robby Yeung, CEO, Animoca Brands;
Roman Regelman, CEO of Asset Servicing and Head of Digital, BNY Mellon;
Sam Bankman-Fried, CEO, FTX;
Stefan Klestil, General Partner & Head of FinTech, SpeedInvest;
Stephen Bird, CEO, abrdn;
Teana Baker-Taylor, Chief Policy Officer for the Digital Chamber of Commerce;
Thomas Jordan, Chairman of the Governing Board of the Swiss National Bank (SNB);
Ueli Maurer, Switzerland’s Federal Councillor and Head of the Federal Department of Finance;
Umar Farooq, CEO, Onyx by JP Morgan

4. The full agenda can be found here.

Fringe Activities: Brand-New Investor Day and Innovation Open Houses

On the first day of the Forum (June 21st), investors are invited to a closed-door session hosted by SIF and MAS. The session will serve as a precedent to the Forum, where investors will be able to gain a perspective on the global market trends and business opportunities that are shaping the FinTech scene, and how these topics will be addressed on the agenda during the main stage.

Also happening on the June 21st are open houses hosted by BIS Innovation Hub, Crypto Valley Labs, ETH Zurich, F10, University of Zurich and ZHAW Zurich University of Applied Sciences. Registrations for these events are now open on the website.

Point Zero Forum is an invitation-only forum for investors, influencers, thinkers and decision-makers from government and regulators, financial institutions, technology companies, crypto and blockchain networks, and academia. The Forum is organised in cooperation with the BIS Innovation Hub, MAS, and SNB, and supported by Knowledge Partners including Bussmann Advisory, Ecosystm, Finance.Swiss, Milken Institute, Open Wealth Association and Switzerland Global Enterprise. To request an invite, visit www.pointzeroforum.com

State Secretariat for International Finance

The State Secretariat for International Finance represents Switzerland’s interests in financial, monetary and tax matters not only vis-à-vis partner countries but also in the competent international bodies. It is committed to good framework conditions to ensure that Switzerland can have an innovative, interconnected and sustainable financial centre and business location that is among the world leaders. The State Secretariat is responsible for implementing the financial market policy of the Swiss Government.

Elevandi

Elevandi is set up by the Monetary Authority of Singapore (MAS) to foster an open dialogue between the public and private sectors to advance FinTech in the digital economy. We work closely with governments, founders, investors, and corporate leaders to drive collaboration, education, and new sources of value at the industry and national levels. Our initiatives have convened over 300,000 people since 2016 to drive the growth of FinTech through events, closed-door roundtables, investor programmes, educational initiatives, and research. Our flagship product is the Singapore FinTech Festival alongside fast-rising platforms, including the World FinTech Festival and Point Zero Forum.

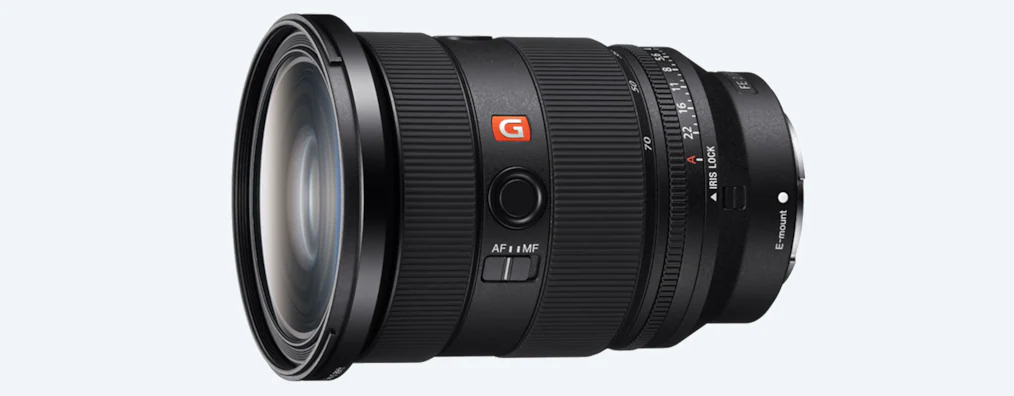
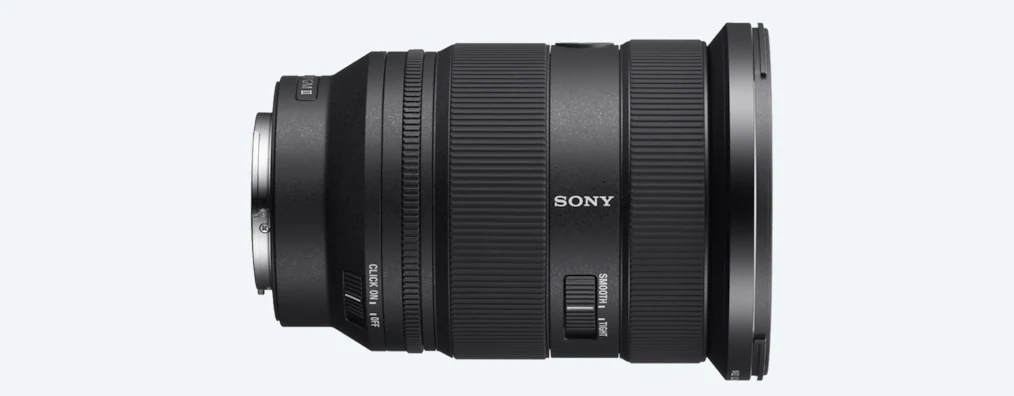
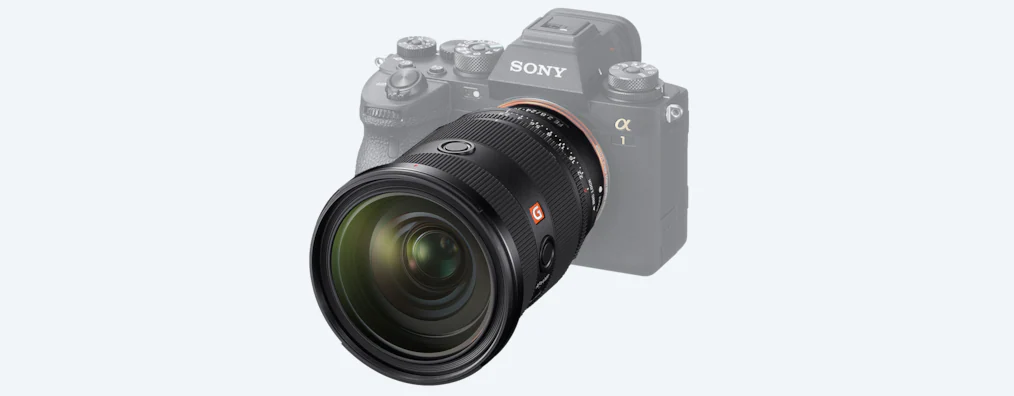
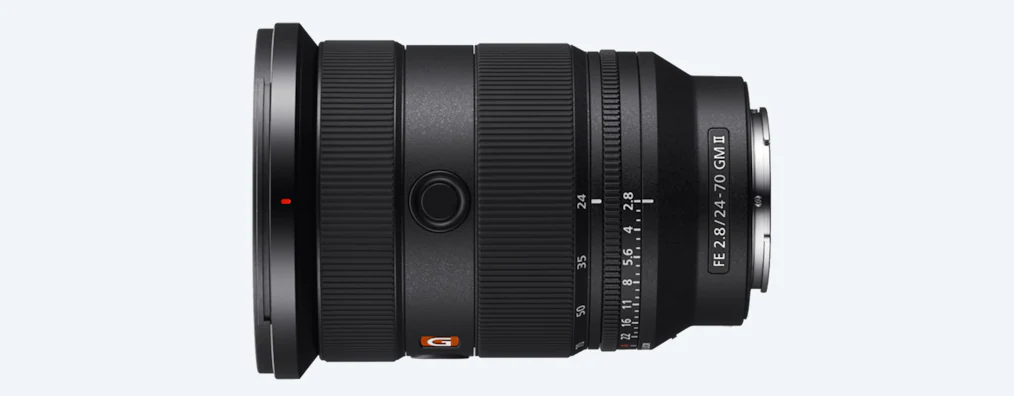
Sony Introduces the Most Compact and Lightest F2.8 Standard Zoom Lens, The Sony FE 24-70mm F2.8 G Master II (SEL2470GM2) is Here

Before we go on; yes, Sony already had a 24-70mm lens with a G Master branding on it. Yes, it was also rather expensive. Yes, it shoots rather pretty photos. Also yes, it shoots nicer than the standard Sony 24-70 F4 G lens. So why do we need another 24-70 F2.8?

Because it is a better one than before.

More Compact, More Portable

SEL2470GM2 2
Source: Sony

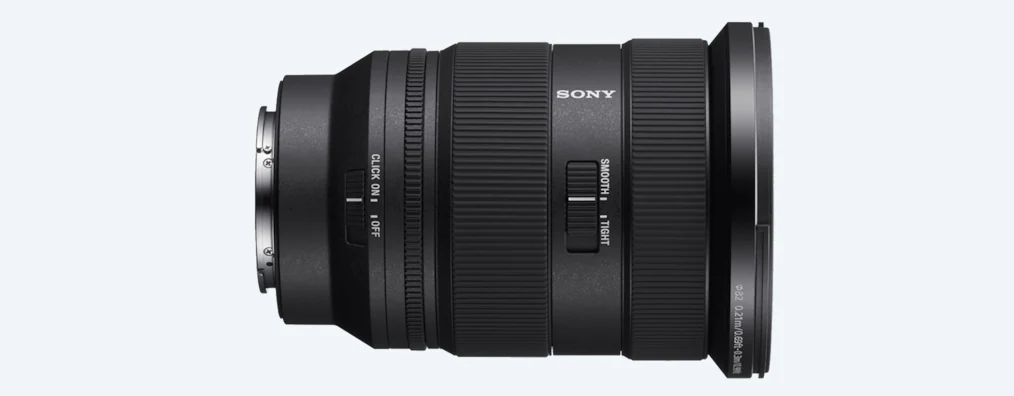
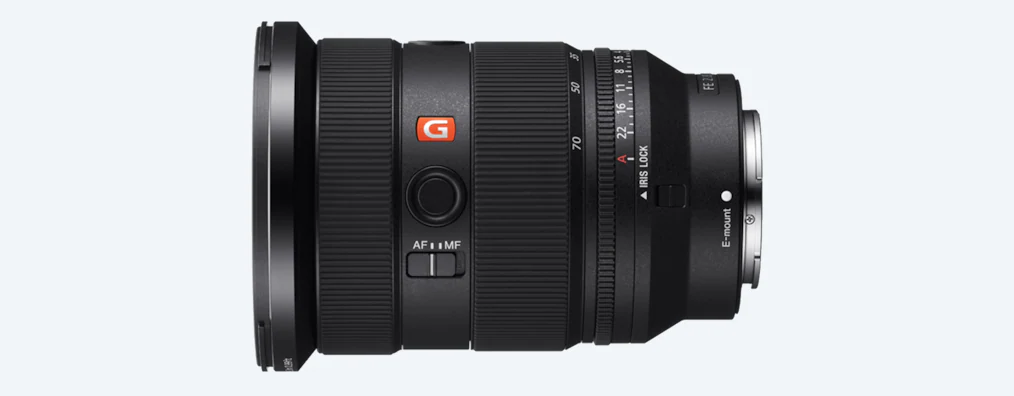
They call the new one the FE 24-70mm F2.8 GM II, or code named SEL2470GM2. It is much lighter than before with about 20% of weight shaved off from the previous lens. It now sits pretty in your bag, or hand, at less than 700 grams.

If you put it beside the first iteration of Sony’s highly acclaimed 24-70mm G Master, you can see how much effort Sony puts into the Mk. II in terms of weight saving too. It is a much smaller lens overall. It is shorter by 16mm and much slimmer than before too, about 18% slimmer than before. With all the weight shavings, Sony can claim that this is the lightest and most compact lens of its kind, at least for the time being.

More Speed, More Performance

SEL2470GM2 3
Source: Sony

Smaller size does not mean that Sony has compromised on its performance though. They have managed to first improve its autofocusing (AF) ability. It is still the same Extreme Dynamic (XD) Linear motors working on the AF mechanism, but iis now much faster than before. It can support up to 30fps in continuous still shooting and up to 4K 120fps in video recording mode. That might not sound like a lot, but it is mighty impressive to work with in this sort of lens. Sony also claims that the AF tracker is about twice as precise than before.

For the videographers, Sony is making the 24-70mm G Master an even better lens to work with. Thanks to a newly developed aperture unit (now with 11 aperture blades instead of 9), AF operations is quieter than before. The improved motors have also reduced focus breathing, focus shift, and axial shift when zooming to ensure that you get a nice, smooth, immersive video footages when it matters. Of course, you still can work with manual zoom if you want.

Better Elements, Better Images

SEL2470GM2 5
Source: Sony

They managed to fit better glasses in this compact form too. Sony first treated the lens with a Nano AR Coating II. This is to reduce reflections on the glass that in turn reduces lens flares. The new glasses within the lens also allows the Sony FE 24-70mm F2.8 G Master II to produce photos with beautiful depth effect in all sorts of zoom range. At the same time. The new lens also allows a shorter focusing distance at 0.21 and 0.30 meters at its minimum (@24mm and 70mm respectively) with up to .32x magnification.

All this is achieved through the five aspherical elements found in the lens. There are two high-precision extreme aspherical glass elements paired with two extra-low dispersion glass elements and one floating focus mechanism. The combination of elements also allows the lens to capture photos with high-resolution even at the edges of the photos.

More Precise, More Control

To top it all off, Sony has made improvements on the lens body itself to give users more control over the lens. There is a zoom smoothness switch on the zoom ring to adjust its smoothness now. There are two customisable focus hold buttons in the lens as well. At the same time, some work has been done on the focus ring to make it just a touch more responsive for better manual focus controls. They have also managed to shift the weight balance further back, toward the camera flange end to allow for better ergonomic and camera control in free-handed shooting conditions.

Price and Availability

The Sony FE 24-70mm F2.8 G Master II lens will be available in Malaysia from 5th of June 2022 onward. There are no mentions on prices just yet. We are guessing that the price should not be too far off the current FE 24-70mm F2.8 G Master though. There could also be a price drop for the original standard zoom lens, so you might want to look out for a bargain for something that is still quite stellar. More information on the FE 24-70mm F2.8 G Master II can be found on their website.

Nintex Accelerates Process Automation Across Commercial Enterprises and Government Agencies


With pre-built process templates designed for major industries and departmental use cases, the online Nintex Gallery is a valuable resource for digital transformation acceleration

AUCKLAND, New Zealand, April 28, 2022 /PRNewswire/ — Nintex, the global standard for process intelligence and automation, today announced the addition of more than 50 new process templates to its online Nintex Gallery, an interactive portal featuring downloadable process maps, automation templates, workflows and connectors – all designed to speed the digitisation of work for organisations worldwide.

“Nintex process templates jumpstart sophisticated-to-critical automation projects by putting valuable pre-built components and solutions directly in the hands of people,” said Nintex Chief Product Officer Neal Gottsacker. “With our process intelligence and automation tools and templates, organisations can rapidly remove digital transformation barriers and automate faster.”

New capabilities available through the Nintex Gallery include direct integration with Nintex Workflow Cloud, the company’s next-generation cloud automation platform, which allows customers to directly import workflow templates into their environment so they can deploy digital solutions even faster. There are also a growing number of templates available for Nintex AssureSign®, Nintex Kryon® RPA, Nintex Drawloop DocGen®, and Nintex Forms.

Currently the Nintex Gallery features hundreds of useful templates that have accumulated since the initial launch in January 2020. Templates may be filtered and organised by capability, industry and department, and the latest release includes an advanced search function, refreshed user interface, and new template sets to accelerate the development of end-to-end automated business solutions.

Popular templates to support key use cases include:

  • Employee onboarding with Nintex Workflow Cloud
  • Invoice processing with Nintex Promapp®
  • Integrate Nintex RPA Central with Nintex K2 Five with connectors
  • Check processing automation with Nintex RPA

Template contributions are open to Nintex premier partners with a high-level of expertise and Nintex expert certifications, like top template contributors Protiviti Inc, Quadrion, and Optimum.

“Our highly skilled team of Nintex-certified experts work with clients to develop their business process automation strategy and assist with design, configuration and customisation of intelligent automation solutions,” said Protiviti Managing Director, Global Ecosystem, Claudia Kuzma. “The Nintex Gallery allows us to quickly and easily get our solutions to customers so they can experience the benefits immediately.”

To experience The Power of Process®, request a free Nintex trial at https://www.nintex.com/trial/.

Media Contact

About Nintex

Nintex is the global standard for process intelligence and automation. Today more than 10,000 public and private sector organisations across 90 countries turn to the Nintex Platform to accelerate progress on their digital transformation journeys by quickly and easily managing, automating and optimising business processes. Learn more by visiting www.nintex.com and experience how Nintex and its global partner network are shaping the future of Intelligent Process Automation (IPA).

Product or service names mentioned herein may be the trademarks of their respective owners.

Logo – https://techent.tv/wp-content/uploads/2022/04/nintex-accelerates-process-automation-across-commercial-enterprises-and-government-agencies.jpg

Hello Group Files Annual Report on Form 20-F for Fiscal Year 2021

BEIJING, April 27, 2022 /PRNewswire/ —  Hello Group Inc. (NASDAQ: MOMO) (“Hello Group” or the “Company”), a leading mobile social and entertainment platform in China, today filed with the U.S. Securities and Exchange Commission its annual report on Form 20-F for the fiscal year ended December 31, 2021. The annual report can be accessed on the Company’s investor relations website at https://ir.hellogroup.com/ or on the SEC’s website at http://www.sec.gov.

The Company will provide a hard copy of its annual report containing the audited consolidated financial statements, free of charge, to its shareholders and ADS holders upon request. Requests should be directed to the Company’s Investors Relations Department via email at ir@hellogroup.com or by mail at 20th Floor, Block B, Tower 2, Wangjing SOHO, No. 1 Futongdong Street, Chaoyang District, Beijing 100102, People’s Republic of China.

About Hello Group Inc.

We are a leading player in China’s online social and entertainment space. Through Momo, Tantan and other properties within our product portfolio, we enable users to discover new relationships, expand their social connections and build meaningful interactions. Momo is a mobile application that connects people and facilitates social interactions based on location, interests and a variety of online recreational activities. Tantan, which was added into our family of applications through acquisition in May 2018, is a leading social and dating application. It is designed to help its users find and establish romantic connections as well as meet interesting people. We also operate a number of other applications to serve different social and entertainment demands from our users.

For investor and media inquiries, please contact:

Hello Group Inc.

Investor Relations
Phone: +86-10-5731-0538
Email: ir@hellogroup.com  

Christensen

In China
Mr. Eric Yuan
Phone: +86-10-5900-1548
E-mail: Eyuan@christensenir.com  

In US
Ms. Linda Bergkamp
Phone: +1-480-614-3004
Email: lbergkamp@christensenir.com

Cision View original content:https://www.prnewswire.com/news-releases/hello-group-files-annual-report-on-form-20-f-for-fiscal-year-2021-301534253.html

Source: Hello Group Inc.

POCO Launches Their Latest Flagship, the F4 GT at MYR 2,299

These days, when you talk flagship, you think about devices that cost at least MYR 3,000 and above. Anything below that price range is usually categorised as mid-range smartphones. They are usually specced as such too, with Qualcomm’s Snapdragon 700 series, 6-8GB of RAM, and up to 256GB of storage. Not this one though. It is priced as a mid-range smartphone, but on paper, it is a flagship.

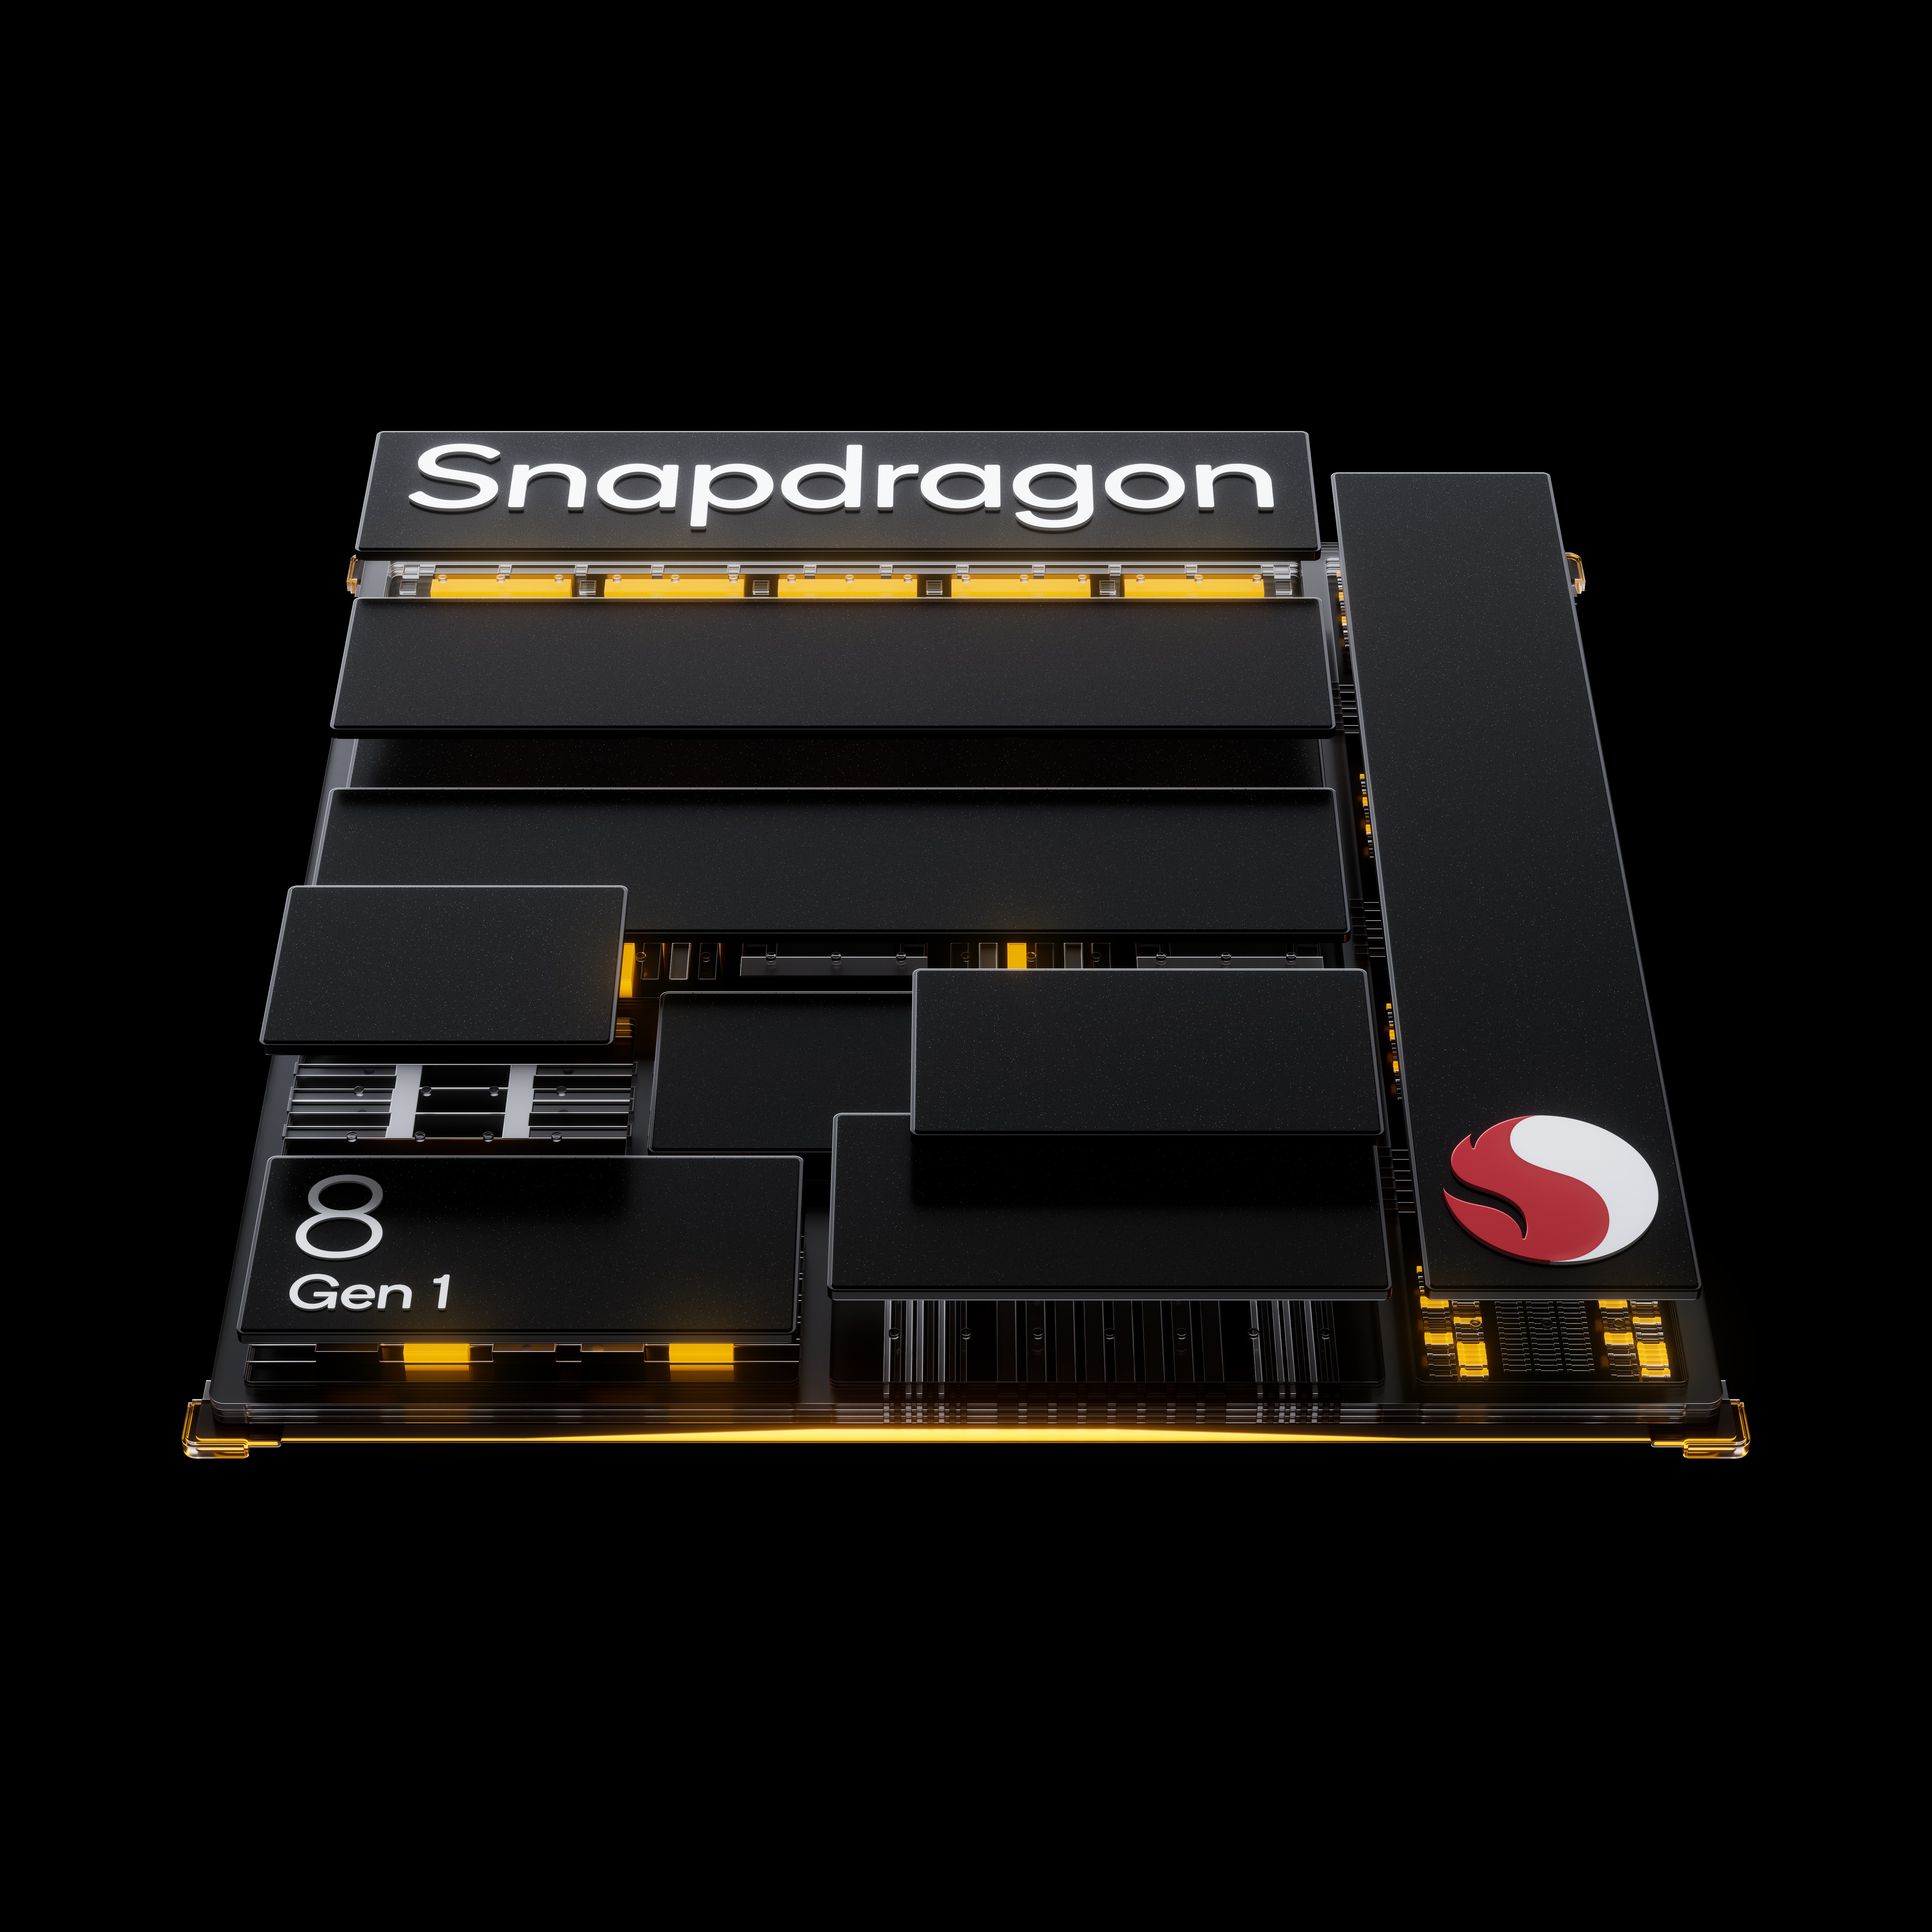
First, the POCO F4 GT packs a Snapdragon 8 Gen 1, the most powerful system on a chip (SoC) you can find in an Android smartphone currently. Sure, the Snapdragon 8 Gen 2 is rumoured to come some time soon. Until then, the Gen 1 is still the most powerful SoC you can find on an Android. The powerful SoC is supported by up to 12GB of speedy LPDDR5 RAM with up to 256GB of UFS 3.1 storage for snappy operations.

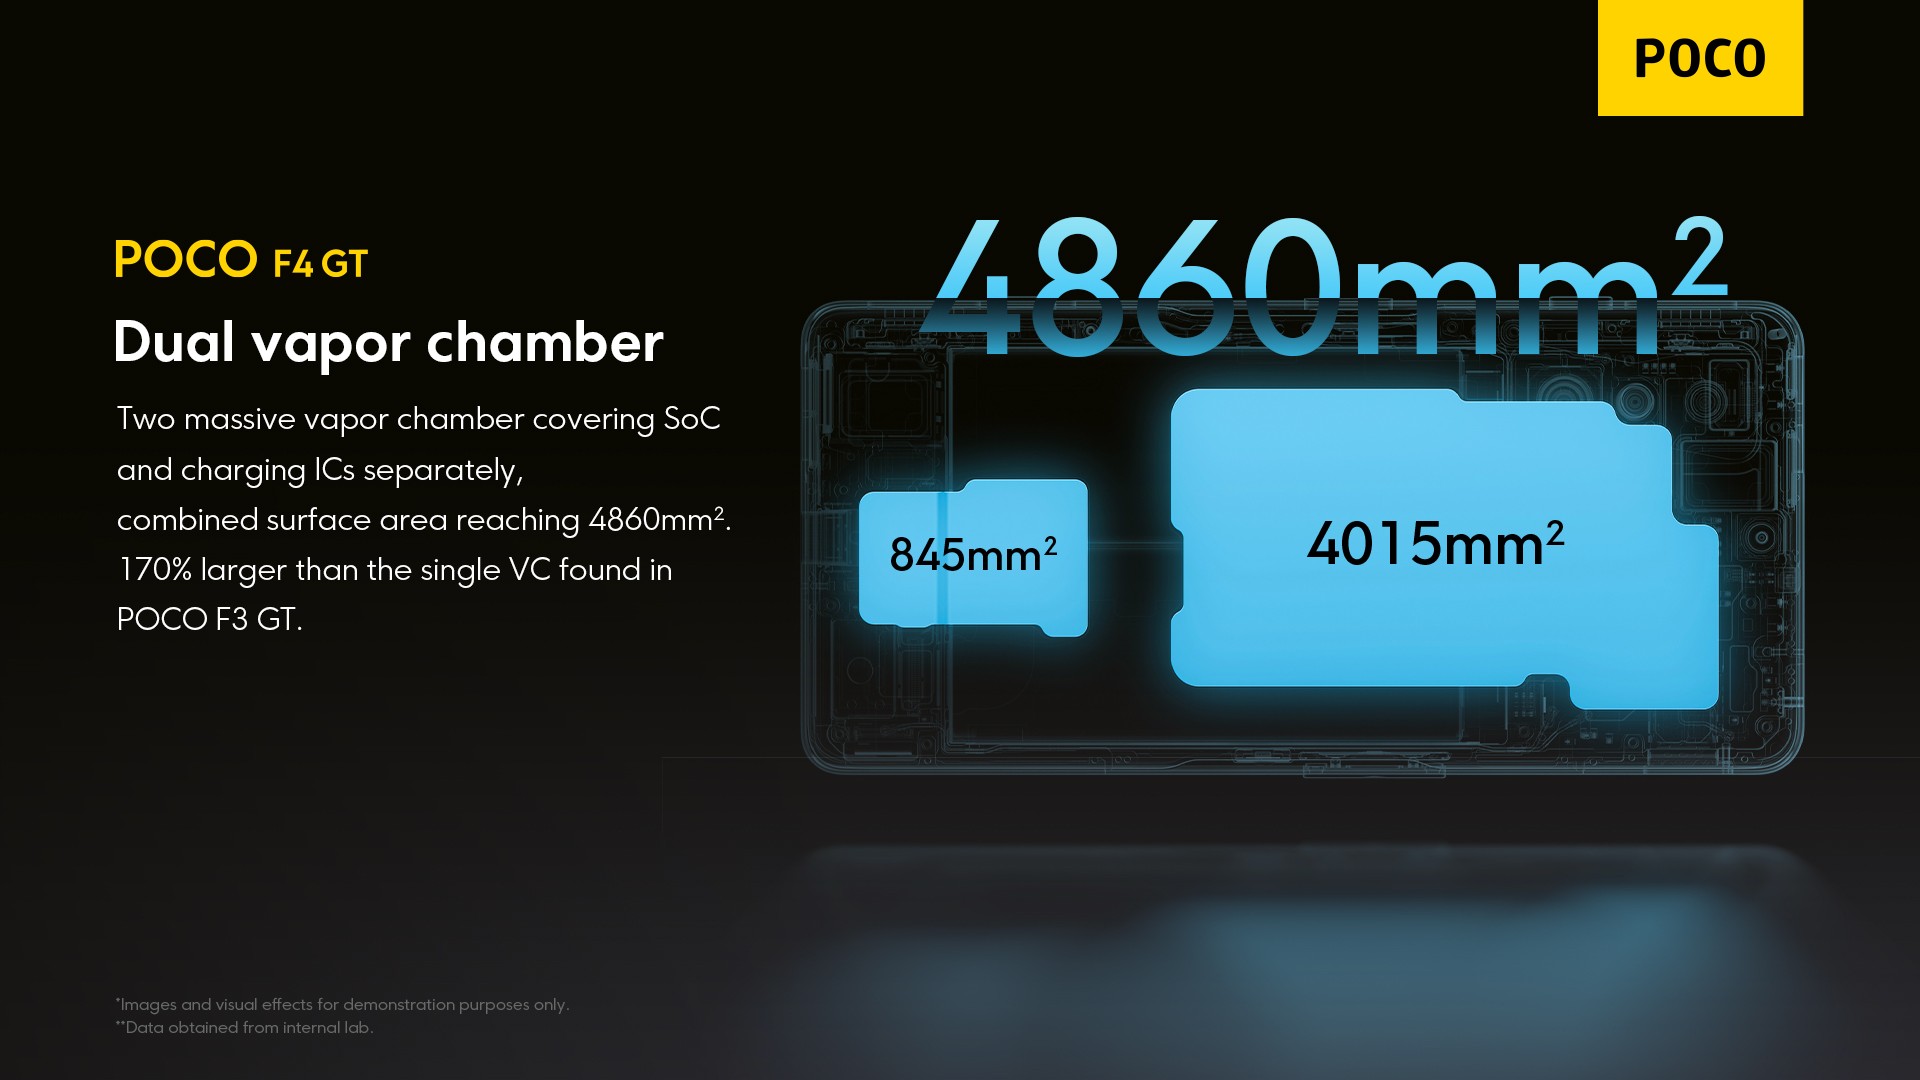
They say that it is made for mobile gaming. To ensure that the SoC stays cool for extended gaming sessions then, they have something they call LiquidCool Technology 3.0. The technology large dual vapor chambers to ensure that heat from the SoC can be quickly and efficiently transferred and dissipated elsewhere on the device.

Screen
Source: POCO

Out the front is an expansive and immersive 6.67-inch AMOLED display with 10-bit colours. With up to 120Hz, your interface should feel smoother than running a hot knife through butter. At up to 480Hz of touch sampling rate, every touch should feel more instant and more responsive than ever before. Of course, with DisplayMate’s A+ rating, this display should be great with movies too.

Out the back is a 64-Megapixel main shooter which should be enough in most cases. Of course, most of the time, you are really taking 12-Megapixel photos unless you tell your camera that you want to shoot in 64-Megapixel mode. The powerful camera is supported by an 8-Megapixel ultra-wide shooter and a 2-Megapixel macro camera. Out the front is a 20-Megapixel selfie shooter for when you need to stream or when you just want to capture a clear selfie.

To keep everything running nicely an entire day and more is a 4,700mAh battery inside the device. It is also the first battery in POCO’s device range to offer 120W HyperCharge charging speed. The device can be fully charged in just 27 minutes. Charging your device at 120W at all times can destroy the battery pretty quickly though, so POCO’s AdaptiveCharge feature cleverly keeps your battery from overcharging to prolong its shelf life.

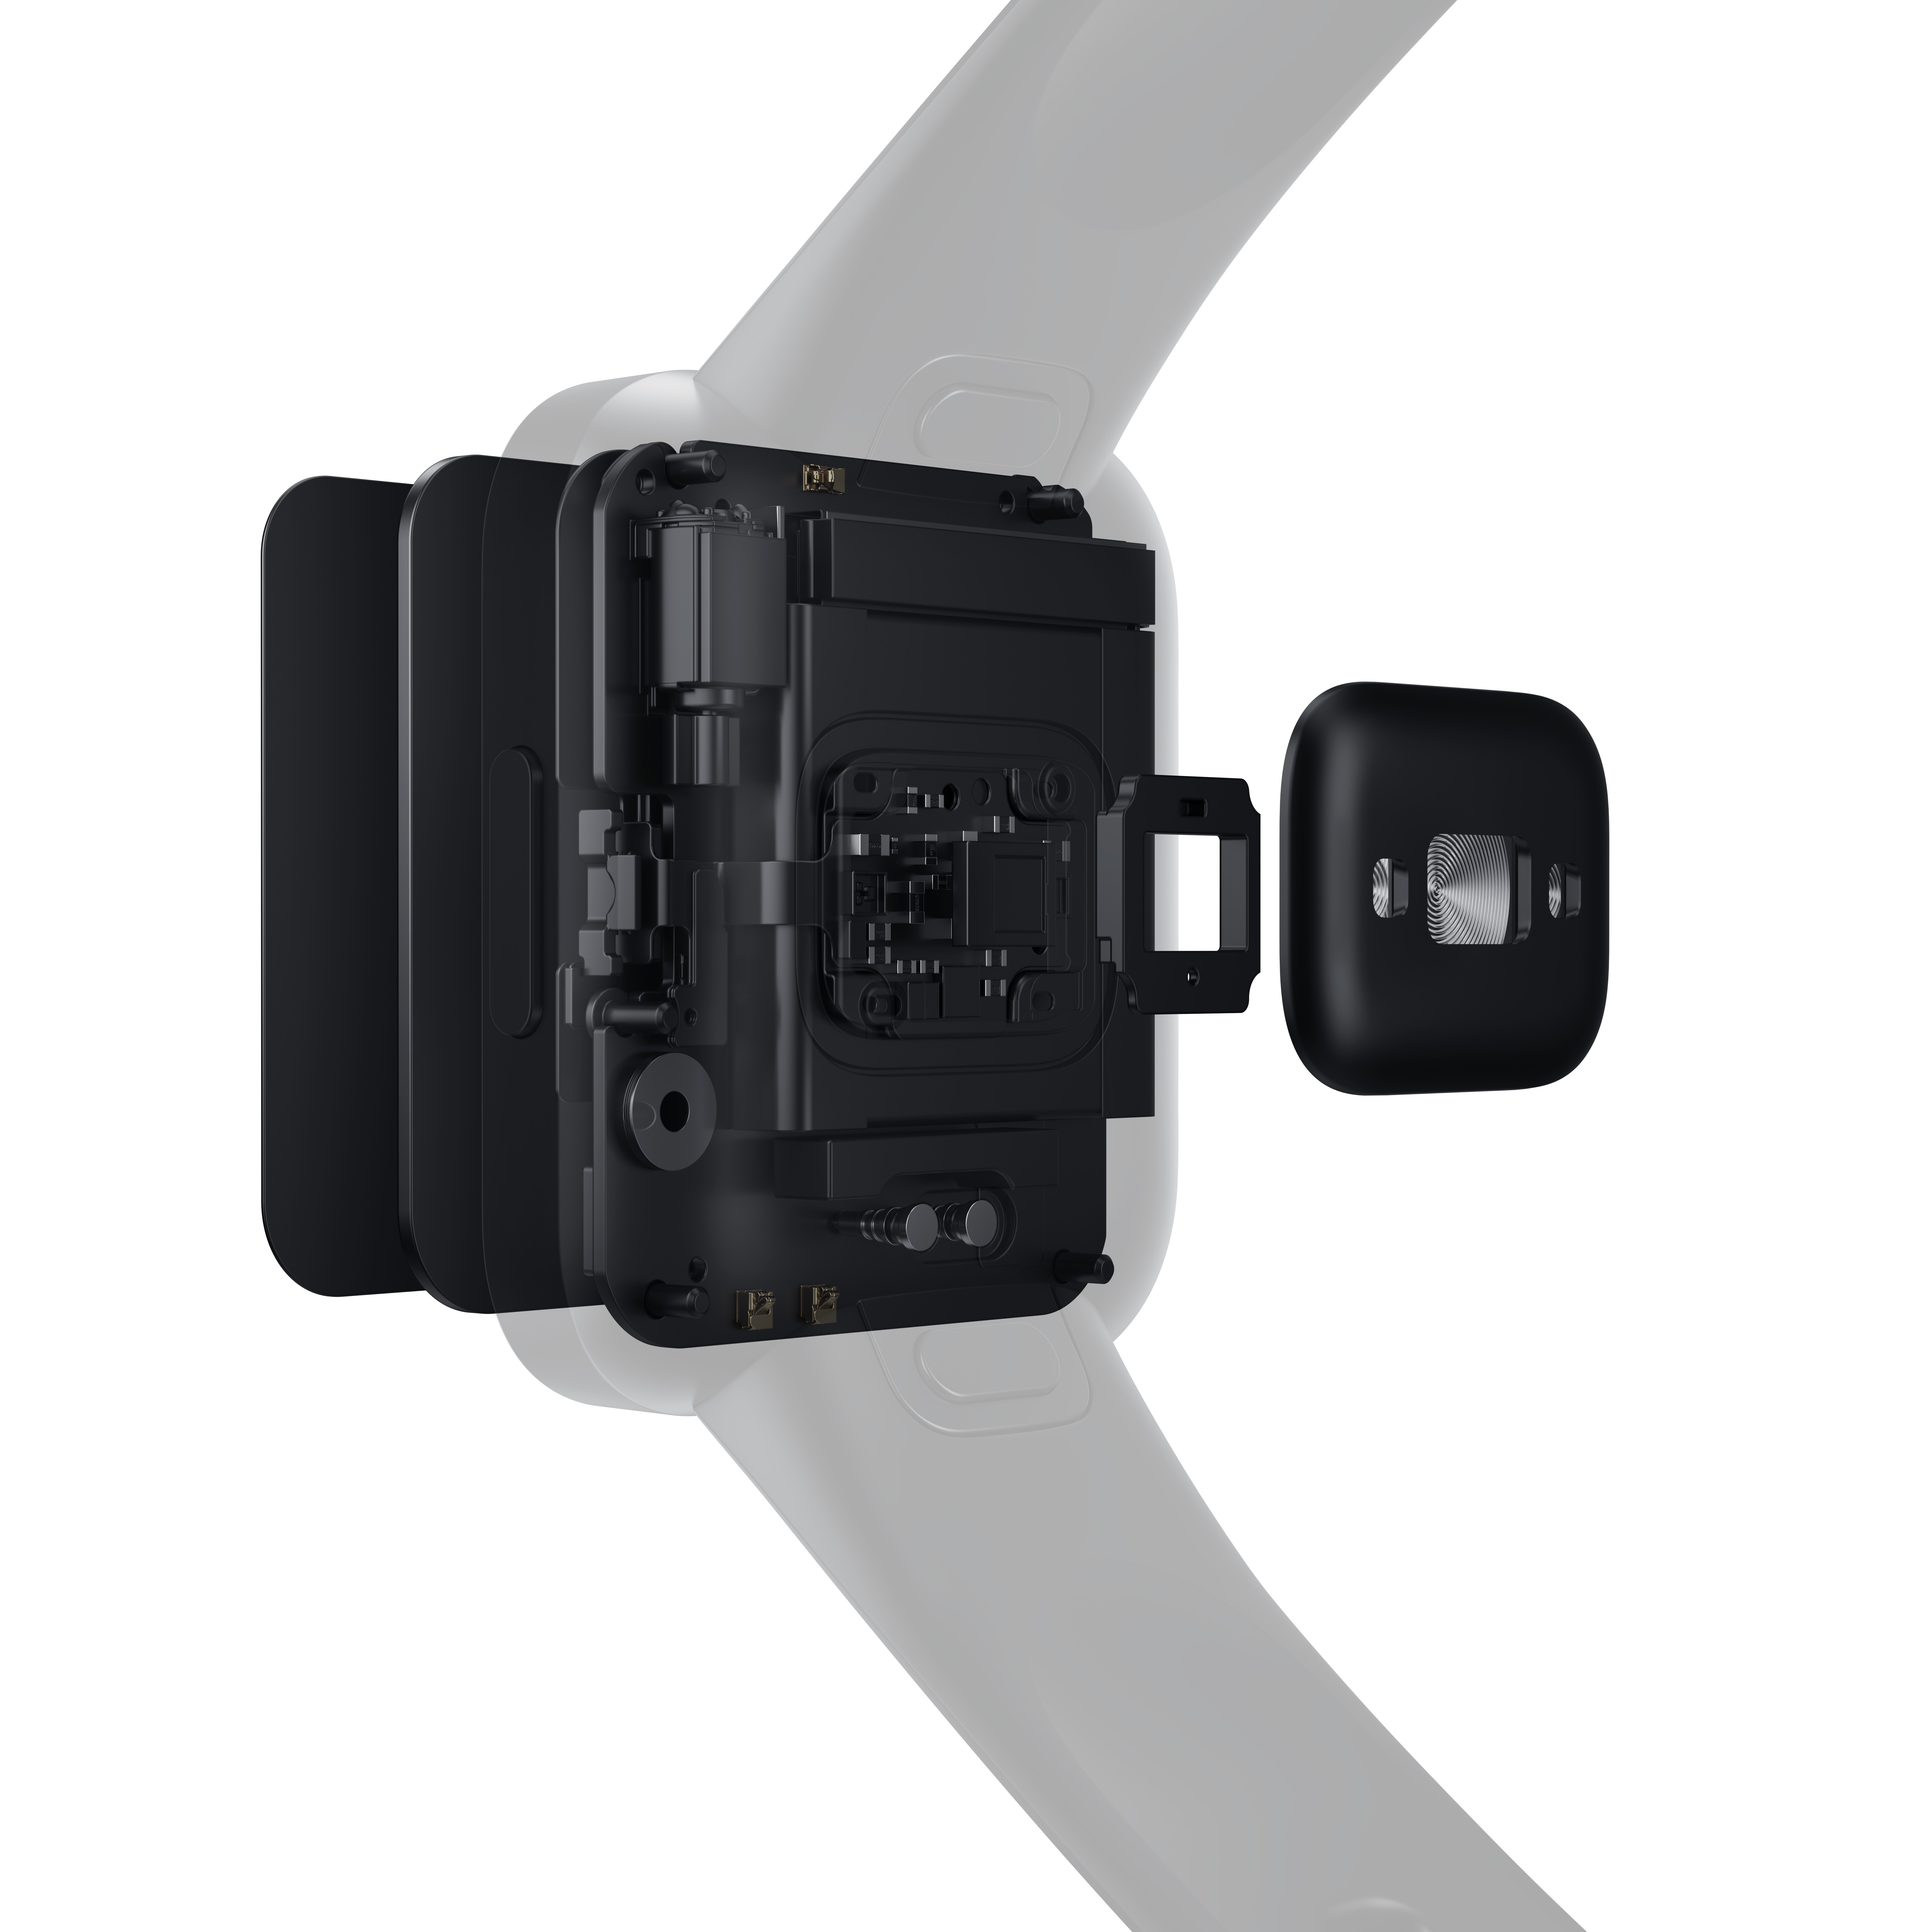
Alongside the POCO F4 GT, POCO also launched their new Buds Pro Genshin Impact Edition with a rather special design throwing homage to the ever so popular mobile game. They also launched the POCO Watch, their first ever smartwatch cum fitness tracker. It does not run on the Wear OS.

The POCO F4 GT is available in three colour options from 28th of April 2022 onward. You can choose between Stealth Black, Knight Silver, and Cyber Yellow colour options. You can also choose between an 8GB + 128GB variant and a 12GB + 256GB variant for MYR 2,299 and MYR 2,499 respectively. If you purchase your device on the 28th of April 2022 on either Shopee or Lazada, you can get your device for MYR 1,999 and MYR 2,199 respectively. The POCO Buds Pro Genshin Impact Edition and POCO Watch will be available for MYR 299 and MYR 249 respectively on the same date. More information on the new POCO devices can be found on their website.

Lanvin Group Accelerates Digital Strategies with Shopify in North America


Global luxury fashion group harnessing the power of Shopify technologies to build a disruptive digital platform

SHANGHAI, April 27, 2022 /PRNewswire/ — Lanvin Group (the “Group”), a global luxury fashion group, today announced that it has entered into a commercial agreement with Shopify (NASDAQ: SHOP), a leading provider of essential internet infrastructure for e-commerce, that will allow it to build a North American digital platform powered by Shopify’s technologies.

From H2 2022, Lanvin and Sergio Rossi will become the first of the Group’s luxury brands to transition onto the digital platform in the North American market, allowing them to unlock new growth opportunities with market-leading digital capabilities in the world’s largest luxury fashion market.

The new digital platform powered by Shopify’s high performing and trusted technologies will allow the brands to focus on what matters the most – products and customers – and to continue their expansion with the assurance and support of a robust commerce engine in the years to come. This will form an important part of the Group’s ongoing efforts to provide best-in-class customer experience with dedicated merchandise and content, as well as optimized and localized omni-channel shopping services.

Shopify’s highly modular and scalable solutions offer great potential for the Group’s other existing and any newly-acquired luxury brands to centralize their e-commerce functions on a shared platform, creating synergies across the portfolio, while still maintaining individual brand’s unique interfaces and databases. The Group will adopt Shopify’s agile and user-friendly digital solutions to further enhance the increasingly important digital experience for customers, and benefit from Shopify’s extensive app-based ecosystem in business process optimization and digital acceleration as it continues to expand globally through retail footprint expansion, e-commerce channel activation and category expansion.

Ms. Joann Cheng, Chairman and CEO of Lanvin Group, said: “As an innovation-driven luxury fashion group, we strive to usher in the future of luxury. Shopify has been at the forefront of innovation, working with some of the most successful businesses to transform e-commerce for merchants and consumers globally. The launch of our new Shopify-powered platform is a testament to our differentiated strategy to deliver high growth by leveraging the newest technologies, working with best-in-class partners, and speaking to the consumers of tomorrow. Our legacy-light and digital-native model allows us to integrate Shopify’s disruptive technologies across our portfolio of heritage brands. Thanks to the strengthened e-commerce capabilities brought by Shopify, Lanvin Group is now even better equipped to capture the significant growth opportunities we have identified in North America, the world’s largest luxury market.”

Harley Finkelstein, President of Shopify Inc., said: “At Shopify, we enable the world’s best brands to seamlessly reach their customers and connect with new audiences. We are thrilled that Lanvin, an iconic, 130-year old brand, has chosen Shopify to power its ecommerce business as it enhances its digital platform in North America. With our world-class technology, we know this launch will enable Lanvin to pursue endless possibilities and growth opportunities.”

Lanvin Group recently announced that it has entered into a definitive business combination agreement with Primavera Capital Acquisition Corporation (NYSE: PV) that is expected to list Lanvin Group on the New York Stock Exchange.

Note to Editor

According to Bain-Altagamma Luxury Goods Worldwide Market Study (Fall 2021-20th), online channel is on track to becoming the number-one distribution channel by 2025, accounting for approximately 30% of the personal luxury goods market. The online personal luxury goods market almost doubled its size between 2019 to 2021, representing a €62 billion market on its own. Websites devoted to a single brand gained ground on other types of online platforms and made up 40% of the online segment in 2021, up from 30% in 2019.

About Lanvin Group

Lanvin Group, is the leading global luxury fashion group headquartered in Shanghai, China, managing iconic brands worldwide including Lanvin, Sergio Rossi, Wolford, St. John Knits, and Caruso. Harnessing the power of its unique strategic alliance of industry-leading partners in the luxury fashion sector, Lanvin Group strives to expand the global footprint of its portfolio brands and achieve sustainable growth through strategic investment and extensive operational know-how, combined with an intimate understanding and unparalleled access to the fastest-growing luxury fashion markets in the world. For more information about Lanvin Group, please visit www.lanvin-group.com, and to view our investor presentation, please visit www.lanvin-group.com/investor-relation/.

About Shopify

Shopify is a leading provider of essential internet infrastructure for commerce, offering trusted tools to start, grow, market, and manage a retail business of any size. Shopify makes commerce better for everyone with a platform and services that are engineered for reliability, while delivering a better shopping experience for consumers everywhere. Proudly founded in Ottawa, Shopify powers millions of businesses in more than 175 countries and is trusted by brands such as Allbirds, Gymshark, Heinz, Tupperware, FTD, Netflix, FIGS, and many more. For more information, visit www.shopify.com.

Cision View original content to download multimedia:https://www.prnewswire.com/news-releases/lanvin-group-accelerates-digital-strategies-with-shopify-in-north-america-301533850.html

Global Cloud Gaming to Reach 349.4 Million Users by 2025

The global cloud gaming market’s B2C segment will witness exponential growth, registering market expansion at a CAGR of 69% by 2025, says Frost & Sullivan

SAN ANTONIO, April 27, 2022 /PRNewswire/ — Frost & Sullivan’s recent research, Analysis of the Global Cloud Gaming Market, finds that the global video game market is experiencing disruption with the advent of cloud gaming. It allows users to enjoy the latest gaming titles without high-end hardware or downloading the full software on their computers or other devices. This buoyant market’s business-to-consumer (B2C) segment will likely garner $13.05 billion in revenue by 2025 from $1.6 billion in 2021, registering a staggering compound annual growth rate (CAGR) of 69%. In addition, total users are expected to reach 349.4 million by 2025, compared to 60.6 million users in 2021.

Global Cloud Gaming to Reach 349.4 Million Users by 2025

For further information on this analysis, please visit: https://frost.ly/78f

“The entrance of major gaming companies into the cloud gaming arena and the adoption of 5G technology are prominent drivers boosting the global cloud gaming market growth exponentially,” said Diego Dell Orco, Digital Content Services Research Analyst at Frost & Sullivan. “Major technology companies have already shown interest in the market, with significant offerings that could be fully released in the next two or three years.”

Dell Orco added: “Cloud gaming is available across a diverse number of devices, such as cell phones and smart TVs, which also enables the creation of new revenue streams for a wide range of companies. These notable possibilities should encourage cloud gaming providers and interested entrants to invest in the sector before competition heats up.”

The cloud gaming industry is a sunrise sector and presents immense growth prospects for market participants, including:

  • Increased adoption of 5G and high-bandwidth networks: Telcos will diversify their portfolio and boost customer traffic, enabling them to monetize other aspects of their business besides bandwidth.
  • Cloud capabilities for game developers and publishers: Video game companies will capture new audiences and better serve their hardcore user base as developers create massive and complex products thanks to cloud capabilities.
  • Edge computing and investment in data centers: Companies that focus on co-location services will experience rising demand, especially those that are strategically placed to cover promising geographical regions such as Latin America, Southeast Asia, and Sub-Saharan Africa.
  • Mobile cloud gaming market: Video game firms and cloud gaming companies should be aware of how mobile user acquisition will change with cloud gaming.
  • Chinese cloud gaming market: The Chinese government is focusing on deploying 5G networks and data centers around the country as part of a comprehensive digital infrastructure plan that aims to revitalize the economy. This creates unparalleled potential for cloud gaming services in China.
  • Opportunity for smart TV manufacturers: These companies should focus their efforts on creating cloud gaming platforms, optimized for high resolutions.

Analysis of the Global Cloud Gaming Market is the latest addition to Frost & Sullivan’s Information & Communication Technology research and analyses available through the Frost & Sullivan Leadership Council, which helps organizations identify a continuous flow of growth opportunities to succeed in an unpredictable future.

About Frost & Sullivan

For over six decades, Frost & Sullivan has helped build sustainable growth strategies for Fortune 1000 companies, governments, and investors. We apply actionable insights to navigate economic changes, identify disruptive technologies, and formulate new business models to create a stream of innovative growth opportunities that drive future success. Contact us: Start the discussion.

Analysis of the Global Cloud Gaming Market

K70E

Contact:
Mariana Fernandez
Corporate Communications
E: Mariana.Fernandez@frost.com
https://www.frost.com

Acer Aspire Vero National Geographic Edition Available in Malaysia

Acer’s Aspire Vero laptop was announced last year. The new laptop is the first in a line of products built on the company’s Earthion (Earth + Mission) platform. With their new platform, the company is looking to lessen and reverse the environmental impact of technology on the environment.

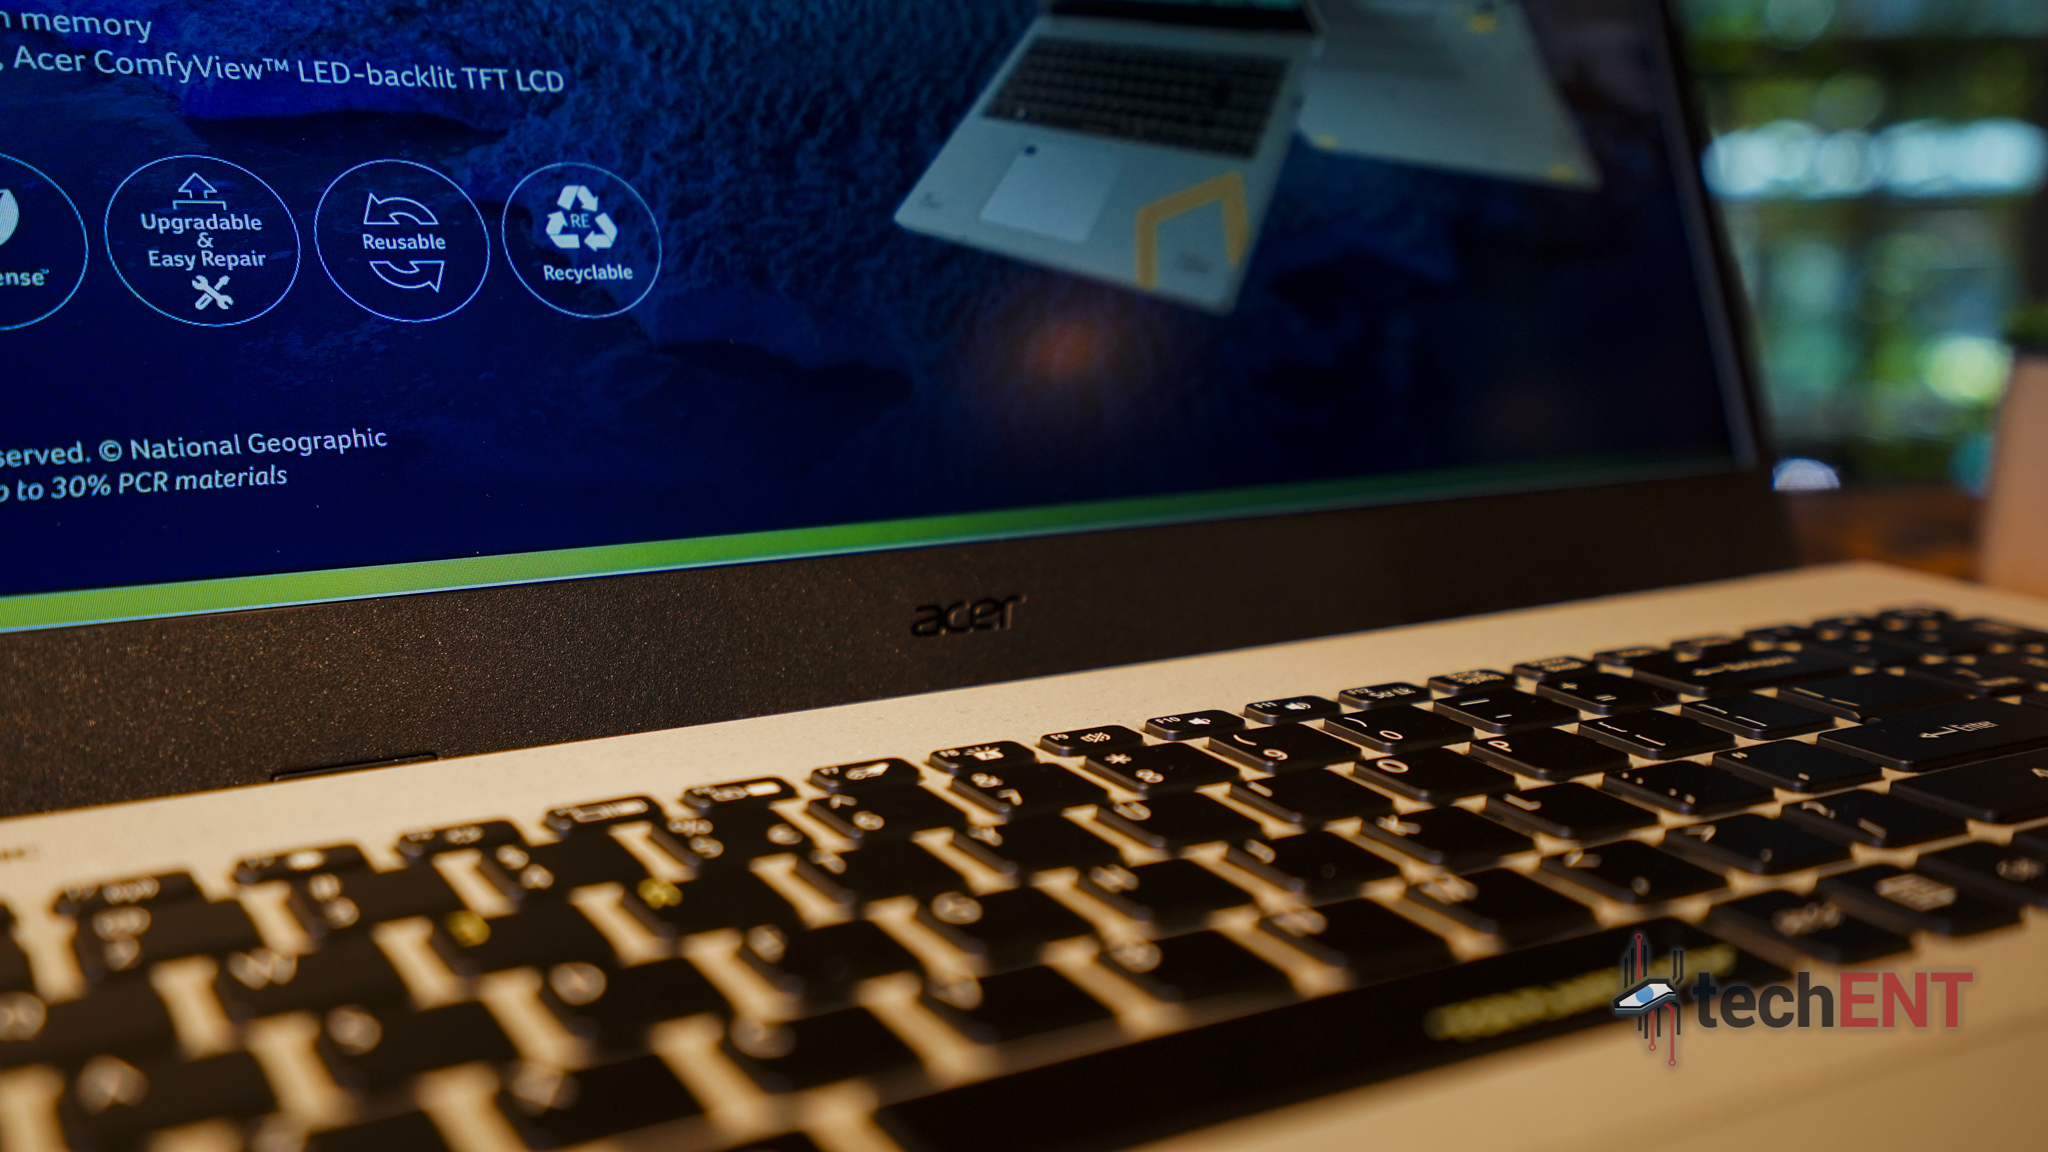
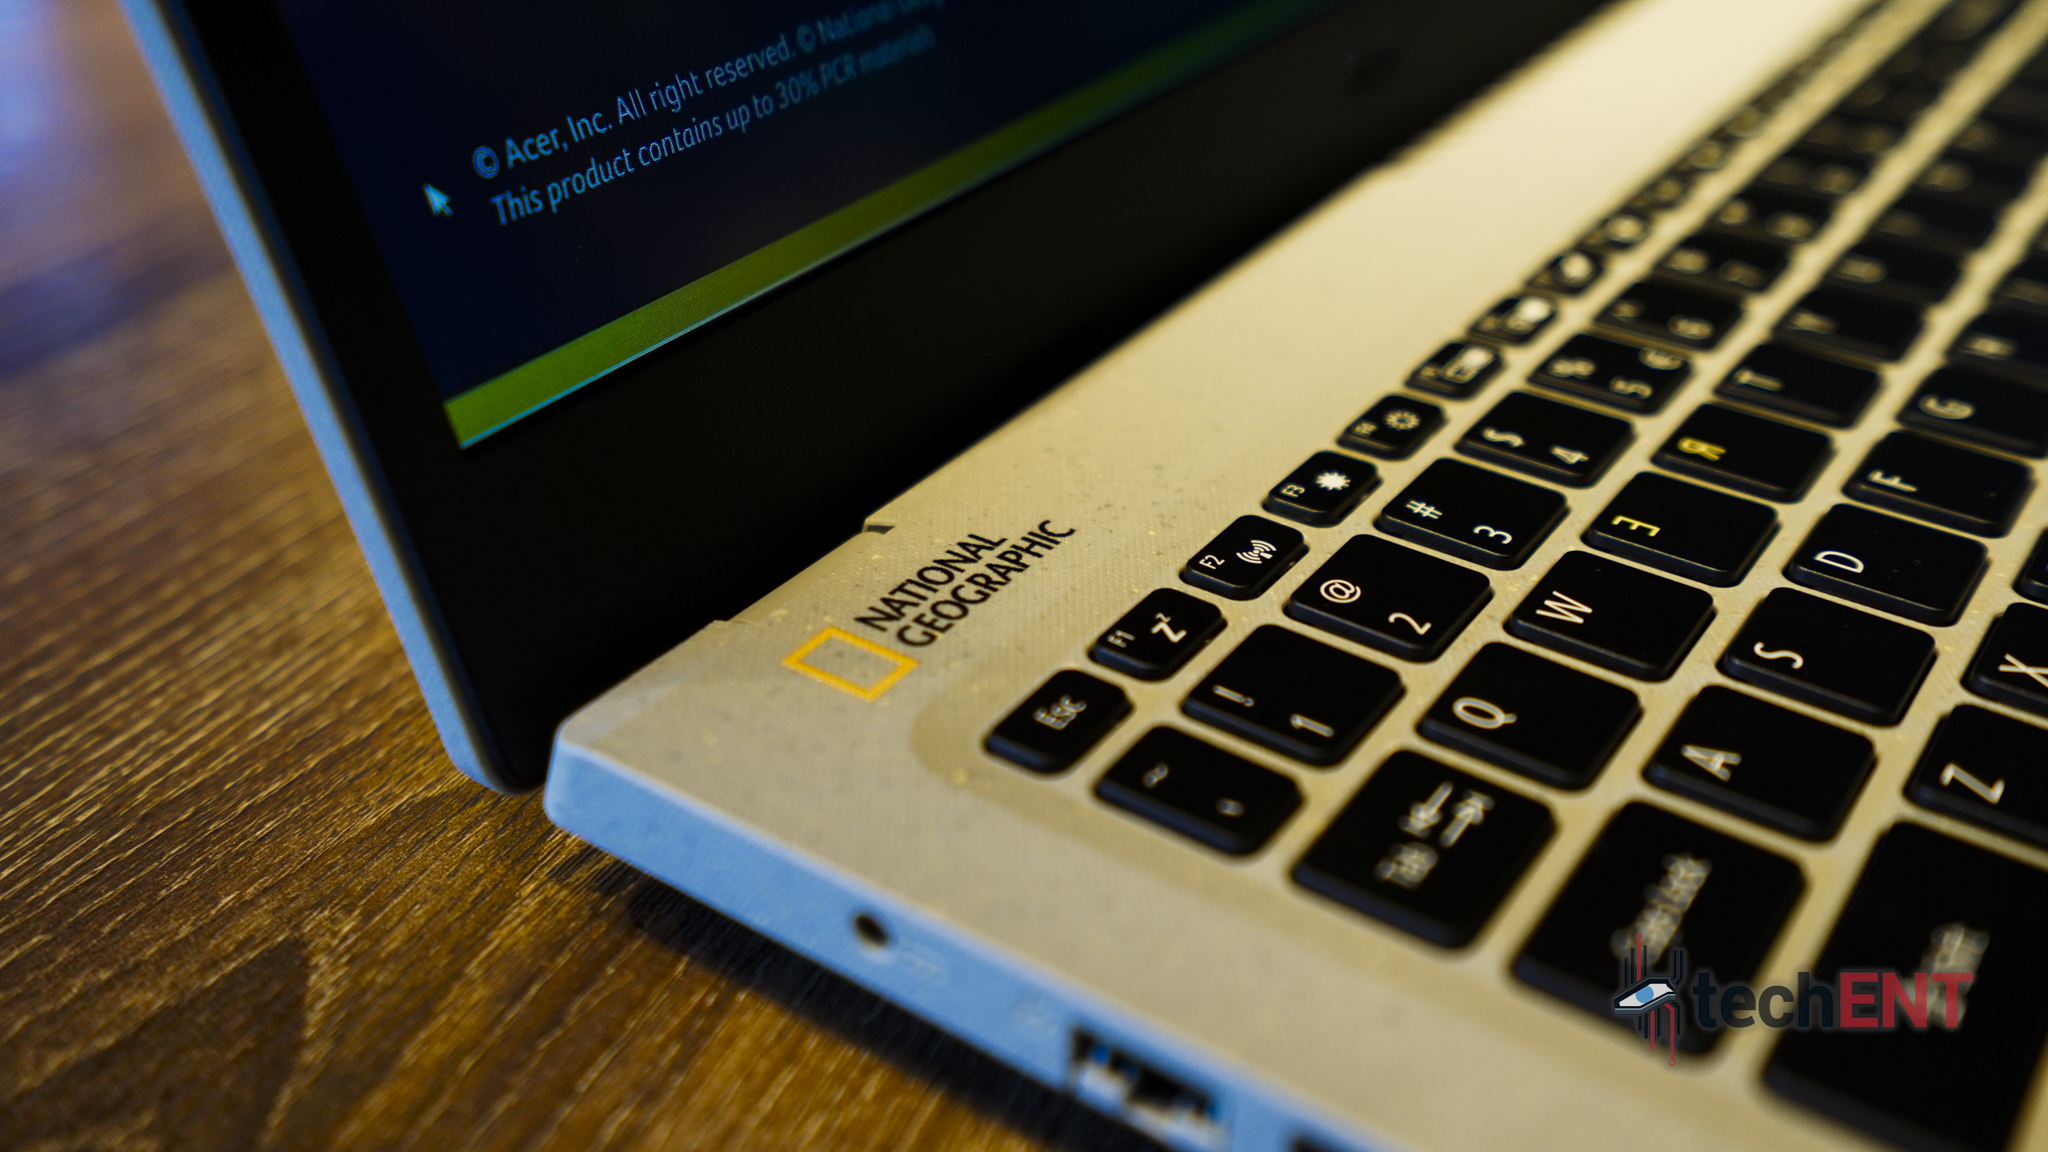
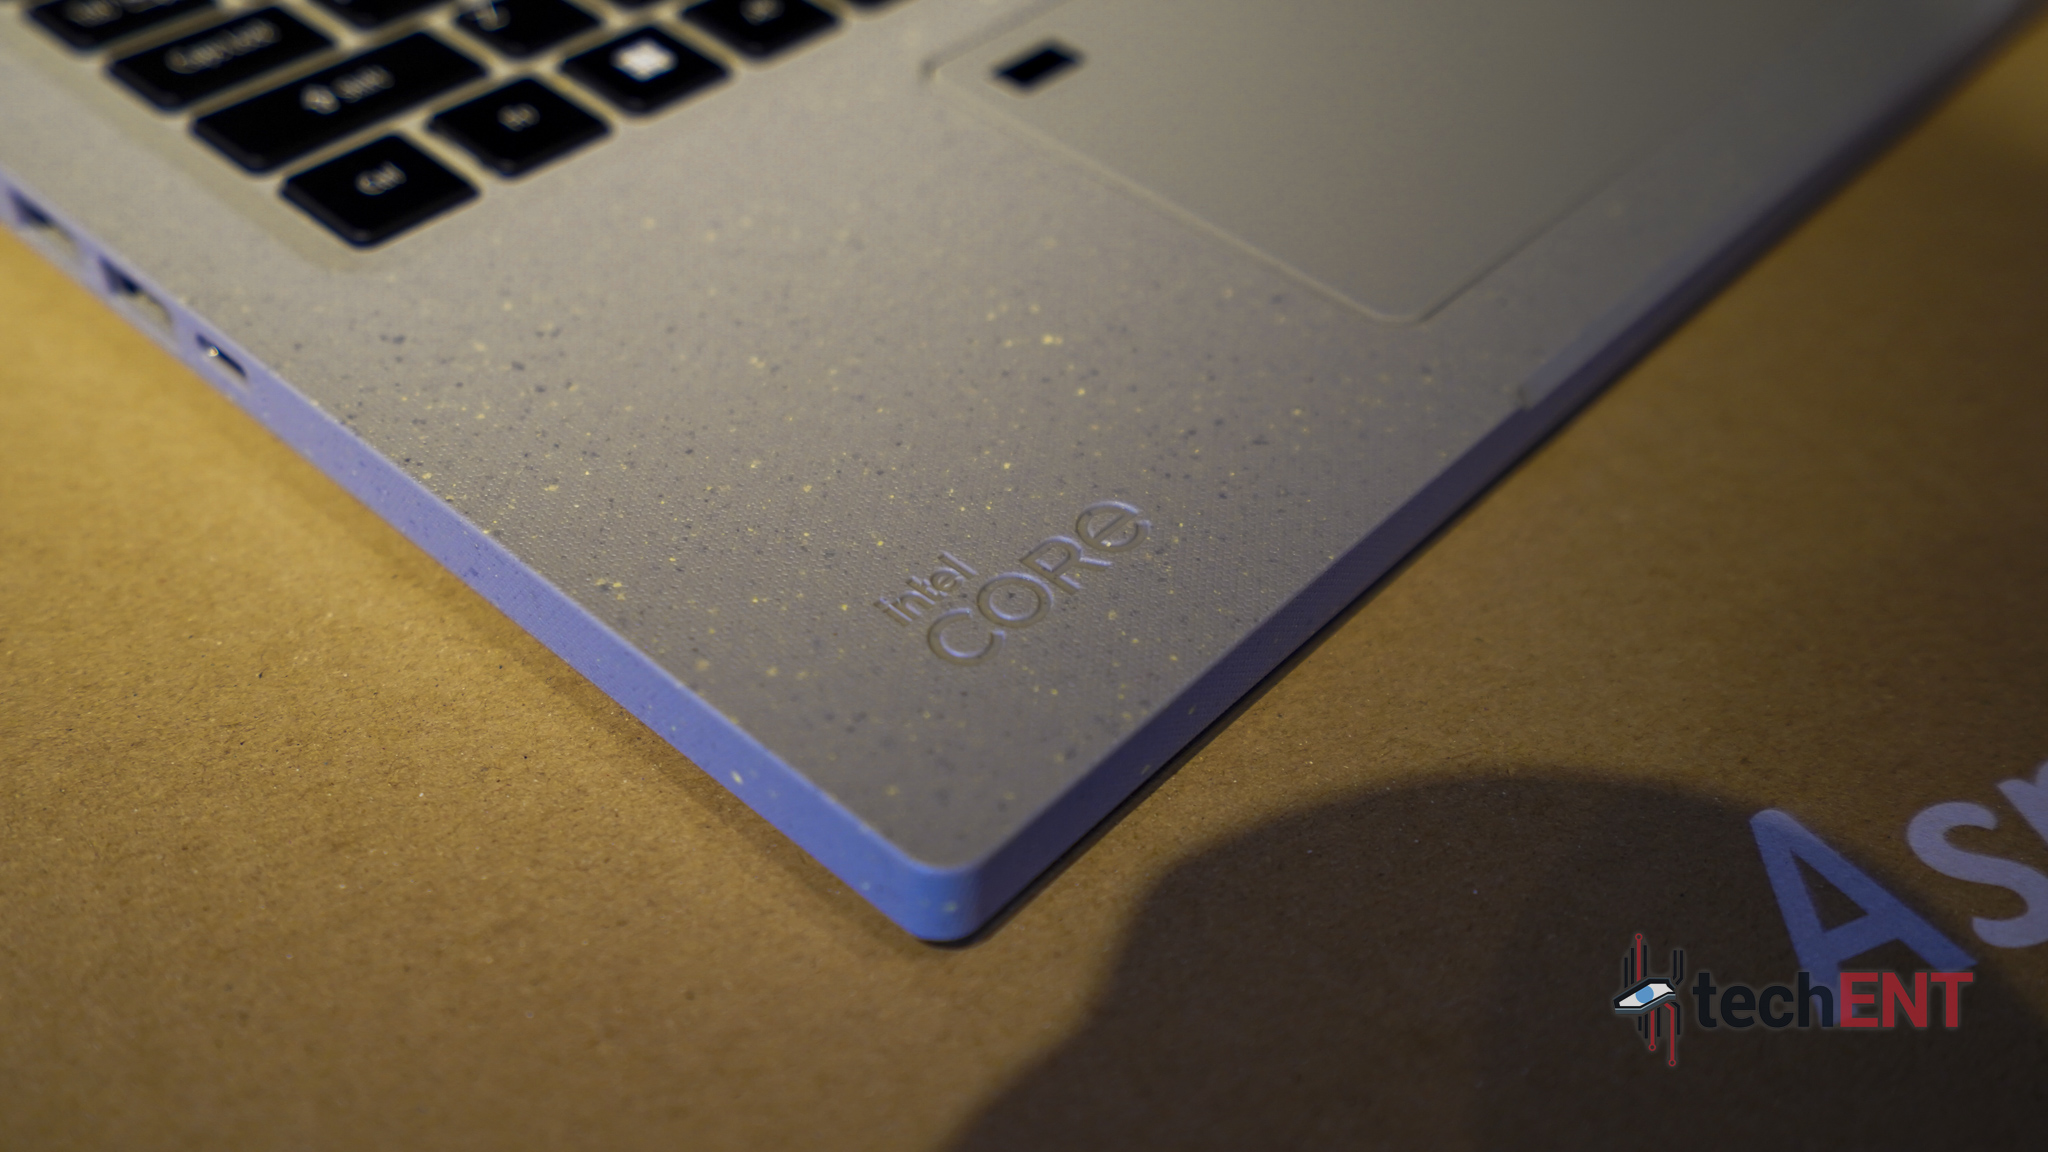
The Aspire Vero spearheads their new effort with the company using a substantial amount of recycled and repurposed materials. In fact, Acer was one of the first companies to openly share that they are using up to 50% post-consumer recycled (PCR) plastics in components like keycaps and the body of the Aspire Vero.

ACER AspVer NatGeoEd 22

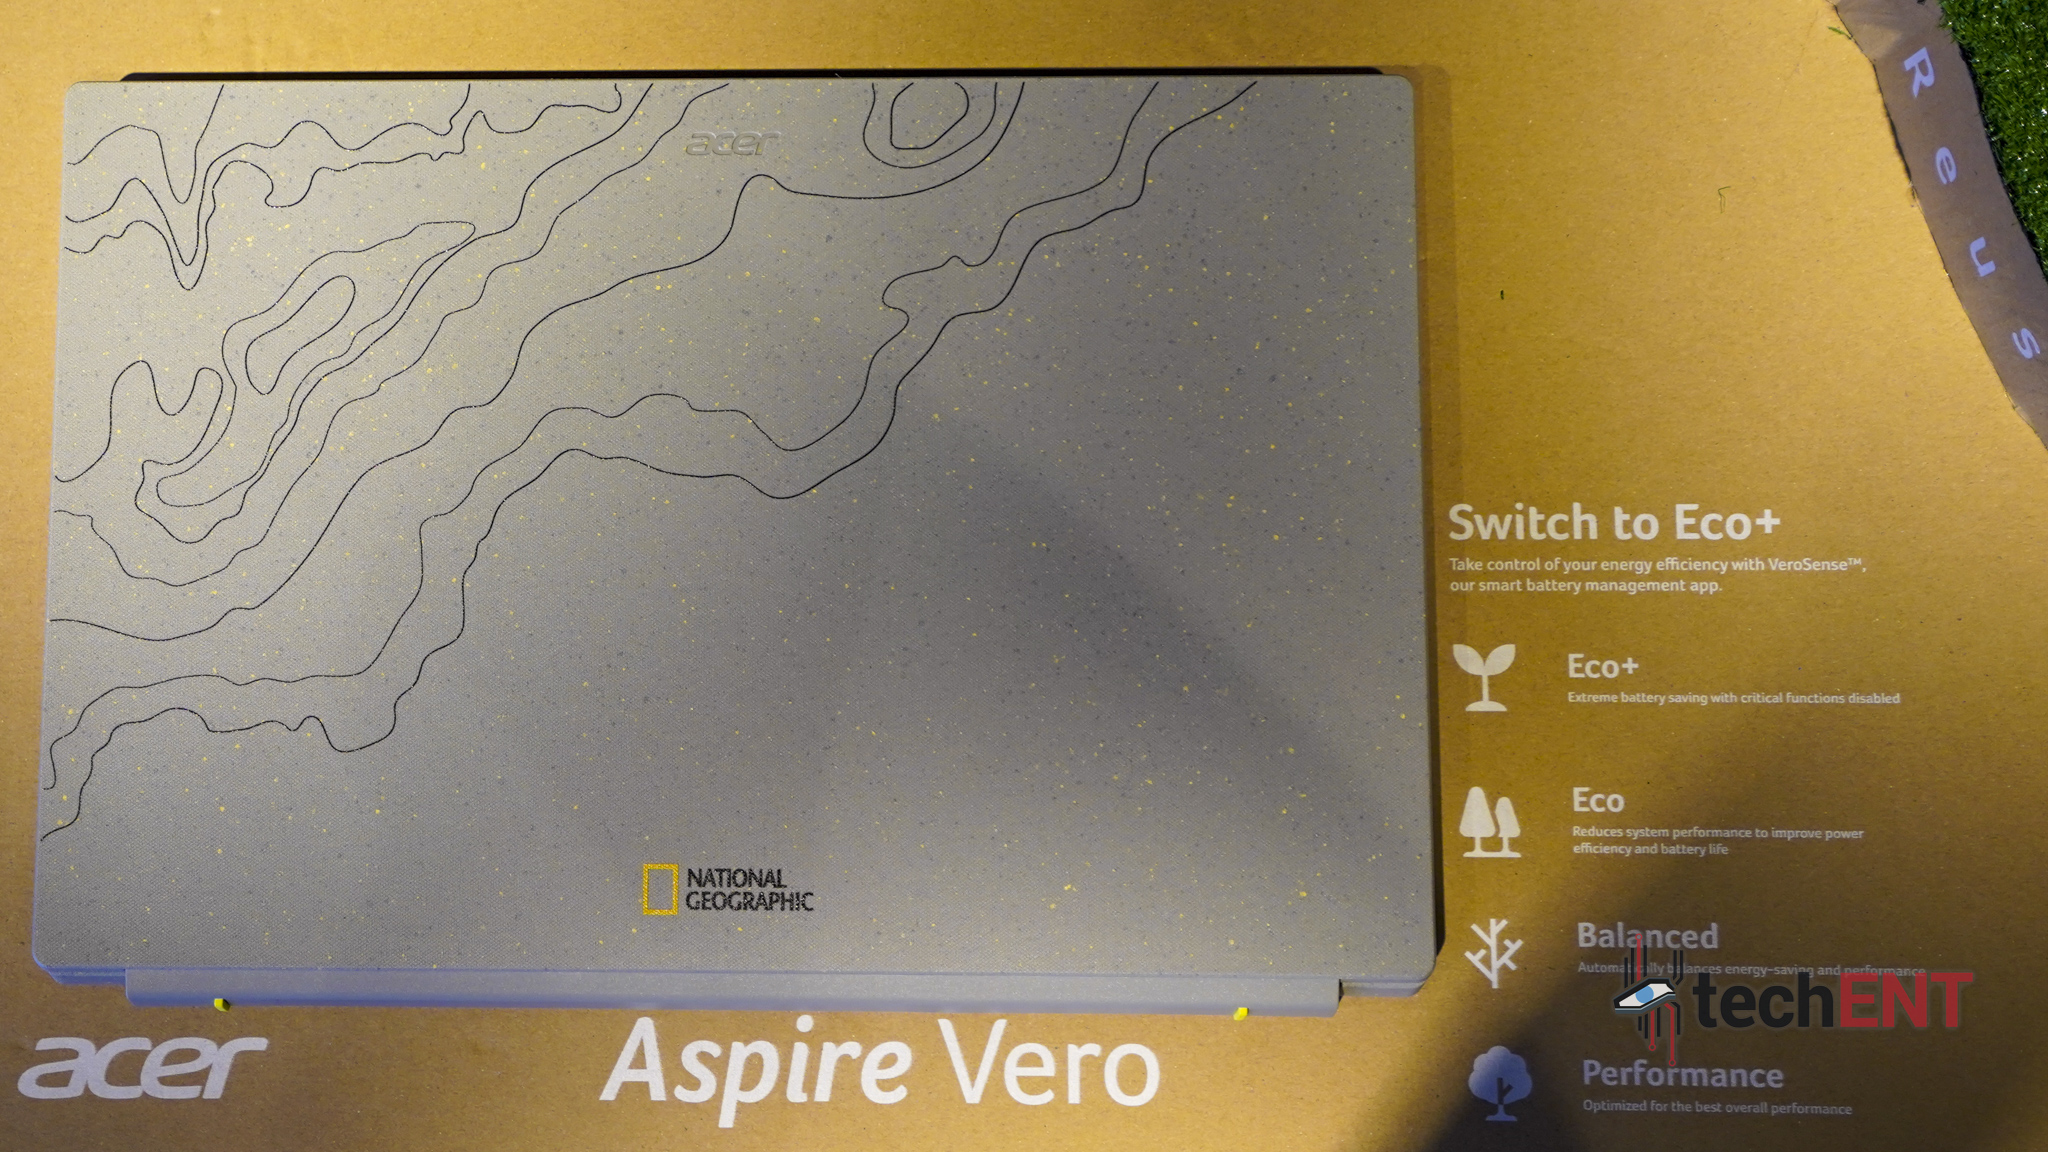
Of course, using these materials was only the beginning. Extending the reach of their Earthion, Acer has partnered with the National Geographic Society. In their partnership, the Acer Aspire Vero was given a special design with signature National Geographic accents. The Aspire Vero National Geographic Edition comes in a brighter white with the signature National Geographic yellow square. This new edition of the Aspire Vero is now available for pre-order in Malaysia. It will be priced at MYR4,299. Acer Malaysia will be channelling MYR100 from every purchase of the laptop to fund tree adoption. This comes in addition to the percentage being channelled to through the National Geographic Society to fund conservation efforts the world over.

In addition to this, Acer Malaysia is making available a trade-in programme in which you will be able to get up to MYR500 for your older devices. The programme is open to all working and non-functioning tablets, laptops, desktops and All-in-One desktops. Of course, like other programmes out there, the items will be evaluated and priced after which you will be entitled to up to an MYR500 cash rebate.

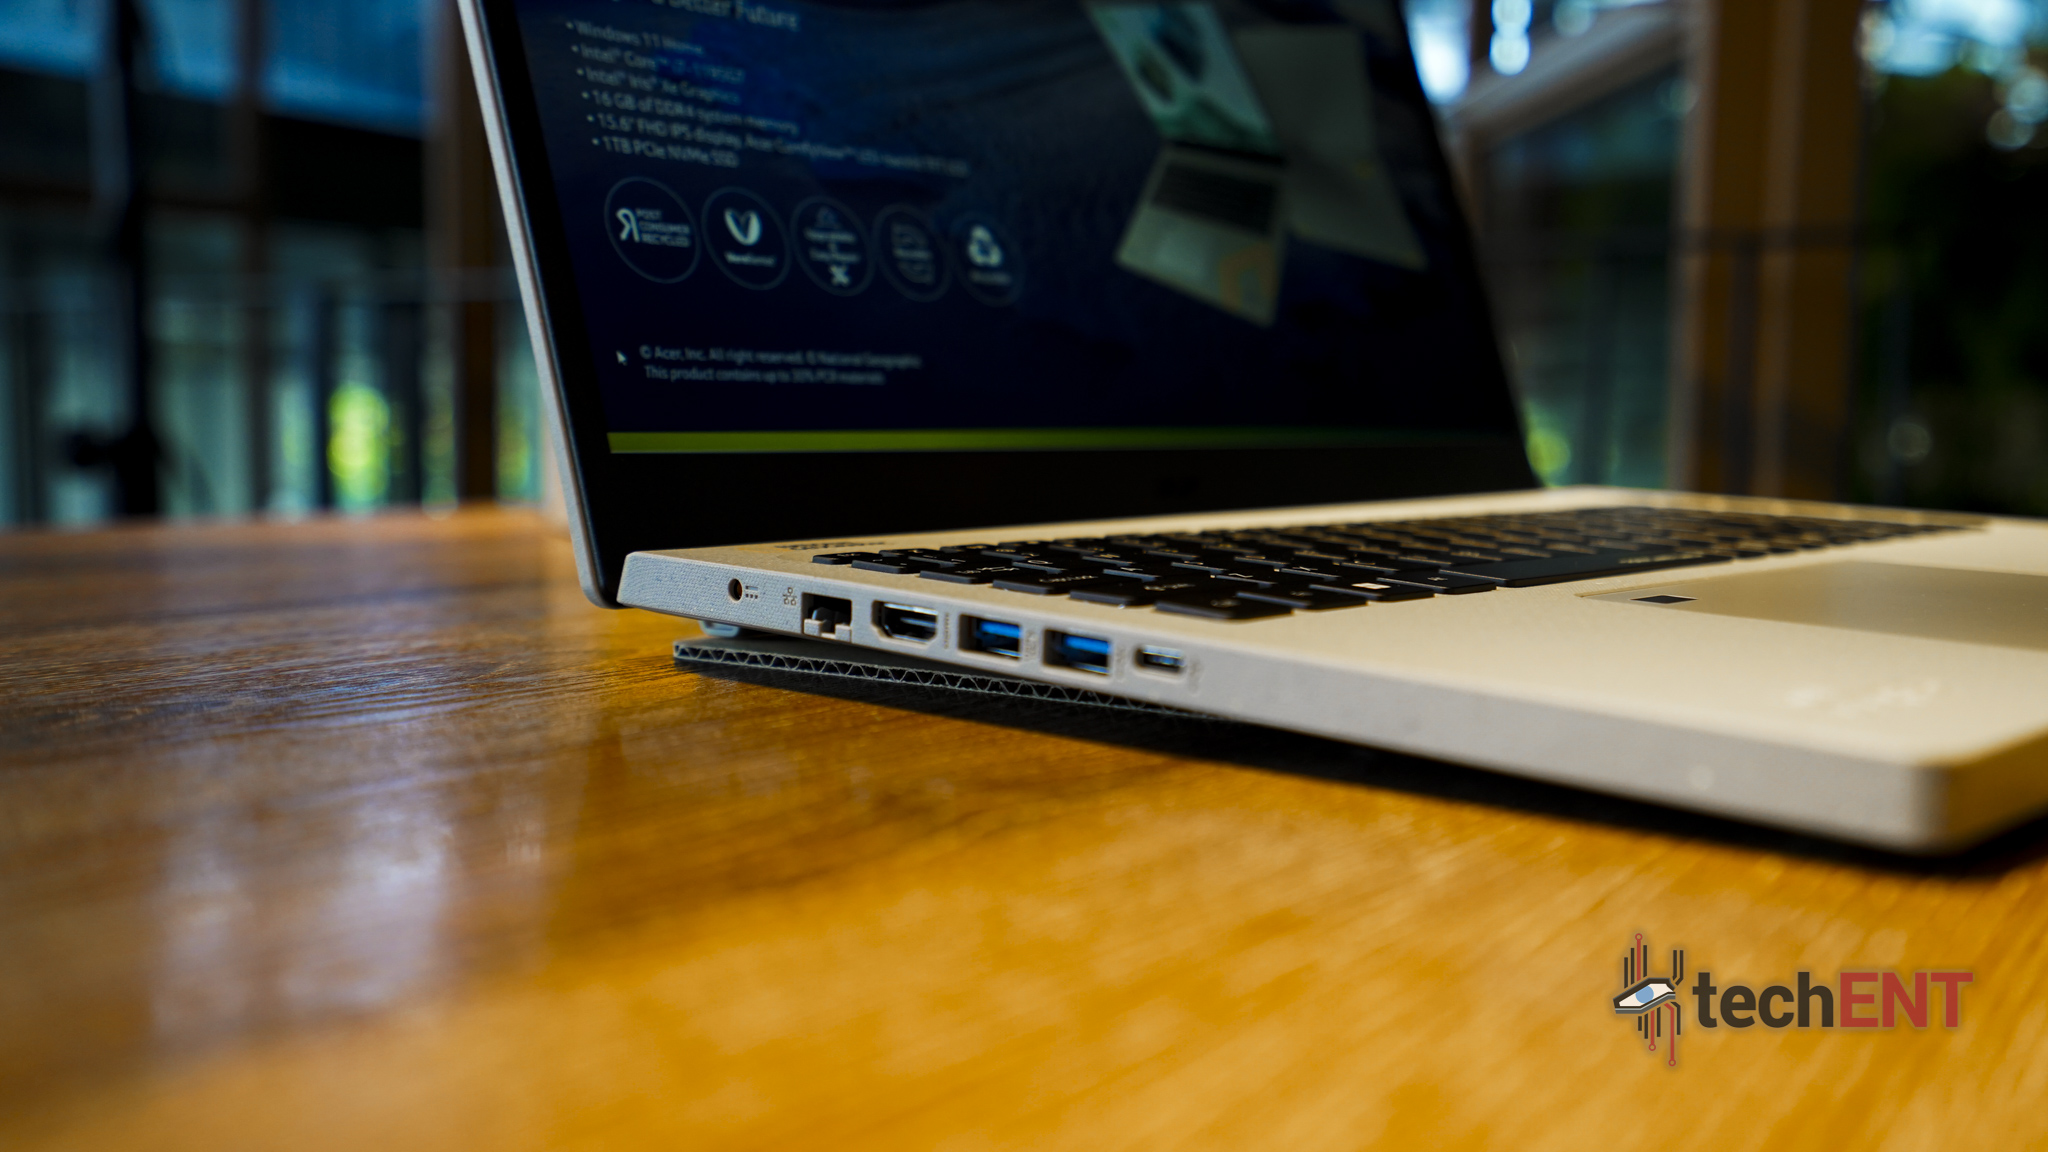
The Acer Aspire Vero National Geographic Edition isn’t an underpowered laptop pushing a premium cause of its conservation efforts. It actually comes with the specifications that allow it to be a productivity tool for everyone. It’s equipped with an 11th Generation Intel Core i7 with Intel Xe Graphics. It also jas 16GB of RAM and 1TB of PCIe NVMe SSD. The Aspire Vero is also equipped with a full array of ports including an HDMI, 2 USB-A, a USB-C, a 3.5mm combo audio jack and even an ethernet port. It’s relatively lightweight coming in at only 1.8kg and has a 2-year local warranty with an international traveller’s warranty for the first year.

  • ACER AspVer NatGeoEd 25
  • ACER AspVer NatGeoEd 24
  • ACER AspVer NatGeoEd 23
  • ACER AspVer NatGeoEd 20
  • ACER AspVer NatGeoEd 19
  • ACER AspVer NatGeoEd 18
  • ACER AspVer NatGeoEd 7
  • ACER AspVer NatGeoEd 14
  • ACER AspVer NatGeoEd 13
  • ACER AspVer NatGeoEd 15
  • ACER AspVer NatGeoEd 12
  • ACER AspVer NatGeoEd 3
  • ACER AspVer NatGeoEd 8

In addition to the announcement of the National Geographic Edition, Acer Malaysia also announced new pricing for the regular Acer Aspire Vero. It is now available for MYR3,699 for the i7 version and MYR2,999 for the i5 version.

New Oriental Announces Results for the Third Fiscal Quarter Ended February 28, 2022

BEIJING, April 26, 2022 /PRNewswire/ — New Oriental Education & Technology Group Inc. (the “Company” or “New Oriental”) (NYSE: EDU/ 9901.SEHK), a provider of private educational services in China, today announced its unaudited financial results for the third fiscal quarter ended February 28, 2022, which is the third quarter of New Oriental’s fiscal year 2022.   

Financial Highlights for the Third Fiscal Quarter Ended February 28, 2022

  • Total net revenues decreased by 48.4% year-over-year to US$614.1 million for the third fiscal quarter of 2022.
  • Operating loss was US$141.2 million for the third fiscal quarter of 2022, compared to an income of US$101.5 million in the same period of the prior fiscal year.
  • Net loss attributable to New Oriental was US$122.4 million for the third fiscal quarter of 2022, compared to an income of US$151.3 million in the same period of the prior fiscal year.

Key Financial Results

(in thousands US$, except per ADS(1) data)

3Q FY2022

3Q FY2021

% of change

Net revenues

614,091

1,190,498

-48.4%

Operating (loss) / income

(141,194)

101,470

-239.1%

Non-GAAP operating (loss) / income (2)(3)

(111,232)

115,892

-196.0%

Net (loss) / income attributable to New Oriental

(122,439)

151,326

-180.9%

Non-GAAP net (loss) / income attributable to New Oriental (2)(3)

(95,503)

163,236

-158.5%

Net (loss) / income per ADS attributable to New Oriental – basic

(0.72)

0.90

-180.6%

Net (loss) / income per ADS attributable to New Oriental – diluted

(0.72)

0.89

-180.8%

Non-GAAP net (loss) / income per ADS attributable to New Oriental –
basic(3)(4)

(0.56)

0.97

-158.3%

Non-GAAP net (loss) / income per ADS attributable to New Oriental –
diluted(3)(4)

(0.56)

0.96

-158.4%

(in thousands US$, except per ADS(1) data)

9M FY2022

9M FY2021

% of change

Net revenues

2,581,223

3,064,553

-15.8%

Operating (loss) / income

(876,864)

219,628

-499.2%

Non-GAAP operating (loss) / income (2)(3)

(772,680)

268,363

-387.9%

Net (loss) / income attributable to New Oriental

(998,419)

379,880

-362.8%

Non-GAAP net (loss) / income attributable to New Oriental (2)(3)

(885,899)

416,902

-312.5%

Net (loss) / income per ADS attributable to New Oriental – basic

(5.89)

2.33

-352.6%

Net (loss) / income per ADS attributable to New Oriental – diluted

(5.89)

2.32

-353.7%

Non-GAAP net (loss) / income per ADS attributable to New Oriental –
basic(3)(4)

(5.22)

2.56

-304.3%

Non-GAAP net (loss) / income per ADS attributable to New Oriental –
diluted(3)(4)

(5.22)

2.55

-305.1%

(1)  Each ADS represents ten common shares. The Hong Kong-listed shares are fully fungible with the ADSs listed on
      NYSE. The weighted average number of ADS and earnings per ADS have been retrospectively adjusted to reflect
      the ADS ratio change from one ADS representing one common share to one ADS representing ten common
      shares, which became effective on April 8, 2022.

(2)  GAAP represents Generally Accepted Accounting Principles in the United States of America.

(3)  New Oriental provides net (loss) / income attributable to New Oriental, operating (loss) / income and net (loss) /
      income per ADS attributable to New Oriental on a
non-GAAP basis that excludes share-based compensation
      expenses and gain / (loss) from fair value change of investments to provide supplemental information regarding its
      operating performance. For more information on these
non-GAAP financial measures, please see the section
      captioned “About
Non-GAAP Financial Measures” and the tables captioned “Reconciliations of Non-GAAP 
      Measures to the Most Comparable GAAP Measures” set forth at the end of this release.

(4)  The Non-GAAP net (loss) / income per ADS attributable to New Oriental is computed using Non-GAAP net (loss) /
      income attributable to New Oriental and the same number of shares and
ADSs used in GAAP basic and diluted
      EPS calculation.

Operating Highlights for the Third Fiscal Quarter Ended February 28, 2022

  • The total number of schools and learning centers was 847 as of February 28, 2022, a decrease of 778 and 822 compared to 1,625 as of February 28, 2021 and 1,669 as of May 31, 2021, respectively. The total number of schools was 111 as of February 28, 2022.

Michael Yu, New Oriental’s Executive Chairman, commented, “Although the Company is in a restructuring phase, we are pleased to see a promising trend in our remaining key businesses and a positive momentum across many of our new initiatives. In the first nine months of the current fiscal year, our remaining key business, the overseas test preparation and overseas study consulting business increased by 15% year-over-year. Our domestic test preparation business targeting adults and university students recorded a rapid growth of approximately 59% year-over-year. Simultaneously, we are actively exploring various new business opportunities, including non-academic tutoring, intelligent learning system and devices, study tour and research camp, educational materials and digitalized smart study solutions, as well as exam preparation courses designed for students with junior college diplomas to obtain bachelor’s degrees. These new businesses are at their early stage but we firmly believe they present a bright future for the Company, and we are confident that by leveraging our brand recognition and educational resources accumulated over our operating history, these new businesses will start to contribute meaningful revenue from the next fiscal year.”

Chenggang Zhou, New Oriental’s Chief Executive Officer, added, “During the last two fiscal quarters, we have largely completed our restructuring of businesses and operations to comply with the government policies in China. The total number of schools and learning centers was reduced to 847 by end of this fiscal quarter. Looking ahead, we will continue our efforts in developing and revamping our online-merge-offline teaching platform, and keep leveraging our educational infrastructure and technology strength across our remaining key businesses and new initiatives to provide more advanced and diversified educational services to our customers of all ages. Our pure online education platform, Koolearn.com, continued to expand online educational offerings to adults and university students, and actively seek business opportunities in new areas, including livestream commerce business, institutional cooperation and new intelligent learning innovations.”

Stephen Zhihui Yang, New Oriental’s Executive President and Chief Financial Officer, commented, ” We maintained a strong cash position throughout the whole restructuring process. By the end of this quarter, our cash and cash equivalents, term deposits and short-term investments totaled approximately US$4.4 billion. In the first half of this fiscal year, the Company incurred considerable costs due to the termination of lease agreements in relation to the closure of its learning centers and employee layoffs. We believe that the loss caused by the restructuring is temporary. We are confident in the sustainable profitability of all our remaining key businesses, as well as the growth and profit potential of our new initiatives. The Company’s management team will continue to work together to seek profitable growth. Our continued commitment to high quality services and operational efficiency will generate more values to our customers, society and shareholders over the long term.”

Financial Results for the Third Fiscal Quarter Ended February 28, 2022

Net Revenues

For the third fiscal quarter of 2022, New Oriental reported net revenues of US$614.1 million, representing a 48.4% decrease year-over-year. Net revenues from educational programs and services for the third fiscal quarter were US$506.4 million, representing a 54.1% decrease year-over-year. The decline was mainly due to the cessation of K-9 academic after-school tutoring services in order to comply with the government policies in China.

Operating Costs and Expenses

Operating costs and expenses for the quarter were US$755.3 million, representing a 30.6% decrease year-over-year. Non-GAAP operating costs and expenses for the quarter, which exclude share-based compensation expenses, were US$725.3 million, representing a 32.5% decrease year-over-year. The decrease was primarily due to the reduction of facilities and number of staff as a result of the restructuring in the last two fiscal quarters.   

  • Cost of revenues decreased by 30.9% year-over-year to US$372.7 million.
  • Selling and marketing expenses decreased by 40.0% year-over-year to US$93.7 million.
  • General and administrative expenses for the quarter decreased by 26.6% year-over-year to US$288.8 million. Non-GAAP general and administrative expenses, which exclude share-based compensation expenses, were US$259.6 million, representing a 32.3% decrease year-over-year.

Total share-based compensation expenses, which were allocated to related operating costs and expenses, increased by 107.8% to US$30.0 million in the third fiscal quarter of 2022. The increase is due to the grants of restricted share units of the Company to employees and directors in May 2021 with graded vesting over three years.

Operating Loss / Income and Operating Margin

Operating loss was US$141.2 million, compared to an income of US$101.5 million in the same period of the prior fiscal year. Non-GAAP loss from operations for the quarter was US$111.2 million, compared to an income of US$115.9 million in the same period of the prior fiscal year.

Operating margin for the quarter was negative 23.0%, compared to 8.5% in the same period of the prior fiscal year. Non-GAAP operating margin, which excludes share-based compensation expenses, for the quarter was negative 18.1%, compared to 9.7% in the same period of the prior fiscal year.

Net Loss / Income and Net Loss per ADS

Net loss attributable to New Oriental for the quarter was US$122.4 million, compared to an income of US$151.3 million in the same period of the prior fiscal year. Basic and diluted net loss per ADS attributable to New Oriental were US$0.72 and US$0.72, respectively.

Non-GAAP Net Loss / Income and Non-GAAP Net Loss per ADS

Non-GAAP net loss attributable to New Oriental for the quarter was US$95.5 million, compared to an income of US$163.2 million in the same period of the prior fiscal year. Non-GAAP basic and diluted net loss per ADS attributable to New Oriental were US$0.56 and US$0.56, respectively.

Cash Flow

Net operating cash outflow for the third fiscal quarter of 2022 was approximately US$235.0 million and capital expenditures for the quarter were US$37.4 million.

Balance Sheet

As of February 28, 2022, New Oriental had cash and cash equivalents of US$1,466.8 million. In addition, the Company had US$915.1 million in term deposits and US$2,028.1 million in short-term investment.

New Oriental’s deferred revenue balance, which is cash collected from registered students for courses and recognized proportionally as revenue as the instructions are delivered, at the end of the third quarter of fiscal year 2022 was US$971.3 million, a decrease of 47.9% as compared to US$1,865.7 million at the end of the third quarter of fiscal year 2021. The decrease is primarily due to the cessation of K-9 academic after-school tutoring services in order to comply with the government policies in China. 

Financial Results for the Nine Months Ended February 28, 2022

For the first nine months of fiscal year 2022, New Oriental reported net revenues of 2,581.2 million, representing a 15.8% decrease year-over-year.

Loss from operations for the first nine months of fiscal year 2022 was US$876.9 million, compared to an income of US$219.6 million in the same period of the prior fiscal year. Non-GAAP loss from operations for the first nine months of fiscal year 2022 was US$772.7 million, compared to an income of US$268.4 million in the same period of the prior fiscal year.

Operating margin for the first nine months of fiscal year 2022 was negative 34.0%, compared to 7.2% for the same period of the prior fiscal year. Non-GAAP operating margin, which excludes share-based compensation expenses for the first nine months of fiscal year 2022, was negative 29.9%, compared to 8.8% for the same period of the prior fiscal year.

Net loss attributable to New Oriental for the first nine months of fiscal year 2022 was US$998.4 million, compared to an income of US$379.9 million in the same period of the prior fiscal year. Basic and diluted net loss per ADS attributable to New Oriental for the first nine months of fiscal year 2022 amounted to US$5.89 and US$5.89, respectively.

Non-GAAP net loss attributable to New Oriental for the first nine months of fiscal year 2022 was US$885.9 million, compared to an income of US$416.9 million in the same period of the prior fiscal year. Non-GAAP basic and diluted net loss per ADS attributable to New Oriental for the first nine months of fiscal year 2022 amounted to US$5.22 and US$5.22, respectively.

Conference Call Information

New Oriental’s management will host an earnings conference call at 8 AM on April 26, 2022, U.S. Eastern Time (8 PM on April 26, 2022, Beijing/Hong Kong Time). Participants can join the conference using the below options:

Dialling-in to the conference call:

Please register in advance of the conference, using the link provided below. Upon registering, you will be provided with participant dial-in numbers, passcode and unique registrant ID.

Conference call registration link: http://apac.directeventreg.com/registration/event/7678797. It will automatically direct you to the registration page of “New Oriental Third Fiscal Quarter 2022 Earnings Conference Call” where you may fill in your details for RSVP. If it requires you to enter a participant conference ID, please enter “7678797”.

In the 10 minutes prior to the call start time, you may use the conference access information (including dial in number(s), direct event passcode and registrant ID) provided in the confirmation email received at the point of registering.

Joining the conference call via a live webcast:

Additionally, a live and archived webcast of the conference call will be available at http://investor.neworiental.org.

Listening to the conference call replay:

A replay of the conference call may be accessed by phone at the following number until May 4, 2022:

International:

+61 2 90034211

Passcode: 

7678797

About New Oriental

New Oriental is a provider of private educational services in China offering a wide range of educational programs, services and products to a varied student population throughout China. New Oriental’s program, service and product offerings mainly consist of test preparation, language training for adults, education materials and distribution, online education, and other services. New Oriental is listed on NYSE (NYSE: EDU) and SEHK (9901.SEHK), respectively. New Oriental’s ADSs, each of which represents ten common shares. The Hong Kong-listed shares are fully fungible with the ADSs listed on NYSE.

For more information about New Oriental, please visit http://www.neworiental.org/english/.

Safe Harbor Statement

This announcement contains forward-looking statements. These statements are made under the “safe harbor” provisions of the U.S. Private Securities Litigation Reform Act of 1995. These forward-looking statements can be identified by terminology such as “will,” “expects,” “anticipates,” “future,” “intends,” “plans,” “believes,” “estimates” and similar statements. Among other things, the quotations from management in this announcement, as well as New Oriental’s strategic and operational plans, contain forward-looking statements. New Oriental may also make written or oral forward-looking statements in its reports filed or furnished to the U.S. Securities and Exchange Commission, in its annual reports to shareholders, in press releases and other written materials and in oral statements made by its officers, directors or employees to third parties. Statements that are not historical facts, including statements about New Oriental’s beliefs and expectations, are forward-looking statements. Forward-looking statements involve inherent risks and uncertainties. A number of factors could cause actual results to differ materially from those contained in any forward-looking statement, including but not limited to the following: our ability to attract students without a significant decrease in course fees; our ability to continue to hire, train and retain qualified teachers; our ability to maintain and enhance our “New Oriental” brand; our ability to effectively and efficiently manage the expansion of our school network and successfully execute our growth strategy; the outcome of ongoing, or any future, litigation or arbitration, including those relating to copyright and other intellectual property rights; competition in the private education sector in China; changes in our revenues and certain cost or expense items as a percentage of our revenues; the expected growth of the Chinese private education market; Chinese governmental policies relating to private educational services and providers of such services; health epidemics and other outbreaks in China; and general economic conditions in China. Further information regarding these and other risks is included in our annual report on Form 20-F and other documents filed with the Securities and Exchange Commission. New Oriental does not undertake any obligation to update any forward-looking statement, except as required under applicable law. All information provided in this press release and in the attachments is as of the date of this press release, and New Oriental undertakes no duty to update such information, except as required under applicable law.

About Non-GAAP Financial Measures

To supplement New Oriental’s consolidated financial results presented in accordance with GAAP, New Oriental uses the following measures defined as non-GAAP financial measures by the SEC: net income / (loss) excluding share-based compensation expenses and gain / (loss) from fair value change of long-term investments, operating income / (loss) excluding share-based compensation expenses, operating cost and expenses excluding share-based compensation expenses, general and administrative expenses excluding share-based compensation expenses, operating margin excluding share-based compensation expenses, and basic and diluted net income / (loss) per ADS and per share excluding share-based compensation expenses and gain / (loss) from fair value change of long-term investments. The presentation of these non-GAAP financial measures is not intended to be considered in isolation or as a substitute for the financial information prepared and presented in accordance with GAAP. For more information on these non-GAAP financial measures, please see the tables captioned “Reconciliations of non-GAAP measures to the most comparable GAAP measures” set forth at the end of this release.

New Oriental believes that these non-GAAP financial measures provide meaningful supplemental information regarding its performance and liquidity by excluding share-based compensation expenses and gain / (loss) from fair value change of long-term investments that may not be indicative of its operating performance from a cash perspective. New Oriental believes that both management and investors benefit from referring to these non-GAAP financial measures in assessing its performance and when planning and forecasting future periods. These non-GAAP financial measures also facilitate management’s internal comparisons to New Oriental’s historical performance and liquidity. New Oriental believes these non-GAAP financial measures are useful to investors in allowing for greater transparency with respect to supplemental information used by management in its financial and operational decision making. A limitation of using these non-GAAP measures is that they exclude share-based compensation expenses and gain / (loss) from fair value change of long-term investments that has been and will continue to be for the foreseeable future a significant recurring expense in our business. Management compensates for these limitations by providing specific information regarding the GAAP amounts excluded from each non-GAAP measure. The accompanying tables have more details on the reconciliations between GAAP financial measures that are most directly comparable to non-GAAP financial measures.

Contacts

For investor and media inquiries, please contact:

Ms. Sisi Zhao                                                                 Ms. Rita Fong
New Oriental Education and Technology Group Inc.     FTI Consulting                          

Tel:         +86-10-6260-5568                                          Tel:        +852 3768 4548                       
Email:     zhaosisi@xdf.cn                                             Email:    rita.fong@fticonsulting.com

NEW ORIENTAL EDUCATION & TECHNOLOGY GROUP INC.

CONDENSED CONSOLIDATED BALANCE SHEETS

(In thousands)

As of February 28

As of May 31

2022

2021

(Unaudited)

(Audited)

USD

USD

ASSETS:

Current assets:

   Cash and cash equivalents

1,466,779

1,612,211

   Term deposits

915,103

1,214,025

   Short-term investments

2,028,129

3,434,726

   Accounts receivable, net

14,314

8,667

   Inventory, net

30,732

31,175

   Prepaid expenses and other current assets, net

207,369

269,233

   Amounts due from related parties, current

29,628

4,118

Total current assets

4,692,054

6,574,155

   Restricted cash, non-current

44,463

19,916

   Property and equipment, net

516,938

865,030

   Land use rights, net

3,859

13,989

   Amounts due from related parties, non-current

1,687

4,157

   Long-term deposits

36,080

74,796

   Intangible assets, net

3,291

4,836

   Goodwill, net

73,757

73,254

   Long-term investments, net

582,703

537,749

   Deferred tax assets, non-current, net

18,675

103,587

   Right-of-use assets

688,234

1,857,533

   Other non-current assets

7,481

22,051

Total assets

6,669,222

10,151,053

LIABILITIES AND EQUITY

Current liabilities:

Accounts payable (including accounts payable of the consolidated variable interest entities without recourse to
New Oriental of  US$36,032 and US$25,108 as of May 31, 2021 and February 28,2022, respectively)

28,001

38,441

Accrued expenses and other current liabilities (including accrued expenses and other current liabilities of the
consolidated variable interest entities without recourse to New Oriental of  US$900,877 and US$601,432 as of
May 31, 2021 and February 28,2022, respectively)

602,470

908,231

Income taxes payable (including income tax payable of the consolidated variable interest entities without
recourse to New Oriental of US$46,248 and US$64,019 as of May 31, 2021 and February 28,2022, respectively)

72,528

84,321

Amounts due to related parties (including amounts due to related parties of the consolidated variable interest
entities without recourse to New Oriental of US$33 and US$21 as of May 31, 2021 and February 28, 2022,
respectively)

21

33

Deferred revenue (including deferred revenue of the consolidated variable interest entities without recourse to
New Oriental of US$1,923,007 and US$969,453 as of May 31, 2021 and February 28,2022, respectively)

971,255

1,926,386

Operating lease liability-current (including operating lease liabilities-current of the consolidated variable interest
entities without recourse to New Oriental of US$501,049 and US$210,787 as of May 31, 2021 and February
28, 2022, respectively)

215,660

514,033

Total current liabilities

1,889,935

3,471,445

Deferred tax liabilities, non-current (including deferred tax liabilities of the consolidated variable interest entities
without recourse to New Oriental of US$12,924 and US$18,269 as of May 31, 2021 and February 28, 2022,
respectively)

18,551

13,172

Unsecured senior notes (including unsecured senior notes of the consolidated variable interest entities without
recourse to the New Oriental of nil and nil as of May 31, 2021 and February 28, 2022, respectively)

113,174

297,631

Operating lease liabilities (including operating lease liabilities of the consolidated variable interest entities
without recourse to New Oriental of US$1,333,961 and US$534,881 as of May 31, 2021 and February 28, 2022,
respectively)

542,980

1,350,629

Total long-term liabilities

674,705

1,661,432

Total liabilities

2,564,640

5,132,877

Equity

    New Oriental Education & Technology Group Inc. shareholders’ equity

4,022,771

4,913,275

    Non-controlling interests

81,811

104,901

Total equity

4,104,582

5,018,176

Total liabilities and equity

6,669,222

10,151,053

NEW ORIENTAL EDUCATION & TECHNOLOGY GROUP INC.

CONDENSED CONSOLIDATED STATEMENTS OF OPERATIONS

(In thousands except for per share and per ADS amounts)

For the Three Months Ended February 28

2022

2021

(Unaudited)

(Unaudited)

USD

USD

Net revenues

614,091

1,190,498

Operating cost and expenses (note 1)

Cost of revenues

372,747

539,499

Selling and marketing

93,706

156,084

General and administrative

288,832

393,445

Total operating cost and expenses

755,285

1,089,028

Operating (loss)/income

(141,194)

101,470

Gain/(Loss) from fair value change of long-term investments

1,072

(2,443)

Other income, net

35,702

68,077

Provision for income taxes

(16,863)

(46,971)

(Loss)/Gain from equity method investments

(4,366)

6,509

Net (loss)/income

(125,649)

126,642

Add: Net loss attributable to non-controlling interests

3,210

24,684

Net (loss)/income attributable to New Oriental Education & Technology Group
Inc.’s shareholders

(122,439)

151,326

Net (loss)/income per share attributable to New Oriental-Basic (note 2)

(0.07)

0.09

Net (loss)/income per share attributable to New Oriental-Diluted (note 2)

(0.07)

0.09

Net (loss)/income per ADS attributable to New Oriental-Basic (note 2)

(0.72)

0.90

Net (loss)/income per ADS attributable to New Oriental-Diluted (note 2)

(0.72)

0.89

NEW ORIENTAL EDUCATION & TECHNOLOGY GROUP INC.

RECONCILIATION OF NON-GAAP MEASURES TO THE MOST COMPARABLE GAAP MEASURES

(In thousands except for per share and per ADS amounts)

For the Three Months Ended February 28

2022

2021

(Unaudited)

(Unaudited)

USD

USD

General and administrative expenses

288,832

393,445

Less: Share-based compensation expenses in general and
administrative expenses

29,222

10,108

Non-GAAP general and administrative expenses

259,610

383,337

Total operating cost and expenses

755,285

1,089,028

Less: Share-based compensation expenses

29,962

14,422

Non-GAAP operating cost and expenses

725,323

1,074,606

Operating (loss)/income

(141,194)

101,470

Add: Share-based compensation expenses

29,962

14,422

Non-GAAP operating (loss)/income

(111,232)

115,892

Operating margin

-23.0%

8.5%

Non-GAAP operating margin

-18.1%

9.7%

Net (loss)/income attributable to New Oriental

(122,439)

151,326

Add: Share-based compensation expenses

28,008

9,467

Less: Gain/(loss) from fair value change of long-term
investments

1,072

(2,443)

Non-GAAP net (loss)/income attributable to New Oriental

(95,503)

163,236

Net (loss)/income per ADS attributable to New Oriental – Basic
(note 2)

(0.72)

0.90

Net (loss)/income per ADS attributable to New Oriental –
Diluted (note 2)

(0.72)

0.89

Non-GAAP net (loss)/income per ADS attributable to New
Oriental – Basic (note 2)

(0.56)

0.97

Non-GAAP net (loss)/income per ADS attributable to New
Oriental – Diluted (note 2)

(0.56)

0.96

Weighted average shares used in calculating basic net
(loss)/income per ADS (note 2)

1,696,966,183

1,689,712,150

Weighted average shares used in calculating diluted net
(loss)/income per ADS (note 2)

1,696,966,183

1,695,315,497

Non-GAAP (loss)/income per share – basic

(0.06)

0.10

Non-GAAP (loss)/income per share – diluted

(0.06)

0.10

Notes:

Note 1: Share-based compensation expenses (in thousands) are included in the operating cost and expenses as follows:

For the Three Months Ended February 28

2022

2021

(Unaudited)

(Unaudited)

USD

USD

Cost of revenues

48

2,393

Selling and marketing

692

1,921

General and administrative

29,222

10,108

Total

29,962

14,422

NEW ORIENTAL EDUCATION & TECHNOLOGY GROUP INC.

CONDENSED CONSOLIDATED STATEMENTS OF CASH FLOWS

(In thousands)

For the Three Months Ended February 28

2022

2021

(Unaudited)

(Unaudited)

USD

USD

Net cash (used in)/provided by operating activities

(234,965)

23,314

Net cash provided by/(used in) investing activities

753,586

(1,122,254)

Net cash (used in)/provided by financing activities

(66,727)

13,364

Effect of exchange rate changes

9,218

23,644

Net change in cash, cash equivalents and restricted cash

461,112

(1,061,932)

Cash, cash equivalents and restricted cash at beginning of period

1,050,130

2,648,124

Cash, cash equivalents and restricted cash at end of period

1,511,242

1,586,192

NEW ORIENTAL EDUCATION & TECHNOLOGY GROUP INC.

CONDENSED CONSOLIDATED STATEMENTS OF OPERATIONS

(In thousands except for per share and per ADS amounts)

For the Nine Months Ended February 28

2022

2021

(Unaudited)

(Unaudited)

USD

USD

Net revenues

2,581,223

3,064,553

Operating costs and expenses (note 1):

   Cost of revenues

1,506,464

1,458,028

   Selling and marketing

371,109

406,555

   General and administrative

1,580,514

980,342

Total operating costs and expenses

3,458,087

2,844,925

Operating (loss)/income

(876,864)

219,628

Loss from fair value change of investments

(13,251)

(4,597)

Other income, net

33,344

195,578

Provision for income taxes

(130,694)

(112,910)

(Loss)/gain from equity method investments

(46,144)

7,556

Net (loss)/income

(1,033,609)

305,255

Add: Net loss attributable to non-controlling interests

35,190

74,625

Net (loss)/income attributable to New Oriental Education &
Technology Group Inc.

(998,419)

379,880

Net (loss)/income per share attributable to New Oriental-Basic
(note 2)

(0.59)

0.23

Net (loss)/income per share attributable to New Oriental-Diluted
(note 2)

(0.59)

0.23

Net (loss)/income per ADS attributable to New Oriental-Basic
(note 2)

(5.89)

2.33

Net (loss)/income per ADS attributable to New Oriental-Diluted
(note 2)

(5.89)

2.32

NEW ORIENTAL EDUCATION & TECHNOLOGY GROUP INC.

RECONCILIATION OF NON-GAAP MEASURES TO THE MOST COMPARABLE GAAP MEASURES

(In thousands except for per share and per ADS amounts)

For the Nine Months Ended February 28

2022

2021

(Unaudited)

(Unaudited)

USD

USD

General and administrative expenses

1,580,514

980,342

Less: Share-based compensation expenses in general and
administrative expenses

106,698

34,655

Non-GAAP general and administrative expenses

1,473,816

945,687

Total operating costs and expenses

3,458,087

2,844,925

Less: Share-based compensation expenses

104,184

48,735

Non-GAAP operating costs and expenses

3,353,903

2,796,190

Operating (loss)/income

(876,864)

219,628

Add: Share-based compensation expenses

104,184

48,735

Non-GAAP operating (loss)/income

(772,680)

268,363

Operating margin

-34.0%

7.2%

Non-GAAP operating margin

-29.9%

8.8%

Net (loss)/income attributable to New Oriental

(998,419)

379,880

Add: Share-based compensation expenses

99,269

32,425

Less: Loss from fair value change of long-term investments

(13,251)

(4,597)

Non-GAAP net (loss)/income to New Oriental

(885,899)

416,902

Net (loss)/income per ADS attributable to New Oriental-
Basic (note 2)

(5.89)

2.33

Net (loss)/income per ADS attributable to New Oriental-
Diluted (note 2)

(5.89)

2.32

Non-GAAP net (loss)/income per ADS attributable to New
Oriental – Basic (note 2)

(5.22)

2.56

Non-GAAP net (loss)/income per ADS attributable to New
Oriental – Diluted (note 2)

(5.22)

2.55

Weighted average shares used in calculating basic net
(loss)/income per ADS (note 2)

1,696,234,912

1,630,427,098

Weighted average shares used in calculating diluted net
(loss)/income per ADS (note 2)

1,696,234,912

1,637,074,362

Non-GAAP (loss)/income per share – basic

(0.52)

0.26

Non-GAAP (loss)/income per share – diluted

(0.52)

0.25

Notes:

Note 1: Share-based compensation expenses (in thousands) are included in the operating costs and expenses as follows:

For the Nine Months Ended February 28

2022

2021

(Unaudited)

(Unaudited)

USD

USD

Cost of revenues

(157)

6,229

Selling and marketing

(2,357)

7,851

General and administrative

106,698

34,655

Total

104,184

48,735

Note 2: Each ADS represents ten common shares. For the three and nine months ended February 28, 2021,
the weighted average number of ADS and earnings per ADS have been retrospectively adjusted to reflect the
ADS ratio change from each ADS representing one common share to each ADS representing ten common
shares, which became effective on April 8, 2022.

NEW ORIENTAL EDUCATION & TECHNOLOGY GROUP INC.

CONDENSED CONSOLIDATED STATEMENTS OF CASH FLOWS

(In thousands)

For the Nine Months Ended February 28

2022

2021

(Unaudited)

(Unaudited)

USD

USD

Net cash (used in)/provided by operating activities

(1,309,800)

825,590

Net cash provided by/(used in) investing activities

1,406,960

(1,919,054)

Net cash (used in)/provided by financing activities

(179,986)

1,654,835

Effect of exchange rate changes

(38,059)

105,397

Net change in cash, cash equivalents and restricted cash

(120,885)

666,768

Cash, cash equivalents and restricted cash at beginning of period

1,632,127

919,424

Cash, cash equivalents and restricted cash at end of period

1,511,242

1,586,192

Cision View original content:https://www.prnewswire.com/news-releases/new-oriental-announces-results-for-the-third-fiscal-quarter-ended-february-28-2022-301532876.html

Source: New Oriental Education and Technology Group Inc.