PrimeCredit Takes Operational Efficiency to Next Level with SAP Concur Automated Spend Management Solution

Enhanced data visibility, scalability and transparency empowers PrimeCredit to fulfill its fast-growing business needs while maintaining stringent governance

HONG KONG, Nov. 11, 2021  — PrimeCredit, one of the leading non-bank consumer finance groups in Hong Kong, has selected and deployed SAP Concur Expense and Concur Invoice to accommodate its thriving business needs with digitalized and automated spend management. Leveraging on artificial intelligence (AI) and machine learning, the cloud-based SAP Concur solution enables PrimeCredit to customize its expense limit approval matrix for different types of expenses in order to meet its unique and stringent internal compliance needs.

This advanced solution also provides an integrated and comprehensive overview on spend categories, reimbursement and invoice status, delivering real-time data visibility to serve PrimeCredit’s business expansion needs while improving its transparency and credibility. With digitalization, the SAP Concur solution enables PrimeCredit to reroute manpower to valuable tasks, creating a highly productive and efficient workplace.

"In view of an ever-changing market and evolving regulatory environment, financial institutions have a pressing need to harness the power of technology for improving efficiency, optimizing cost and fulfilling their growing business needs. However, digital transformation entails a large degree of change to business processes and operating models, consequently creating immense barriers for financial institutions as they navigate the digitalization journey," said William Ng, Chief Financial Officer of PrimeCredit Limited. "The SAP Concur solution has been a key step in our digitalization strategy. It has helped us optimize our workload, which is instrumental in resource planning. We also have better data visibility and a deeper understanding of our various businesses and financial health for better-informed budgeting decisions."

Powered by AI and machine learning, the SAP Concur solution automatically triggers a specific approval matrix according to different expense types with embedded rules for expense limits. In case of any discrepancy between the input data and the assigned expense limit, the solution will generate alert messages spontaneously to the approvers and reviewers. This enables managers and supporting teams to review expenses more efficiently, as they no longer need to review individual amounts and related data on a recurring basis to search for errors. Given the intricate compliance needs of PrimeCredit, the SAP Concur solution simplifies the overall workflow of the finance team in terms of expense approval and budget prediction by virtue of its streamlined and optimized finance procedures, while demonstrably reducing errors and risk of fraud.

The cloud-based SAP Concur solution also offers data accuracy coupled with real-time visibility of daily expenses and invoices from a centralized system dashboard, allowing PrimeCredit to trace, retrieve and analyze data for expense control, profit and loss management and cash flow projection on a year-on-year trajectory without the need for manual forms. By streamlining the process from input through to review and approval, Concur Expense and Concur Invoice provide better data visibility over daily expenses and invoices and have proved instrumental for the company’s finance team to evaluate expense control strategically and plan for the coming year’s budget.

"Building a prospective and resilient business amid the pandemic is challenging, and technology has become a critical component in how well businesses adapt to emerging needs and stay ahead of the competition. It is encouraging to see how the SAP Concur solution has supported PrimeCredit, a key player in Hong Kong’s non-bank consumer finance groups, to unleash business potential with data and digitalization. At SAP Concur, we are committed to being the credible companion of local enterprises and financial institutions of all sizes, enabling them to thrive amid the pandemic and beyond, and supporting them along their digital transformation journey with our industry-leading automated spend management solutions," said Jeff Lam, General Manager, Greater China, SAP Concur.

About SAP Concur

SAP® Concur® is the world’s leading brand for integrated travel, expense, and invoice management solutions, driven by a relentless pursuit to simplify and automate these everyday processes. The highly-rated SAP Concur mobile app guides employees through business trips, charges are directly populated into expense reports, and invoice approvals are automated. By integrating near real-time data and using AI to analyze transactions, businesses can see what they’re spending, improve compliance, and avoid possible blind spots in the budget. SAP Concur solutions help eliminate yesterday’s tedious tasks, make today’s work easier, and support businesses to run at their best. Learn more at concur.com.hk

About SAP

SAP’s strategy is to help every business run as an intelligent enterprise. As a market leader in enterprise application software, we help companies of all sizes and in all industries run at their best: 77% of the world’s transaction revenue touches an SAP system. Our machine learning, Internet of Things (IoT), and advanced analytics technologies help turn customers’ businesses into intelligent enterprises. SAP helps give people and organizations deep business insight and fosters collaboration that helps them stay ahead of their competition. We simplify technology for companies so they can consume our software the way they want – without disruption. Our end-to-end suite of applications and services enables business and public customers across 25 industries globally to operate profitably, adapt continuously, and make a difference. With a global network of customers, partners, employees, and thought leaders, SAP helps the world run better and improve people’s lives. For more information, visit www.sap.com/hk.

About PrimeCredit Limited

PrimeCredit, founded in 1977, is the biggest non-bank consumer finance group in Hong Kong. Its 26 branches widely distributed in Hong Kong mainly offer personal loans and credit cards. Rooted in Hong Kong for more than 40 years, its user base is over 300,000.

Money Lender’s Licence No.: 754/2021
Warning: You have to repay your loans. Don’t pay any intermediaries.
Complaint Hotline: 2111 2999

NUU Unveils its New B-Series Smartphones

Following up on its successful G5 flagship from last year, the smartphone maker pulls back the curtain on an all-new flagship series of smartphones.

DALLAS, Nov. 11, 2021 — This November, NUU will begin a new chapter of providing quality premium smartphones with the launch of the new B-series line up. As company growth accelerates, NUU will further our commitment to the research and design to offer customers a selection of electrifying devices at a simplified price.

The all new B-series of B15 and B10 from NUU.

"The B-series represents a key milestone for the direction we plan to take our latest flagships,” said Danny Sit, CEO of NUU, Inc. "It was very important we offered our customers a polished look and feel as well as premium features." The B-series is unlocked and ready to use with your preferred GSM carrier, such as AT&T, T-Mobile, and any associated MVNOs using those networks in the US, so customers can be sure to stay connected with those who mean the most to them. (CDMA Networks like Verizon, Sprint, and Boost Mobile are not compatible.)

Pre-Order Now For Exclusive Deals and Bundles

In the spirit of the holidays, NUU is offering limited-time exclusive discounts of $159.99 for the B15 and $129.99 for the B10, plus a 3-month extension on the warranty, from November 8th to the 17th. All devices come with a protective case to cushion against any accidental drops, a tempered glass protector to shield your screen from unwanted cracks and dust. Additionally, NUU’s partnership with payment gateway Klarna® allows nearly anyone to put a B15 or B10 in their hands for 4 smaller, spread-out payments.

Introducing Next Level Power in the B15

The all-new B15 flagship boasts a gaming-class MediaTek Helio G88 processor and fast 90Hz display refresh rate that combine to deliver a fluid gaming performance. With the expansive and high-resolution 6.78" FHD+ display, it’s an experience that’s positively immersive, not only for gaming, but even running all social media apps, streaming the latest shows, or even working.

Not to be outdone, the B15’s quad-camera system brings a big upgrade in performance over last year’s G5, starting with the ultra-resolution 48 megapixel main camera, capturing every last detail in your photos. It’s followed by an ultrawide-angle 5 megapixel sensor, a macro lens for super-close photography, and a bokeh sensors for portrait-styled photos. On the flipside, the 8 megapixel selfie camera boasts advanced functionality in the form of AI auto-calibration, beautification filters, and a professional photography mode.

Given the substantial performance of the B15, it’s all supported by a massive 5000mAh battery with 18W quick charge capabilities, allowing users to take their day head-on without charging concerns. It’s all secured through a sleek, side-mounted fingerprint reader, on a pure, stock version of the modern Android 11, and is available for just $199.99 (after the $159.99 pre-order promotion).

Expand Your View with the B10

Make way for the new B10, powered by MediaTek’s powerhouse Helio P60 octa-core chipset and triple camera imaging system. The B10 excels at making lag a thing of the past, for editing photos, doing work, playing games, or kicking back with the latest episode of a favorite TV show.

When no detail can be spared, take super-high resolution photos with the B10’s exceptional 48 megapixel rear main camera that allows an incredible amount of zooming into photos. For capturing more detail outside of the shot, there’s the powerful 8 megapixel ultra wide-angle camera, boasting a 127° field of view. If detail is needed close-up on a single object, the macro zoom camera and its 2.2mm focal length can handle that with ease.

Soak in a world beyond imagination with the B10’s deluxe high definition punch hole 6.55" display with an 87% screen to body ratio, making it perfect for browsing the web for the next big adventure without worrying about potential gaps in performance. Trimmed with an elegant sleek bezel as well as a deep ocean blue or white metallic finish, users can be sure to make a statement without saying a word.

With all that’s happening in the B10, it relies on a substantial 4,000mAh battery to provide all-day usage, and for securing one’s privacy, there’s the sleek side-mounted fingerprint sensor, conveniently located on the power key. The B10 is now available at just $149.99 (after the $129.99 pre-order promotion).

To learn more about the NUU B10 & B15, please visit: us.nuumobile.com

B10 Specifications

System

Android™ 11 

Camera

Rear: 48MP (Main) + 8MP (Wide Angle) + 2MP (Macro)

Front:  8MP

Processor

MTK Helio P60 Octa-Core 2.0GHz

Display

6.55" HD+ 1600×720

Battery

4,000mAh

Memory

RAM: 4GB

Storage: 64GB

External Storage: microSD (up to 512GB)

Network

4G B2/4/5/12/13/25/26/41/66/71

3G 850/1700/1900

GSM 850/900/1800/1900

Connectivity

WiFi 802.11 a/b/g/n/ac (2.4GHz/5GHz)

Bluetooth 5.0

VoLTE & VoWiFi

USB Type-C

USB On-The-Go (OTG)

Dual Sim Dual Standby

3.5mm Headset Jack

Security

Face Unlock

Side-mounted Fingerprint Sensor

Dimensions

165.5×76.9 x9.2mm

B15 Specifications

System

Android™ 11 

Camera

Rear: 48MP (Main) + 5MP (Wide Angle) + 2MP (Macro) + 2MP (Bokeh)

Front:  8MP

Processor

MTK Helio G88 Octa-Core 2.0Hz

Display

6.78" FHD+ 2460×1080 + 90Hz refresh rate

Battery

5,000mAh with 18W fast charging

Memory

RAM: 4GB

Storage: 128GB

External Storage: microSD (up to 512GB)

Network

4G B2/4/5/12/13/25/26/41/66

3G 850/1700/1900

GSM 850/900/1800/1900

Connectivity

WiFi 802.11 a/b/g/n/ac (2.4GHz/5GHz)

Bluetooth 5.0

VoLTE & VoWiFi

USB Type-C

USB On-The-Go (OTG)

Dual Sim Dual Standby

3.5mm Headset Jack

Security

Face Unlock

Side-mounted Fingerprint Sensor

Dimensions

169×76.9 x8.6mm

B-Series product shot and high-resolution images, please download at: https://drive.google.com/drive/folders/1injy3HJq1ZWlZEJYnwWxV92mQNPd4J1s?usp=sharing

About NUU

NUU is an advanced mobility brand founded in 2010, with the goal of democratizing smartphone technology and empowering consumers. Since our inception, we’ve been steadily growing our capabilities in product development and distribution to produce beautiful, reliable, premium-quality products that offer similar functionality to much more expensive brands. We are headquartered in Dallas, Texas and Hong Kong.

Disclaimer: Android and Google are registered trademarks of Google Inc.

Related Links :

http://us.nuumobile.com

Acer Brings the Aspire Vero to Malaysia

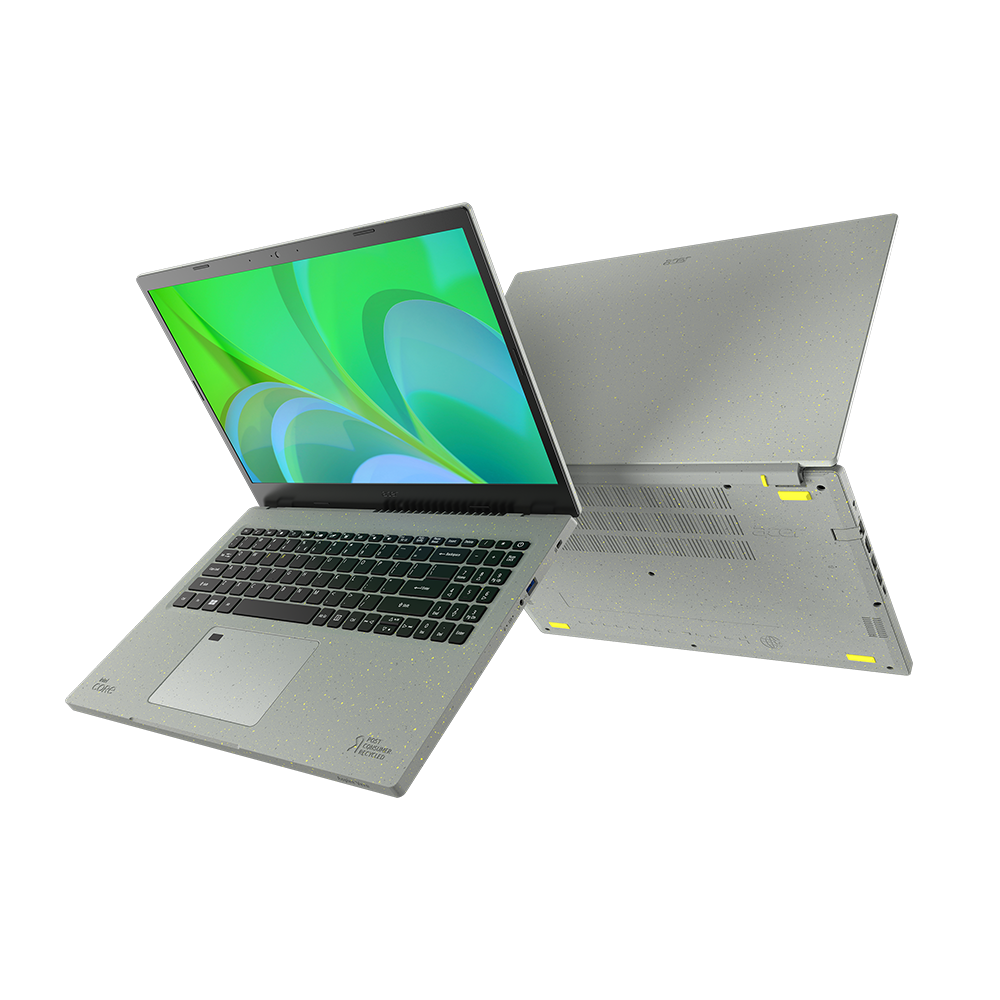
We’ve been hearing and seeing more tech companies making strides to make technology greener and be more environmentally friendly. However, very few have followed through with grassroots efforts and tangible products which help them progress in their goals. At their recent next@acer, Acer announced a new sub-brand that would focus on driving their efforts in becoming a greener company – the Vero. The Acer Vero sub-brand is only one of their efforts in progressing what they call the Earthion (Earth Mission) of bettering the environment and producing technology more responsibly.

Aspire Vero AV15 51 05
Source: Acer

Acer announced its new Aspire Vero in Malaysia today. However, before we talk about the tech, it would be remiss of us to not highlight their efforts in bringing their Earthion closer to fruition in Malaysia. The company has adopted 15 trees in the Taman Tugu – a green lung in the nation’s capital. However, it’s not just about adopting trees, Acer is also bringing their partners and collaborators into the fold. Five of the company’s partners including PIKOM, Team Lugiami, Microsoft and the National Cancer Society of Malaysia have pledged their support for Acer’s Earthion.

Creating the Opportunity to Choose Responsible Technology

The company views the Aspire Vero as a crucial part of achieving its Earthion. The new laptop affords consumers a more responsible choice when it comes to buying laptops. The Aspire Vero incorporates post-consumer recycled (PCR) plastics in its chassis and keycaps. In fact, the chassis is 30% PCR plastics while the keycaps are made of 50% PCR plastics. While it would have been nice to see Acer raise the bar higher, limitations on processes and technology when it comes to recycling these plastics force the company to still use virgin plastics for the sake of rigidity and sturdiness. However, Acer’s Aspire Vero accounts for a significant reduction in carbon dioxide (CO2) emissions during production. Each unit accounts for a 21% reduction. The packaging of the Acer Aspire Vero keeps in line with the environmentally cautious nature of the lineup being made of up to 85% recycled paper pulp and using soy ink exclusively for printing.

Aspire Vero AV15 51 03
Source: Acer

So, what does an environmentally cautious laptop look like? Acer has intentionally made the Acer Aspire Vero take a very nature-inspired approach to texture and design. It makes the Vero both unique and functional. What’s more, the laptop isn’t sacrificing much when it comes to performance. It comes with a 15.6-inch IPS Display with Full HD resolution. The panel itself is 99% recyclable. It’s powered by Intel’s 11th generation Core processors and has up to 16GB of RAM. It also takes advantage of Intel’s Iris Xe Graphics making it capable of some graphical prowess. It comes with 512GB of storage.

Aspire Vero AV15 51 04
Source: Acer

When it comes to connectivity, the Acer Aspire Vero comes with support for WiFi 6 and Bluetooth 5.1. It also has a full array of ports including an HDMI, two USB 3.2 ports, 1 USB Type-C, an Ethernet port and a 3.5mm headphone jack. It also has an HD webcam and a claimed 7-hour battery life.

Pricing & Availability

The Acer Aspire Vero will be available starting 11th November 2021. The i5 version will be priced at MYR3,399 while the i7 version will be priced at MYR4,299.

In conjunction with the launch, early adopters will be entitled to freebies worth up to MYR500 with every purchase. In addition, MYR100 of each unit sold will be chanelled to fund more tree adoptions in Taman Tugu.

The DJI Revolution is Here in the Form of the Mavic 3 with Prices from MYR 9,799

Rarely today you get a product that is leaps and bound from its previous generation product that it would replace. Then again, there is the NVIDIA GeForce RTX, the new 12th Generation Intel Core Alder Lake processors, and even AMD’s Ryzen processors. Maybe a huge generational gap is not that unique after all. This DJI Mavic 3 though, is a special one.

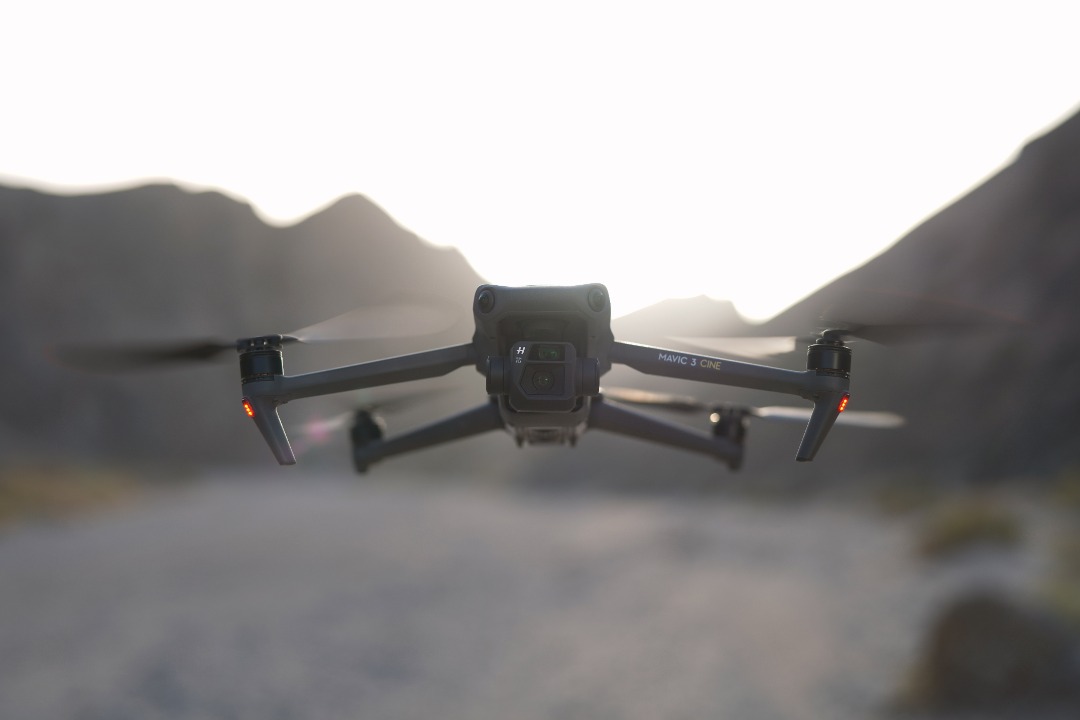
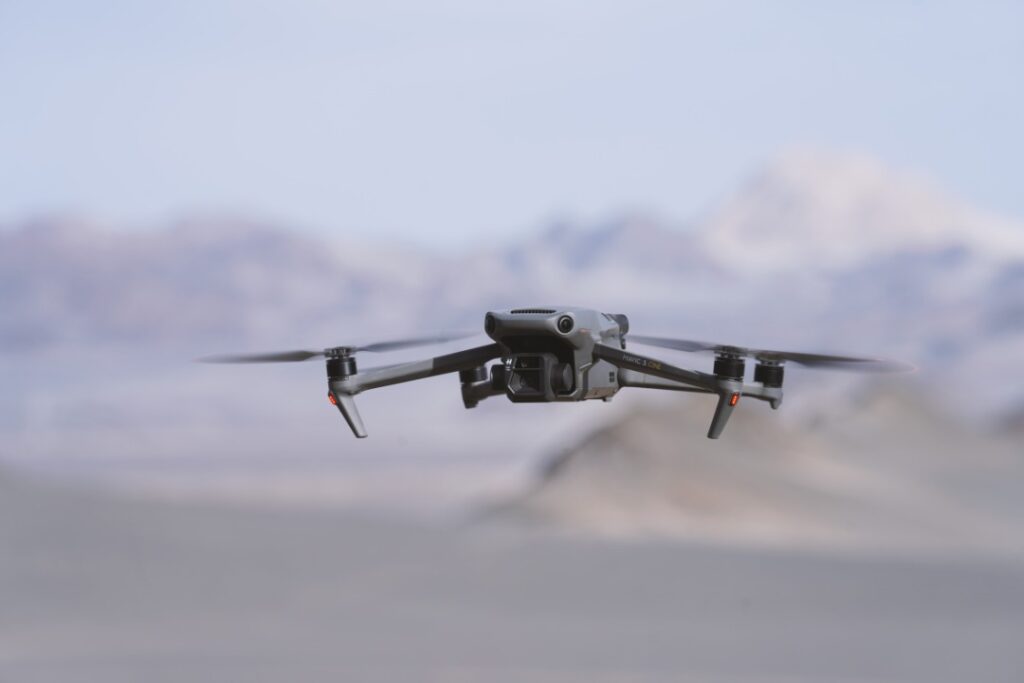
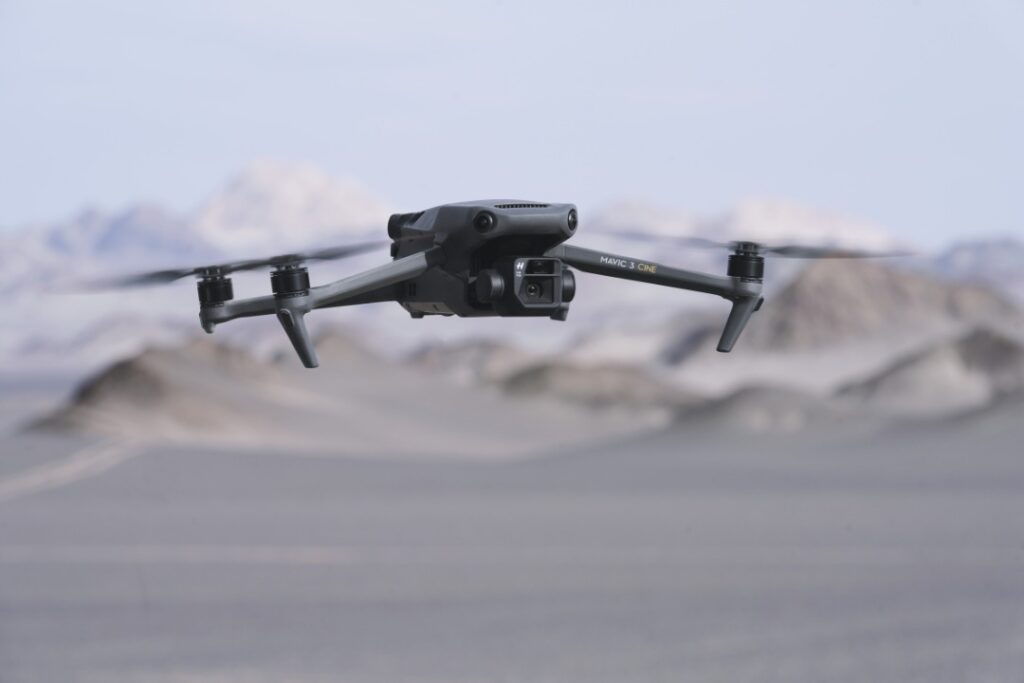
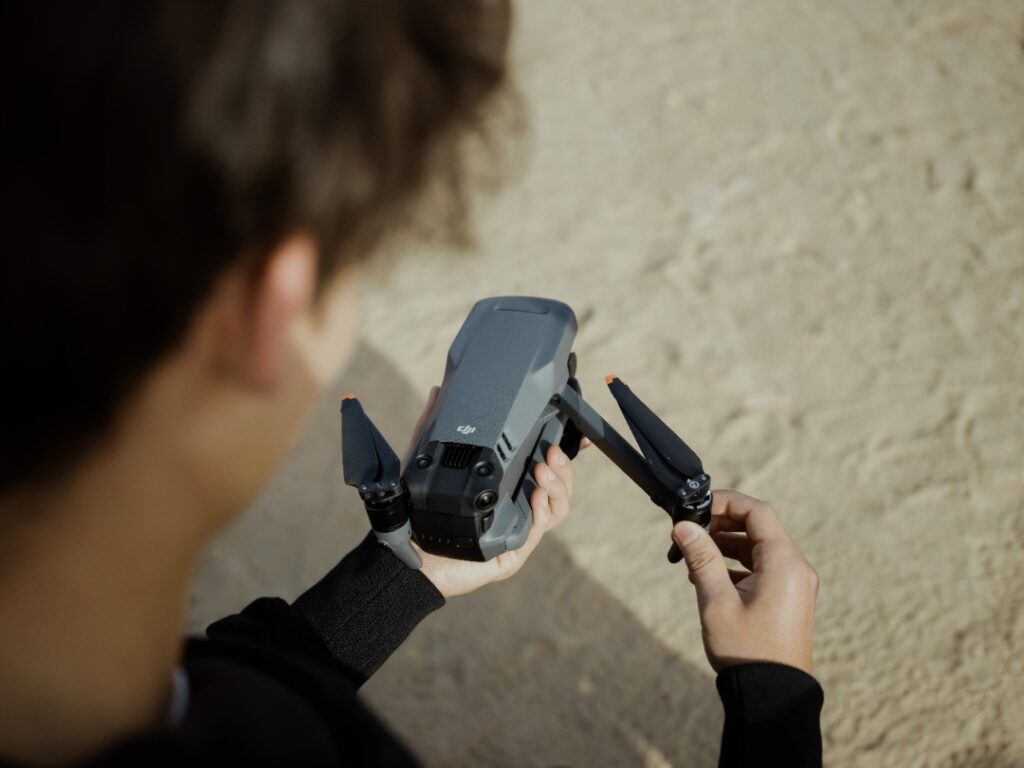
The DJI Mavic 3 is meant to replace the DJI Mavic 2 series of drones. If you remember, the DJI Mavic 2 came in two flavours; the Pro and Zoom. The Pro variant comes with a Hasselblad engineered camera module while the Zoom variant comes with a camera module with optical zoom lens, you get the idea. The DJI Mavic 3 does not follow the same path with the Mavic 2 series though. Instead, DJI introduced one Mavic 3, and one Mavic 3 Cine edition.

An Aerial Video Powerhouse

  • DJI Mavic 3 6
  • DJI Mavic 3 7
  • DJI Mavic 3 8
  • DJI Mavic 3 9
  • DJI Mavic 3 1

The Mavic 3 series has more in common with the DJI Mavic 2 Pro than the Zoom variant. It packs a 4/3 CMOS Hasselblad engineered camera. The only traces of the Zoom variant is its 28x hybrid zoom capability.

The camera module, to be fair, is not that big of an improvement compared to the older Mavic 2 Pro to be fair. It records videos at up to 5.1K resolution at 50 fps. The biggest improvement is on its 4K resolution recording though. Now you can record 4K videos at 120fps for even better-looking slow-motion videos. This is where the Mavic 3 stops and where the Cine edition starts.

The Mavic 3 Cine edition is truly a special thing. It offers Apple ProRes 422 HQ encoding for even higher quality videos for post processing. It is not RAW, but it is the first integrated drone system that can record at ProRes 422 HQ format. Of course, if you choose to record at that format, ou are going to run out of storage space pretty quickly if you use a humble SDXC memory card. The Cine edition has a 1TB internal SSD storage for all your recording needs though.

Longer, Smarter Flights

  • DJI Mavic 3 2
  • DJI Mavic 3 3
  • DJI Mavic 3 4
  • DJI Mavic 3 5

To ensure that your Mavic 3 does not get tumbled around mid-air, it has even more sensors than before too. It now packs omnidirectional sensors that can detect objects up to 200 meters away just so that it knows where and when to stop or how to avoid the obstacle. It is the easiest full-sized Mavic to fly. It is even cleverer too. It can track a subject, lose it if it goes out of frame, and pick it back up as soon as the subject comes back into the frame with ActiveTrack 5.0. It can even follow the subject wherever it moves. Of course, it also comes with the array of other precision sensors to ensure that it knows where it is at any given time. With the help of GPS, GLONASS< and BeiDou satellites too, it knows where to return to when you call it home or when its battery is running out.

It boasts 15km of remote range with DJI O3+. Even with interference, you are not going to lose remote signal or even clear video signal from 15km away. DJI boasts that this drone can transmit 1080p Full HD/60fps live feed over that distance without loss or lag. Of course, you might not fly the DJI Mavic 3 to that full range, but it is nice to know it can. What is more impressive is that DJI managed to extend the battery life of the Mavic 3 to up to 46 minutes instead of the mere 30 minutes the previous versions used to boast.

Price and Availability

The DJI Mavic 3 and Mavic 3 Cine edition is now available in Malaysia. You can get your hands on either from DJI’s authorised retailers across Malaysia or from DJI’s official stores on Shopee and Lazada. The DJI Mavic 3 starts at MYR 9,799, which is quite a little bit more expensive compared to the Mavic 2 Pro. The Mavic 3 Cine edition however starts at MYR 22,899. For that money you are getting the drone itself with a few extra ND filters, two extra Intelligent Flight batteries, a charging hub, and a special carrying bag. For more information on the DJI Mavic 3, you can visit their website.

Nisun International Reports Unaudited Operational Results for the Nine Months Ended September 30, 2021

SHANGHAI, Nov. 10, 2021 — Nisun International Enterprise Development Group Co., Ltd ("Nisun International" or the "Company") (Nasdaq: NISN), a provider of innovative comprehensive solutions through the integration of technology, industry, and finance, today announced its unaudited operational results for the nine months ended September 30, 2021.

Mr. Xiaoyun Huang, Chairman and Chief Executive Officer of Nisun International, commented, "We are pleased to announce a robust earnings quarter, with net income of approximately $20 million for the nine months ended September 30, 2021. As we continue to strengthen our core business, we will expand our overall capabilities to better serve our existing customers. At the same time, we will continue to actively expand our customer base and create long-term value for our shareholders."

Operational Results for the Nine Months Ended September 30, 2021

The following table presents an overview of the Company’s unaudited results of operations for the nine months ended September 30, 2021:

For the
Nine Months
Ended
September 30,
2021

(Unaudited)

Revenue

$

106,784,001

Cost of revenue

73,703,349

Gross profit

33,080,652

Operating expenses

9,382,713

Income from operations

23,697,939

Other income, net

1,826,465

Income before income taxes

25,524,404

Income taxes

5,570,324

Net income

$

19,954,080

Net income per common share

$

0.97

Weighted average number of shares outstanding

20,555,768


Revenues

Total revenue was approximately $106.8 million for the nine months ended September 30, 2021.

  • Revenue generated from Small and Medium Enterprise (SME) financing solutions services was approximately $58.4 million, as the Company provided comprehensive financing solutions to SMEs in China seeking alternative financing solutions to bank financing.
  • Total supply chain transaction volume was approximately $329.7 million for the nine months ended September 30, 2021.
  • Revenue generated from sales of merchandise was approximately $44.2 million, attributable to the launch of the Company’s supply chain trading business after generating high-quality customers and resources through its supply chain solution business.

For the Nine Months Ended
September 30,
2021

(Unaudited)

%

Revenue generated from service

Small and Medium Enterprise financing solutions

$

58,438,245

55

%

Supply chain financing solutions

4,184,441

4

%

Other financing solutions

582

0

%

Total revenue generated from service

62,623,268

59

%

Revenue generated from sales

Merchandise sales

44,160,733

41

%

Total revenue

$

106,784,001

100

%


Cost of Revenue

The cost of revenue was approximately $73.7 million for the nine months ended September 30, 2021, which primarily comprised of approximately $43.9 million in cost of sales of merchandise sold, approximately $19.1 million in direct operational costs from SME financing solutions, and approximately $10.0 million in direct costs associated with staff who designed and managed SME financing solutions, supply chain solutions, and other financing solutions businesses.

Operating Expenses

For the Nine Months Ended
September 30,
2021

(Unaudited)

%

Selling expenses

$

2,294,598

24

%

General and administrative expenses

6,195,402

66

%

Research and development expenses

892,713

10

%

Total cost of revenue

$

9,382,713

100

%


Selling, general and administrative expenses are comprised of indirect advertising and marketing costs, office rent and expenses, costs associated with staff and support personnel who manage the Company’s business activities, and professional fees paid to third parties. 

Net income and net income per share

For the nine months ended September 30, 2021, the Company had net income of approximately $20.0 million and net income per share of $0.97.

The Company did not compile quarterly information for the nine months ended September 30, 2020. As such, comparative data is not available at this time.

About Nisun International Enterprise Development Group Co., Ltd

Nisun International Enterprise Development Group Co., Ltd (NASDAQ: NISN) is a technology-driven, integrated supply chain solutions provider focused on transforming the corporate finance industry. Leveraging its industry experience, Nisun is dedicated to providing professional supply chain solutions to Chinese and foreign enterprises and financial institutions. Through its subsidiaries, Nisun provides users with professional solutions for technology supply chain management, technology asset routing, and digital transformation of tech and finance institutions, enabling the industry to strengthen and grow. At the same time, Nisun continues to deepen the field of industry segmentation through industrial and financial integration, by cultivating/creating an ecosystem of openness and empowerment. Nisun has built a linked platform that incorporates supply chain, banking, securities, trust, insurance, funds, state-owned enterprises, among other businesses. Focusing on industry-finance linkages, Nisun aims to serve the upstream and downstream of the industrial supply chain while also assisting with supply-side sub-sector reform. For more information, please visit http://ir.nisun-international.com.

Cautionary Note Regarding Forward-Looking Statements

This press release contains information about Nisun’s view of its future expectations, plans and prospects that constitute forward-looking statements within the meaning of Section 27A of the Securities Act of 1933, as amended, and Section 21E of the Securities Exchange Act of 1934, as amended, and as defined in the U.S. Private Securities Litigation Reform Act of 1995. Actual results may differ materially from historical results or those indicated by these forward-looking statements as a result of a variety of factors including, but not limited to, risks and uncertainties associated with its ability to raise additional funding, its ability to maintain and grow its business, variability of operating results, its ability to maintain and enhance its brand, its development and introduction of new products and services, the successful integration of acquired companies, technologies and assets into its portfolio of products and services, marketing and other business development initiatives, competition in the industry, general government regulation, economic conditions, dependence on key personnel, the ability to attract, hire and retain personnel who possess the technical skills and experience necessary to meet the requirements of its clients, and its ability to protect its intellectual property. Nisun encourages you to review other factors that may affect its future results in Nisun’s registration statements and in its other filings with the Securities and Exchange Commission. Nisun assumes no obligation to update or revise its forward-looking statements as a result of new information, future events or otherwise, except as expressly required by applicable law.

Contacts:

Nisun International Enterprise Development Group Co., Ltd
Investor Relations
Tel: +86 (21) 2357-0055
Email: ir@cnisun.com

ICR, LLC
Tel: +1 203 682 8233
Email: nisun@icrinc.com

Related Links :

http://ir.nisun-international.com

Asian Games Gets More Interesting with Medalled eSport Events including PUBG Mobile & Hearthstone

Big sporting events are about to get more interesting – particularly if you have an interest in eSports. It’s been a long time coming, but eSports is becoming more mainstream with the increasing number of events that are becoming recognised. A growing number of games are being included in large, global and regional sporting events. The Asian Games are the latest to join the foray.

eSports has long been sidelined by mainstream sports and athletics cause of their perceived lack of “training” and “athleticism”. But that’s been changing in recent years. With the establishment of international tournaments like “The International” (TI), The World Cyber Games (WCG) and the Electronic Sports League (ESL), there has been more awareness cultivated of how eSports athletes train and how intense and precise each match can be.

The industry has scored another big win with PUBG Mobile being recognised as a medalled event at the upcoming Asian Games. The event, held once every four years, is recognised by the International Olympic Committee as the second largest event of its kind; only second to the Olympics itself. PUBG Mobile joins a list of elite games selected for the event.

PUBG Mobile Asian Games
Source: Tencent Games

PUBG Mobile has seen tremendous growth in the years since its launch. It has since spawned 14 new leagues and a cumulative prize pool of USD$15 million this year alone. It joins an exclusive list of games that have been recognised as medalled events for the upcoming Asian Games. As of now, the list consists of Arena of Valor Asian Games Version, DOTA 2, Dream Three Kingdoms 2, EA SPORTS FIFA branded soccer games, Hearthstone, League of Legends, and Street Fighter V.

The Asian Games will be taking place in Hangzhou, China from 10th to 25th September 2022. The upcoming games will mark the 19th Asian Games and the first to have eSports as recognised, medalled events.

Cyclone Robotics Launches End-To-End Hyperautomation Product Portfolio to Boost Digital Economy in Asia Pacific, Enabling Automation Across All Stages of Digital Transformation

SHANGHAI, Nov. 10, 2021 — Cyclone Robotics, the world’s leading RPA provider and thought leader in the era of hyperautomation, launched its enterprise-level product portfolio with end-to-end automation solutions, and announced its expanded global partnership strategy. Strengthened by its product innovation, rich experience in hyperautomation, and extensive global partnership network, Cyclone Robotics aims to fully empower local businesses’ digital transformations across all stages to accelerate the digital economy’s development in Asia Pacific.

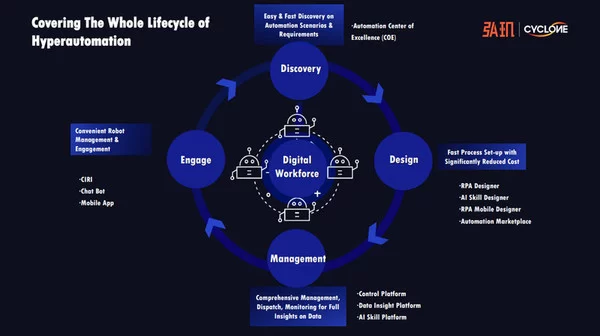
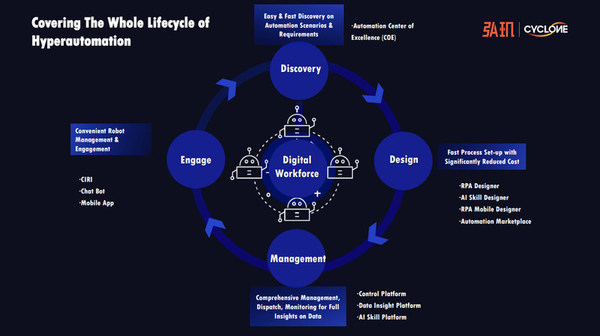
Cyclone Robotics’ solutions cover the whole lifecycle of digital transformation including phases of requirements discovery, design, management and engagement, creating a positive feedback loop that accelerates improvements. Furthermore, it integrates with various technologies such as process mining, analysis, AL/ML, iBPMS, iPAAS and zero-code development on the platform, becoming one of the important components of enterprise-level architecture in the digital era.

Cyclone RPA products and solutions run across every stage of digital transformation

Earlier this year, the world-leading independent research institution Gartner identified hyperautomation as one of the top strategic technology trends of 2022, and noted that RPA enriched by AI has become the core enabling technology of hyperautomation. As an early driver of this trend, Cyclone Robotics recently launched its innovative AI Skill Platform, which supports multiple forms of AI capabilities from software to hardware as well as the CIRI Digital Assistant that seamlessly connects human, digital robot and enterprise system. It is worth mentioning that it also launched RPA Mobile Designer and Mobile App that allow everyone to operate wireless automation process in an easier way.

"As the industry leader driving the future of hyperautomation, Cyclone Robotics has stayed ahead of the trends and invested heavily in product development to provide end-to-end hyperautomation solutions. With better integration between IT and businesses, and a more flexible selection of products, we not only can empower businesses to improve individual task efficiencies, but also provide departmental and enterprise-level RPA solutions for the next stage of their digital transformations as they continue to advance." said Vincent Gao, founder and CEO of Cyclone Robotics.

According to Dr. Jia, Chief Product Officer of Cyclone Robotics, RPA has evolved over the years from its basic stages to the current RPA+, which requires end-to-end process automation capabilities at the departmental level, and will continue to advance to enterprise-level hyperautomation of the future. Cyclone Robotics’ rich experience and practices indicate that enterprises have diverse demands throughout their digital transformation, from very basic applications to more complex challenges. For example, Cyclone Robotics’ partnership with Sinolink Securities, an Asia-Pacific leading securities and investment management firm, has gone through all three RPA stages during its digital transformation journey since 2019. In the beginning, Cyclone Robotics helped launch RPA pilots in some of its business operations that had more informatisation, lower implementation costs, and more frequent standard needs. After Cyclone Robotics’ RPA products and applications were proven successful, Sinolink then began to broadly deploy RPA across the whole company. By 2021, more than 200 RPA operations have been successfully deployed in over 30 departments, achieving 100% execution accuracy with zero errors, 24/7 automated operations, and saving over 6,000 minutes of manpower every day. Moving forward, Cyclone Robotics is working with Sinolink to establish its hyperautomatic middle office with Cyclone Robotics’ recent innovations, such as the aforementioned AI Skill Platform and CIRI. Sinolink can now look forward to more deeply integrated RPA that adds value to its management, business, and collaborations, enabling it to explore more applications for automation.

Gartner also forecasted that the Covid-19 pandemic would fast-forward digital skills adoption by at least five years, which is currently proven by the accelerated digitalisation in Southeast Asia. Automation technologies such as RPA and AI are expected to help address the growing concerns of skills shortage in this region. For example, Singapore, impacted by both Covid-19 restrictions and the government’s hiring policies for foreign skilled workers, is now in heavy demand for tech talents across multiple sectors, especially when it comes to working and managing new technologies. Additionally, other industries like construction, logistics, and manufacturing in Singapore are also seeing rising needs for automation to help them minimise disruption across all aspects of business in the post pandemic recovery.

ASEAN countries including Singapore, Malaysia, Indonesia have all announced their national strategy for digital transformation. Among them, Singapore is considered as "most prepared" for automation according a 2021 Deloitte report. In October 2021, Singapore also announced new phases of the Smart City Initiatives established in 2019 with China (Shenzhen), and highlighted "robotics development" as one of its three key focus areas.

"We are excited to see RPA’s increasing role in helping accelerate digitalisation in this region," said Dr. Jia. "Cyclone Robotics’ newly launched product portfolio is tailored for all types of needs across digital transformation. With a proven track record of success, and with our strong innovation capabilities in AI, MI, and more, we are confident we can propel local companies to become more competitive and prepared for the coming hyperautomation era by fulfilling their all of their business priorities."

Cyclone Robotics has also announced an accelerated global partnership ecosystem to drive business growth, an expanded business chain and scalable partner values. As of now, it already has a large gathering of global partners on the ecosystem, and has tripled its channel partners. Just months after opening its Singapore branch earlier this year, Cyclone Robotics has successfully signed a number of local partnerships with different expertise across countries and regions, including Singapore, Malaysia, Thailand, Indonesia, and Taiwan. "We are encouraged to see so many partnerships formed in SEA shortly after opening our office here. Alongside our new service offering, this rapid expansion of our global partnership network will allow us to empower partners through the ecosystem, and provide efficient on-boarding and responsive services, thereby improving our overall service delivery capabilities," said Dr. Jia. "We look forward to welcoming more partners from all regions into our global ecosystem, through which we’ll provide further localised, professional and tailored offerings, from advisory to solutions, for all types of enterprises throughout their digital transformation journey."

About Cyclone Robotics

Cyclone Robotics completed its Series B in 2020, raising nearly $40 million USD. The team grew from 20 employees in 2019 to 400 members currently across 13 subsidiaries and branches around the world, serving over 500 global customers across Asia Pacific, Europe, and the Middle East. In early 2021, Cyclone Robotics established its Singapore branch, covering Southeast Asia, Japan, the Middle East, Australia and New Zealand to empower companies across all industries to realize digital transformation with its full RPA products & services portfolio. To date, Cyclone Robotics is the only RPA provider in China to have been included in the authoritative reports published by both Gartner and Forrester. The firm is committed to maintaining and growing its position as a world-leading RPA provider and thought leader in the era of hyperautomation.

Webull Financial Donates Brooklyn Nets Tickets to DozenS of New York-Based Community Organizations

Donation of 8,000 Tickets Follows Announcement of Multi-Year Partnership Between Webull and the Nets

NEW YORK, Nov. 10, 2021 — Webull Financial LLC, an independent, self-directed broker-dealer focused on zero-commission trading and in-depth market data, donated more than 8,000 tickets to the first eight Brooklyn Nets home games this season to dozens of New York-based community organizations, including Sheltering Arms and Lutheran Social Services of New York. The tickets were distributed to children and their families, as well as non-profit employees.

"Giving back to the New York community is a very important aspect of our company’s mission," said Anthony Denier, CEO of Webull. "Seeing the joy and appreciation of these individuals is a good reminder of what really matters. We’re extremely grateful for the ability to provide these tickets."

Logan, a member of Sheltering Arms who received tickets, said, "This was a great opportunity to introduce the game of basketball to our nephew, Milan. We always play ball in the park but now Milan had a chance to see what hard work and determination can help him achieve if he takes basketball seriously."

"The majority of our staff are essential workers and going to the game is an opportunity many of our participants might not have otherwise experienced," said Rachel Bleecker, Executive Director at the Lutheran Social Services of New York. "Together, we got to put smiles on the faces of many deserving folks."

Webull announced its multi-year partnership with the Nets, the New York Liberty, and affiliated organizations in September. The company is the Official Patch Partner of the Nets and was recognized at center court prior to the team’s home opener on Oct. 24 at Barclays Center.

For more information on Webull and its offerings, visit www.webull.com.

About Webull Financial 

Webull Financial LLC is a broker-dealer registered with the Securities and Exchange Commission (SEC) and is a member of the Financial Industry Regulatory Authority (FINRA) and the Securities Investor Protection Corporation (SIPC). The headquarters of Webull Financial LLC is located at 44 Wall Street, New York, NY, USA.


Related Links :

http://www.webull.com

JBL Celebrates 75 Years by Launching the Tour ONE and Tour Pro+ TWS Noise Cancelling Headphones

Plenty of companies celebrate their significant milestone with special edition products. It is quite normal that you get an anniversary edition of things, especially in the world of gadgets. What do you mean why? You get anniversary version of cars, why not tech?

Not too many celebrate their major anniversary by launching a product though, JBL is one of those companies. This year JBL celebrates their 75th year in business. While they might not have existed quite as long as some audiophile brands, 75 years in the industry is a long time. This is also in consideration that some of the players in the audio industry have just started dabbling in high-end audio in the last five years or even less.

Of course, having 75 years of experience in the industry, JBL is one of the foremost brands in the audio industry. In fact, they make some of the best and most value-for-money production level gear. They really know a thing or two when it comes to making audiophile stuff then.

To celebrate their 75 years in the industry, they launched two new high-end noise-cancelling wireless headphones, very fitting. They launched one JBL Tour ONE and one JBL Tour Pro+ TWS in Malaysia. As per their name, they are part of JBL’s Tour series of audio gear.

JBL Tour ONE

  • JBL Tour ONE Image 1
  • JBL Tour ONE Image 3
  • JBL Tour ONE Image 2

This one will set you back MYR 1,699, about the same as the Sony WH-1000XM4 currently. In that sense, it goes up against one of the best in the business. You are going to ask the question; “why should I get this one instead of the Sony?”

The JBL Tour ONE offers what JBL calls the True Adaptive Noise Cancellation technology. The headphone cleverly monitors environmental sounds and automatically determines the amount of noise cancellation that needs to be pumped into your ears. You can even turn on the feature even if your headphone was not connected to your smartphone device. They call the feature SilentNow and you can just turn off the world with the feature.

The JBL Tour ONE is not just a one trick pony though. The JBL Pro Sound tuned driver features HARMAN’s clever Smart Audio Mode that switches your headphone’s audio profile according to what you are using your headphone for. The system will optimise the connection for either “normal listening”, “music mode”, or “video mode”. In “music mode”, the headphones automatically increase the fidelity of music for your enjoyment. Obviously, latency suffers and therefore watching videos with it might be less than ideal. In “video mode” then, latency is prioritised and minimised.

Battery life is not bad too. You get up to 25 hours of battery life with Noise Cancelling function on. Without Noise Cancelling, you double the battery life. If you run out of battery, a 10-minute charge gives you up to two hours of playback time.

JBL Tour Pro+ TWS

  • JBL Tour Pro TWS Image 1
  • JBL Tour Pro TWS Image 2
  • JBL Tour Pro TWS Image 3

For a more active lifestyle, an over-ear headphone may not be the most suitable tool you want to carry in your gearbag. You need something light, something portable, and quick to deploy. You want the JBL Tour Pro+ TWS headphones.

True to its name, it is a compact true wireless earbuds package that fits in your pocket like it belongs there. The 6.9mm dynamic drivers ensures that the small package can deliver big sounds though. All of that while still offering up to 30 hours in playback time (up to 6 hours on a single charge with Active Noise Cancelling on, 8 hours without Noise Cancelling). When you run out, you can simply put it on a wireless charging pad and quickly charge it. Either that or plug a USB Type-C charging chord to it and get one hour of playback time in just 10 minutes.

The JBL Tour Pro+ TWS also comes with Adaptive Noise Cancelling technology that either cancels out noise completely or lets noise in to your ears when you need to stay aware of the situation around you. Of course, the 3-mic beamforming technology mics that are on the earbuds also acts as the microphones for voice calls or voice chats. At the same time, Dual Connect + Sync also allows you to choose whether or not you pick up your calls and play music with either side of your earbuds. Fast Pair allows your Android device to quickly connect to the TWS headphones with no fuss. Of course, it is IPX4 rated, so you can take it to the gym and it is ready for the weather at least.

Prices and Availability

Both the JBL Tour ONE and Tour Pro+ TWS are now available via JBL’s own online store and official retail partners including Shopee and Lazada. The JBL Tour ONE headphone will set you back MYR 1,699 as per mentioned. The JBL Tour Pro+ TWS on the other hand will set you back MYR 1,099. Unfortunately, unlike plenty of JBL’s products, there are no colour choices on this one. More information on the JBL Tour ONE and JBL Tour Pro+ TWS can be found on JBL’s website.

HUYA Inc. Reports Third Quarter 2021 Unaudited Financial Results

GUANGZHOU, China, Nov. 9, 2021 — HUYA Inc. ("Huya" or the "Company") (NYSE: HUYA), a leading game live streaming platform in China, today announced its unaudited financial results for the third quarter ended September 30, 2021.

Third Quarter 2021 Highlights

  • Total net revenues for the third quarter of 2021 increased by 5.7% to RMB2,975.5 million (US$461.8 million), from RMB2,814.8 million for the same period of 2020.
  • Net income attributable to HUYA Inc. was RMB524.4 million (US$81.4 million) for the third quarter of 2021, compared with RMB253.0 million for the same period of 2020.
  • Non-GAAP net income attributable to HUYA Inc.[1] was RMB180.0 million (US$27.9 million) for the third quarter of 2021, compared with RMB361.2 million for the same period of 2020.
  • Average mobile MAUs[2] of Huya Live in the third quarter of 2021 increased by 14.7% to 85.1 million, from 74.2 million in the same period of 2020.
  • Total number of paying users[3] of Huya Live in the third quarter of 2021 reached 6.0 million, compared with 6.0 million in the same period of 2020.

"During the recent summer period, we saw robust growth in mobile users based on our comprehensive content offerings, strong operational capabilities and continued promotion efforts. Huya Live’s average mobile MAUs reached 85.1 million in the third quarter of 2021, representing a year-over-year increase of 14.7% and a quarter-over-quarter increase of 9.7%," said Mr. Rongjie Dong, Chief Executive Officer of Huya. "In light of the dynamic business environment, reinforcing our competitive advantages is pivotal to our continuing success. In this spirit, we will strive to promote new game launches, further enrich our content library, and advance product and service upgrades through innovation to meet diverse user demands as we continue to ensure a great user experience."

Ms. Ashley Xin Wu, Vice President of Finance of Huya, commented, "We continued our sustained growth pathway in the third quarter by achieving 5.7% year-over-year top-line growth. And, against the backdrop of an evolving landscape, we strengthened our investment in quality content and content creators to cement our leading market position. Going forward, we will remain dedicated to driving user growth, improving monetization and enhancing our ecosystem."

[1] "Non-GAAP net income attributable to HUYA Inc." is defined as net income attributable to HUYA Inc. before share-based compensation expenses, and gain on fair value change and disposal of equity investments, net of income taxes. For more information, please refer to "Use of Non-GAAP Financial Measures" and "Reconciliations of GAAP and Non-GAAP Results" at the end of this press release.

[2] Refers to average monthly active users on mobile apps. Average mobile MAUs for any period is calculated by dividing (i) the sum of active users on the mobile apps for each month during such relevant period, by (ii) the number of months during such relevant period.

[3] Refers to the sum of user accounts that purchased various products and services on our platform at least once during such relevant period.

Third Quarter 2021 Financial Results

Total net revenues for the third quarter of 2021 increased by 5.7% to RMB2,975.5 million (US$461.8 million), from RMB2,814.8 million for the same period of 2020.

Live streaming revenues decreased by 2.1% to RMB2,601.9 million (US$403.8 million) for the third quarter of 2021, from RMB2,657.2 million for the same period of 2020, primarily due to lower average spending per paying user on Huya Live.

Advertising and other revenues increased by 137.1% to RMB373.7 million (US$58.0 million) for the third quarter of 2021, from RMB157.6 million for the same period of 2020, primarily driven by the revenues from licensing of content.

Cost of revenues increased by 12.6% to RMB2,471.5 million (US$383.6 million) for the third quarter of 2021 from RMB2,194.3 million for the same period of 2020, primarily due to the increase in revenue sharing fees and content costs.

Revenue sharing fees and content costs increased by 16.3% to RMB2,123.6 million (US$329.6 million) for the third quarter of 2021 from RMB1,826.7 million for the same period of 2020, primarily due to the increase in revenue sharing fees in relation to certain broadcaster incentive programs, and the increase in spending on e-sports content and content creators.

Bandwidth costs decreased by 14.2% to RMB178.0 million (US$27.6 million) for the third quarter of 2021 from RMB207.6 million for the same period of 2020, primarily due to improved bandwidth cost management and continued technology enhancement efforts.

Gross profit decreased by 18.8% to RMB504.0 million (US$78.2 million) for the third quarter of 2021 from RMB620.6 million for the same period of 2020, primarily due to the increased cost of revenues driven by higher revenue sharing fees and content costs. Gross margin was 16.9 % for the third quarter of 2021, compared with 22.0% for the same period of 2020.

Research and development expenses increased by 12.9% to RMB206.2 million (US$32.0 million) for the third quarter of 2021 from RMB182.7 million for the same period of 2020, primarily due to increased personnel-related expenses.

Sales and marketing expenses increased by 59.5% to RMB229.4 million (US$35.6 million) for the third quarter of 2021 from RMB143.8 million for the same period of 2020, primarily due to increased marketing expenses to promote the Company’s content, products, services and brand name, particularly including promotional activities for e-sports events and cooperation with various marketing channels during the summer vacations.

General and administrative expenses decreased by 32.6% to RMB80.1 million (US$12.4 million) for the third quarter of 2021 from RMB118.7 million for the same period of 2020, primarily due to lower share-based compensation expenses.

Operating income decreased by 62.7% to RMB83.1 million (US$12.9 million) for the third quarter of 2021 from RMB222.9 million for the same period of 2020. Operating margin was 2.8% for the third quarter of 2021, compared with 7.9% for the same period of 2020.

Interest and short-term investments income were RMB62.6 million (US$9.7 million) for the third quarter of 2021, compared with RMB75.9 million for the same period of 2020, primarily due to decreased interest rates.

Income tax expenses decreased by 19.9% to RMB40.6 million (US$6.3 million) for the third quarter of 2021 from RMB50.7 million for the same period of 2020.

Share of income in equity method investments, net of income taxes was RMB378.7 million (US$58.8 million) for the third quarter of 2021, compared with RMB0.2 million for the same period of 2020, primarily due to the investment income related to a disposal of equity investment.

Net income attributable to HUYA Inc. for the third quarter of 2021 was RMB524.4 million (US$81.4 million), compared with RMB253.0 million for the same period of 2020.

Non-GAAP net income attributable to HUYA Inc. for the third quarter of 2021, which excludes share-based compensation expenses, and gain on fair value change and disposal of equity investments, net of income taxes, was RMB180.0 million (US$27.9 million), compared with RMB361.2 million for the same period of 2020.

Diluted net income per American depositary share ("ADS") was RMB2.17 (US$0.34) for the third quarter of 2021, compared with RMB1.05 for the same period of 2020. Each ADS represents one Class A ordinary share of the Company.

Non-GAAP diluted net income per ADS was RMB0.75 (US$0.12) for the third quarter of 2021, compared with RMB1.50 for the same period of 2020.

As of September 30, 2021, the Company had cash and cash equivalents, short-term deposits and short-term investments of RMB11,119.6 million (US$1,725.7 million), compared with RMB10,738.2 million as of June 30, 2021, primarily due to a cash inflow from a disposal of equity investment.

Conference Call

The Company’s management will host an earnings conference call at 7:00 a.m. U.S. Eastern Time on November 9, 2021 (8:00 p.m. Beijing/Hong Kong time on November 9, 2021).

For participants who wish to join the call, please complete online registration using the link provided below 20 minutes prior to the scheduled call start time. Upon registration, participants will receive the conference call access information, including dial-in numbers, Direct Event passcode, a unique registrant ID and an e-mail with detailed instructions to join the conference call.

Participant Online Registration: http://apac.directeventreg.com/registration/event/4691866

After registration is complete, please dial-in 10 minutes before the scheduled start time of the earnings call and enter the Direct Event passcode and registrant ID as instructed to connect to the call.

Additionally, a live and archived webcast of the conference call will be available on the Company’s investor relations website at http://ir.huya.com.

A replay of the conference call will be accessible approximately two hours after the conclusion of the live call until November 16, 2021, by dialing the following telephone numbers:

United States:

+1-646-254-3697

International:

+61-2-8199-0299

Hong Kong, China:

+852-3051-2780

Replay Access Code:

4691866

About HUYA Inc.

HUYA Inc. is a leading game live streaming platform in China with a large and active game live streaming community. The Company cooperates with e-sports event organizers, as well as major game developers and publishers, and has developed e-sports live streaming as one of the most popular content genres on its platform. The Company has created an engaged, interactive and immersive community for game enthusiasts of China’s young generation. Building on its success in game live streaming, Huya has also extended its content to other entertainment content genres. Huya’s open platform also functions as a marketplace for broadcasters and talent agencies to congregate and closely collaborate with the Company.

Use of Non-GAAP Financial Measures

The unaudited condensed consolidated financial information is prepared in conformity with accounting principles generally accepted in the United States of America ("U.S. GAAP"), except that the consolidated statement of changes in shareholders’ equity, consolidated statements of cash flows, and the detailed notes have not been presented. Huya uses non-GAAP gross profit, non-GAAP operating income, non-GAAP net income attributable to HUYA Inc., non-GAAP net income attributable to ordinary shareholders, and non-GAAP basic and diluted net income per ADS, which are non-GAAP financial measures. Non-GAAP gross profit is gross profit excluding share-based compensation expenses allocated in cost of revenues. Non-GAAP operating income is operating income excluding share-based compensation expenses. Non-GAAP net income attributable to HUYA Inc. is net income attributable to HUYA Inc. excluding share-based compensation expenses, and gain on fair value change and disposal of equity investments, net of income taxes. Non-GAAP net income attributable to ordinary shareholders is net income attributable to ordinary shareholders excluding share-based compensation expenses, and gain on fair value change and disposal of equity investments, net of income taxes. Non-GAAP basic and diluted net income per ADS is non-GAAP net income attributable to ordinary shareholders divided by weighted average number of ordinary shares used in the calculation of non-GAAP basic and diluted net income per ADS. The Company believes that separate analysis and exclusion of the impact of (i) share-based compensation expenses, and (ii) gain on fair value change and disposal of equity investments, net of income taxes add clarity to the constituent parts of its performance. The Company reviews these non-GAAP financial measures together with GAAP financial measures to obtain a better understanding of its operating performance. It uses the non-GAAP financial measure for planning, forecasting and measuring results against the forecast. The Company believes that non-GAAP financial measure is useful supplemental information for investors and analysts to assess its operating performance without the effect of (i) share-based compensation expenses, which have been and will continue to be significant recurring expenses in its business, and (ii) gain on fair value change and disposal of equity investments, net of income taxes, which both may recur when there is observable price change in the future. However, the use of non-GAAP financial measures has material limitations as an analytical tool. One of the limitations of using non-GAAP financial measures is that they do not include all items that impact the Company’s net income for the period. In addition, because non-GAAP financial measures are not measured in the same manner by all companies, they may not be comparable to other similar titled measures used by other companies. In light of the foregoing limitations, you should not consider non-GAAP financial measure in isolation from or as an alternative to the financial measure prepared in accordance with U.S. GAAP.

The presentation of these non-GAAP financial measures is not intended to be considered in isolation from, or as a substitute for, the financial information prepared and presented in accordance with U.S. GAAP. For more information on these non-GAAP financial measures, please see the table captioned "HUYA Inc. Reconciliations of GAAP and Non-GAAP Results" at the end of this announcement.

Exchange Rate Information

This announcement contains translations of certain RMB amounts into U.S. dollars at a specified rate solely for the convenience of the reader. Unless otherwise noted, all translations from RMB to U.S. dollars are made at a rate of RMB6.4434 to US$1.00, the noon buying rate in effect on September 30, 2021, in the H.10 statistical release of the Federal Reserve Board. The Company makes no representation that the Renminbi or U.S. dollars amounts referred to in this announcement could have been or could be converted into U.S. dollars or Renminbi, as the case may be, at any particular rate or at all.

Safe Harbor Statement

This announcement contains forward-looking statements. These statements are made under the "safe harbor" provisions of the U.S. Private Securities Litigation Reform Act of 1995. These forward-looking statements can be identified by terminology such as "will," "expects," "anticipates," "future," "intends," "plans," "believes," "estimates" and similar statements. Among other things, the business outlook and quotations from management in this announcement, as well as Huya’s strategic and operational plans, contain forward-looking statements. Huya may also make written or oral forward-looking statements in its periodic reports to the U.S. Securities and Exchange Commission ("SEC"), in its annual report to shareholders, in press releases and other written materials and in oral statements made by its officers, directors or employees to third parties. Statements that are not historical facts, including statements about Huya’s beliefs and expectations, are forward-looking statements. Forward-looking statements involve inherent risks and uncertainties. A number of factors could cause actual results to differ materially from those contained in any forward-looking statement, including but not limited to the following: Huya’s goals and strategies; Huya’s future business development, results of operations and financial condition; the expected growth of the game live streaming market; the expectation regarding the rate at which to gain active users, especially paying users; Huya’s ability to monetize the user base; Huya’s efforts in complying with applicable data privacy and security regulations; fluctuations in general economic and business conditions in China; the impact of the COVID-19 to Huya’s business operations and the economy in China and elsewhere generally; any regulatory developments in laws, regulations, rules, policies or guidelines applicable to Huya; and assumptions underlying or related to any of the foregoing. Further information regarding these and other risks is included in Huya’s filings with the SEC. All information provided in this press release and in the attachments is as of the date of this press release, and Huya does not undertake any obligation to update any forward-looking statement, except as required under applicable law.

For investor and media inquiries, please contact:

In China:

HUYA Inc.
Investor Relations
Tel: +86-20-2290-7829
E-mail: ir@huya.com

The Piacente Group, Inc.
Jenny Cai
Tel: +86-10-6508-0677
E-mail: huya@tpg-ir.com

In the United States:

The Piacente Group, Inc. 
Brandi Piacente
Tel: +1-212-481-2050
E-mail: huya@tpg-ir.com


HUYA INC.

UNAUDITED CONDENSED CONSOLIDATED BALANCE SHEETS

(All amounts in thousands, except share, ADS, per share data and per ADS data)

As of December 31,

As of September 30,

2020

2021

2021

RMB

RMB

US$

Assets

Current assets

Cash and cash equivalents

3,293,573

3,103,779

481,699

Restricted cash

164,889

2,741

425

Short-term deposits

5,974,790

7,006,098

1,087,329

Short-term investments

1,206,539

1,009,720

156,706

Accounts receivable, net

71,237

74,692

11,592

Amounts due from related parties, net

64,802

211,301

32,793

Prepayments and other current assets, net

495,108

934,951

145,102

Total current assets

11,270,938

12,343,282

1,915,646

Non-current assets

Deferred tax assets

48,313

26,451

4,105

Investments

467,206

582,213

90,358

Property and equipment, net

94,555

82,438

12,794

Intangible assets, net

62,796

90,717

14,079

Right-of-use assets, net

87,418

404,929

62,844

Prepayments and other non-current assets

379,461

150,542

23,364

Total non-current assets

1,139,749

1,337,290

207,544

Total assets

12,410,687

13,680,572

2,123,190

Liabilities and shareholders’ equity

Current liabilities

Accounts payable

10,083

18,918

2,936

Advances from customers and deferred revenue

485,878

399,607

62,018

Income taxes payable

56,861

74,613

11,580

Accrued liabilities and other current liabilities

1,707,289

1,759,490

273,066

Amounts due to related parties

95,457

333,812

51,807

Lease liabilities due within one year

29,227

36,812

5,713

Total current liabilities

2,384,795

2,623,252

407,120

Non-current liabilities

Lease liabilities

57,620

51,216

7,949

Deferred tax liabilities

13,350

4,597

713

Deferred revenue

178,144

145,174

22,531

Total non-current liabilities

249,114

200,987

31,193

Total liabilities

2,633,909

2,824,239

438,313


HUYA INC.

UNAUDITED CONDENSED CONSOLIDATED BALANCE SHEETS (CONTINUED)

(All amounts in thousands, except share, ADS, per share data and per ADS data)

As of December 31,

As of September 30,

2020

2021

2021

RMB

RMB

US$

Shareholders’ equity

Class A ordinary shares (US$0.0001 par value;
    750,000,000 shares authorized as of December
    31, 2020 and September 30, 2021, respectively; 
   
83,490,841 and 86,195,765 shares issued and
    outstanding as of December 31, 2020 and
    September 30, 2021, respectively)

55

56

9

Class B ordinary shares (US$0.0001 par value;
    200,000,000 shares authorized as of December
    31, 2020 and September 30, 2021, respectively; 
    152,357,321 and 151,136,517 shares issued and 
    outstanding as of December 31, 2020 and
    September 30, 2021, respectively)

100

100

16

Additional paid-in capital

11,465,575

11,688,697

1,814,057

Statutory reserves

122,429

122,429

19,001

Accumulated deficit

(1,883,643)

(987,475)

(153,254)

Accumulated other comprehensive income

72,262

32,526

5,048

Total shareholders’ equity

9,776,778

10,856,333

1,684,877

Total liabilities and shareholders’ equity

12,410,687

13,680,572

2,123,190


HUYA INC.

UNAUDITED CONDENSED CONSOLIDATED STATEMENTS OF OPERATIONS

 (All amounts in thousands, except share, ADS, per share data and per ADS data)

Three Months Ended

Nine Months Ended

September 30,
2020

June 30,
2021

September 30,
2021

September 30,
2021

September 30,
2020

September 30,
2021

September 30,
2021

RMB

RMB

RMB

US$

RMB

RMB

US$

Net revenues

Live streaming

2,657,208

2,579,178

2,601,854

403,801

7,496,755

7,573,307

1,175,359

Advertising and others

157,632

383,197

373,692

57,996

427,277

969,398

150,448

Total net revenues

2,814,840

2,962,375

2,975,546

461,797

7,924,032

8,542,705

1,325,807

Cost of revenues(1)

(2,194,263)

(2,381,056)

(2,471,536)

(383,576)

(6,253,627)

(6,943,488)

(1,077,612)

Gross profit

620,577

581,319

504,010

78,221

1,670,405

1,599,217

248,195

Operating expenses(1)

Research and development expenses

(182,683)

(207,899)

(206,203)

(32,002)

(518,597)

(613,173)

(95,163)

Sales and marketing expenses

(143,846)

(167,045)

(229,404)

(35,603)

(364,902)

(541,034)

(83,967)

General and administrative expenses

(118,741)

(72,130)

(80,073)

(12,427)

(348,953)

(236,294)

(36,672)

Total operating expenses

(445,270)

(447,074)

(515,680)

(80,032)

(1,232,452)

(1,390,501)

(215,802)

Other income, net

47,613

47,643

94,804

14,713

99,650

218,415

33,897

Operating income

222,920

181,888

83,134

12,902

537,603

427,131

66,290

Interest and short-term investments income

75,919

57,729

62,561

9,709

239,373

185,420

28,777

Gain on fair value change of investments

3,593

40,568

6,296

2,160

44,161

6,854

Other non-operating expenses

(10,010)

Foreign currency exchange gains (losses), net

4,677

722

(31)

(5)

2,277

(1,569)

(244)

Income before income tax expenses

303,516

243,932

186,232

28,902

771,403

655,143

101,677

Income tax expenses

(50,657)

(58,291)

(40,577)

(6,297)

(139,499)

(138,278)

(21,460)

Income before share of income (loss) in
      equity method investments, net of
      income taxes

252,859

185,641

145,655

22,605

631,904

516,865

80,217

Share of income (loss) in equity method
      investments, net of income taxes

154

610

378,724

58,777

(907)

379,303

58,867

Net income attributable to HUYA Inc.

253,013

186,251

524,379

81,382

630,997

896,168

139,084

Net income attributable to ordinary
     shareholders

253,013

186,251

524,379

81,382

630,997

896,168

139,084


HUYA INC.

UNAUDITED CONDENSED CONSOLIDATED STATEMENTS OF OPERATIONS (CONTINUED)

 (All amounts in thousands, except share, ADS, per share data and per ADS data)

Three Months Ended

Nine Months Ended

September 30,
2020

June 30,
2021

September 30,
2021

September 30,
2021

September 30,
2020

September 30,
2021

September 30,
2021

RMB

RMB

RMB

US$

RMB

RMB

US$

Net income per ADS*

—Basic

1.10

0.78

2.20

0.34

2.82

3.77

0.58

—Diluted

1.05

0.77

2.17

0.34

2.65

3.71

0.58

Net income per ordinary share

—Basic

1.10

0.78

2.20

0.34

2.82

3.77

0.58

—Diluted

1.05

0.77

2.17

0.34

2.65

3.71

0.58

Weighted average number of ADS used in
     calculating net income per ADS

—Basic

230,554,718

238,105,367

238,814,217

238,814,217

224,053,176

237,848,772

237,848,772

—Diluted

240,474,833

241,536,071

241,449,111

241,449,111

237,807,379

241,774,727

241,774,727

* Each ADS represents one Class A ordinary share

(1) Share-based compensation was allocated in cost of revenues and operating expenses as follows:

Three Months Ended

Nine Month Ended

September 30,
2020

June 30,
2021

September 30,
2021

September 30,
2021

September 30,
2020

September 30,
2021

September 30,
2021

RMB

RMB

RMB

US$

RMB

RMB

US$

Cost of revenues

17,352

12,969

11,883

1,844

47,939

41,473

6,437

Research and development expenses

42,552

32,226

34,720

5,388

114,070

103,687

16,092

Sales and marketing expenses

2,711

1,670

2,512

390

7,829

6,073

943

General and administrative expenses

45,549

20,636

21,714

3,370

156,383

67,474

10,472


HUYA INC.

RECONCILIATIONS OF GAAP AND NON-GAAP RESULTS

(All amounts in thousands, except share, ADS, per share data and per ADS data)

Three Months Ended

Nine Months Ended

September 30,
2020

June 30,
2021

September 30,
2021

September 30,
2021

September 30,
2020

September 30,
2021

September 30,
2021

RMB

RMB

RMB

US$

RMB

RMB

US$

Gross profit

620,577

581,319

504,010

78,221

1,670,405

1,599,217

248,195

Share-based compensation expenses allocated
      in cost of revenues

17,352

12,969

11,883

1,844

47,939

41,473

6,437

Non-GAAP gross profit

637,929

594,288

515,893

80,065

1,718,344

1,640,690

254,632

Operating income

222,920

181,888

83,134

12,902

537,603

427,131

66,290

Share-based compensation expenses

108,164

67,501

70,829

10,992

326,221

218,707

33,944

Non-GAAP operating income

331,084

249,389

153,963

23,894

863,824

645,838

100,234

Net income attributable to HUYA Inc.

253,013

186,251

524,379

81,382

630,997

896,168

139,084

Gain on fair value change and disposal of e
     quity investments, net of income taxes

(3,619)

(415,190)

(64,436)

(1,620)

(418,809)

(64,998)

Share-based compensation expenses

108,164

67,501

70,829

10,992

326,221

218,707

33,944

Non-GAAP net income attributable to HUYA Inc.

361,177

250,133

180,018

27,938

955,598

696,066

108,030

Net income attributable to ordinary
      shareholders

253,013

186,251

524,379

81,382

630,997

896,168

139,084

Gain on fair value change and disposal of

      equity investments, net of income taxes

(3,619)

(415,190)

(64,436)

(1,620)

(418,809)

(64,998)

Share-based compensation expenses

108,164

67,501

70,829

10,992

326,221

218,707

33,944

Non-GAAP net income attributable to
      ordinary shareholders

361,177

250,133

180,018

27,938

955,598

696,066

108,030

Non-GAAP net income per ordinary share

—Basic

1.57

1.05

0.75

0.12

4.27

2.93

0.45

—Diluted

1.50

1.04

0.75

0.12

4.02

2.88

0.45

Non-GAAP net income per ADS

—Basic

1.57

1.05

0.75

0.12

4.27

2.93

0.45

—Diluted

1.50

1.04

0.75

0.12

4.02

2.88

0.45

Weighted average number of ADS used in 
     
calculating Non-GAAP net income per ADS

—Basic

230,554,718

238,105,367

238,814,217

238,814,217

224,053,176

237,848,772

237,848,772

—Diluted

240,474,833

241,536,071

241,449,111

241,449,111

237,807,379

241,774,727

241,774,727


Related Links :

http://www.huya.com