LG Develops the ‘Real Folding Window’, a Folding Glass Beater, Coming to Smartphones in 2023

There are a lot of benefits that compensates to a folding PC in the early days too though. It was portable, which means you can set up anywhere and work from anywhere without needing an entire luggage load. The added portability also means you are a lot more flexible with work and locations that allows you to quickly get anything, and everything done from anywhere in the world. Of course, in the early days, you are compromised in battery life, but getting just a few hours window to send out a quick email or quick look at stuff you get from work is more than enough.

Fast forward to 2021 and battery life on portable devices has advanced tremendously. Processing chips are a lot more powerful today and a lot more energy efficient. We are at an age where mobile processing power can match desktop tower processing power. We are at an age where a laptop makes more sense than a tower PC and the tower desktop has been reserved to a niche group.

We have gotten a little side-tracked there, apologies. We are supposed to be talking about foldable smartphones, instead we rambled on about desktop tower PCs and notebook PCs. But it is important to understand why foldable smartphones are going to be the next big thing.

While at this point, the advantages of a candy bar type smartphone still outweigh a foldable smartphone in terms of build durability, optimisation, build quality, and even battery life, there are some arguments for a foldable device. A foldable smartphone can be a lot more versatile in different cases, or they can be a lot less intrusive and more subtle in another.

Take a Samsung Galaxy Z Fold3 for example. It is a regular candy bar smartphone in a lot of cases. When you need a little bit more display real estate for a better overview of your email, multiwindow spaces, and even just for pure entertainment, you simply unfold it to make it a sort of tablet. The Samsung Galaxy Z Flip3 is a little pager like device when you do not need it to be always a nuisance in your face, and its smaller to store in your pockets or bags. When you need the larger display for whatever purpose, it becomes a regular candy bar device. Even Google is on board to produce develop their own foldable device in collaboration with Samsung.

Of course, the foldable smartphone is still very early in technology and one of the biggest problems with it is its durability. In the three iterations of the Samsung Galaxy Z Fold device, that is always its point of contention. In fact, in its first attempt at a folding smartphone, Samsung had to delay the product shipment by a few months just to ensure that they have a better solution to protect their folding display. Samsung is still continuously developing the folding screen technology though.

Oddly enough, competition to Samsung’s folding screen mechanism and build material is not coming from a competing smartphone manufacturer. Well, when we say oddly, we kind of also expected it. The competition to the folding smartphone phenomenon comes from LG and what they call their ‘Real Folding Window’ glass technology.

Before you get confused, LG did make smartphone devices. They pulled out of the smartphone market recently enough that they are now not really a threat or competition to Samsung in the grander mobile device market. They are still one of the largest players in display manufacturing though, which is incidentally also Samsung’s forte. The announcement of their new foldable display technology should come as no surprise.

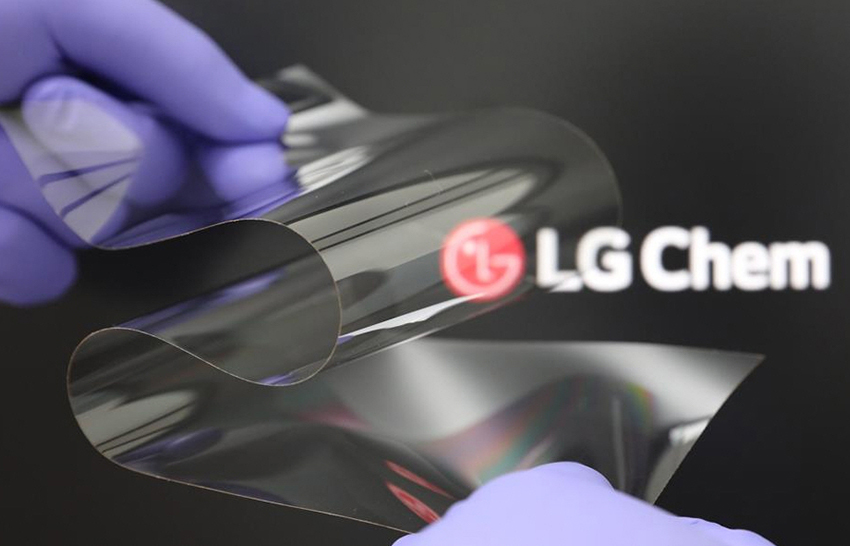
The ‘Real Folding Window’ glass as they call it is not really glass at all. It really is just a coated piece of plastic, to be fair. While it does sound pretty low tech to begin with, it is still complex to implement. They claim that this material allows the piece of ‘glass’ material to be bent on both sides of the device without sacrificing rigidity and durability while remaining free of creases. While it is not technically glass, LG Chem says that the material is as hard as tempered glass and could be even thinner. The prototype material they were able to produce is just a few micrometers thick and is rated to fold more than 200,000 times before any noticeable deterioration.

window 8500
Source: LG Chem

How LG achieved this feat with this prototype display cover material is by using a sheet of thin plastic film that is coated with more plastic film, specifically PET films. If you think that PET sounds familiar, you will be right. It is the material that you can find on modern disposable plastic bottles. It is a clever solution to a complex problem. It is also a more cost friendly option to developing new materials to begin with, which might mean that we will see more competitively priced foldable devices in the future.

You have to keep in mind that the material itself is just a cover though, and it has not addressed the fundamental problem in folding displays; the display itself. LG also says that the new material is not set to be commercialised just yet until 2023 at the earliest. LG is not unique in using PET in their material design though. Samsung’s latest Galaxy Z Fold3 and Z Flip3 has a PET coating on their glass manufactured by a German partner that should prove to be more durable and feels better on the devices.

Samsung is not just sitting by and passing their work on the foldable displays on the Galaxy Z Fold3 and Z Flip3 as the perfect foldable display technology though. We mentioned that they are reportedly working with Google to manufacture Google’s first foldable smartphones. Other manufacturers are also relying on Samsung to ramp up production of their foldable displays. They are also betting that Samsung could come up with a viable glass solution for foldable displays as Samsung has been reportedly working with Corning for their next version of a foldable display.

LG’s participation in the battle for foldable display supremacy is huge though. It ramps competition up, which should ramp innovation and competitiveness of each brand up. It will also eventually lead to a price war, which also means lower prices for the new technology. Lower prices is always good for us consumers who are always hungry for more innovation.

CooTek Announces Second Quarter 2021 Unaudited Results

SHANGHAI, Sept. 8, 2021 — CooTek (Cayman) Inc. (NYSE: CTK) ("CooTek" or the "Company"), a global mobile internet company, today reported unaudited financial results for the second quarter ended June 30, 2021.

Second Quarter 2021 Highlights

  • Net revenues were US$83.2 million, a decrease of 34% from US$126.4 million during the same period last year due to the continuous restructuring of portfolio products.
  • Gross profit was US$74.4 million, a decrease of 38% from US$120.7 million during the same period last year.
  • Gross profit margin was 89.4%, compared with 95.5% during the same period last year.
  • Net income was US$0.3 million, compared with net loss of US$12.4 million last quarter, and net income of US$3.1 million during the same period last year.
  • Adjusted net income[1] (Non-GAAP) was US$1.1 million, compared with adjusted net loss (Non-GAAP) US$11.1 million last quarter, and adjusted net income (Non-GAAP) of US$4.5 million during the same period last year.
  • The Company’s Portfolio Products[2] contributed approximately 99% of total revenues, with a focus on three main categories: online literature, mobile games and scenario-based content apps.

June 2021 Operational Highlights

  • Average daily active users ("DAUs") of the Company’s portfolio products were 23.5 million, a decrease of 2% from 23.9 million in June 2020. Monthly active users ("MAUs") of the Company’s portfolio products were 70.0 million, a decrease of 16% from 83.5 million in June 2020.
  • Average DAUs of the Company’s online literature products were 6.7 million, a decrease of 17% from 8.1 million in June 2020. MAUs of the Company’s online literature products were 18.1 million, a decrease of 36% from 28.4 million in June 2020. The average daily reading time[3] of our online literature product in the Chinese market, Fengdu Novel’s users was approximately 153 minutes in June 2021, which continued to grow steadily compared with 148 minutes in March 2021.
  • Average DAUs of the Company’s TouchPal Smart Input were 109.6 million. MAUs of the Company’s TouchPal Smart Input were 144.1 million.

"We are pleased to return to profitability while keeping a positive quarter-over-quarter revenue growth in the second quarter of 2021," commented Mr. Karl Zhang, CooTek’s Chairman. "We remain committed to our content-focused strategy by continuously enhancing our product portfolio and optimizing our product features. We are encouraged by the solid implementation of the business plan driven by our online literature and mobile games products. With enriching and high-quality content incubation, Fengdu Novel has been expanding the exclusive content distribution and IP business. The revenues from the IP business of Fengdu Novel recorded 194% quarter-over-quarter growth. In addition, our mobile games portfolio has been further strengthened both in the domestic and overseas markets. We have strived to ride on the strong performance of Catwalk Beauty, our globally top-ranking casual game, to form a competitive product pipeline. As a special note, for the second half of 2021, we can expect such pipeline with more than 15 games in the domestic market and more than 20 games in the overseas market under the smooth combination of our internal development and external cooperation."

Mr. Robert Cui, CooTek’s CFO further commented, "As focusing on upgrading our business model, we have been optimizing the balance between our marketing and monetization strategies which resulted in the achievement of group-level profitability in the second quarter of 2021. We will further expand the scale of our product portfolio, improve our user experience and user stickiness and enhance our monetization capabilities. We are confident in delivering a robust and stable long-term growth."

(in millions)

Portfolio Products

Portfolio Products

Including: Online literature

DAUs

MAUs

DAUs

MAUs

Jun’ 19

27.6

65.1

0.3

1.6

Sep’ 19

23.9

67.5

2.0

11.0

Dec’ 19

24.7

74.6

4.8

19.3

Mar’ 20

25.2

89.2

7.3

29.1

Jun’ 20

23.9

83.5

8.1

28.4

Sep’ 20

27.7

94.8

10.0

29.5

Dec’ 20

27.8

85.8

10.2

29.5

Mar’ 21

20.3

58.6

7.5

20.1

Jun’ 21

23.5

70.0

6.7

18.1

Second Quarter 2021 Financial Results

Net Revenues

(in US$ thousands, except percentage)

2Q 2021

1Q 2021

2Q 2020

QoQ % Change

YoY % Change

Mobile Advertising Revenues

82,078

80,408

125,774

2%

(35)%

Other Revenues

1,139

1,144

622

0%

83%

Total Net Revenues

83,217

81,552

126,396

2%

(34)%

Net revenues were US$83.2 million, a decrease of 34% from US$126.4 million during the second quarter of 2020 and an increase of 2% from US$81.6 million during the last quarter. The decrease compared with the same quarter of 2020 was primarily due to a decrease in mobile advertising revenues.

Mobile advertising revenues were US$82.1 million, a decrease of 35% from US$125.8 million during the second quarter of 2020 and an increase of 2% from US$80.4 million during the last quarter. The decrease compared with the same quarter of 2020 was primarily due to the continuous restructuring of portfolio products.

Our portfolio products focus on three categories: online literature, scenario-based content apps and mobile games. Mobile games accounted for approximately 55%, online literature accounted for approximately 37%, and scenario-based content apps accounted for approximately 7% in the second quarter of 2021.

Cost and Operating Expenses

2Q 2021

1Q 2021

2Q 2020

(in US$ thousands, except percentage)

US$

% of revenue

US$

% of revenue

US$

% of revenue

QoQ %
Change

YoY %

Change

Cost of revenues

8,801

10%

8,866

11%

5,691

5%

(1)%

55%

Sales and marketing

59,787

72%

70,736

87%

105,999

84%

(15)%

(44)%

Research and development

9,709

12%

9,037

11%

8,103

6%

7%

20%

General and administrative

4,879

6%

5,557

7%

4,136

3%

(12)%

18%

Other operating income, net

(1,459)

(2)%

(802)

(1)%

(446)

(0)%

82%

227%

Total Cost and Expenses

81,717

98%

93,394

115%

123,483

98%

(13)%

(34)%

Share-based compensation expenses by function

Cost of revenues

54

0.1%

79

0.1%

71

0.1%

(32)%

(24)%

Sales and marketing

14

0.0%

41

0.1%

61

0.0%

(66)%

(77)%

Research and development

456

0.5%

646

0.8%

862

0.7%

(29)%

(47)%

General and administrative

317

0.4%

538

0.6%

430

0.3%

(41)%

(26)%

Total share-based compensation expenses

841

1.0%

1,304

1.6%

1,424

1.1%

(36)%

(41)%

Cost of revenues was US$8.8 million, a 55% increase from US$5.7 million during the same period last year, and a decrease of 1% from US$8.9 million during the last quarter. The year-over-year increase was primarily due to an increase in content costs we paid to our signed authors and third-party content providers for the publishing and licensing of relevant online literature works and an increase in salary and payroll expenses associated with staff.

Gross profit was US$74.4 million, a decrease of 38% from US$120.7 million during the same period last year, and an increase of 2% from US$72.7 million last quarter. Gross profit margin was 89.4%, compared with 95.5% in the same period last year and 89.1% last quarter.

Sales and marketing expenses were US$59.8 million, a decrease of 44% from US$106.0 million during the same period last year, and a decrease of 15% from US$70.7 million last quarter. As a percentage of total revenues, sales and marketing expenses accounted for 72%, compared with 84% during the same period last year, and 87% last quarter. The sequential and year-over-year decrease in sales and marketing expenses as a percentage of total net revenues was primarily due to the continuous transition of the strategy in relation to the acquisition of new users and the retention of existing users which resulted in the reduction of the user acquisition costs.

Research and development expenses were US$9.7 million, an increase of 20% from US$8.1 million during the same period last year and an increase of 7% from US$9.0 million last quarter. The sequential and year-over-year increase was primarily due to an increase in salary and payroll expenses associated with technology R&D staff, and was partially offset by decline in share-based compensation expenses. As a percentage of total net revenues, research and development expenses accounted for 12%, compared with 6% during the same period last year and 11% last quarter.

General and administrative expenses were US$4.9 million, an increase of 18% from US$4.1 million during the same period last year and a decrease of 12% from US$5.6 million last quarter. The sequential decrease was mainly due to a decrease in share-based compensation and third-party outsourcing fee, and was partially offset by a rise in professional service fee. The year-over-year increase was mainly due to an increase in salary and payroll expenses associated with G&A staff, professional service fee and third-party outsourcing fee, and was partially offset by decline in share-based compensation. As a percentage of total net revenues, general and administrative expenses accounted for 6%, compared with 3% during the same period last year and 7% during last quarter.

Other operating income, net was US$1.5 million, compared with US$0.4 million during the same period last year and US$0.8 million last quarter. The other operating income mainly included government subsidy received.

Net income was US$0.3 million, compared with net income of US$3.1 million during the same period last year and a net loss of US$12.4 million last quarter.

Adjusted net income was US$1.1 million, compared with adjusted net income of US$4.5 million in the same period last year and adjusted net loss of US$11.1 million last quarter. The achievement of profitability compared with the adjusted net loss last quarter was mainly due to the decrease in sales and marketing expenses as a percentage of total revenue driven by the continuous transition of the strategy in relation to the acquisition of new users and the retention of existing users.

(in US$ thousands, except percentage)

2Q 2021

1Q 2021

2Q 2020

QoQ % Change

YoY % Change

Net Income (Loss)

264

(12,398)

3,119

(102)%

(92)%

Add: Share-based Compensation related to share

options and restricted share units


841


1,304

1,424


(36)%


(41)%

Adjusted Net Income (Loss) (Non-GAAP)

1,105

(11,094)

4,543

(110)%

(76)%

For the quarter ended June 30, 2021, basic and diluted net income per ADS were US$0.004 and US$0.004, and basic and diluted adjusted net income (Non-GAAP) per ADS were US$0.02 and US$0.02, respectively.

Balance Sheet and Cash Flows

As of June 30, 2021, cash, cash equivalents and restricted cash were US$39.0million, compared with US$56.1 million as of March 31, 2021. As of June 30, 2021, restricted cash were US$3.3 million, mainly consisting of amount of US$3.1 million held in the Company’s bank account as guarantee deposit for loan facility provided by the bank. As of March 31, 2021, the long-term restricted cash was US$21.5 million held in the Company’s bank accounts which were frozen by a local authority in connection with an ongoing investigation related to an alleged illegal act of certain customers. As of June 30, 2021, the relevant bank accounts have been unfrozen.

Net cash outflow from operating activities during the second quarter of 2021 was US$17.5 million, compared with net cash inflow from operating activities of US$5.4 million for the same period in 2020 and net cash outflow from operating activities of US$23.0 million during the last quarter. Cash outflow from operating activities during the second quarter of 2021 was mainly due to the decrease in accounts payable driven primarily by the decrease of our user acquisition costs.

Net cash outflow from financing activities during the second quarter of 2021 was US$0.1 million, compared with net cash inflow from financing activities of US$3.1 million for the same period in 2020 and net cash inflow from financing activities of US$30.2 million during the last quarter. Cash inflow from financing activities during the first quarter of 2021 was mainly due to the Company issued a convertible note for a principal amount of US$10.0 million and received net proceeds of US$8.9 million from this issuance on January 19, 2021, and the Company issued a convertible note for a principal amount of US$20.0 million and received net proceeds of US$ 18.2 million from this issuance on March 19, 2021.

Share Repurchase Plan

On May 18, 2020, the Company announced a share repurchase program (the "2020 Program") whereby the Company is authorized to repurchase its class A ordinary shares in the form of ADSs with an aggregate value of up to US$20.0 million during the 12-month period starting from May 18, 2020. As of June 30, 2021, the Company had used an aggregate of US$6.0 million to repurchase 1.4 million ADSs under the 2020 Program and recorded as treasury stock. The 2020 Program was terminated on May 17, 2021.

Conference Call and Webcast

CooTek’s management team will host a conference call at 8:00 AM U.S. Eastern Time on September 8, 2021 (8:00 PM Beijing Time on the same day), following the results announcement.

The dial-in details for the live conference call are:

United States:

866-548-4713

Hong Kong:

800-961-105

Mainland China:

4001-209-101

International:

1-323-794-2093

Passcode:

7805619

Please dial in 15 minutes before the call is scheduled to begin. When prompted, ask to be connected to the CooTek (Cayman) Inc. call.

A live webcast and archive of the conference call will be available on the Investor Relations section of CooTek’s website at https://ir.cootek.com/.

About CooTek (Cayman) Inc.

CooTek is a mobile internet company with a global vision that offers content-rich mobile applications, focusing on three categories: online literature, scenario-based content apps and mobile games. CooTek’s mission is to empower everyone to enjoy relevant content seamlessly. CooTek’s user-centric and data-driven approach has enabled it to release appealing products to capture mobile internet users’ ever-evolving content needs and helps it rapidly attract targeted users.

Non-GAAP Financial Measure

To supplement the unaudited consolidated financial information prepared in accordance with generally accepted accounting principles in the United States of America ("GAAP"), the Company uses non-GAAP financial measure of adjusted net loss that is adjusted from results based on GAAP to exclude the impact of share-based compensation, and Adjusted EBITDA that is net loss excluding interest income and expense, income taxes, depreciation and amortization, and share-based compensation. The measure should be considered in addition to results prepared in accordance with GAAP, but should not be considered a substitute for, or superior to, GAAP results.

The Company believes that the non-GAAP measure help identify underlying financial and business trends relating to the Company’s results of operations that could otherwise be distorted by the effect of certain expenses that the Company include in loss from operations and net loss. By making the Company’s financial results comparable period over period, the Company believes adjusted net loss and Adjusted EBITDA provides useful information to better understand the Company’s historical business operations and future prospects and allows for greater visibility with respect to key metrics used by the management in financial and operational decision-making. In order to mitigate these limitations, the Company has provided specific information regarding the GAAP amounts excluded from the non-GAAP measure. The table at the bottom of this press release includes details on the reconciliation between GAAP financial measure that is most directly comparable to the non-GAAP financial measure the Company has presented.

Safe Harbor Statement

This press release contains forward-looking statements made under the "safe harbor" provisions of Section 21E of the Securities Exchange Act of 1934, as amended, and the U.S. Private Securities Litigation Reform Act of 1995. These forward-looking statements can be identified by terminology such as "will," "expects," "anticipates," "future," "intends," "plans," "believes," "estimates," "confident," "optimistic" and similar statements. CooTek may also make written or oral forward-looking statements in its reports filed with or furnished to the U.S. Securities and Exchange Commission, in its annual report to shareholders, in press releases and other written materials and in oral statements made by its officers, directors or employees to third parties. Any statements that are not historical facts, including statements about CooTek’s beliefs and expectations, are forward-looking statements that involve factors, risks and uncertainties that could cause actual results to differ materially from those in the forward-looking statements. Such factors and risks include, but not limited to the following: CooTek’s mission and strategies; future business development, financial conditions and results of operations; the expected growth of the mobile internet industry and mobile advertising industry; the expected growth of mobile advertising; expectations regarding demand for and market acceptance of our products and services; competition in mobile application and advertising industry; relevant government policies and regulations relating to the industry and the development and impacts of COVID-19. Further information regarding these and other risks, uncertainties or factors is included in the Company’s filings with the U.S. Securities and Exchange Commission. All information provided in this press release is current as of the date of the press release, and CooTek does not undertake any obligation to update such information, except as required under applicable law.

For investor enquiries, please contact:

CooTek (Cayman) Inc.
Mr. Robert Yi Cui
Email: IR@cootek.com

ICA Investor Relations (Asia) Limited
Mr. Kevin Yang
Phone: +86-21-8028-6033
E-mail: cootek@icaasia.com


CooTek (Cayman) Inc.

Unaudited Condensed Consolidated Statement of Operations

(in thousands, except for share and per share data)

Three Months Ended

Six Months Ended

June 30,

March 31,

June 30,

June 30,

2020

2021

2021

2020

2021

US$

US$

US$

US$

US$

Net revenues

126,396

81,552

83,217

233,409

164,769

Cost of revenues

(5,691)

(8,866)

(8,801)

(10,273)

(17,667)

Gross Profit

120,705

72,686

74,416

223,136

147,102

Operating expenses:

Sales and marketing expenses

(105,999)

(70,736)

(59,787)

(208,435)

(130,523)

Research and development expenses

(8,103)

(9,037)

(9,709)

(14,950)

(18,746)

General and administrative expenses

(4,136)

(5,557)

(4,879)

(7,437)

(10,436)

Other operating income, net

446

802

1,459

836

2,261

Total operating expenses

(117,792)

(84,528)

(72,916)

(229,986)

(157,444)

Income (loss) from operations

2,913

(11,842)

1,500

(6,850)

(10,342)

Interest income (expense), net

211

(313)

(1,336)

234

(1,649)

Foreign exchange (loss) gain, net

(2)

(243)

19

(224)

Fair value change of derivatives

85

85

Income (loss) before income taxes

3,122

(12,398)

268

(6,616)

(12,130)

Income tax expense

(3)

(3)

Share of loss in equity method investment

(4)

(4)

Net income (loss)

3,119

(12,398)

264

(6,619)

(12,134)

Net income (loss) per ordinary share

Basic

0.001

(0.004)

0.0001

(0.002)

(0.004)

Diluted

0.001

(0.004)

0.0001

(0.002)

(0.004)

Weighted average shares used in calculating
    net income (loss) per ordinary share

Basic

3,084,894,043

3,136,585,226

3,238,319,836

3,094,780,922

3,187,723,620

Diluted

3,222,716,303

3,136,585,226

3,279,417,127

3,094,780,922

3,187,723,620

Non-GAAP Financial Data

Adjusted Net Income (Loss)

4,543

(11,094)

1,105

(4,254)

(9,989)

Adjusted EBITDA

5,123

(9,924)

3,428

(2,945)

(6,496)


Unaudited Condensed Consolidated Balance Sheets 

(in thousands, except for share and per share data)

As of

March 31, 
2021

June 30, 
2021

US$

US$

ASSETS

Current assets:

Cash and cash equivalents

31,413

35,667

Restricted cash

3,238

3,293

Short-term investment

50

50

Accounts receivable, net of allowance for doubtful accounts of US$1,126 as of  
  March 31, 2021 and US$1,180 as of June 30, 2021, respectively

27,425

31,451

Prepaid expenses and other current assets

9,293

8,966

Total current assets

71,419

79,427

Long term restricted cash

21,476

Property and equipment, net

4,916

4,100

Intangible assets, net

360

326

Operating lease right-of-use assets[4]

2,177

1,818

Long-term investments

304

620

Other non-current assets

1,015

1,211

TOTAL ASSETS

101,667

87,502

LIABILITIES AND SHAREHOLDERS’ DEFICIT

Current liabilities

Accounts payable

63,819

50,245

Short-term borrowings

15,028

15,162

Accrued salary and benefits

5,389

6,555

Operating lease liabilities, current[4]

1,486

1,322

Accrued expenses and other current liabilities

9,697

6,685

Convertible notes

16,547

16,243

Derivative liabilities

1,662

1,577

Deferred revenue

3,114

3,086

Total current liabilities

116,742

100,875

Other non-current liabilities

425

391

Operating lease liabilities, non-current3

688

231

TOTAL LIABILITIES

117,855

101,497


Unaudited Condensed Consolidated Balance Sheets (continued):

(in thousands, except for share and per share data)

As of

March 31, 
2021

June 30, 
2021

US$

US$

Shareholders’ Deficit:

Ordinary shares

33

33

Treasury shares

(5,132)

(5,229)

Additional paid-in capital

203,836

206,159

Accumulated deficit

(213,363)

(213,099)

Accumulated other comprehensive loss

(1,562)

(1,859)

Total Shareholders’ Deficit

(16,188)

(13,995)

TOTAL LIABILITIES AND SHAREHOLDERS’ DEFICIT

101,667

87,502


Unaudited Condensed Consolidated Statement of Cash Flows

 (in thousands, except for share and per share data)

Three Months Ended

Six Months Ended 

 June 30,

March 31,

June 30, 

June 30,

2020

2021

2021

2020

2021

US$

US$

US$

US$

US$

Net cash provided by (used in)
     operating activities

5,402

(22,974)

(17,540)

20,362

(40,514)

Net cash used in investing activities

(13,859)

(359)

(565)

(14,628)

(924)

Net cash provided by (used in) 
      financing activities

3,100

30,150

(135)

(754)

30,015

Net (decrease) increase in cash and 
      cash equivalents

(5,357)

6,817

(18,240)

4,980

(11,423)

Cash, cash equivalents, and restricted 
      cash at beginning of period

70,026

49,622

56,127

59,966

49,622

Effect of exchange rate changes on 
      cash and cash equivalents

252

(312)

1,073

(25)

761

Cash, cash equivalents, and restricted
      cash at end of period

64,921

56,127

38,960

64,921

38,960


Reconciliations of GAAP and Non-GAAP Results

(in thousands, except for share and per share data)

Three Months Ended

Six Months Ended 

 June 30,

 March 31,

June 30, 

June 30,

2020

2021

2021

2020

2021

 US$

US$

US$

 US$

US$

Net Income (Loss)

3,119

(12,398)

264

(6,619)

(12,134)

Add:

Share-based compensation related to share options and
   restricted share units

1,424

1,304

841

2,365

2,145

Adjusted Net Income (Loss) (Non-GAAP)*

4,543

(11,094)

1,105

(4,254)

(9,989)

Add:

Interest (income) expense, net

(211)

313

1,336

(234)

1,649

Income taxes

3

3

Depreciation and amortization

788

857

987

1,540

1,844

Adjusted EBITDA (Non-GAAP)*

5,123

(9,924)

3,428

(2,945)

(6,496)

* The tax impact to the non-GAAP adjustments is zero.


[1] "Adjusted net income" (Non-GAAP) is a non-GAAP measure, which is defined as net loss excluding share-based compensation related to share options and restricted share units. For further information, please see "Non-GAAP Financial Measures" and "Reconciliations of GAAP and non-GAAP results" at the bottom of this release.

[2] "Portfolio Products" is to the mobile applications that we develop and provide to our users and business partners, which exclude TouchPal Smart Input and TouchPal Phonebook.

[3] "Average daily reading time" for any day is calculated by dividing (i) the sum of time spent on reading books on our Fengdu Novel for such day, by (ii) the number of Fengdu Novel users who spent time on reading books for such day. The average daily reading time for any month is calculated by dividing (i) the sum of average daily reading time for each day in such month, by (ii) the number of days in such month.

[4] On January 1, 2021, the Company adopted ASC 842, the new lease standard, using the modified retrospective method.


Related Links :

https://ir.cootek.com/

RateGain’s OPTIMA releases MarketDRONE Narratives to help hoteliers react faster to market volatility


DALLAS, LONDON and SINGAPORE, Sept. 8, 2021 — RateGain Technologies, a provider of SaaS solutions for travel and hospitality, announced today the launch of MarketDRONE Narratives, an update to its real-time rate intelligence SaaS solution for hotels, OPTIMA. Through this update, RateGain aims to transform how revenue managers plan and tackle market volatility on an everyday basis.

On a daily basis revenue managers spend considerable time manually sourcing data and identifying critical insights that impact their market position. However, with increasing demand channels, last-minute travel plans, and the ongoing volatility, most revenue managers are pressed for time to get these insights on demand to mitigate inaccurate and incomplete analysis that drives revenue maximization.

MarketDRONE Narratives provides clear actionable insights, shared every time there is a change in the market, helping revenue and pricing managers know exactly how to position ones revenue strategies for the day to mitigate any loss of market share while increasing RevPAR.  Revenue and pricing managers will now save critical time that was earlier spent in collating and analyzing data, allowing them to take the lead in attracting more guests and increasing revenue.

Narratives are generated based on change hints using a mix of distribution and market supply data combined with competitive rate shopping data across Hotels and OTAs. It generates personalized insights using all these data points with customized thresholds for each of the hotels that they can configure to get the most relevant insights for tailoring their strategies. RateGain developed these narratives by consulting our customers, industry experts to understand insights that are most vital to make better strategies.

Over the last few years, RateGain has focused on solving the problem of collecting and providing accurate real-time data for hoteliers through updates to OPTIMA such as pricing playground and lightning refresh. However, with the volatility introduced in pricing since the pandemic, hoteliers don’t only need real-time data but also instant insights which are powered by Narratives.

Commenting on the launch, Harmeet Singh, CEO, RateGain, said, "As one of the largest aggregators of data in our industry, RateGain is committed to listening to our customers who have clearly stated the need to evolve rate intelligence solutions. MarketDRONE Narratives is a step in that direction where we continue to push innovation and help our customers move faster every day to unlock more revenue. We will continue to evolve and add more depth to this product such as providing insights on Parity and Events Intelligence to help our customers get all the insights they need instantly. "

About RateGain

RateGain is a global provider of SaaS solutions for the hospitality and travel industry, offering travel and hospitality solutions that unlock new revenue every day. We are one of the largest aggregators of data points in the world for the hospitality and travel industry (Source: Phocuswright Report).

CONTACT:  Ankit Chaturvedi, AVP-Marketing, ankit.chaturvedi@rategain.com


Create a Collaborative Organization to Help Manufacturing Companies Deliver Exceptional Customer Service at Every Touchpoint

Security and feedback systems are critical to companies’ CX enhancement efforts, finds Frost & Sullivan

SANTA CLARA, Calif., Sept. 8, 2021 — Remote work, agent shortages, delays in the supply chain, manufacturing, distribution, and, in many cases, rapid business growth have dramatically impacted customer contact organizations across industries. As a result, improving customer experience (CX) has become a top business goal for manufacturing companies across almost every industry. They are increasingly moving beyond "people, process, and technology" to deliver reliable and frictionless CX at every touchpoint.

Frost & Sullivan’s latest virtual ThinkTank, Delivering Frictionless Customer Experience in Manufacturing, discussed what is next in CX and digital transformation as the world begins to recover from the pandemic. It explored the top challenges and ways to help manufacturing companies make the best investment decisions as they continue their digital transformation journey.

To download the complimentary Executive Brief, please visit: http://frost.ly/64z.

"Customers want personalized products, services, and care but are apprehensive about sharing their information for security reasons. Therefore, companies need to be upfront about their security measures and how customer data will be used," said Alpa Shah, Vice President, Customer Experience at Frost & Sullivan. "In addition to security, companies must constantly improve processes, train employees to improve skill sets, and provide the tools necessary to empower them to deliver exceptional CX."

"Although companies have been disrupted and have an immediate need to integrate across the entire supply chain, many have multiple systems on the back end and do not have a central strategy," noted Brian Remmel, General Manager, Business Applications at Microsoft. "We traditionally look at CX as a front-office issue. The reality is that CX is impacted by the front office, the back office, all the way through the entire customer journey. The best way to provide an incredible CX is to deliver an exceptional employee experience because it is your employees that are servicing customers."

It is clear that to succeed in an altered marketplace, manufacturing companies will have to offer differentiated CX by:

  • Becoming a customer-first manufacturer: Establish an effective feedback loop from customers, marketing and sales, and research and development. With access to easy-to-use analytics, companies will truly understand their customers’ needs and address them.
  • Building trust and loyalty with customers: Customers are more willing to share their data if they have control over it. Companies need to help them realize benefits such as convenience and anytime-anywhere access.
  • Unlocking new service revenue streams through connected devices: Connected devices allow companies to be predictive rather than reactive by knowing what is going to fail in the manufacturing process, preventing problems from ever occurring, and prolonging the life of critical assets. More importantly, technology can reduce the cost to serve customers by offering self-serve capabilities.

About Frost & Sullivan
For six decades, Frost & Sullivan has been world-renowned for its role in helping investors, corporate leaders and governments navigate economic changes and identify disruptive technologies, Mega Trends, new business models and companies to action, resulting in a continuous flow of growth opportunities to drive future success. Contact us: Start the discussion.

Media Contact:

Priya George,
Corporate Communications, Frost & Sullivan
E: priyag@frost.com

http://ww2.frost.com


Related Links :

http://www.frost.com

ROG Unleashes the ROG Zephyrus G14 Alan Walker SE to Walkers in Malaysia at MYR 7,999!

August was an interesting month for ASUS. They launched a brand-new gaming laptop in collaboration with a big name in the new age world of EDM Music. That name is Alan Walker, if you have not guessed it yet.

At its global launch, we mentioned Malaysia will get to the notebook somewhere in September. We did not know specifically when though. We are excited about the laptop though, because we were mainly interested in the included box that packages the ROG Zephyrus G14 Alan Walker SE. At the same time, it is one of the most striking looking collaboration pieces from ASU ROG. In other words, it looks stunning, and we dig its looks.

At today’s launch gambit of the ASUS ROG Zephyrus G14 AW SE, we can tell you that you can get your hands on one today onward if you have MYR 7,999 to spare. The ROG Zephyrus G14 AW SE, admittedly, is more expensive than the regular ASUS ROG Zephyrus G14. To be specific, you are paying about MYR 300 over the most expensive ASUS ROG Zephyrus G14 device available.

The ROG Zephyrus G14 AW SE packs a powerful AMD Ryzen 9 5900HS processor with Zen 3 architecture which is respectable enough. It also comes with NVIDIA’s GeForce RTX 3050 Ti GPU, which is also a respectable processor for gaming notebooks. The combination of which powers Windows 10 on a 14-inch QHD IPS display that refreshes at 120Hz.

00 Zephyrus G14 AW SE 3
Source: ASUS

In comparison, the top-of-the-line ASUS ROG Zephyrus G14 features AMD’s Ryzen 9 5900HS Zen 3 processor. It also comes with NVIDIA’s GeForce RTX 3060 GPU platform which packs a lot of punch. This package comes at the price of MYR 7,499.

Before you write off the new ROG Zephyrus G14 AW SE though, you should know that your money buys more than just a gaming notebook PC. Alongside your G14 AW SE are a few extra goodies that you will not find anywhere else in the PC market. You get an Alan Walker x ROG designed cap and socks. On top of that, you are getting a custom ROG laptop sleeve that has Alan Walker design all over it.

Those may not sound like a lot. You are also buying a sort of an audio sampling box to go along with your Alan Walker edition of the ROG Zephyrus G14. The sampler box allows you to be your own DJ and be more creative with music samples that is included with the built-in software. You can even load the samples into the software if you want and create your own tracks. On top of that also, you get a slew of custom Alan Walker inspired graphics to load up on the AniMe Matrix panel on the back of the display.

  • Zephyrus G14 AW SE Package ROG Remix
  • Zephyrus G14 AW SEROG Sleeve 01 Lighting
  • Zephyrus G14 AW SEROG Remix lighting
  • Zephyrus G14 AW SE ROG x AW Socks 01
  • Zephyrus G14 AW SE ROG x AW Cap 01
  • 00 Zephyrus G14 AW SE 1
  • 00 Zephyrus G14 AW SE 2
  • 00 Zephyrus G14 AW SE 3
  • 00 Zephyrus G14 AW SE All bundled
  • Zephyrus G14 AW SE Laptop 16 Lighting
  • Zephyrus G14 AW SE Laptop 01 KB Lighting
  • Zephyrus G14 AW SE Laptop 19

The ASUS ROG Zephyrus G14 AW SE is now available for purchase across ASUS retailers nationwide. You can also purchase the laptop via their online retail partners, Shopee and Lazada. As mentioned, it will set you back MYR 7,999. For fans in Malaysia though, you get an extra special edition item to go along with your ROG Zephyrus G14 AW SE. As part of the 9.9 promotions, every order of the Alan Walker x ROG notebook is entitled to an ROG Slash Sling Bag worth MYR 399, while stocks last. More information on the ASUS ROG Zephyrus G14 AW SE can be found on their website.

Management change at Mycronic

STOCKHOLM, Sept. 7, 2021 — Mycronic AB (publ) has today appointed Pierre Brorsson as Chief Financial Officer effective October 25, 2021. A Swedish citizen born in 1972 with a MSc in Business Administration from Linköping University, Pierre is currently working in his own company focusing on Acquisitions and Financial Management. He is today engaged as Integration Manager by Atlas Copco for their newly formed Machine Vision Solution division. He was previously Group CFO at Ramirent between 2016 and 2018 and before that held senior positions both as Financial Manager as well as VP Business Development at Atlas Copco.

"I am very pleased to welcome Pierre to Mycronic", says Anders Lindqvist, Mycronic’s President and CEO. "Pierre has a solid international industrial background from key financial and business development functions in Atlas Copco and Ramirent. I am convinced he has the right skills, experience and drive to contribute to Mycronic´s further profitable growth in several ways. Pierre will in the management team, in addition to the CFO-scope, assume responsibility for Corporate Development, previously lead by Niklas Edling."

Pierre will replace Torbjörn Wingårdh, who has chosen to pursue a career outside the company in connection with the change in organization. Torbjörn will remain in his current role until October 25 and will stay with Mycronic until March 7, 2022, to ensure a smooth transition.

"I would like to thank Torbjörn for his valuable contribution during his 5 years with Mycronic. He has been an important member of the management team during very successful years", says Anders Lindqvist, Mycronic’s President and CEO.
 

For additional information, please contact:
Anders Lindqvist
President and CEO
Tel: +46 8 638 52 00, e-mail: anders.lindqvist@mycronic.com

Sven Chetkovich
Director Investor Relations
Tel: +46 70 558 39 19, e-mail: sven.chetkovich@mycronic.com

The information in this press release was published on September 7, 2021, at 2:00 p.m. CEST

About Mycronic
Mycronic is a Swedish high-tech company engaged in the development, manufacture and marketing of production equipment with high precision and flexibility requirements for the electronics industry. Mycronic’s headquarters are located in Täby, north of Stockholm and the Group has subsidiaries in China, France, Germany, Japan, the Netherlands, Singapore, South Korea, United Kingdom and the United States. Mycronic is listed on Nasdaq Stockholm. www.mycronic.com

This information was brought to you by Cision http://news.cision.com

https://news.cision.com/mycronic-ab/r/management-change-at-mycronic,c3411058

The following files are available for download:

Fossil Watches Lose Face in New Update

Fossil produces what is possibly one of the better Smartwatches available running Android Wear or Wear OS. Their watches manage to capture the allure and feel of traditional smartwatches while bringing it into the future with modern smartwatch functionality. With their recent release of the Wear OS 3 powered Gen 6 smartwatches, it seems like a new update may have just cleaned house; removing a reported 33 watch faces from their library.

The update which was pushed through the PlayStore introduced two new watch faces: Dashboard Digital and Fitness Digital. The new watch faces come with a minimal design but seems to be focused on delivering information that might be important to the Fossil smartwatch owner. Fitness Digital, as the name suggests, focuses on the metrics related to fitness and health; while Dashboard Digital focuses on more essential details.

0823 Gen6 Learnmore Hero9 Group slide3 Desktop@2x
Source: Fossil Group

9to5 Google has reported that with the introduction of the new smartwatch faces, the Fossil Gen 5 lineup also loses 33 watch faces out of the blue. If you were using one of the watch faces listed below, it’s likely you had a rude awakening with the smartwatch reverting to its default watch face when the update was rolled out.

The list of confirmed watch faces is listed below:

  • Big Tic
  • Blue
  • Candice Huffine
  • Colorist
  • Compass
  • Cory Richards
  • Darryl Westly
  • Defender
  • Ettore
  • Flip Digital
  • Fred
  • Grant
  • KJ Apa
  • Magic 8-Ball
  • Mandy Moore
  • McKinney
  • Mechanical Digital
  • Men’s Fashion Digital
  • Minimal Dressy
  • Minimalist Analog
  • Mood
  • Movember
  • Movember Analog
  • Movember Digital
  • No Icon Digital
  • P-51
  • Rainbow
  • Robot
  • Roulette
  • Sail Dial
  • Scarlette Shimmer
  • Speedometer
  • Turn Table

It hasn’t been ascertained if older generations of Fossil smartwatches are affected. That said, the reduction in the number of watch faces could be a good thing when it comes to the Gen 5 Fossil smartwatches. It could indicate that Fossil is preparing the smartwatch for the jump to Wear OS 3. However, nothing has been confirmed by Fossil at the time of writing.

Mobileum Referenced for 5G Service Assurance and Testing Vendors in 2021 Gartner ® Report Titled, “Market Trend: Expand CSPs’ Monetization With 5G, AI, Edge Compute”

Testing Requirements Vital to 5G Monetization

CUPERTINO, Calif., Sept. 7, 2021 — Mobileum Inc. ("Mobileum"), a leading global provider of analytics solutions for roaming and network services, security, risk management, testing, and monitoring, is pleased to announce that it has been referenced in the 2021 Gartner report, " Market Trend: Expand CSPs’ Monetization with 5G, AI, Edge Compute".[1] The report identifies Mobileum as a Service Assurance and Testing vendor.


As CSPs transition to 5G, there are new opportunities to leverage their 5G networks as a service, providing vertical industries, such as industrial automation, security, healthcare, and automotive, the ability to boost connectivity-enabled productivity and innovation. With advanced closed-loop service assurance mechanisms supported by testing and revenue assurance mechanisms in place, CSPs can pursue new business models, such as offering SLA-based pricing according to various levels of quality. However, this requires an integrated testing and charging monitoring solution encompassing the 5G device, radio access, and core network. Mobileum’s Active Intelligence platform is a leading telecom-focused analytics technology with a robust testing infrastructure, automation capabilities, and a widespread set of network interfaces that allows for an active-passive testing and monitoring approach required to support 5G SLA-based business models.

"Due to the nature of dynamic provisioning and the scaling of network capacity and resources brought on by 5G, it’s more important than ever for CSPs to ensure that the quality of service delivered is meeting SLAs and the charges for those services are accurate. We are pleased to have been included in this Gartner report as a company providing this critical business support," stated Ron Haberman, Chief Product Officer at Mobileum.

Mobileum’s Testing and Monitoring and Risk Management solutions provide the service and connectivity customer experience monitoring required to support B2B and B2B2X business models. The in-depth portfolio provides the automation framework and performance intelligence necessary for CSPs to understand the domestic network experience spanning 5G, IoT and eSIM, mobile money, video, emergency service, IMS, voice, data and messaging, core network, to the smartphone and app experience. In addition, it is supporting CSPs across the world to test and monitor the international network experience for their roaming, IoT and connected cars, VoLTE roaming, and international Carrier customers. Recently, Mobileum announced that Audi (AUDVF) is deploying Mobileum’s Connected Car Testing solution to test and monitor the end-to-end quality of service (QoS) of their connected cars and ensure the highest service assurance standards and control over customer experience. 

Sources (available to Gartner subscribers):

[1] Gartner, "Market Trend: Expand CSPs’ Monetization with 5G, AI, Edge Compute", Susan Welsh de Grimaldo, 27 May 2021

Gartner Disclaimer

GARTNER is a registered trademark and service mark of Gartner, Inc. and/or its affiliates in the U.S. and internationally and is used herein with permission.

Gartner does not endorse any vendor, product or service depicted in its research publications, and does not advise technology users to select only those vendors with the highest ratings or other designation. Gartner research publications consist of the opinions of Gartner’s research organization and should not be constructed as statements of fact. Gartner disclaims all warranties, expressed or implied, with respect to this research, including any warranties of merchantability or fitness for a particular purpose.

About Mobileum Inc.

Mobileum is a leading provider of Telecom analytics solutions for roaming, core network, security, risk management, domestic and international connectivity testing, and customer intelligence. More than 1,000 customers rely on its Active Intelligence platform, which provides advanced analytics solutions, allowing customers to connect deep network and operational intelligence with real-time actions that increase revenue, improve customer experience, and reduce costs.  Headquartered in Silicon Valley, Mobileum has global offices in Australia, Dubai, Germany, Greece, India, Portugal, Singapore, and UK.

More in www.mobileum.com and follow @MobileumInc on Twitter.

Learn more in https://www.mobileum.com/  and follow @MobileumInc on Twitter.


‘Live Revival’ Sees Fitness Fans Flock Back to Facilities, Finds New Les Mills Report

Les Mills 2021 Global Fitness Report spotlights how the world will work out post-pandemic, with live workouts and "Omnichannel Fitness" tipped to prevail.

LONDON, Sept. 7, 2021

Key findings:

  • Gyms worldwide making strong recoveries, with class attendances at 120% of pre-COVID levels in markets where restrictions have lifted.
  • Two-thirds of gym members prefer working out with others as opposed to alone, with live fitness classes cited as the most popular offering at the gym.
  • Live classes at the gym are more than twice as appealing as livestream options at home, with live Instructors and "the energy of the group" both key factors.
  • But COVID legacy will live on, with 80% of gym members planning to continue using digital workouts post-pandemic in addition to live workouts.
Despite fears the COVID-inspired home fitness boom would spell the end for fitness facilities, the report finds gyms worldwide making strong recoveries since reopening.

Gyms around the world are set for a roaring recovery as they emerge from the pandemic, with fitness fans eager to get back to live workouts with friends.

That’s according to a major new report that charts a global ‘live revival’, with fitness fans flocking to facilities for greater motivation and social connection after months of solitary home workouts.

The Les Mills 2021 Global Fitness Report – which features insights from 12,157 consumers across five continents – explores how the pandemic has changed our fitness habits and spotlights the trends that will shape our workouts in years to come.

Despite fears the COVID-inspired home fitness boom would spell the end for fitness facilities, research suggests the majority of members are rushing back to their gym. The report finds gyms worldwide making strong recoveries since reopening, with class occupancy at 120% of pre-COVID levels in markets where capacity restrictions have lifted.

After a year of enforced home workouts, appetite for live fitness experiences in groups is soaring, with 85% of gymgoers interested in trying live classes in their facility.

Two-thirds of gym members (67%) say they prefer working out in groups, while live classes in gyms are nearly twice as popular as online classes that are livestreamed (done by 44% of members vs 23%).

Rockstar Instructors are identified as the single most important factor for gymgoers when choosing a live class, favored by 28%, ahead of the quality of music (24%) and type of class (21%). Quality Instructors are cited as a key component of the live revival, meeting strong consumer demand for added motivation and deeper connection in their workouts.

"After months of being stuck at home, people can’t wait to get back to fitness facilities and enjoy their favorite workouts with familiar faces," says Phillip Mills, Les Mills Founder and Executive Director.

"Much like bars, restaurants, and sports events, fitness is experiencing a real ‘live revival’, as people make up for lost time with a renewed appreciation for real-world social settings.

"Many people have missed the thrill of a busy class led by a rockstar Instructor, and the extra motivation from working out with others.

"But that doesn’t mean home workouts will disappear as we emerge from the pandemic. The digital fitness boom and the growth of home working mean consumers are taking an omnichannel approach to their training, mixing thrilling live workouts at the gym with the convenience of digital workouts at home."

The impact of the pandemic on the fitness landscape is evident throughout the report. The digital fitness boom looks set to last, with 80% of gym members planning to continue using digital workouts post-pandemic.

‘Omnichannel Fitness’ – a blend of in-gym and digital home workouts – is tipped to gain traction as we emerge from the pandemic, with the majority of exercisers (59%) favoring a 60:40 split between gym and home workouts.

Access the full report: https://www.lesmills.com/global-fitness-report/

Media requests: press@lesmills.com

About Les Mills

Les Mills is the global leader in group fitness and creator of 20 programs including BODYPUMP™ and BODYCOMBAT™. Les Mills workouts are delivered by 140,000 certified instructors in 21,000 gyms across 100 countries, as well as via the LES MILLS™ On Demand streaming platform. The company was founded by Les Mills – a four-time Olympian and head coach of New Zealand’s track and field team – who opened his first gym in 1968 to bring elite sports training to the masses.


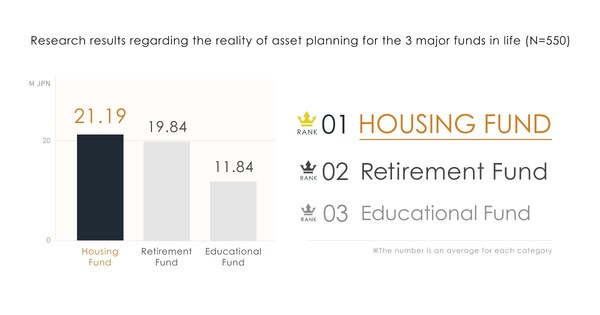
“Home Funding” is the least considered among retirement and education, but prepared cost is highest, averagely 21.19 million JPY in Japan


TOKYO, Sept. 7, 2021 — A result of survey was announced by one stop real estate platform service "RENOSY" provided by GA technologies Co.,Ltd. (Headquarters: Minato City, Tokyo; CEO: Ryo Higuchi; Securities Code: 3491; "the Company") regarding "Financial Assets Plans & Housing" among families with annual income of more than 10million JPY with children under schooling age living in major districts of Tokyo.

According to the research, "home funding" is the least considered among "retirement fund" and "educational fund", although these funds together are said to be the 3 major funds in life in Japan. "Lack of adequate knowledge regarding this field" is the answer that has being most frequently answered as the reason. On the other hand, however, home funding costs the most among the 3 major funds when it comes to preparation. People who are planning about spending on real estate usually see it as an investment for oneself and tend to pay more attention to the market price of the real estate property itself and the timing for sell.

Along with the research result, we are looking for providing a more sophisticated service that integrates online and offline elements together for a more elaborate customer service of RENOSY. We want to make experience regarding real estate less complicated by solving all kinds of issues and concerns customer may have (*2).

Research on Attitudes of Asset Building and Housing in JAPAN

[ Result Summary ]
1."Home funding" is the least considered among the 3 major funds in a person‘s life
2."Lack of adequate knowledge" is the most frequented given answer as a reason
3."Home funding" average preparation fund cost is 21.19 million JPY
4.People who are planning to spending on housing, tend to pay more attention to its market value as an investment and the timing for sell

Outline of the research

Research period: July 19, 2021July 21, 2021
Research method: Online questionnaire
Research target: families with annual income of more than 10million JPY with children under schooling age living in major districts of Tokyo. / Both male and female / Age 25 – 45 / Total 550 people

Details

1. "Home funding" is the least considered among the 3 major funds in a person‘s life

"Retirement", "education", "home" funds are said to be the 3 major funds in life.  While more than half of the people being researched answered positively of making plans about "retirement" and "educational "funds. However, there are 27.1% answered with "No plan" when it comes to "home". Together with the people who answered with "Considered, however have not taking any initiative yet" which accounts for 40% of the total.


2. "Lack of adequate knowledge" is the most frequented given answer as a reason

The reason that has been given most frequently of why people tend to skip the planning for home funding, is because of "Lack of sufficient knowledge" which accounts for 27%, followed by "Having savings in the bank is enough for me" which is 22.3%. Other reasons such as "Already own a real estate property", "Already have a plan for housing loan", "No further plan for buying a new house" etc. are also given.

3. "Home funding" average preparation fund cost is 21.19 million JPY

When being asked about the specific amount of fund prepared for housing among people who answered positively, the number rounded up with an average of 21.19 million JPY which is also the highest among the 3 categories.


4. People who are planning to spending on housing, tend to pay more attention to its market value as an investment and the timing for sell

From the result of the research, people who are planning about buying a house of their own tend to view the property as an investment and showing higher interests in the price value of the property and the timing for sell compared to those who are not making any plans regarding purchasing a house.

(4-1) When being asked about "Whether if you prefer to be able to keep up with the assessment information about your owned property (*3)?" 62.5% of people who are making financial plans for housing answered, "Very much", "Do think about that" compared to 32.6% of people who do not have any plans regarding purchasing a house.

(4-2) When it comes to the question where "Are you interested in using AI to do a simulation of the assessment on the property you currently owned (*3)?" 61% of people who are making financial plans for housing answered, "Very much", "Do think about that" compared to 30.5% of people who do not have any plans regarding purchasing a house.

(4-3) While when being asked about "Are you interested in selling the property you owned(*3) with a price other than the one being calculated and suggested by AI simulation?" 40.1% of people who are making financial plans for housing answered, "Very much", "Do think about that" compared to 17.4% of people who do not have any plans regarding purchasing a house.

(*1) The so called 3 major funds in a person’s life is as followed: "Home funding", "Retirement fund" and "Educational fund"

(*2) Related press release: RENOSY: Checking up your property’s market price by AI assessment and more on RENOSY (https://www.ga-tech.co.jp/news/10067/)

(*3) Property purchased not by oneself also included

About RENOSY OWNER‘S MY PAGE
This is an exclusive service for RENOSY members (Memberships are FREE). By applying AI technology, we make all the information such as " estimated market price", "estimated price for rent" and the fluctuations visualizable. Users who are planning about selling or renting the property could access the information on "OWNER’S MY PAGE". On the other hand, for those of whom are interested in real estate investment can check up the latest updates about live streaming announcements about assets management and property investment as well as scheduling appointments with our agents. We offer our customers the most useful information that suits with one’s needs and condition.

About RENOSY
RENOSY is a comprehensive one-stop real estate platform provided by GA technologies under the concept of "making house hunting and assets management easier". With the business vision of "inspiring the world with the power of technology and innovation". The purpose of RENOSY is to make everything about real estate easier for consumers in the field of "rent", "buy", "sell", "lease", "renovate" or "invest", and we provide these services in one-stop. Currently, we have about 20,0000 registered members, and more than 15,0000 existing properties in the center of Tokyo available on our website. GA technologies is working on helping to accelerate the digital transformation of the industry, and to provide a better customer experience through both online and offline.
– Data of the number of RENOSY members: by June 2021 / Data of the number of properties available on the website: by October,2021

About GA technologies
Company: GA technologies Co., Ltd.
Representative: Ryo Higuchi
URL: https://www.ga-tech.co.jp/en/ 
Head office: 40F of Sumitomo Fudosan Roppongi Grand Tower, Roppongi 3-2-1, Minato District, Tokyo
Year of founding: March 2013
Capital fund: 72,859,98310 JPY (As of July 2021)
Services:

  • PropTech real estate services platform: RENOSY (Portal media, Real estate agent service, real estate dealing, renovation service, property management)
  • SaaS type of BtoB PropTech products development
  • Data research and analysis using AI
  • Overseas real estate platform service targets at the Greater China area: Shenjumiausuan, overseas PropTech business

Major group companies: ITANDI, Inc, Modern Standard Co, Ltd., Shenjumiausuan Co.,Ltd and other 8 companies