Black Friday & Cyber Monday Deal: Four Months Of TIDAL For Only $0.99 (Premium) And $1.99 (HiFi)

New Customers Can Take Advantage of Limited-Time Offer From November 24-December 2

NEW YORK, Nov. 19, 2020 — Today, global music streaming and entertainment platform, TIDAL, announced a Black Friday and Cyber Monday limited-time offer. From November 24 through December 2, 2020, new customers can receive four months of TIDAL at $0.99 for Premium or $1.99 for a HiFi membership (a value of $39.96 (Premium) and $79.96 (HiFi) for four months.) To take advantage of the offer this holiday season, new members can head to TIDAL.com/blackfriday.

TIDAL’s Premium and HiFi tiers offer music fans unlimited access to its extensive catalog of over 70 million tracks across all genres, thousands of expertly curated playlists by TIDAL’s seasoned editorial team, and endless artist radio stations. HiFi members have the added benefit of listening to the best quality of sound available, including TIDAL Masters and immersive sound experiences from Dolby Atmos Music and Sony 360 Reality Audio. Recently announced improvements including the expansion of TIDAL’s Masters catalog and TIDAL Connect, give HiFi members even more ways to enjoy the platform’s unparalleled lossless audio quality.

TIDAL brings its members closer to their favorite artists through virtual album experiences. Both Premium and HiFi members can sit back, relax and enjoy elevated listening with album commentary from artists like Alicia Keys and U2, animated artwork and performances with more interaction and dimension. Whether on the go or on the couch, members can tap into TIDAL’s full array of features across platforms and devices like: Plex, Roku, Amazon Alexa, Apple TV/Android TV, Apple CarPlay, Samsung Wearables and direct control with Sonos (Complete list here).

Following the four-month limited holiday membership, members can continue their subscription at $9.99/month for Premium and $19.99/month for HiFi – discounts are available for students (-50%), military (-40%), first responders (-40%) and families (6 accounts for $14.99 (Premium) or $29.99 (HiFi)). 

Additionally, Best Buy customers can purchase 12 months of TIDAL HiFi Standard or Family for the price of 6 months through the end of December 2020 both in-store and online.

About TIDAL

TIDAL is an artist-owned global music and entertainment platform that brings artists and fans closer together through unique original content and exclusive events. Available in 56 countries, the streaming service has more than 70 million songs and 250,000 high quality videos in its catalog along with original video series, podcasts, thousands of expertly curated playlists and artist discovery via TIDAL Rising. With the commitment of its owners to create a more sustainable model for the music industry, TIDAL is available in Premium and HiFi tiers—recordings which includes Master Quality Authenticated (MQA), Sony’s 360 Reality Audio recordings, and Dolby Atmos Music.


Related Links :

https://tidal.com/

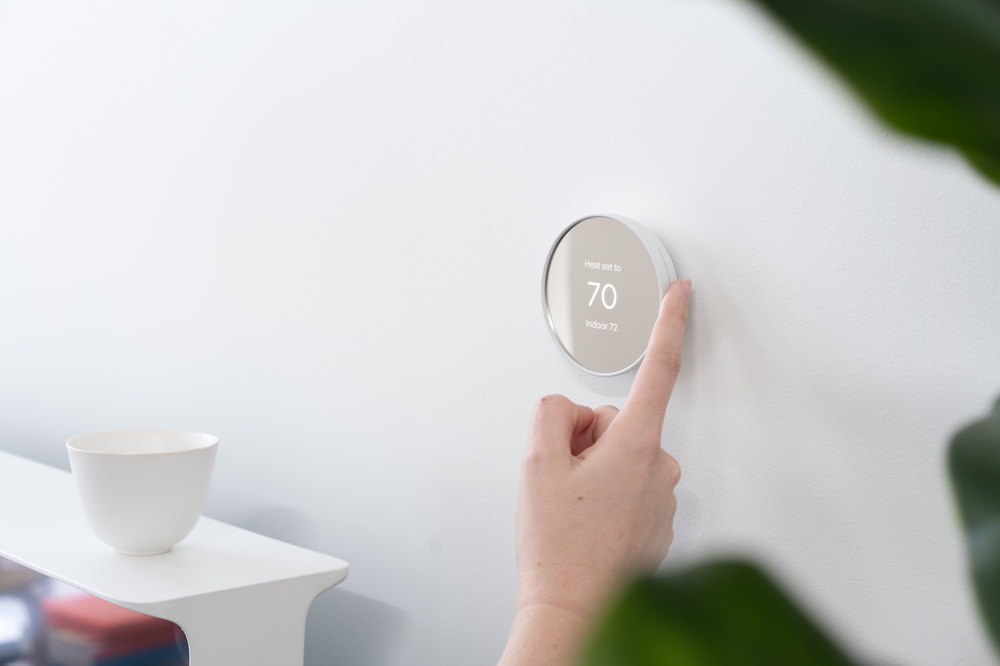
Google’s New Nest Thermostat is designed with Simplicity in Mind

Google’s Nest has just received an update and is ready to launch a new model after three years. Surprisingly, this new iteration released with a lower price tag and enhanced capabilities. The available colours are white, dark grey, light pink and light green at pricing of $14.99.

The new thermostat is designed to be simple and user friendly, with voice control through the Nest app on your devices via the Google Assistant or Amazon’s Alexa. With a swipe or tap of the touch strip on the edge of the thermostat, you can control the climate of your home. The design of the interface is minimalist and has a mirrored finish.

Source: Google

The Nest Thermostat has less functionality than its previous iterations, which allows for the lower price. It lacks the signature learning function that identifies the optimal climate conditions for you current living situation. However it still has some useful features such as alerts for issues with your HVAC system and prompts to adjust temperature levels for better efficiency. Moreover, Google stated that the process of installing is similar to other models and is compatible with many HVAC systems currently in use.

The new Nest Thermostat is currently retailing in the US and Canada for $129.99, with no news of availability in Malaysia just yet.

HUAWEI Freebuds Pro, Watch GT 2 Pro & MatePad T 10s is now Available in Malaysia

Huawei is rolling out new products aimed to enhance the quality of your lifestyle with the new Huawei Freebuds Pro, Watch GT 2 Pro and MatePad T. They are currently retailing nationwide, with Huawei is giving out amazing deals for Malaysian fans.

The Huawei FreeBuds Pro has turned some heads due to its stunning design and the world’s first intelligent Dynamic Noise cancellation with hybrid active noise-cancellation to avoid in-ear noise environments. To ensure an immersive audio experience, it identifies the nature of the environmental noise and automatically switches to the appropriate noise-cancellation mode.

The new Huawei Watch GT 2 Pro is designed with a premium titanium body enhanced by a sapphire glass surface. It is created for users to experience a perfect blend of aesthetics and performance in a smartwatch. It also features fitness-based sensors enabling heart rate, speed and slope measurements while giving alerts if you have exceedingly high values of those data to keep you safe. What is astonishing about this smartwatch is that it provides up to 2 weeks of usage on a single charge.

Last but not least is the Huawei MatePad T10s. The tablet is powered by the Kirin 710a octa-core processor and runs Huawei’s EMUI 10.1. The MatePad T10s packs a 10.1 inch FHD display with vivid colors thanks to the HUAWEI ClariVu™ technology. The display has Eye Comfort certification for its low blue light emission. The display is coupled with cinematic surround sound tuned by Harman Kardon, perfect tablet for your next Netflix binge.

Pricing & Availability

The Huawei FreeBuds Pro is priced at RM699 and comes with a free cover and mini Bluetooth speaker.

The Huawei Watch GT 2 Pro is priced at RM1,199 and comes witha free dark green strap.

It is RM999 for the Huawei MatePad T 10s and it comes with a free flip cover, 15GB Huawei Cloud Storage, Huawei Video and Huawei Books.

You can grab these incredible products via the Huawei Store online, Lazada or Shopee.

111, Inc. Announces Third Quarter 2020 Unaudited Financial Results

SHANGHAI, Nov. 19, 2020 — 111, Inc. ("111" or the "Company") (NASDAQ: YI), a leading digital healthcare platform committed to digitally connecting patients with medicine and healthcare services in China, today announced its unaudited financial results for the third quarter ended September 30, 2020.

Third Quarter 2020 Highlights

  • Net revenues were RMB2.36 billion (US$348.0 million), representing an increase of 112.8% year-over-year.
  • Operating expenses [1] were RMB212.1 million (US$31.2 million), representing an increase of 28.2% year-over-year. Operating expenses accounted for 9.0% of net revenue this quarter as compared to 14.9% in the same quarter of last year.
  • Number of pharmacies served increased to more than 300,000 (representing 57% of the total numbers of pharmacies in China) as of September 30, 2020, compared to more than 210,000 pharmacies as of September 30, 2019.
  • B2B net revenue increased to RMB2.2 billion (US$324.3 million) this quarter as compared to RMB1.45 billion in Q2 2020. Revenue from existing customers [2] were up 38.9% quarter-over-quarter and newly added customers contributed 12.5% of the growth quarter-over-quarter.
  • Cash and cash equivalents, restricted cash and short-term investments amounted to RMB1,213.1 million (US$178.7 million) as of September 30, 2020, achieving positive cash flow from operating activities, which amounted to RMB25 million for the quarter.

[1] Operating expense consists of fulfillment expenses, selling and marketing expenses, general and administrative expenses, technology expenses and other operating expenses.

[2] We define existing customers as the customers who have placed orders from 111 prior to third quarter 2020

"In Q3 2020, we exceeded the top end of our guidance and continued the strong momentum built since the IPO. In the 8th consecutive quarter of revenue growth, we delivered net revenue of RMB2.36 billion, an increase of 113% year-over-year. Gross profit rose 90% year-over-year to RMB90 million. Non-GAAP net loss attributable to ordinary share[3] as a percentage of net revenue continued to narrow, from approximately 10% in Q3 2019 to 4% this quarter, showing a trajectory towards profitability," said Mr. Junling Liu, Co-Founder, Chairman, and Chief Executive Officer of 111.

"The robust performance is a strong validation of the successful execution of our multifaceted growth strategy to deliver the mission of digitally connecting patients with medicine and healthcare services. We have made solid progress in strengthening our digital capabilities. Our cloud-based solutions in the areas of patient management, doctor-patient interaction, education for doctors, patients and pharmacists, and other related services received excellent response from our customers. Our smart supply-chain management is making our operation more and more efficient. The omni-channel drug commercialization platform is laying a strong foundation for our future growth in one of China’s fastest growing industries."

"Over the last few quarters, we made significant progress in strengthening the infrastructure of our digital healthcare platform that  brings together key stakeholders in the healthcare ecosystem – retail pharmacies, online platform partners, doctors, insurance companies and pharmaceutical companies to the benefit of all." He continued, "For our retail pharmacy customers, part of our 300,000+ strong network representing 57% of China’s total number of pharmacies and the largest in China, our smart sourcing system, machine-learning and cloud-based solutions translate into effective sourcing, better inventory management, optimal product assortment, and broader market reach, resulting in greater cost efficiency, higher earning potential and an enhanced ability to serve our end consumers. For doctors, our smart technology puts the power of the latest medical innovations in their hands to achieve better health outcomes for their patients. For patients, our holistic disease management platform gives them access to the best doctors across the country, follow-up consultations, disease education materials, medication guides, and the benefits of obtaining medications at home through our e-prescription service."

"The most significant progress is in establishing 111 as partner of choice for pharmaceutical companies with our omni-channel drug commercialization capability." Commenting on the partnership with pharmaceutical companies, he said, "With our broad consumer reach, vast virtual pharmacy network, and smart technology-enabled omni-channel commercialization platform, we have been helping them to gain additional commercialization channels, expand reach, optimize their sales and marketing functions, enhance patient services and support programs, resulting in greater commercial success for new and existing products. In the quarter, we have expanded the number of partnerships to over 300, up 101% over the same period last year. New partners include major multinational and domestic pharmaceutical companies, such as Bayer Healthcare, Huluwa Pharmaceutical, Xiangxue Pharmaceutical and Baiyunshan Pharmaceutical."

"We’ve also broadened our partnership with insurance companies to further enhance the digital healthcare value chain. In the quarter, we added another insurance partner, Shanghai Uniondrug. This partnership will give us the power to offer to consumers better access to healthcare and pharmaceutical products at lower prices. In addition, consumers will also gain tools and supporting services that are personalized to their needs and that emphasize preventive, rather than curative care."

"As China successfully keeps the COVID-19 pandemic in check and its economy resumes growth, we are confident about the Company’s ability to take advantage of the immense opportunities that ensue. With our market-leading digital healthcare platform, we have built a healthcare ecosystem where all key stakeholders – drug manufacturers, retailers, insurance companies and end consumers are in a virtuous circle of value creation."

"Looking toward the last quarter, we’ll continue to leverage this ecosystem and enhance its value as we work to increase sales from our existing base of retail pharmacies while gaining new ones, enhance ‘stickiness’ of our customers, and expand and deepen strategic partnerships. We’ll focus on narrowing net loss, drive growth, and continue the ascent to delivering sustainable and long-term profitability to our shareholders," he concluded.

[3] Non-GAAP net loss attributable to ordinary shareholders represents net loss attributable to ordinary shareholders excluding share-based compensation expenses and impairment loss of long-term investment.

Share Repurchase Program

On August 14, 2019, the Company’s Board of Directors approved a share repurchase program of up to US$10 million, as a vote of confidence in the Company’s prospects. As of September 30, 2020, the Company had repurchased 998,810 ADSs for a total consideration of US$4.9 million. No new repurchase happened in the third quarter.

Third Quarter 2020 Financial Results

Net revenues were RMB2.36 billion (US$348.0 million), representing an increase of 112.8% from RMB1.11 billion in the same quarter of last year.

As of September 30, 2020, the Group has two reporting segments that includes B2B segment and B2C segment. Revenue contribution from E-Channel was previously disclosed as a separate segment, but was incorporated in B2B segment in this quarter. The Company revised prior comparative periods to conform to the current period segment presentation as follows:

(In thousands RMB)

For the three months ended September 30,

2019

2020

YoY

B2B Net Revenue

Product

939,434

2,197,915

134.0%

Service

1,128

3,710

228.9%

Sub-Total

940,562

2,201,625

134.1%

Cost of Products Sold[4]

927,564

2,143,845

131.1%

Segment Profit

12,998

57,780

344.5%

Segment Profit %

1.4%

2.6%


(In thousands RMB)

For the three months ended September 30,

2019

2020

YoY

B2C Net Revenue

Product

164,348

152,939

(6.9%)

Service

5,541

8,159

47.2%

Sub-Total

169,889

161,098

(5.2%)

Cost of Products Sold[4]

135,558

128,943

(4.9%)

Segment Profit

34,331

32,155

(6.3%)

Segment Profit %

20.2%

20.0%


[4]   For segment reporting purposes, purchase rebate is allocated to B2B segment and B2C segment primarily based on the amount of cost of products sold for each segment. Cost of products sold does not include other direct costs related to cost of product sales such as shipping and handling expense, payroll and benefits of logistic staff, logistic centers rental expenses and depreciation expenses, which are recorded in the fulfillment expenses.

Operating costs and expenses were RMB2.48 billion (US$366.0 million), representing an increase of 102.3% from RMB1.23 billion in the same quarter of last year.

  • Cost of products sold was RMB2.27 billion (US$334.7 million), representing an increase of 113.8% from RMB1.06 billion in the same quarter of last year. The increase was primarily due to our rapid revenue growth in B2B business, which increased by 134.1% as compared to the same quarter last year.
  • Fulfillment expenses were RMB58.2 million (US$8.6 million), representing an increase of 83.8% from RMB31.6 million in the same quarter of last year. Fulfillment expenses accounted for 2.5% of net revenues this quarter as compared to 2.8% in the same quarter of last year.
  • Selling and marketing expenses were RMB104.3 million (US$15.4 million), representing an increase of 19.7% from RMB87.1 million in the same quarter of last year, mainly due to increase in the number of sales staffs and expenses associated with the expansion of the B2B business. As a percentage of net revenues, selling and marketing expense further reduced to 4.4% in the quarter from 7.8% in the same quarter of last year.
  • General and administrative expenses were RMB28.5 million (US$4.2 million), representing a drop of 10.8% from RMB32.0 million in the same quarter of last year. As a percentage of net revenues, general and administrative expense reduced to 1.2% in the quarter from 2.9% in the same quarter of last year.
  • Technology expenses were RMB22.0 million (US$3.2 million), representing an increase of 49.4% from RMB14.7 million in the same quarter of last year, mainly due to our increased investment in technology. Technology expenses accounted for 0.9% of net revenues this quarter as compared to 1.3% in the same quarter of last year.

Loss from operations was RMB122.2 million (US$18.0 million), compared to RMB118.1 million in the same quarter of last year. As a percentage of net revenues, loss from operations further decreased to 5.2% in the quarter from 10.6% in same quarter of last year.

Non-GAAP loss from operations [5] was RMB108.0 million (US$15.9 million), compared to RMB104.5 million in the same quarter of last year. As a percentage of net revenues, non-GAAP loss from operations decreased to 4.6% in the quarter from 9.4% in same quarter of last year.

Net loss attributable to ordinary shareholders was RMB108.6 million (US$16.0 million), compared to RMB123.3 million in the same quarter of last year. As a percentage of net revenues, net loss attributable to ordinary shareholders decreased to 4.6% in the quarter from 11.1% in same quarter of last year.

Non-GAAP net loss attributable to ordinary shareholders was RMB94.4 million (US$13.9 million), compared to RMB109.7 million in the same quarter of last year. As a percentage of net revenues, non-GAAP net loss attributable to ordinary shareholders decreased to 4.0% in the quarter from 9.9% in same quarter of last year. 

Loss per ADS was RMB1.32 (US$0.20), compared to RMB1.50 for the same quarter of last year.

Non-GAAP loss per ADS [6] was RMB1.15 (US$0.17), compared to RMB1.34 for the same quarter of last year.

As of September 30, 2020, the Company had cash and cash equivalents, restricted cash and short-term investments of RMB 1,213.1 million (US$178.7 million), compared to RMB697.7 million as of December 31, 2019.

[5]   Non-GAAP loss from operations represents loss from operations excluding share-based compensation expenses.

[6]   Non-GAAP loss per ADS represents loss per ADS excluding share-based compensation expenses and impairment loss of long-term investment per ADS.

Business Outlook

For the fourth quarter of 2020, the Company expects its total net revenues to be between RMB2.44 billion and RMB2.56 billion, representing a year-over-year growth of approximately 81% to 90%.

The above outlook is based on the current market conditions and reflects the Company’s current and preliminary estimates of market and operating conditions and customer demand, which are all subject to changes.

Conference Call

111’s management team will host an earnings conference call at 7:30 AM U.S. Eastern Time on Thursday, November 19, 2020 (8:30 PM Beijing Time on November 19, 2020).

Details for the conference call are as follows:

Event Title:                       111, Inc. Third Quarter 2020 Earnings Conference Call
Registration Link:             http://apac.directeventreg.com/registration/event/1679252

All participants must use the link provided above to complete the online registration process in advance of the conference call. Upon registering, each participant will receive a set of participant dial-in numbers, the Direct Event passcode, and a unique Registration ID, which can be used to join the conference call.

Please dial in 15 minutes before the call is scheduled to begin and provide the Direct Event passcode and unique Registration ID you have received upon registering to join the call.

A telephone replay of the call will be available after the conclusion of the conference call until November 27, 2020, 7:59 P.M. ET on:

United States:                     +1-855-452-5696
International:                       +61-2-8199-0299
Conference ID:                    1679252

A live and archived webcast of the conference call will be available on the Investor Relations section of 111’s website at http://ir.111.com.cn/.

Use of Non-GAAP Financial Measures

In evaluating the business, the Company considers and uses non-GAAP loss from operations, non-GAAP net loss attributable to ordinary shareholders, and non-GAAP loss per ADS, non-GAAP measures, as supplemental measures to review and assess its operating performance. The Company defines non-GAAP loss from operations as loss from operations excluding share-based compensation expenses. The Company defines non-GAAP net loss attributable to ordinary shareholders as net loss attributable to ordinary shareholders excluding share-based compensation expenses and impairment loss of long-term investment. The Company defines non-GAAP loss per ADS as loss per ADS excluding share-based compensation expenses and impairment loss of long-term investment per ADS. The presentation of these non-GAAP financial measures is not intended to be considered in isolation or as a substitute for the financial information prepared and presented in accordance with U.S. GAAP.

The Company believes that non-GAAP loss from operations, non-GAAP net loss attributable to ordinary shareholders, and non-GAAP loss per ADS help identify underlying trends in its business that could otherwise be distorted by the effect of certain expenses that it includes in loss from operations and net loss. Share-based compensation expenses is a non-cash expense that varies from period to period. Impairment loss of long-term investment is a non-cash, non-recurring expense that occurred in the historical period. As a result, management excludes these two items from its internal operating forecasts and models. Management believes that the adjustments for share-based compensation expenses and impairment loss of long-term investment provide investors with a reasonable basis to measure the company’s core operating performance, in a more meaningful comparison with the performance of other companies. The Company believes that non-GAAP loss from operations, non-GAAP net loss attributable to ordinary shareholders, and non-GAAP loss per ADS provide useful information about its operating results, enhances the overall understanding of its past performance and future prospects and allow for greater visibility with respect to key metrics used by the management in their financial and operational decision-making.

The non-GAAP financial measures are not defined under U.S. GAAP and are not presented in accordance with U.S. GAAP. The non-GAAP financial measures have limitations as analytical tools. One of the key limitations of using non-GAAP loss from operations, non-GAAP net loss attributable to ordinary shareholders, or non-GAAP loss per ADS is that it does not reflect all items of income and expense that affect the Company’s operations. Further, the non-GAAP financial measures may differ from the non-GAAP information used by other companies, including peer companies, and therefore their comparability may be limited.

The Company compensates for these limitations by reconciling the non-GAAP financial measures to the most comparable U.S. GAAP measures, all of which should be considered when evaluating the Company’s performance. The Company encourages you to review its financial information in its entirety and not rely on a single financial measure.

Reconciliation of the non-GAAP financial measures to the most comparable U.S. GAAP measures is included at the end of this press release.

Exchange Rate Information Statement

This announcement contains translations of certain RMB amounts into U.S. dollars at specified rates solely for the convenience of the reader. Unless otherwise noted, all translations from RMB to U.S. dollars are made at a rate of RMB6.7896 to US$1.00, the exchange rate set forth in the H.10 statistical release of the Board of Governors of the Federal Reserve System as of September 30, 2020.

Safe Harbor Statement

This press release contains forward-looking statements. These statements constitute "forward-looking" statements within the meaning of Section 21E of the Securities Exchange Act of 1934, as amended, and as defined in the U.S. Private Securities Litigation Reform Act of 1995. These forward-looking statements can be identified by terminology such as "will," "expects," "anticipates," "future," "intends," "plans," "believes," "estimates," "target," "confident" and similar statements. Among other things, the Business Outlook and quotations from management in this announcement, as well as 111’s strategic and operational plans, contain forward-looking statements. 111 may also make written or oral forward-looking statements in its periodic reports to the U.S. Securities and Exchange Commission, in its annual report to shareholders, in press releases and other written materials and in oral statements made by its officers, directors or employees to third parties. Such statements are based upon management’s current expectations and current market and operating conditions and relate to events that involve known or unknown risks, uncertainties and other factors, all of which are difficult to predict and many of which are beyond the Company’s control. Forward-looking statements involve inherent risks, uncertainties and other factors that could cause actual results to differ materially from those contained in any such statements. Potential risks and uncertainties include, but are not limited to, uncertainties as to the Company’s ability comply with extensive and evolving regulatory requirements, its ability to compete effectively in the evolving PRC general health and wellness market, its ability to manage the growth of its business and expansion plans, its ability to achieve or maintain profitability in the future, its ability to control the risks associated with its pharmaceutical retail and wholesale businesses, and the Company’s ability to meet the standards necessary to maintain listing of its ADSs on the Nasdaq Global Market, including its ability to cure any non-compliance with Nasdaq’s continued listing criteria. Further information regarding these and other risks, uncertainties or factors is included in the Company’s filings with the U.S. Securities and Exchange Commission. All information provided in this press release is as of the date of this press release, and 111 does not undertake any obligation to update any forward-looking statement as a result of new information, future events or otherwise, except as required under applicable law.

About 111, Inc.

111, Inc. (NASDAQ: YI) ("111" or the "Company") is a leading digital healthcare platform committed to digitally connecting patients with medicine and healthcare services in China. The Company provides consumers with better access to pharmaceutical products and healthcare services directly through its online retail pharmacy, 1 Drugstore, and indirectly through its offline virtual pharmacy network. The Company also offers online healthcare services through its internet hospital, 1 Clinic, which provides consumers with cost-effective and convenient online consultation, electronic prescription service, and patient management service. In addition, the Company’s online wholesale pharmacy, 1 Drug Mall, serves as a one-stop shop for pharmacies to source a vast selection of pharmaceutical products. With the largest virtual pharmacy network in China, 111 enables offline pharmacies to better serve their customers with cloud-based services. 111 also provides an omni-channel drug commercialization platform to its strategic partners, which includes services such as digital marketing, patient education, data analytics, and pricing monitoring.

For more information on 111, please visit: http://ir.111.com.cn/.

For more information, please contact:

111, Inc.
Investor Relations
Email: ir@111.com.cn

111, Inc.
Media Relations 
Email: press@111.com.cn 
Phone: +86-021-2053 6666 (China)

GCM Strategic Communications
IR Counsel
Email: 111.ir@gcm.international


111, Inc.

UNAUDITED CONDENSED CONSOLIDATED BALANCE SHEETS

(In thousands, except for share and per share data)

As of

As of

December 31, 2019

September 30, 2020

RMB

RMB

US$

ASSETS

Current Assets:

Cash and cash equivalents

581,281

1,030,771

151,816

Restricted cash

116,441

82,170

12,102

Short-term investments

100,159

14,752

Accounts receivable, net 

65,247

140,113

20,636

Note Receivables, net

23,587

22,842

3,364

Inventories

486,271

922,919

135,931

Prepayments and other current assets

208,604

292,501

43,083

Total current assets

1,481,431

2,591,475

381,684

Property and equipment

29,836

29,034

4,276

Intangible assets

8,022

7,043

1,037

Long-term investments

140

140

21

Other non-current assets

3,009

4,687

690

Operating lease right-of-use asset

87,855

88,679

13,061

Total Assets

1,610,293

2,721,058

400,769

LIABILITIES AND EQUITY

Current liabilities including amounts of the
consolidated VIE without recourse to the Company

Short-term borrowings

95,081

179,100

26,379

Accounts payable

444,334

1,302,637

191,858

Accrued expense and other current liabilities 

234,008

287,425

42,332

Total Current liabilities

773,423

1,769,162

260,569

Operating lease liabilities

57,011

51,946

7,651

Other non-current liabilities

5,936

4,286

631

Total Liabilities

836,370

1,825,394

268,851

Mezzanine Equity

Redeemable non-controlling interests[7]

417,194

61,446

Shareholders’ Equity

Ordinary shares Class A 

30

30

4

Ordinary shares Class B 

25

25

4

Treasury shares 

(22,991)

(34,972)

(5,151)

Additional paid in capital

2,606,486

2,654,792

391,009

Accumulated deficit

(1,883,335)

(2,209,244)

(325,386)

Accumulated other comprehensive Income

76,441

71,763

10,570

Total shareholders’ equity

776,656

482,394

71,050

Non-controlling interest

(2,733)

(3,924)

(578)

Total equity

773,923

478,470

70,472

Total liabilities, mezzanine equity and equity

1,610,293

2,721,058

400,769

[7] In August 2020, the Company’s subsidiary, Yao Fang Information Technology (Shanghai) Co., Ltd ("Yao Fang Shanghai") completed the private fund raising. Since the new investors have
redeemable rights, the redeemable non-controlling interests are classified as Mezzanine Equity.


UNAUDITED CONDENSED CONSOLIDATED STATEMENTS OF COMPREHENSIVE LOSS

(In thousands, except for share, per share and per ADS data)

For the three months ended September 30,

For the nine months ended September 30,

2019

2020

2019

2020

RMB

RMB

US$

RMB

RMB

US$

Net revenues

1,110,451

2,362,723

347,991

2,604,213

5,560,207

818,929

Operating costs and expenses:

Cost of product sold

(1,063,122)

(2,272,788)

(334,745)

(2,481,522)

(5,297,929)

(780,301)

Fulfillment expenses

(31,639)

(58,161)

(8,566)

(80,313)

(157,380)

(23,181)

Selling and marketing expenses

(87,131)

(104,252)

(15,355)

(237,631)

(281,202)

(41,417)

General and administrative expenses

(31,956)

(28,504)

(4,198)

(88,000)

(96,450)

(14,206)

Technology expenses

(14,695)

(21,953)

(3,233)

(42,024)

(61,394)

(9,042)

Other operating (expenses)/income, net

(3)

754

112

(164)

5,560

819

Total operating costs and expenses

(1,228,546)

(2,484,904)

(365,985)

(2,929,654)

(5,888,795)

(867,328)

Loss from operations

(118,095)

(122,181)

(17,994)

(325,441)

(328,588)

(48,399)

Interest income

1,117

2,684

395

4,477

4,093

603

Interest expense

(2,109)

(2,532)

(373)

(2,458)

(6,203)

(914)

Foreign exchange (loss)/gain

(9,301)

10,295

1,516

(15,311)

(671)

(99)

Other income/(expense), net

4,473

543

80

(4,781)

1,642

242

Loss before income taxes

(123,915)

(111,191)

(16,376)

(343,514)

(329,727)

(48,567)

Income tax expense

Net loss

(123,915)

(111,191)

(16,376)

(343,514)

(329,727)

(48,567)

Net loss attributable to non-controlling
interest

616

2,627

387

1,499

3,818

562

Net loss attributable to ordinary
shareholders

(123,299)

(108,564)

(15,989)

(342,015)

(325,909)

(48,005)

Other comprehensive loss

Unrealized gains of available-for-sale
securities, net of tax

2,465

60

9

6,685

60

9

Realized gains of available-for-sale
securities, net of tax

(511)

(1,109)

Foreign currency translation adjustments,
net of tax

19,173

(18,486)

(2,713)

15,773

(4,738)

(698)

Comprehensive loss

(102,172)

(126,990)

(18,693)

(320,666)

(330,587)

(48,694)

Loss per share:

Basic and diluted

(0.75)

(0.66)

(0.10)

(2.09)

(1.98)

(0.29)

Loss per ADS:

Basic and diluted

(1.50)

(1.32)

(0.20)

(4.18)

(3.96)

(0.58)

Weighted average number of shares
used in computation of loss per
share

Basic and diluted

164,162,090

164,866,965

164,866,965

163,676,671

164,667,259

164,667,259


111, Inc.

UNAUDITED CONDENSED CONSOLIDATED
STATEMENTS OF CASH FLOWS

(In thousands)

For the three months ended September 30,

For the nine months ended September 30,

2019

2020

2019

2020

RMB

RMB

US$

RMB

RMB

US$

Net cash (used in)/provided by
operating activities 

(288,023)

25,217

3,714

(440,838)

39,306

5,789

Net cash provided by/(used in) in
investing activities 

186,857

(101,255)

(14,913)

127,858

(108,346)

(15,958)

Net cash provided by financing
activities 

57,645

466,050

68,642

99,935

496,745

73,163

Effect of exchange rate changes on
cash and cash equivalents 

22,033

(20,571)

(3,030)

16,038

(12,486)

(1,839)

Net (decrease)/increase in cash and
cash equivalents 

(21,488)

369,441

54,413

(197,007)

415,219

61,155

Cash and cash equivalents, and
restricted cash at the beginning of
the period 

678,221

743,500

109,505

853,740

697,722

102,763

Cash and cash equivalents, and
restricted cash at the end of the
period   

656,733

1,112,941

163,918

656,733

1,112,941

163,918


111, Inc.

Unaudited Reconciliation of GAAP and Non-GAAP Results

(In thousands, except for share, per share and per ADS data)

For the three months ended September 30,

For the nine months ended September 30,

2019

2020

2019

2020

RMB

RMB

US$

RMB

RMB

US$

Loss from operations

(118,095)

(122,181)

(17,994)

(325,441)

(328,588)

(48,399)

Add:Share-based compensation
expenses

13,569

14,171

2,087

40,372

43,278

6,374

Non-GAAP loss from operations 

(104,526)

(108,010)

(15,907)

(285,069)

(285,310)

(42,025)

Net Loss attributable to ordinary
shareholders 

(123,299)

(108,564)

(15,988)

(342,015)

(325,909)

(48,005)

Add:Share-based compensation
expenses, net of tax

13,569

14,171

2,087

40,372

43,278

6,374

Impairment loss of long-term
investment

11,000

Non-GAAP net Loss attributable to
ordinary shareholders 

(109,730)

(94,393)

(13,901)

(290,643)

(282,631)

(41,631)

Loss per ADS: 

  Basic and diluted

(1.50)

(1.32)

(0.20)

(4.18)

(3.96)

(0.58)

Add:Share-based compensation
expenses and impairment loss of long-
term investment per ADS, net of tax

0.16

0.17

0.03

0.63

0.53

0.08

Non-GAAP Loss per ADS

(1.34)

(1.15)

(0.17)

(3.55)

(3.43)

(0.50)


Related Links :

http://www.yiyaowang.com
Sony’s Xperia 1 II & Xperia 5 II are Available in Malaysia

Sony’s Xperia line up is one of the longest lasting line up of smartphones. It continues to be Sony’s go to brand with their newly launched flagships the Xperia 1 II and the Xperia 5 II. The Xperia 1 II will be available starting in November and the Xperia 5 II a little later after that, with prices starting at MYR4099. Let’s take a peek at bells and whistles of models to retail in Malaysia.

Both of these new Xperia models share some key specs. Chiefly, they are both powered by a Qualcomm Snapdragon 865. They both have a triple 12MP camera setup with ZEISS optics for quality images. They also have good life battery with 4,000mAh battery supported by USB-PD and charging via USB-C. They also retain the 3.5 headphone jack for your audio needs.

The key difference between these devices is their size. The Xperia 1 II is slightly bigger with a 6.5 inch screen compared to the Xperia 5 II and its 6.1 inch screen. The Xperia 1 II also has a better OLED display with higher resolution of 1644 x 3840 and and a higher pixel density, while the Xperia 1 II has a lower 1080 x 2520 resolution.

Both models have IP65/IP68 certification for water and dust resistance. They also come with stereo speakers and support PS4 Remote Play. Only the Xperia 1 II comes along with wireless charging as is expected of the flagship variant. However, the Xperia 5 II with its lower price tag and similar core features will give it a run for its money.

The Xperia 1 II is listed for retail at MYR4,999 while the Xperia 5 II is listed at MYR4,099 in the official Sony Online Store. With this announcement, the original Xperia 1 and Xperia 5 are now retailing for MYR3,099 and MYR2,799 respectively.

LU Hong Kong Launches First Batch of USD-denominated Fund Products

Committed to Providing Diversified Products to Meet Various Investment Needs

HONG KONG, Nov. 19, 2020 — Lu International (Hong Kong) Limited ("LU Hong Kong" or the "Company"), a subsidiary of Lufax Holding ("Lufax"), will launch the first batch of USD Fund Products distributed through its online investment and wealth management platform, the LU Hong Kong App, which aims to provide investors with a more diversified portfolio of currency fund products catering to different risk appetites and investment needs.

The first batch of the USD-denominated fund products distributed on the LU Hong Kong App consists of five different fund products, namely "BNY Mellon Emerging Market Corporate Debt Fund", "BNY Mellon Mobility Innovation Fund", "BNY Mellon Long-Term Global Equity Fund", "Franklin Technology Fund" and "Franklin Biotechnology Discovery Fund".

The LU Hong Kong App currently offers a selection of diverse and extensive high-quality Hong Kong dollar-denominated funds for Hong Kong retail investors. With the new addition of the five featured USD-denominated funds, LU Hong Kong is expected to expand its coverage of different market indexes and asset classes to enrich its product portfolio and provide investors with more diverse and comprehensive investment and wealth management options.

Mr. Cai Hua, CEO of LU Hong Kong, said, "LU Hong Kong has always been keeping a close eye on the global market conditions. By introducing a selection of fund products in a timely manner, we help users stay ahead of the latest investment trends to seize market opportunities. We are thrilled to launch our first batch of USD-denominated fund products. Not only will it enrich our fund product offerings on the platform, it can also satisfy the risk appetite of different investors. Our equity fund offerings also include many highly sought-after sectors such as technology, alternative-fueled vehicles (AFVs) and biotech."

"Given the market expectation of low US Federal Reserve rates to maintain in the foreseeable future, and the continuation of the global quantitative easing cycle, investors who prefer steady returns may choose value stocks with high performance potential on the LU Hong Kong App. Going forward, we will continue capitalizing on Ping An and Lufax’s ‘Finance + Technology’ strengths while selecting high quality fund to enrich and optimize ‘LU Hong Kong’ fund product portfolio and offer an efficient, high-quality and integrated wealth management experience to our customers."

Disclaimer:

Investment involves risks. The prices of investment products may rise or fall, sometimes fluctuate sharply, and may even become worthless. The past performance of the relevant assets does not reflect future performance. Before making any investment decisions, investors should read the relevant offering documents and risk disclosure statements in detail or obtain independent professional advice and carefully consider all relevant risk factors.

The content of this material is for informational purpose only and does not constitute any investment advice, recommendation, offer, solicitation, advertisement, inducement or invitation. The relevant fund information in this material is provided by the relevant manager, fund or product issuer. Lu International (Hong Kong) Limited has made reasonable effort to ensure that the information provided is complete, accurate and reliable but does not make any explicit or implicit claims regarding its completeness, accuracy, or reliability and does not assume any responsibility for any loss or damage caused by, arisen out of, or related to any inaccuracy or omission of information. Lu International (Hong Kong) Limited also does not assume any responsibility for any prospectus or any other materials prepared or issued by any manager, fund or product issuer nor for any intentional act or omission, breach of contract, fraud or gross negligence of any manager, fund or product issuer.

Lu International (Hong Kong) Limited is a licensed corporation under the Securities and Futures Ordinance (CE: BIN669) licensed for Type 1 (dealing in securities), Type 4 (advising on securities) and Type 9 (asset management) regulated activities. This promotional material has not been reviewed by the Securities and Futures Commission of Hong Kong.

About LU Hong Kong

Lu International (Hong Kong) Limited ("LU Hong Kong"), is a subsidiary of Lufax Holding. LU Hong Kong is incorporated in Hong Kong and is an SFC-licensed corporation licensed to carry on Types 1, 4 and 9 regulated activities (CE: BIN669). The LUHK mobile application is an online wealth management platform launched on 8 August 2020 in Hong Kong to offer around-the-clock wealth management services.

Official website: http://www.lu-hk.com

Related Links :

http://www.lu-hk.com

5G Gets More Affordable with the Samsung Galaxy A42 5G

The latest generation of mobile network, 5G, is slowly making its way to the masses around the world. With that in mind, more major players in the mobile device market pumping out their own compatible devices. After introducing their 5G capable flagships, Samsung has announced another 5G device- the Galaxy A42 which is priced lower at $450 internationally and only MYR1,599 in Malaysia. It is equipped with all the innovation consumers have come to expect with the Galaxy A series, including a Quad Camera, Infinity-U Display and a long lasting battery.

The Galaxy A42 5G comes with the Snapdragon 750G which brings support for 5G on both mmWave and Sub6 bands according to Qualcomm. However, actual connectivity support has not been revealed by Samsung. The new smartphone comes with a 6.6-inch HD+ Super AMOLED Infinity-U Display; which should provide ample viewing space for an immersive media experience. It also has a large 5,000mAh battery with support for Fast Charge which should keep you going for at least one full day. The sleek design of the phone is also ergonomic, with rounded edges to make it more comfortable to grip.

Here comes the catchy features of the Galaxy A42 5G, a powerful multi role Quad Camera that captures images and records videos with enhanced clarity. This consists of 48MP main camera supported by a an 8MP Ultra Wide Camera, a 5MP Macro Camera and a 5MP Depth Camera to capture more detail. Plus, the front-facing camera is a 20MP Selfie Camera, a great addition for selfie enthusiasts. Other Galaxy A42 5G specs include 4GB of RAM and 128GB of internal storage, expandable up to 1TB.

Pricing & Availability

The Samsung Galaxy A42 will be available in Prism Dot Black, Prism Dot White and Prism Dot Grey. It is available in Europe for €369 starting from 7 November and is already available in Malaysia via Samsung’s online store for MYR1,599.

Official Specifications

Galaxy A42 5G Product Specifications1

Display26.6-inch HD+ Super AMOLED
Infinity-U Display
Rear CameraQuad Camera
Main: 48MP, F1.8
Ultra Wide: 8MP, F2.2
Depth: 5MP, F2.4
Macro: 5MP, F2.4
Front
Camera
20MP, F2.2
Body75.9 x 164.4 x 8.6mm
193g3,7
APOcta-Core
(Dual 2.2GHz + Hexa 1.8GHz)
Memory44/6/8GB RAM
128GB Internal Storage
MicroSD slot (up to 1TB)
Battery55,000mAh (typical)
15W Adaptive Fast Charging
Biometric AuthenticationOn-Screen Fingerprint
Colors6Prism Dot Black
Prism Dot White
Prism Dot Gray

All functionality, features, specifications and other product information provided in this table including, but not limited to, the benefits, design, pricing, components, performance, availability, and capabilities of the product are subject to change without notice.
2 Screen measured diagonally as a full rectangle without accounting for the rounded corners. Actual viewable area is less due to the rounded corners and the camera cut out.
3 Device weight may vary by region and market.
4 Available RAM may vary by country and region.
5 Typical value tested under third-party laboratory condition. Typical value is the estimated average value considering the deviation in battery capacity among the battery samples tested under IEC 61960 standard. Rated (minimum) capacity is 4,680mAh. Actual battery life may vary depending on network environment, usage patterns and other factors. All functionality, features, specifications and other product information provided in this table including, but not limited to, the benefits, design, pricing, components, performance, availability and capabilities of the product are subject to change without notice.
6 Availability may vary by country. 
7The disclaimer for weight specifications has been revised on October 22, 2020 to provide more accurate information.

Trina Solar and Tongwei Group Complete Joint Venture to Upgrade 210 Integrated Industrial Chain

CHANGZHOU, China, Nov. 19, 2020 — On November 17, 2020, Trina Solar, a leading global PV and smart energy solution provider, announced a joint venture agreement with global photovoltaic giant Tongwei.

The latest agreement will see Trina Solar collaborate with Tongwei subsidiary Sichuan Yongxiang Co., Ltd, to upgrade their 210 industrial series modules that will help secure a stronger supply chain ecosystem going forward.

Gao Jifan, Chairman of Trina Solar, said: "Joint ventures and cooperation among strong players, who complement each other as well as Trina Solar and Tongwei Group do, will always create great advantages."

The partnership will see the two enterprises work together on four key project areas. The first includes a high-purity crystalline silicon project with an annual output of 40,000 tons, as well as an ingot project expected to produce an annual output of 15GW. There will be a wafer-cutting project with an annual output of 15GW, and a high-efficiency crystalline silicon cell project, also with an annual output of 15GW.

Total investment in the venture is estimated to be worth US$ 2.3 billion, with Trina Solar gaining a shareholding ratio of 35%, and the total registered capital contribution has been set at US$ 32 million.

Wu Qun, secretary of the board of directors of Trina Solar, said these major project investments are a key part of Trina Solar’s strategic development plan going forward.

"Trina Solar and Tongwei both have outstanding advantages in their roles for the industrial chain. They have reached a consensus on 210 series modules, and this cooperation will further strengthen our strategic partnership. Through the joint efforts of all industry partners, the 210-product industry chain has matured, and is now more conducive for deeper integration."

By the end of 2021, Trina Solar plans to have a photovoltaic module production capacity of no less than 50GW, most of which will be at 210 module production capacities. In the future, the company will continue to strengthen its scale advantages of advanced module production capacity based on large-size cells.

As part of the agreement, Trina Solar will purchase approx. 72,000 tons of polysilicon products between January 2021 and December 2023 from a number of Tongwei Group subsidiaries including Sichuan Yongxiang Polysilicon Co., Ltd., Sichuan Yongxiang New Energy Co., Ltd., Inner Mongolia Tongwei High Purity Crystal Silicon Co., Ltd., and Yunnan Tongwei High Purity Crystal Silicon Co.

Ms. Chen Ye, Assistant Vice President of Procurement Supply Chain Management of Trina Solar, said: "Trina Solar and Tongwei have an excellent relationship and we are very pleased to deepen this cooperation further."

"This long-term procurement will facilitate timely and effective responses to changes in the market, ensuring the long-term stability of Trina Solar’s supply chain, and will provide strong support for the production capacity of Vertex Series 210 ultra-high-power modules."

Trina Solar’s collaboration with Tongwei Group follows the signing of further procurement deals by the company in recent weeks.

On November 2, Trina Solar signed a 20GW silicon wafer procurement contract with Wuxi Shangji Automation Co., Ltd., and on November 15 signed an 85 million square meter photovoltaic glass procurement contract with Changzhou Almaden Co., Ltd.

About Trina Solar 

Founded in 1997, Trina Solar is the world leading PV and smart energy total solution provider. The company engages in PV products R&D, manufacture and sales; PV projects development, EPC, O&M; smart micro-grid and multi-energy complementary systems development and sales, as well as energy cloud-platform operation. In 2018, Trina Solar launched Energy IoT brand, established the Trina Energy IoT Industrial Development Alliance together with leading enterprises and research institutes in China and around the world, and founded the New Energy IoT Industrial Innovation Center. With these actions, Trina Solar is committed to working with its partners to build the energy IoT ecosystem and develop an innovation platform to explore New Energy IoT, as it strives to be a leader in global intelligent energy. For more information, please visit www.trinasolar.com

Related Links :

http://www.trinasolar.com

The Resiliency Gap Widens: Failure to Keep Pace with Complexity in Multi-Cloud Environments Leaves Singapore Businesses at Risk of Ransomware, Finds Veritas Survey

An average of 14 cloud providers were used to drive business transformation, but complexity can lead to risk unless comprehensive data protection tools are used

SINGAPORE, Nov. 19, 2020 Veritas Technologies, a global leader in data protection, availability and insights, today highlighted the challenges that businesses around the globe are facing as they try to protect data stored in complex hybrid multi-cloud environments, from the growing threat of ransomware. In the 2020 Ransomware Resiliency Report, Veritas found that only 49% of respondents in Singapore said that their security has kept pace with their IT complexity, underscoring the need for greater use of data protection solutions that can protect against ransomware across the entirety of increasingly heterogenous environments.

Need to pay ransoms

Typically, if businesses fall foul to ransomware and are not able to restore their data from a backup copy of their files, they may look to pay the hackers responsible for the attack to return their information. The Veritas research showed that companies with greater complexity in their multi-cloud infrastructure were more likely to make these payments. The mean number of clouds deployed by those organisations who paid a ransom in full was 17.11. This increased to 18.61 for those who paid only part of the ransom and went as low as 3.67 for businesses who didn’t pay at all. In fact, only 20% of businesses with fewer than five clouds paid a ransom in full, less than for those (30%) with more than 20 clouds.

This compares with 70% of the under-fives paying nothing to their hackers and just 6% of those with five to twenty clouds.

Overall, a staggering 72% of organisations in Singapore who suffered a ransomware attack either paid the ransom in full or in part.

Slow recovery times

Complexity in cloud architectures was also shown to have a significant impact on a business’s ability to recover following a ransomware attack. While 45% of those businesses with fewer than five cloud providers in their infrastructure saw their business operations disrupted by 5 to 10 days, only 40% of those with more than 20 were as fast to return to normal. Moreover, 12% of the over-20s took less than 5 days to recover, with just 44% of the under-fives having to wait so long.

Regardless of number of cloud services deployed, 43% of respondents estimated 5 to 10 average days of business disruption due to a ransomware attack on average.

Inability to restore data

Furthermore, according to the findings of the research, greater complexity in an organisation’s cloud infrastructure, also made it slightly less likely that they would ever be able to restore their data in the event of a ransomware attack. While 49% of businesses with fewer than five cloud providers were able to restore 90% or more of their data, just 39% of enterprises building their infrastructure on more than 20 cloud services were able to say the same.

When hit by a ransomware attack, the average Singapore business would see 22% of its data impacted while 11% of them would see more than half of their data affected.

Andy Ng, Vice President and Managing Director, Asia South Region at Veritas said: "The pandemic has fast-tracked digital transformation in companies; we found that the average company in Singapore engages with 14 cloud services to drive their digital strategy. The hybrid multi-cloud has emerged as a key component to the digital strategy of companies setting themselves up to face the realities of a new business-as-usual world. Our research has revealed that many companies have not kept pace with the complexity that comes with multi-cloud environments, rendering them vulnerable towards the threats of ransomware. To mitigate the short-term panic and long-term reputation damage from a ransomware attack, companies need to partner with a trusted advisor to ensure they receive independent advice on the right data protection strategy that can work seamlessly across all clouds for their business."

Businesses recognise the challenge

The Veritas research revealed that many businesses are aware of the challenge that they face, with 49% of respondents believing that their security had kept pace with the complexity in their infrastructure. The top concerns as a result of this complexity, as stated by businesses, was the increased risk of internal (36%) attacks followed by and external (35%) attacks.

Andy continued: "The unique security challenges posed by increased multi-cloud adoption combined with an everchanging threat landscape requires pro-active measures put in place for prevention and mitigation. It is imperative for companies deploy corresponding data protection solutions to close that resiliency gap in order to protect increasingly valuable digital assets."

Need for investment

Over half of Singapore businesses (55%) shared that they had increased their budgets for security since the advent of the COVID pandemic. On the other hand, 28% have worryingly decreased it. There was a correlation between this elevated level of investment and the ability to restore data in the wake of an attack: 46% of those spending more since the Coronavirus outbreak were able to restore 90% or more of their data, compared with just 40% of those spending less. The results suggest that there is more to be done though, with the average business being able to restore only 83% of its data.

Back to basics

While the research indicates that organisations need to more comprehensively protect data in their complex cloud infrastructures, the survey also highlighted the need to get the basics of data protection right too. Only 50% of respondents could claim that they have offline backups in place, despite the fact that those who do are more likely to be able to restore more than 90% of their data. Those with multiple copies of data were also better able to restore the lion’s share of their data. 59% (10% more than the global average) of those with three or more copies of their files were able to restore 90% or more of their information, compared with just 35% of those with only two.

The three most common data protection tools to have been deployed amongst respondents who had avoided paying ransoms were: anti-virus and endpoint security (55%), keeping an offline backup of data (50%) and storing copies of backups in different locations (44%).

Global trends

While majority of organisations in Singapore have not experienced any ransomware attacks (69%), the safest countries to be in to avoid ransomware attacks were Poland and Hungary. Just 24% of businesses in Poland had been on the receiving end of a ransomware attack, and the average company in Hungary had only experienced 0.52 attacks ever. The highest incident of attack was in India, where 77% of businesses had succumbed to ransomware, and the average organisation had been hit by 5.27 attacks.

To read the full 2020 Ransomware Resiliency Report, please visit: https://www.veritas.com/defy/ransomware.

Methodology

The 2020 Ransomware Resiliency Report was carried out by Wakefield Research in September 2020 and includes the responses to questions from 2,690 senior IT executives at companies of 1,000 or more employees in Australia, Benelux, China, France, Germany, Hungary, India, Italy, Japan, Poland, Russia, Saudi Arabia, Singapore, Spain, South Africa, South Korea, Sweden, Turkey, UAE, UK and US.

About Veritas

Veritas Technologies is a global leader in data protection, availability and insights. Over 80,000 customers—including 87 percent of the Fortune Global 500—rely on us to abstract IT complexity and simplify data management. The Veritas Enterprise Data Services Platform automates the protection and orchestrates the recovery of data everywhere it lives, ensures 24/7 availability of business-critical applications, and provides enterprises with the insights they need to comply with evolving data regulations. With a reputation for reliability at scale and a deployment model to fit any need, Veritas Enterprise Data Services Platform supports more than 800 different data sources, over 100 different operating systems, more than 1,400 storage targets, and more than 60 different cloud platforms. Learn more at www.veritas.com. Follow us on Twitter at @veritastechllc.

Related Links :

http://www.veritas.com

Relativity Strengthens Investment in Australia’s e-Discovery and Compliance Market


Relativity hires a Managing Director for APAC, rolls out a local product update and brings Justice for Change program to Australia

MELBOURNE, Australia, Nov. 19, 2020 — Relativity, a global legal and compliance technology company, announced at Legal Innovation and Tech Fest that it is strengthening its investment in the Australian market. Relativity is growing its presence in Australia given the high demand and engagement from the region.

The Relativity community in Australia has shown more engagement than ever over the past year, including a 93% increase in attendance at user groups and nearly 40% growth in overall certifications, which is twice the global average. Additionally, RelativityOne data in Australia has more than doubled in the last year, demonstrating an increased desire for an e-discovery SaaS product.

Adding to the Team in Melbourne
Building out the team in Australia is a key element in Relativity’s continued investment in the region to provide the best support possible for customers. Relativity has hired Georgia Foster, Managing Director, APAC, to lead the organisation’s efforts in the region. Foster has more than 17 years of experience leading lead sales, operations, product and marketing teams in APAC, the U.S. and Latin America. She previously held roles at LinkedIn and Uber, bringing their products and concepts to the local market. 

"I’m thrilled to join the Relativity team at a time when there’s so much growth and excitement around the product in Australia and the APAC market more broadly," said Foster. "As we continue to expand in the local market, it’s important to empower our Australian users to be successful. I look forward to working with our customers and team members to ensure we can deliver the best experience possible."

RelativityOne’s Latest Release Built with Australia in Mind
Delivering a solution that makes meeting processing and production requirements in Australia simpler is a key priority. To achieve this, Relativity introduced a preview program enabling some Australian customers to provide real-time feedback allowing for iteration on the functionality prior to its release. The latest release for RelativityOne users in Australia offers:

  • Level Numbering to eliminate the need for multiple processing platforms.
  • Improved PDF Rendering and Viewer so there’s no more importing/exporting.
  • Improved PDF Redaction Workflow to apply redactions from within RelativityOne.
  • Updated options in Relativity Desktop Client (RDC) to export rendered PDFs.

"Our goal is for e-discovery teams to have a true end-to-end e-discovery platform in RelativityOne," said Stuart Hall, Senior Manager, APAC Service Delivery at Relativity. "This is the first time that we collaborated so closely with Australian customers on a locally focused product upgrade and the approach certainly benefitted both Relativity and our customers."

Expansion of Justice for Change Program
Relativity’s new Justice for Change program is now available in Australia, the first region outside of the U.S. This global program leverages the unique capabilities of RelativityOne and its ecosystem to positively impact racial justice progress in our communities. Justice for Change first launched at Relativity Fest in September where Relativity pledged 100 terabytes of RelativityOne to remove barriers to access technology for organising, collecting and analysing data in matters related to racial injustice.

Any customers or organisations working to promote racial justice are eligible to apply for the program. And for those in Australia who are not familiar with our software, Relativity will pair them with a service provider or law firm from its network that can assist.

"We are thrilled to include the Australian community in our efforts to make inclusion, diversity and belonging an integral part of our culture," Foster added. "I look forward to seeing the difference we can make when our community comes together to create positive change."

Legal Innovation and Tech Fest attendees can learn more about Justice for Change and additional updates at Relativity’s virtual booth and the following sessions:

  • Technology as the Enabler to Make Our Lives Better on Thursday, 19 Nov. at 1:10 p.m. AEDT
  • Relativity Q&A on Thursday, 19 Nov. at 1:40 p.m. AEDT
  • Product Demo of RelativityOne on Friday, 20 Nov. at 12:00 p.m. AEDT
  • Fireside Chat with Relativity’s Stuart Hall and KPMG’s Michael Khoury on Friday, 20 Nov. at 1:05 p.m. AEDT
  • Product Demo of Relativity Trace on Monday, 23 Nov. at 10:30 a.m. AEDT

About Relativity 
At Relativity, we make software to help users organize data, discover the truth, and act on it. Our platform is used by more than 13,000 organizations around the world to manage large volumes of data and quickly identify key issues during litigation, internal investigations, and compliance operations with SaaS platform RelativityOne and Relativity Trace. Relativity has users in 48+ countries from organizations, including the U.S. Department of Justice, and 199 of the Am Law 200. Relativity has been named one of Chicago’s Top Workplaces by the Chicago Tribune for 10 consecutive years. Please contact Relativity at sales@relativity.com or visit http://www.relativity.com for more information.

Logo – https://techent.tv/wp-content/uploads/2020/11/relativity-strengthens-investment-in-australias-e-discovery-and-compliance-market.jpg

Related Links :

https://www.relativity.com