GSX Techedu to Report Second Quarter 2020 Financial Results on September 2, 2020

BEIJING, Aug. 17, 2020 — GSX Techedu Inc. (NYSE: GSX) ("GSX" or the "Company"), a leading online K-12 large-class after-school tutoring service provider in China, today announced that it will report its financial results for the second quarter ended June 30, 2020, before U.S. markets open on September 2, 2020.

GSX’s management will hold an earnings conference call on Wednesday, September 2, 2020, at 8:00 AM U.S. Eastern Time (8:00 PM on the same day, Beijing/Hong Kong Time). Dial-in details for the earnings conference call are as follows:

International:              

1-412-317-6061

US:                             

1-888-317-6003

Hong Kong:                

800-963976

Mainland China:         

4001-206115

Passcode:                    

4536408

A telephone replay will be available two hours after the conclusion of the conference call through September 9, 2020. The dial-in details are:

International:  

1-412-317-0088

US:                 

1-877-344-7529

Passcode:        

10146943

Additionally, a live and archived webcast of this conference call will be available at http://gsx.investorroom.com/.

About GSX Techedu Inc.      

GSX is a technology-driven education company and leading online K-12 large-class after-school tutoring service provider in China. GSX offers K-12 courses covering all primary and secondary grades as well as foreign language, professional and interest courses. GSX adopts an online live large-class format to deliver its courses, which the Company believes is the most effective and scalable model to disseminate scarce high-quality teaching resources to aspiring students in China. Big data analytics permeates each aspect of the Company’s business and facilitates the application of the latest technology to improve teaching delivery, student learning experience, and operational efficiency.

For more information, please contact:

GSX Techedu Inc.
Ms. Sandy Qin, CFA
E-mail: ir@genshuixue.com

Christensen

In China
Mr. Eric Yuan
Phone: +86-10-5900-1548
E-mail: Eyuan@christensenir.com

In US

Ms. Linda Bergkamp
Phone: +1-480-614-3004
Email: lbergkamp@christensenir.com

Related Links :

http://www.genshuixue.com

Sai Life Sciences opens new, state-of-the-art Research & Technology Centre in Hyderabad

– Completes first phase in committed investment of US$ 150M (> INR 1000 Cr)

– Sri KT Rama Rao, Hon’ble Minister for Industry & Commerce and IT, Government of Telangana inaugurates the facility

HYDERABAD, India, Aug. 17, 2020 — Sai Life Sciences, one of India’s fastest growing Contract Development & Manufacturing Organizations (CDMOs), today announced the inauguration of its new Research and Technology (R&T) Centre in Hyderabad, India. Sri K T Rama Rao, Hon’ble Minister for Industry & Commerce and IT, Government of Telangana formally inaugurated the facility in the presence of other dignitaries.

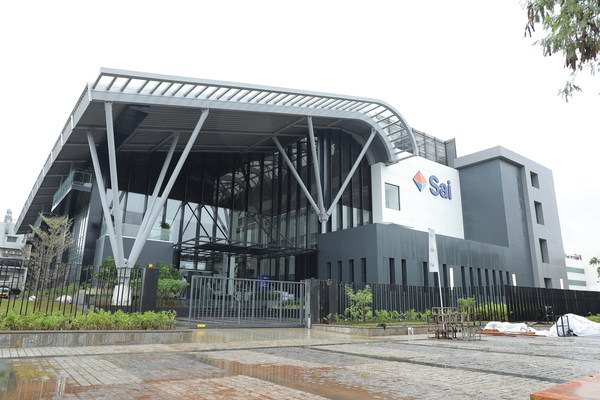
Sai Life Sciences New Research & Technology Centre

Speaking on the occasion, Sri KT Rama Rao said, "I’m very happy that the esteemed leadership of Sai Life sciences has considered Telangana for setting up their new R&D centre. Life Sciences is one of the key focus sectors for the Government of Telangana. Hyderabad serves more than 1000 global innovators in their vision to develop innovative and affordable medicines for the world. I sincerely congratulate the entire team of Sai Life Sciences, not only for the new Research & Technology Centre but, also for their work towards the development and manufacturing of new life saving medicines."

Built with an aspiration to achieve the best global benchmarks in lab infrastructure, the new R&T facility has several unique aspects such as intelligent & ergonomic lab design to enhance safety and productivity, advanced automation for seamless data capture during process development, lean & 5S approach to enhance productivity and collaborative workspaces for engendering innovation.

Making the announcement, Krishna Kanumuri, CEO & Managing Director of Sai Life Sciences said, "Our philosophy behind building this new facility was to go beyond what the norm is in India and to create what our global innovator partners expect in their inhouse capabilities." He further added, "We are an example of what is possible in Hyderabad’s rich life sciences ecosystem. Today, as we build world class R&D capabilities and invest in nurturing talent with deep domain expertise, I can unhesitatingly say, Hyderabad is truly a city where pharma dreams are made."

The new 83,000 sq.ft. (7700 sq.m.) facility houses state-of-the-art research capabilities and advanced technology platforms, augmenting the company’s capabilities in providing superior scientific solutions to its pharma and biotech innovator customers globally. It has 24 chemistry labs with 250 fume hoods, analytical labs, fully equipped technology suite and a dedicated process safety lab.

Sai Life Sciences began a process of organizational transformation in 2019 reinventing itself as a new generation global CDMO. Through this initiative, named Sai Nxt, the company is investing over US$ 150M (> INR 1000 Cr) to expand and upgrade its R&D and manufacturing facilities, induct top-notch global scientific and leadership talent, strengthen automation and data systems, and above all raise the bar for safety, quality and customer focus.

About Sai Life Sciences
Sai Life Sciences is a full-service CDMO driven by a vision to support the launch of 25 new medicines by 2025.  It works with innovator pharma and biotech companies globally, accelerating the discovery, development and manufacture of complex small molecules. A pure-play CDMO, Sai Life Sciences has served a diverse set of NCE development programs, consistently delivering value based on its quality and responsiveness. Today, it works with 7 of the top 10 large pharma companies, as well as several small and mid-sized pharma & biotech companies. Sai Life Sciences is privately held and backed by global investors, TPG Capital and HBM Healthcare Investments. https://www.sailife.com/

Photo: https://techent.tv/wp-content/uploads/2020/08/sai-life-sciences-opens-new-state-of-the-art-research-technology-centre-in-hyderabad-3.jpg  
Photo: https://techent.tv/wp-content/uploads/2020/08/sai-life-sciences-opens-new-state-of-the-art-research-technology-centre-in-hyderabad.jpg  
Logo: https://techent.tv/wp-content/uploads/2020/08/sai-life-sciences-opens-new-state-of-the-art-research-technology-centre-in-hyderabad-2.jpg

Inauguration of Sai Life Sciences’ New Research & Technology Centre. Seen in the picture from left to right – Krishna Kanumuri, CEO & MD Sai Life Sciences, Sri K T Rama Rao, Hon'ble Minister for IT, Industries, MA & UD and Jayesh Ranjan, Principal Secretary to Government Industries and Commerce
Inauguration of Sai Life Sciences’ New Research & Technology Centre. Seen in the picture from left to right – Krishna Kanumuri, CEO & MD Sai Life Sciences, Sri K T Rama Rao, Hon’ble Minister for IT, Industries, MA & UD and Jayesh Ranjan, Principal Secretary to Government Industries and Commerce


Oucica Will Release Its New Photocatalyst Air Purifier to Markets in Late August

SHENZHEN, China, Aug. 15, 2020 — Oucica, a Sub-brand of Huntkey, expert of air purification solutions will release its desktop air purifier DJ010 in the late of August. Like its previously released air purification products, the DJ010 is still developed and manufactured by photocatalyst technology. Different from the previous products, DJ010 is smaller and more suitable for use in small spaces such as desktops and cars.

https://en.huntkey.com/wp-content/uploads/2020/08/oucica-desktop-air-purifier.jpg

What is Photocatalyst?

Photocatalyst is a general term for photo-semiconductor materials with photocatalytic function represented by nano-sized titanium dioxide. It is coated on the surface of the substrate and produces strong catalytic degradation function under the action of ultraviolet light and visible light. Photocatalyst can effectively kill bacteria and virus in the air and decompose harmful substances in the air into water and carbon dioxide. It is a ideal solution for removing formaldehyde, deodorizing, anti-pollution and purifying air.

Reasons to choose Oucica DJ010

Reliable and stable technology

Oucica uses patented spraying technology to uniformly spray titanium dioxide on the surface of the substrate, which is firm and durable, and the addition of antibacterial metal to further enhance the performance of ordinary photocatalyst.

No consumable material design

When Oucica DJ010 works, the air will first pass through the preliminary filter, which can be washed with water. The photocatalyst filter can usually be used for a lifetime without cleaning. There is no problem removing it for cleaning if users want.

Exquisite and compact

It measures a dimension of φ108*160mm, which is easy for users to carry and suitable for air cleaning for a space of 8-10cbm. It features a standby consumption of lower than 200mW, as well as a noise level of 38dB(A) at the maximum. For more product information, please visit: https://en.huntkey.com/

Specifications:
Model: DJ010
Input: 5V/2A (Min. 4.6V, Max. 5.5V)
Rated Power: 8W
Standby Consumption: <200mW
Noise Level (Max.): 38dB(A)
Air Volume: 10cbm/h (Max.)
Applicable Space: 8-10cbm
Dimensions: φ108*160mm

About Oucica

Oucica, a subsidiary of Huntkey, specializes in the development of photocatalyst air purifiers. To improve the air quality of working, living or studying, it has developed a series of air purifiers including model KJ380 for large spaces, CJ001 for car sterilizing and DJ010 for desktops.

Contact
Melody Kim
+86-755-8960-6593
jinzm@huntkey.net


Related Links :

Home

Hexindai Files Annual Report on Form 20-F for Fiscal Year 2020

BEIJING, Aug. 15, 2020 — Hexindai Inc. (NASDAQ: HX) ("Hexindai" or the "Company"), a mobile e-commerce and consumer lending platform in China, today announced that it filed its annual report on Form 20-F for the fiscal year ended March 31, 2020 with the U.S. Securities and Exchange Commission ("SEC") on August 14, 2020. The annual report on Form 20-F, which contains its audited financial statements, can be accessed on the SEC’s website at http://www.sec.gov as well as via the Company’s investor relations website at http://ir.hexindai.com.

The Company will provide a hard copy of its annual report containing the audited consolidated financial statements, free of charge, to its shareholders upon request. Requests should be directed to the Company’s IR Department via email at ir@hexindai.com.

About Hexindai Inc.

Hexindai Inc. (NASDAQ: HX) ("Hexindai" or the "Company") is a mobile e-commerce and consumer lending platform based in Beijing, China. The Company collaborates with brands both online and offline to offer high-quality and affordable branded products through its new form of social e-commerce mobile platform and facilitates loans to meet the increasing consumption needs of underserved prime borrowers through its online consumer lending marketplace. Hexindai’s strong user acquisition capabilities, cutting-edge risk management system, and strategic relationships with respected financial institutions allow the Company to generate higher customer satisfaction, reliance, and realize fast growth.

Safe Harbor Statement

This announcement contains forward-looking statements within the meaning of Section 21E of the Securities Exchange Act of 1934, as amended. These forward-looking statements are made under the "safe harbor" provisions of the U.S. Private Securities Litigation Reform Act of 1995. These statements can be identified by terminology such as "will," "expects," "anticipates," "future," "intends," "plans," "believes," "estimates," "potential," "continue," "ongoing," "targets," "guidance" and similar statements. The Company may also make written or oral forward-looking statements in its periodic reports to the U.S. Securities and Exchange Commission (the "SEC"), in its annual report to shareholders, in press releases and other written materials and in oral statements made by its officers, directors or employees to third parties. Any statements that are not historical facts, including statements about the Company’s beliefs and expectations, are forward-looking statements that involve factors, risks and uncertainties that could cause actual results to differ materially from those in the forward-looking statements. Such factors and risks include, but not limited to the following: the Company’s goals and strategies; its future business development, financial condition and results of operations; the expected growth of the credit industry, and marketplace lending in particular, in China; the demand for and market acceptance of its marketplace’s products and services; its ability to attract and retain borrowers and investors on its marketplace; its relationships with its strategic cooperation partners; competition in its industry; and relevant government policies and regulations relating to the corporate structure, business and industry. Further information regarding these and other risks, uncertainties or factors is included in the Company’s filings with the SEC. All information provided in this announcement is current as of the date of this announcement, and the Company does not undertake any obligation to update such information, except as required under applicable law.

For more information, please visit ir.hexindai.com.

For investor inquiries, please contact:

Hexindai

Investor Relations
Ms. Zenabo Ma
Email: ir@hexindai.com

Christensen

In China
Mr. Eric Yuan
Phone: +86-10- 5900-1548
E-mail: Eyuan@christensenir.com

In US
Mr. Tip Fleming
Phone: +1-917-412-3333
Email: tfleming@Christensenir.com

Related Links :

http://www.hexindai.com

Blue Hat Interactive Entertainment Technology Announces First Half Year of 2020 Unaudited Financial Results

XIAMEN, China, Aug. 15, 2020 — Blue Hat Interactive Entertainment Technology ("Blue Hat" or the "Company") (NASDAQ: BHAT), a producer, developer and operator of augmented reality ("AR") interactive entertainment games, toys and educational materials in China, today announced its unaudited financial results for the six months ended June 30, 2020.

First Half Year of 2020 Financial Highlights

  • Total revenues decreased by 34.9% for the six months ended June 30, 2020 to US$4.9 million.
     
  • Gross profit decreased by 30.8% for the six months ended June 30, 2020 to US$3.7 million.
     
  • Income from operations decreased by 50.8% for the six months ended June 30, 2020 to US$1.6 million.
     
  • Net income decreased by 58.8% for the six months ended June 30, 2020 to US$1.3 million.

"The outbreak of COVID-19 since the beginning of 2020 has adversely impacted the global economy and our financial performance in the first half year was negatively affected as a result of the suspension of the entire industry. With daily life in China gradually returning to normal since April, our business related to education industry ramped up during the period," said Mr. Xiaodong Chen, Chief Executive Officer of Blue Hat, "I’m pleased that our thriving smart education business line made a significant addition to our portfolio. ‘AR Immersive Classes’ (‘ARIC’), integrated with physical exercises in terms of AR-based educational content and products, targets children between three and six years old. Interactive education combines teaching with entertainment, inspiring kids with imagination and critical thinking. We build Direct-to-Consumer social content marketing channels via short videos and live streaming to increase our brand awareness, and broaden our market reach. Looking forward, we intend to continue to explore both in-house development and strategic investment opportunities to strengthen our pipeline of toy and game content and maximize shareholder value."

Recent Developments

  • Blue Hat announced in January 2020 that its AR child abuse prevention course would be introduced in 25 preschools in Tong’an District, Xiamen City as a compulsory part of the curriculum for children before they graduate from kindergarten.
     
  • In February 2020, Blue Hat announced a new suite of smart educational products "AR Immersive Classes" ("ARIC"), which includes "Smart Screen Immersive Education Classes", "Smart Immersive Cognitive Education Classes" and "Smart Immersive Physical Education Classes.", and upgrades System for Evaluating Developmental Progress of Preschool Students in China.
     
  • In March 2020, Blue Hat’s "Interactive System Based on Light Intensity Recognition" received U.S. patent with the number US 10,512,836 B2 from the United States Patent and Trademark Office. 
     
  • In May 2020, Blue Hat announced that it has signed a three-year partnership with smart education service provider, Sutesen Information Technology Ltd., to expand Blue Hat’s Smart Immersive Education Classes, or ARIC, in Guangxi province, China. The partnership aims to commercially launch ARIC in up to 1,000 Guangxi preschools in three years.
     
  • In June 2020, Blue Hat announced that it has partnered with Xiamen Xing Meng Wei Lai Culture Media Co. LTD, a leading Chinese multi-channel network and internet content development agency, to build Direct-to-Consumer social content marketing channels via short videos and live streaming.
     
  • In July 2020, Blue Hat entered into a Securities Purchase Agreement with two accredited institutional investors to sell senior secured convertible notes of the Company in a private placement to the investors, in the aggregate principal amount of $3,262,000, together with the issuance of warrants to acquire up to 784,000 ordinary shares of the Company for an aggregate cash purchase price of $2,800,000 (reflecting an original issue discount of $462,000).

First Half 2020 Results

Total revenues were $4.9 million for the six months ended June 30, 2020, a decrease of $2.6 million, or 34.9%, from $7.5 million for the same period ended June 30, 2019. The overall decrease was primarily attributed to the fewer sales of interactive toys (game series) during the period, partially offset by revenue from ARIC, which was launched to the market this year.

Gross profit was $3.7 million for the six months ended June 30, 2020, a decline of $1.6 million, or 30.8%, from $5.3 million for the same period ended June 30, 2019. Gross profit margin was 75.2% for the six months ended June 30, 2020, compared to 70.8% for the same period of 2019. Research and development expenses of mobile games recorded in Cost of Sales are fully amortized this February, consequently, gross profit ratio increased by 4.4%.    

Operating expenses were $ 2,032,696 for the six months ended June 30, 2020, an increase of $47,752, or 2.4%, from $1,984,944 for the same period ended June 30, 2019. This increase was mainly due to the increase of general and administrative expenses amounted to $221,638, offset by the decrease of selling expense of around $119,705. Fixed cost increased during the first half of 2020 mainly due to the amortization of newly incurred rental cost and software patents. Legal expenses accounted for an obvious growth of general and administrative expenses in connection with our recent financing.

Income from operations was $1.6 million for the six months ended June 30, 2020, a decrease of $1.7 million, or 50.8%, from $3.3 million for the same period ended June 30, 2019.

Net income attributable to ordinary shareholders was $1.3 million for the six months ended June 30, 2020, compared with $3.1 million for the same period ended June 30, 2019. or $0.04 and $0.09 per basic and diluted share respectively.

Cash and Cash Equivalents

As of June 30, 2020, BHAT maintained strong cash resources of cash and cash equivalents totaling $11.4 million, compared with $10.5 million by the ended of December 31, 2019.

About Blue Hat

Blue Hat Interactive Entertainment Technology is a producer, developer and operator of AR interactive entertainment games and toys in China, including interactive educational materials, mobile games, and toys with mobile game features. The Company’s interactive entertainment platform creates unique user experiences by connecting physical items to mobile devices, which creates a rich visual and interactive environment for users through the integration of real objects and virtual scenery.  Distinguished by its own proprietary technology, Blue Hat aims to create an engaging, interactive and immersive community for its users. For more information, please visit the Company’s investor relations website at http://ir.bluehatgroup.com.  The Company routinely provides important information on its website.

Forward-Looking Statements 

This release contains forward-looking statements within the meaning of Section 27A of the Securities Act of 1933, as amended and Section 21E of the Securities Exchange Act of 1934, as amended. All forward-looking statements are inherently uncertain as they are based on current expectations and assumptions concerning future events or future performance of the Company. Readers are cautioned not to place undue reliance on these forward-looking statements, which are only predictions and speak only as of the date hereof. In evaluating such statements, prospective investors should review carefully various risks and uncertainties identified in this release and matters set in the Company’s SEC filings. These risks and uncertainties could cause the Company’s actual results to differ materially from those indicated in the forward-looking statements.

Contacts:

Lexie Zhang
Blue Hat Interactive Entertainment Technology
Phone: +86 (592) 228-0010
Email: ir@bluehatgroup.net


BLUE HAT INTERACTIVE ENTERTAINMENT TECHNOLOGY AND SUBSIDIARIES

UNAUDITED CONSOLIDATED BALANCE SHEETS

June 30,

December 31,

ASSETS

2020

2019

CURRENT ASSETS

Cash and cash equivalents

US$

11,372,626

US$

10,478,587

Accounts receivable, net

14,420,292

13,631,359

Other receivables, net

12,972,825

13,182,529

Prepayments, net

277,376

299,577

Inventories

249,563

125,264

Restricted cash

5,000,000

Total current assets

39,292,682

42,717,316

PROPERTY AND EQUIPMENT, NET

4,417,195

2,324,823

OTHER ASSETS

Prepayments

4,660,489

4,425,849

Operating lease, right-of-use asset

501,136

679,850

Intangible assets, net

6,423,487

6,758,316

Long-term investments

1,702,098

1,727,301

Deferred tax assets

188,872

182,234

Total other assets

13,476,082

13,773,550

Total assets

US$

57,185,959

US$

58,815,689

LIABILITIES AND SHAREHOLDERS’ EQUITY

CURRENT LIABILITIES

Short-term loans – banks

1,963,415

5,819,787

Current maturities of long-term loans – third
party

51,915

77,493

Accounts payable

1,420,706

293,985

Other payables and accrued liabilities

3,278,340

3,628,809

Other payables – related party

252,989

21,341

Operating lease liabilities-current

264,903

313,460

Customer deposits

3,573

Taxes payable

4,264,275

3,525,153

Total current liabilities

11,500,116

13,680,028

OTHER LIABILITIES

Operating lease liability

255,190

372,051

Long-term loans – third party

13,328

Total other liabilities

255,190

385,379

Total liabilities

11,755,306

14,065,407

COMMITMENTS AND CONTINGENCIES

Total shareholders’ equity

Ordinary shares, US$0.001 par value, 50,000,000
shares authorized, 35,141,114 shares issued and
outstanding as of June 30, 2020,  35,141,114 shares
issued and outstanding as of December 31, 2019

35,141


35,141

Additional paid-in capital

20,771,849

20,771,849

Statutory reserves

1,289,765

1,289,765

Retained earnings

25,391,957

24,132,194

Accumulated other comprehensive income
(loss)

(2,058,059)

(1,478,667)

Total shareholders’ equity

45,430,653

44,750,282

Total liabilities and shareholders’ equity

US$

57,185,959

US$

58,815,689


BLUE HAT INTERACTIVE ENTERTAINMENT TECHNOLOGY AND SUBSIDIARIES

UNAUDITED CONSOLIDATED STATEMENTS OF INCOME AND COMPREHENSIVE INCOME

For the Three Months ended June 30,

2020

2019

REVENUES

US$

2,611,204

 US$

3,176,566

Interactive toys – animation series

(148)

11,248

Interactive toys – game series

2,046,625

2,251,849

Mobile games

564,727

913,469

COST OF REVENUES

(634,473)

(953,732)

GROSS PROFIT

1,976,731

2,222,834

OPERATING EXPENSES

Selling

(117,549)

(207,263)

General and administrative

(1,057,108)

(650,605)

Research and development

(69,128)

(96,148)

Total operating expenses

(1,243,785)

(954,016)

INCOME FROM OPERATIONS

732,946

1,268,818

OTHER INCOME (EXPENSE)

Interest income

107,507

32

Interest expense

(51,053)

(18,759)

Other finance expenses

47,581

(724)

Other (expense) income, net

2,328

(105,621)

Total other income, net

106,363

(125,072)

INCOME BEFORE INCOME TAXES

839,309

1,143,746

PROVISION FOR INCOME TAXES

(338,919)

(55,447)

NET INCOME

500,390

1,088,299

OTHER COMPREHENSIVE INCOME (LOSS)

Foreign currency translation adjustment

25,968

31,760

COMPREHENSIVE INCOME

US$

526,358

 US$

1,120,059

WEIGHTED AVERAGE NUMBER OF
ORDINARY SHARES

Basic and diluted

35,141,114

33,000,000

EARNINGS PER SHARE

Basic and diluted

US$

0.01

 US$

0.03


BLUE HAT INTERACTIVE ENTERTAINMENT TECHNOLOGY AND SUBSIDIARIES

UNAUDITED CONSOLIDATED STATEMENTS OF INCOME AND COMPREHENSIVE INCOME

For the Six Months ended June 30,

2020

2019

REVENUES

US$

4,854,862

 US$

7,453,379

Interactive toys – animation series

54

89,391

Interactive toys – game series

3,701,861

6,116,883

Mobile games

1,152,947

1,247,105

COST OF REVENUES

(1,203,962)

(2,176,756)

GROSS PROFIT

3,650,900

5,276,623

OPERATING EXPENSES

Selling

(290,699)

(410,404)

General and administrative

(1,596,818)

(1,375,180)

Research and development

(145,179)

(199,360)

Total operating expenses

(2,032,696)

(1,984,944)

INCOME FROM OPERATIONS

1,618,204

3,291,679

OTHER INCOME (EXPENSE)

Interest income

107,884

502

Interest expense

(123,660)

(65,507)

Other finance expenses

(10,168)

(1,881)

Other (expense) income, net

20,862

(3,230)

Total other income, net

(5,082)

(70,116)

INCOME BEFORE INCOME TAXES

1,613,122

3,221,563

PROVISION FOR INCOME TAXES

(353,359)

(161,346)

NET INCOME

1,259,763

3,060,217

OTHER COMPREHENSIVE INCOME (LOSS)

Foreign currency translation adjustment

(579,392)

12,269

COMPREHENSIVE INCOME

US$

680,371

 US$

3,072,486

WEIGHTED AVERAGE NUMBER OF
ORDINARY SHARES

Basic and diluted

35,141,114

33,000,000

EARNINGS PER SHARE

Basic and diluted

US$

0.04

 US$

0.09


Related Links :

http://www.bluehatgroup.net

iClick Chairman and Co-Founder Sammy Hsieh Interviewed on TD Ameritrade Network’s The Watch List with Nicole Petallides

Sammy discusses how iClick’s revolutionary digital marketing and enterprise solutions help world’s leading brands in China and the company’s stock price run over the past six months

HONG KONG, Aug. 14, 2020 —  iClick Interactive Asia Group Limited ("iClick" or the "Company") (NASDAQ: ICLK), an independent online marketing and enterprise data solutions provider in China, is glad to share that iClick’s Chairman and Co-Founder Sammy Hsieh appeared as a featured guest on TD Ameritrade Network’s The Watch List with veteran news anchor Nicole Petallides on Thursday, August 13, 2020.

On the show, Sammy shared how iClick is revolutionizing digital marketing in China by helping many of the world’s largest companies not only identify and interact with consumers online effectively but also integrate online-to-offline information to unlock the huge potential of the smart retail market. Sammy also discussed how brands are focusing on China more than ever as it recovers from the COVID-19 downturn, helping propel iClick’s revenue to record heights for any of its first quarter – and sending its stock price soaring over the past 6 months.

The Watch List, hosted by Nicole Petallides, highlights a panel of experts ranging from industry-leading CEOs, analysts, and Wall Street influencers to discuss pressing topics moving the market and is intended to provide viewers with a status update for the end of the trading day and beyond.

Watch the full interview here: https://tdameritradenetwork.com/video/rB4AoXPME2WBc-hLx7UHbQ

About iClick Interactive Asia Group Limited

iClick Interactive Asia Group Limited (NASDAQ: ICLK) is an independent online marketing and enterprise data solutions provider that connects worldwide marketers with audiences in China. Built on cutting-edge technologies, iClick’s proprietary platform possesses omni-channel marketing capabilities and fulfils various marketing objectives in a data-driven and automated manner, helping both international and domestic marketers to reach their target audiences in China. Headquartered in Hong Kong, iClick was established in 2009 and is currently operating in ten locations worldwide including Asia and Europe.

For more information, please visit ir.i-click.com.

Safe Harbor Statement

This announcement contains forward-looking statements, including those related to the Company’s business strategies, operations and financial performance. These statements constitute "forward-looking" statements within the meaning of Section 21E of the Securities Exchange Act of 1934, as amended, and as defined in the U.S. Private Securities Litigation Reform Act of 1995. These forward-looking statements can be identified by terminology such as "will," "expects," "anticipates," "future," "intends," "plans," "believes," "estimates," "confident" and similar statements. Such statements are based upon management’s current expectations and current market and operating conditions and relate to events that involve known or unknown risks, uncertainties and other factors, all of which are difficult to predict and many of which are beyond the Company’s control. Forward-looking statements involve inherent risks and uncertainties. A number of factors could cause actual results to differ materially from those contained in any forward-looking statement, including but not limited to the following: the Company’s fluctuations in growth; its success in implementing its mobile and new retail strategies, including extending its solutions beyond its core online marketing business; its success in structuring a CRM & Marketing Cloud platform; relative percentage of its gross billing recognized as revenue under the gross and net models; its ability to retain existing clients or attract new ones; its ability to retain content distribution channels and negotiate favorable contractual terms; market competition, including from independent online marketing technology platforms as well as large and well-established internet companies; market acceptance of online marketing technology solutions and enterprise solutions; effectiveness of its algorithms and data engines; its ability to collect and use data from various sources; ability to integrate and realize synergies from acquisitions, investments or strategic partnership; fluctuations in foreign exchange rates; and general economic conditions in China and other jurisdictions where the Company operates; and the regulatory landscape in China and other jurisdictions where the Company operates. Further information regarding these and other risks is included in the Company’s annual report on Form 20-F and other filings with the SEC. All information provided in this press release and in the attachments is as of the date of this press release, and the Company undertakes no obligation to update any forward-looking statement, except as required under applicable law.

For investor and media inquiries, please contact:


In China:

In the United States:

iClick Interactive Asia Group Limited

Core IR

Lisa Li

John Marco

Phone: +86-21-3230-3931 #892

Tel: +1-516-222-2560

E-mail: ir@i-click.com

E-mail: johnm@coreir.com


Related Links :

Homepage

Momo to Report Second Quarter 2020 Results on September 3, 2020

BEIJING, Aug. 14, 2020 — Momo Inc. (Nasdaq: MOMO) ("Momo" or the "Company"), a leading mobile social and entertainment platform in China, today announced that it will release its unaudited financial results for the second quarter ended June 30, 2020 before U.S. markets open on Thursday, September 3, 2020.

Momo’s management will host an earnings conference call on Thursday, September 3, 2020, at 8:00 a.m. U.S. Eastern Time (8:00 p.m. Beijing / Hong Kong Time on the same day).

Due to the outbreak of COVID-19, operator assisted conference calls are not available at the moment. All participants must preregister online prior to the call to receive the dial-in details.

Preregistration Information

Participants can register for the conference call by navigating to http://apac.directeventreg.com/registration/event/9767454. Once preregistration has been complete, participants will receive dial-in numbers, direct event passcode, and a unique registrant ID.

To join the conference, simply dial the number in the calendar invite you receive after preregistering, enter the passcode followed by your registrant ID, and you will join the conference instantly.

A telephone replay of the call will be available after the conclusion of the conference call through 9:00 a.m. U.S. Eastern Time, September 11, 2020. The dial-in details for the replay are as follows:

International:

+61-2-8199-0299

U.S. Toll Free:

+1-855-452-5696

Passcode:

9767454

Additionally, a live and archived webcast of the conference call will be available on the Investor Relations section of Momo’s website at http://ir.immomo.com.

About Momo Inc.

We are a leading player in China’s online social and entertainment space. Through Momo, Tantan and other properties within our product portfolio, we enable users to discover new relationships, expand their social connections and build meaningful interactions. Momo is a mobile application that connects people and facilitates interactions based on location, interests and a variety of recreational activities including live talent shows, short videos, social games as well as other video- and audio-based interactive experiences, such as live chats and mobile karaoke experience. Tantan, which was added into our family of applications through acquisition in May 2018, is a leading social and dating application for the younger generation. Tantan is designed to help its users find and establish romantic connections as well as meet interesting people.

For investor and media inquiries, please contact:

Momo Inc.
Momo Investor Relations
Ms. Ashley Jing
Phone: +86-10-5731-0538
Email: ir@immomo.com

Christensen

In China
Mr. Eric Yuan
Phone: +86-10-5900-1548
E-mail: Eyuan@christensenir.com

In US
Ms. Linda Bergkamp
Phone: +1-480-614-3004
Email: lbergkamp@christensenir.com

Related Links :

http://ir.immomo.com/

CareMonkey becomes ‘Operoo’, launches digital school operations platform

Education technology provider repositions to meet surging demand to streamline and automate operational school tasks and processes in K – 12 sector

NEW YORK, Aug. 14, 2020 — CareMonkey – the world’s fastest growing cloud-based solution for online school forms, medical data and trip management – has relaunched as ‘Operoo’. The relaunch will see the company trade as Operoo, with its software – rebranded under the same name, emphasizing its power as a School Operations and Productivity Platform.

The brand’s new logo and website were unveiled at www.operoo.com, along with a simple mission statement: To help schools eliminate operational inefficiencies, so that every dollar and every minute possible is focused on student education.

Operoo CEO and CoFounder, Troy Westley, said the new name reflected how the company had evolved to meet growing demand throughout the global K – 12 education sector for solutions that could streamline a broad range of day-to-day school operations.

"The ‘Oper’ part of Operoo is short for ‘operations’, while the ‘roo’ is a reminder of our Australian origins – even though we’re now truly an international company with offices in the USA, UK and Australia," said Westley. "When we began CareMonkey in 2013, the product was all about care – hence the name. The focus was on collecting child medical and emergency information from parents, then making that data securely available to schools and supervisors at other organizations with a duty-of-care.

"Since then, our product has grown and matured. We’ve listened to what our customers want and how they use the product. The feedback was clear: The daily operational and administrative demand placed on schools and their staff is growing fast. As a result, schools are looking for solutions to reduce the resources required to complete those recurring tasks so that they can focus on what really matters; educating young people. Operoo empowers schools to achieve that goal."

The renewed focus has seen the company grow rapidly, expanding its US and UK client bases by more than 1100% and 260% respectively since early 2019.

Operoo President, Peter Bencivenga, said: "For a long time, there’s been a huge gap in the education technology market, which sat between school administration systems and single use case products; like parent communication or payment apps.

"While we had already been working to address this need leading up to the launch of Operoo, that gap became glaringly obvious when COVID-19 started impacting the global education sector. Not only did the number of operational tasks schools had to manage soar, they simply had to be managed digitally in order to adhere to social distancing requirements and government health guidelines. Paper-based and human-reliant ways of working just weren’t an option. Operoo’s School Operations and Productivity Platform bridges that gap."

Operoo enables schools to automate, manage and track operational tasks in one cloud-based platform. Operoo offers digital workflows for a range of routine school processes – which are often manual, disconnected and paper-based – including distributing and collecting school forms, mobile communications, parental consent, payments, medical and emergency information, staff approvals, incident reporting, activity and group management, paperless school trips and more.

Operoo client and Principal at New York City’s Staten Island Technical High School, Mark Erlenwein, commented: "We started working with CareMonkey, now Operoo, because we were spending too much time and money manually managing routine paper processes. We’ve now digitized and automated over 30 different workflows – from emergency contact cards and consent forms, to reimbursement and leave requests – reducing the manpower required to perform them by 75 percent."

The latest iteration of the OECD’s global Teaching and Learning International Survey found that educators in the developed world are working longer hours than ever before. An increasing amount of time spent on non-teaching tasks was cited as a key contributor to that trend, with ‘skyrocketing administrative requirements’ a primary culprit. In fact, 91 percent of the 18,000 educators who contributed to the University of Sydney’s 2018 study, Understanding Work in Schools, reported experiencing a level of administrative demand so high it was a ‘hindrance’ to their job.

Founded in 2013 from Melbourne, Australia, CareMonkey won numerous awards, including two global start-up competitions in 2015: Talent Unleashed, presented by Sir Richard Branson, and Slush, where the company won a €650,000 investment. Company CoFounders, Troy Westley (CEO) and Martin Howell (CTO), declined the offer in favor of growing the business organically.

In 2019, a consortium led by Peter Bencivenga, New Ground Ventures and ReThink Education, approached and invested in CareMonkey, with Bencivenga becoming CareMonkey’s President.

Today, Operoo has offices in the US, UK and Australia serving thousands of customers from every major continent around the world. The company’s School Productivity and Operations Platform will be generally available under the Operoo name from Friday 14th August 2020.

– END –

About Operoo

Operoo is a School Operations and Productivity Platform. Operoo is helping thousands of schools and other organizations around the world to eliminate slow, expensive and repetitive paper-based tasks. Operoo empowers schools to save time and resources by automating operational tasks and workflows, increasing staff productivity, parental engagement and student participation.

Streamline and digitize any school process, drastically reducing the associated costs: From permission forms, payments, and school trips; to medical information and emergency contacts, incident reporting, staff agreements, student onboarding and more. And, effectively communicate with staff, parents and your whole school community in over 100 languages with Operoo’s multi-language capability.

With Operoo, ensure every dollar and every minute possible is focused on students, rather than wasting resources on operational inefficiencies. For more information, visit www.operoo.com

For further media information, interviews, images or product demonstration, please contact:

Operoo CMO, Lachlan James, on +61 (0)431 835 658 or ljames@operoo.com

Related Links :

http://www.operoo.com

Fang Announces Second Quarter and First Half Year 2020 Unaudited Financial Results

BEIJING, Aug. 14, 2020 — Fang Holdings Limited (NYSE: SFUN) (“Fang” or “we”), a leading real estate Internet portal in China, today announced its unaudited financial results for the second quarter and the first half year ended June 30, 2020.

Second Quarter 2020 Highlights

  • Total revenues were $66.8 million, a decrease of 1.5% from $67.8 million in the corresponding period of 2019.
  • Operating income from continuing operations was $6.4 million, a decrease of 78.7% from $30.1 million in the corresponding period of 2019.
  • Net income was $21.5 million, an increase of 321.6% from $5.1 million in the corresponding period of 2019.

First Half 2020 Highlights

  • Total revenues were $103.0 million, which remained relatively stable with $102.8 million in the corresponding period of 2019.
  • Operating income from continuing operations was $6.9 million, a decrease of 62.3% from $18.3 million in the corresponding period of 2019.
  • Net loss was $19.4 million, compared to net income of $18.5 million in the corresponding period of 2019.

“During the COVID-19 global pandemic, Fang remained solid financially in the first half of 2020,” commented Mr. Jian Liu, CEO of Fang. “For the coming quarters we will continue our focus on new initiatives such as live broadcastings, online exhibitions and VR livestreams to better serve our customers.”

Second Quarter 2020 Financial Results

Revenues

Fang reported total revenues of $66.8 million in the second quarter of 2020, a decrease of 1.5% from $67.8 million in the corresponding period of 2019, mainly due to the decrease in revenues from listing services.  

  • Revenue from marketing services was $32.1 million in the second quarter of 2020, a decrease of 1.2% from $32.5 million in the corresponding period of 2019.
  • Revenue from listing services was $14.2 million in the second quarter of 2020, a decrease of 26.0% from $19.2 million in the corresponding period of 2019, mainly due to the decrease in the number of paying customers.
  • Revenue from leads generation services was $17.3 million in the second quarter of 2020, an increase of 60.2% from $10.8 million in the corresponding period of 2019, mainly due to an increased acceptance and popularity of our leads generation services.
  • Revenue from financial services was $1.6 million in the second quarter of 2020, a decrease of 44.8% from $2.9 million in the corresponding period of 2019, mainly due to the decrease in average loan receivable balance.

Cost of Revenue

Cost of revenue was $3.6 million in the second quarter of 2020, a decrease of 56.3% from $8.3 million in the corresponding period of 2019, primarily due to the decline in sales and the optimization in cost structure.

Operating Expenses

Operating expenses were $56.2 million in the second quarter of 2020, an increase of 81.3% from $31.0 million in the corresponding period of 2019, mainly due to the increase in staff related costs.

  • Selling expenses were $14.9 million in the second quarter of 2020, a decrease of 7.5% from $16.1 million in the corresponding period of 2019, mainly due to the decrease in staff related costs.
  • General and administrative expenses were $41.3 million in the second quarter of 2020, an increase of 177.2% from $14.9 million in the corresponding period of 2019, mainly due to the increase in staff related costs.

Operating Income from Continuing Operations

Operating income from continuing operations was $6.4 million in the second quarter of 2020, a decrease of 78.7% from $30.1 million in the corresponding period of 2019, mainly due to the increase in operating expenses.

Change in Fair Value of Securities

Change in fair value of securities for the second quarter of 2020 was a loss of $0.7 million, compared to a loss of $48.5 million in the corresponding period of 2019, mainly due to the fluctuation in market price of investments in equity securities.

Income Tax Benefits

Income tax benefits were $16.7 million in the second quarter of 2020, a decrease of 17.2% compared to income tax benefits of $20.1 million in the corresponding period of 2019, primarily due to the effect of change in fair value of equity securities.

Net Income

Net income was $21.5 million in the second quarter of 2020, an increase of 321.5% from $5.1 million in the corresponding period of 2019.

First half year 2020 Financial Results

Revenues

Fang reported total revenues of $103.0 million in the first half year of 2020, which remained relatively stable with $102.8 million in the corresponding period of 2019.   

  • Revenue from marketing services was $47.2 million in the first half of 2020, an increase of 3.3% from $45.7 million in the corresponding period of 2019, mainly due to the growth of company’s new initiative such as live broadcastings., etc.
  • Revenue from listing services was $24.4 million in the first half of 2020, a decrease of 22.3% from $31.4 million in the corresponding period of 2019, mainly due to the decrease in the number of paying customers.
  • Revenue from leads generation services was $24.8 million in the first half of 2020, an increase of 67.6% from $14.8 million in the corresponding period of 2019.
  • Revenue from financial services was $3.3 million in the first half of 2020, a decrease of 48.4% from $6.4 million in the corresponding period of 2019, mainly due to the decrease in average loan receivable balance.

Cost of Revenue

Cost of revenue was $9.0 million in the first half year of 2020, a decrease of 46.1% from $16.7 million in the corresponding period of 2019, primarily due to cost savings from optimizing Fang’s core business.

Operating Expenses

Operating expenses were $88.3 million in the first half year of 2020, an increase of 26.5% from $69.8 million in the corresponding period of 2019, mainly due to the increase in staff related costs.

  • Selling expenses were $28.5 million in the first half year of 2020, a decrease of 12.3% from $32.5 million in the corresponding period of 2019, mainly due to the decrease in staff related costs.
  • General and administrative expenses were $59.8 million in the first half year of 2020, an increase of 60.3% from $37.3 million in the corresponding period of 2019, mainly due to the increase in staff related costs.

Operating Income from Continuing Operations

Operating income from continuing operations was $6.9 million in the first half year of 2020, a decrease of 62.3% from $18.3 million in the corresponding period of 2019, mainly due to the increase in operating expenses.

Change in Fair Value of Securities

Change in fair value of securities for the first half year of 2020 was a loss of $43.3 million, compared to a loss of $16.5 million in the corresponding period of 2019, mainly due to the fluctuation in market price of investments in equity securities.

Income Tax Benefits

Income tax benefits were $19.5 million in the first half year of 2020, an increase of 116.7% from $9.0 million in the corresponding period of 2019.

Net Income (Loss)

Net loss was $19.4 million in the first half year of 2020, compared to a net income of $18.5 million in the corresponding period of 2019.

Business Outlook

Based on current operations and market conditions, Fang’s management predicts a positive net income for the year of 2020, which represents management’s current and preliminary view and is subject to change.

Conference Call Information

Fang’s management team will host a conference call on the same day at 8:00 AM U.S. EST (8:00 PM Beijing/Hong Kong time). The dial-in details for the live conference call are:

International Toll:

+65 67135600

Toll-Free/Local Toll:


United States

+1 877-440-9253 / +1 631-460-7472

Hong Kong

+852 800-906-603 / +852 3018-6773

Mainland China

+86 800-870-0075 / +86 400-120-0948

Direct Event Passcode

1383200#

Please register in advance of the conference using the link provided below. Upon registering, you will be provided with participant dial-in numbers, Direct Event passcode (1578624#) and unique registrant ID. Get prompted 10 min prior to the start of the conference. Enter the Direct Event Passcode above (1578624#), and your unique Registrant ID, followed by the pound or hash (#) sign to get into the call.

Direct Event online registration: http://apac.directeventreg.com/registration/event/6379533  

A telephone replay of the call will be available after the conclusion of the conference call from 11:00 AM ET on August 14, 2020 through 9:59 AM ET August 22, 2020. The dial-in details for the telephone replay are:

International Toll:

+61 2-8199-0299

Toll-Free/Local Toll:


United States

+1 855-452-5696 / +1 646-254-3697

Hong Kong

+852 800-963-117 / +852 3051-2780

Mainland China

+86 400-602-2065 / +86 800-870-0206

Conference ID:

3548478

A live and archived webcast of the conference call will be available on Fang’s website at http://ir.fang.com.

About Fang

Fang operates a leading real estate Internet portal in China in terms of the number of page views and visitors to its websites. Through its websites, Fang provides primarily marketing, listing, leads generation and financial services for China’s fast-growing real estate and home furnishing and improvement sectors. Its user-friendly websites support active online communities and networks of users seeking information on, and other value-added services for, the real estate and home furnishing and improvement sectors in China. Fang currently maintains approximately 74 offices to focus on local market needs and its website and database contains real estate related content covering 665 cities in China. For more information about Fang, please visit http://ir.fang.com.

Safe Harbor Statements

This press release contains forward-looking statements within the meaning of Section 27A of the Securities Act of 1933, as amended, and Section 21E of the Securities Exchange Act of 1934, as amended. Such forward-looking statements are made under the “safe harbor” provisions of the U.S. Private Securities Litigation Reform Act of 1995.

These forward-looking statements can be identified by terminology such as “will,” “expects,” “is expected to,” “anticipates,” “aim,” “future,” “intends,” “plans,” “believes,” “are likely to,” “estimates,” “may,” “should” and similar expressions, and include, without limitation, statements regarding Fang’s future financial performance, revenue guidance, growth and growth rates, market position and continued business transformation. Such statements are based upon management’s current expectations and current market and operating conditions, and relate to events that involve known or unknown risks, uncertainties and other factors, all of which are difficult to predict and many of which are beyond Fang’s control, which may cause its actual results, performance or achievements to differ materially from those in the forward-looking statements. Potential risks and uncertainties include, without limitation, the impact of Fang’s business development strategies, the impact of the COVID-19 pandemic, and the impact of current and future government policies affecting China’s real estate market. Further information regarding these and other risks, uncertainties or factors is included in Fang’s filings with the U.S. Securities and Exchange Commission. Fang does not undertake any obligation to update any forward-looking statement as a result of new information, future events or otherwise, except as required under law.


Fang Holdings Limited

Unaudited Condensed Consolidated Balance Sheets[i]

(in thousands of U.S. dollars, except share data and per share data)


ASSETS

June 30,

December 31,


2020

2019


Current assets:


Cash and cash equivalents

85,461

105,282


Restricted cash, current

217,259

219,096


Short-term investments

148,382

194,720


Accounts receivable, net

87,885

66,379


Funds receivable

4,092

8,372


Prepayment and other current assets

32,834

31,509


Commitment deposits

185

188


Loans receivable, current

58,979

60,490


Amounts due from related parties

1,350

644


Total current assets 

636,427

686,680


Non-current assets:


Property and equipment, net

676,564

695,457


Loans receivable, non-current


Deferred tax assets

13,220

6,570


Deposits for non-current assets

482

618


Restricted cash, non-current portion

40,917

42,452


Long-term investments

325,863

341,946


Other non-current assets

36,975

39,179


Total non-current assets

1,094,021

1,126,222


Total assets

1,730,448

1,812,902


LIABILITIES AND SHAREHOLDERS’ EQUITY


Current liabilities:


Short-term loans

361,220

367,403


Deferred revenue

130,083

134,143


Accrued expenses and other liabilities

100,695

120,244


Customers’ refundable fees

3,703

4,981


Income tax payable

11,675

4,207


Amounts due to related parties

10,048

9,227


Total current liabilities

617,424

640,205


Non-current liabilities:


Long-term loans

178,365

184,158


Convertible senior notes

168,614

168,929


Deferred tax liabilities

92,080

90,723


Other non-current liabilities

107,217

138,435


Total non-current liabilities

546,276

582,245


Total Liabilities  

1,163,700

1,222,450


Equity:


Class A ordinary shares, par value Hong Kong Dollar (“HK$”) 1 per share,
600,000,000 shares authorized for Class A and Class B in aggregate, issued
shares as of December 31, 2019 and June 30, 2020: 71,775,686 and    

71,775,686; outstanding shares as of December 31, 2019 and June 30, 2020: 
65,403,527 and 65,403,527

9,244

9,244


Class B ordinary shares, par value HK$1 per share, 600,000,000 s
hares authorized for Class A and Class B in aggregate, and 24,336,650 shares and
24,336,650 shares issued and outstanding as at December 31, 2019 and
June 30, 2020, respectively

3,124

3,124


Treasury stock

(123,216)

(123,216)


Additional paid-in capital

536,352

528,620


Accumulated other comprehensive loss

(110,381)

(98,371)


Retained earnings

250,931

270,358


Total Fang Holdings Limited shareholders’ equity

566,054

589,759


Non controlling interests

694

693


Total equity

566,748

590,452


TOTAL LIABILITIES AND EQUITY

1,730,448

1,812,902


[i] Impact of the Separation of China Index Holdings Ltd (NASDAQ: CIH) (“CIH”) on the Company’s
Financial Statements:
The separation of CIH represents a strategic shift of Fang and has a major effect
on Fang’s results of operations, the business operated by CIH has been reclassified as discontinued
operations. For the periods presented in this press release, the results of the discontinued operations,
less applicable income taxes, are reported as a separate component of income, which is income from
discontinued operations, on the consolidated statements of comprehensive income (loss)


Unaudited Condensed Consolidated Statements of Comprehensive Income[ii]

(in thousands of U.S. dollars, except share data and per share data)


Three months ended

Six months ended


June 30,


June 30,

June 30,

June 30,


2020


2019

2020

2019


Revenues:


Marketing services

32,072


32,465

47,208

45,728


Listing services

14,197


19,212

24,413

31,371


Leads generation services

17,288


10,801

24,806

14,787


Value-added services

1,525


1,665

2,941

2,667


Financial services

1,557


2,926

3,283

6,425


E-commerce services

206


779

315

1,860


Total revenues

66,845


67,848

102,966

102,838


Cost of revenues:


Cost of services

(3,603)


(8,254)

(9,010)

(16,692)


Total cost of revenues

(3,603)


(8,254)

(9,010)

(16,692)


Gross profit

63,242


59,594

93,956

86,146


Operating expenses and income:


Selling expenses

(14,889)


(16,137)

(28,450)

(32,456)


General and administrative expenses

(41,268)


(14,900)

(59,824)

(37,293)


Other (expense) income

(691)


1,508

1,223

1,895


Operating income from continuing operations

6,394


30,065

6,905

18,292


Foreign exchange (loss) gain

(248)


(371)

1,468

(633)


Interest income

2,198


1,630

6,121

3,319


Interest expense

(3,806)


(5,696)

(12,267)

(11,741)


Investment income, net

516


485

1,338

490


Realized gain on sale of available-for-sale
securities


573

871


Change in fair value of securities

(692)


(48,513)

(43,326)

(16,464)


Government grants

441


465

810

700


Income (Loss) before income taxes and
noncontrolling interests from continuing
operations


4,803


(21,362)


(38,951)


(5,166)


Income tax benefits


Income tax benefits

16,675


20,127

19,525

9,008


Net income (loss) from continuing operations,
net of income taxes


21,478


(1,235)


(19,426)


3,842


Income from discontinued operations, net of income
taxes


6,349

14,672


Net income (loss)

21,478


5,114

(19,426)

18,514


Net loss attributable to noncontrolling interests

1


1


Net income (loss) attributable to Fang Holdings
Limited shareholders


21,477


5,114


(19,427)


18,514


Earnings /(loss) per share for Class A and Class B ordinary shares:


Basic

0.24


0.06

(0.22)

0.21


Diluted

0.24


0.06

(0.22)

0.20


Earnings /(loss) from continuing operations per share for Class A and Class B ordinary shares:


Basic


(0.01)


0.04


Diluted


(0.01)


0.04


Earnings from discontinued operations per share for Class A and Class B ordinary shares:


Basic


0.07


0.16


Diluted


0.07


0.16


[ii] On June 19, 2020, a ratio change that had the same effect as a 1-for-10 reverse ADS split took effect,
and as a result, one ADS currently represents ten Class A ordinary shares.


Related Links :

http://www.fang.com

Huobi Records $877.8 Billion in Trading Volume for First Half of 2020

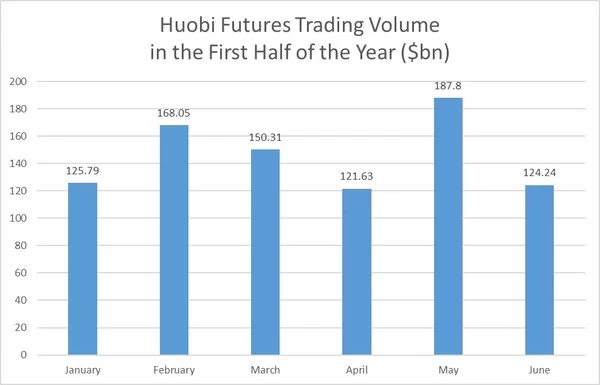
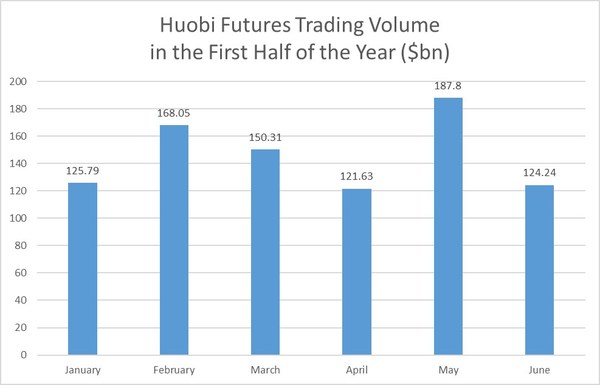
LONDON, Aug. 14, 2020 — Despite 2020 being a difficult year across the planet due to the coronavirus pandemic, the cryptocurrency trading space on Huobi has remained strong and resilient. New information from Huobi global has seen that $877.8 billion has been traded on the platform in the last six months. 

Interestingly, Q1, which was a good quarter for the cryptocurrency space, has been similarly matched by Q2 on Huobi despite Q2 being impacted by a major Bitcoin market collapse. 

For Q1, the unilateral trading volume was $444.2 billion while Q2 was $433.7 billion. Even though Q2 was characterized by the market drop and then sideways trading, the transaction volume saw no real decline to speak of. 


Next let’s analyze Huobi’s performance from perpetual swaps trading and futures trading respectively.

Perpetual Swaps

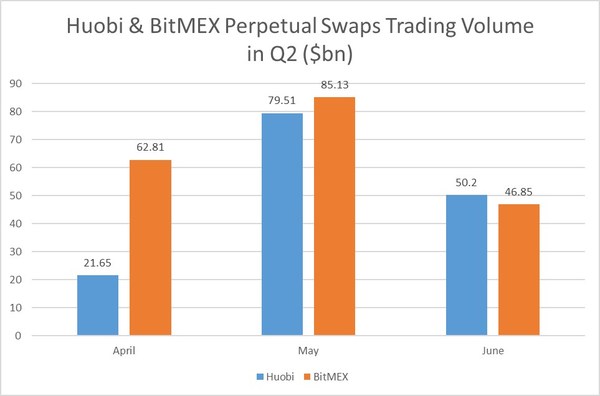
Huobi only recently launched its own perpetual swap product, but it has been an instant success, keeping up with, and sometimes outperforming BitMEX, one of the leaders in the space.

In its first full quarter, Huobi’s perpetual swap trading volume came in at $21.65 billion in April, but rocketed up to $79.5 billion the next month, falling just short of BitMEX’s trading volume. Then, in June, Huobi overtook BitMEX with a total of $50.2 billion.


Coin-margined Futures

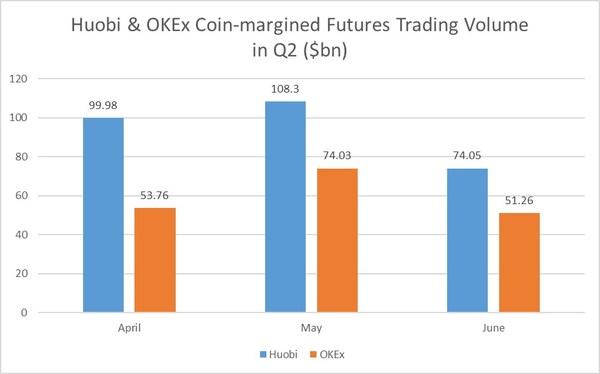
Huobi has managed to push new boundaries against other well established exchanges when it comes to futures trading volume as the coin-margined futures trading volume for the last three months has been better on Huobi than OKEx.

April saw nearly a hundred billion dollars traded on these futures contracts at Huobi while May managed to cross into the hundred-billion-dollar range. June dropped back a bit as $74.05 billion was traded, but all three of these months outperformed OKEx.


First let’s compare the two exchanges from their trading performance of main token BTC.

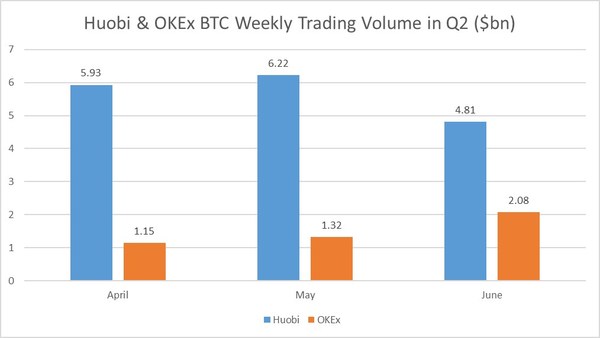
Huobi has far outperformed OKEx in BTC Weekly contracts trading in Q1 as through April, May and June Huobi more than doubled the trading volume against its competitor. 


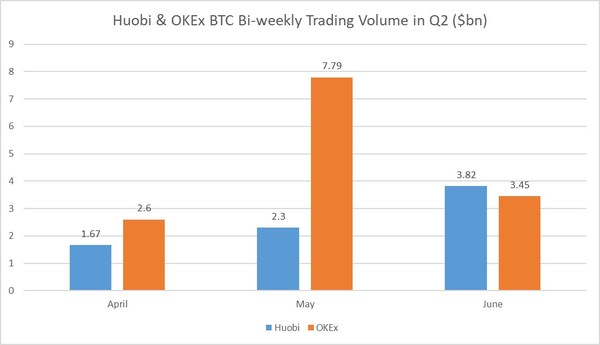
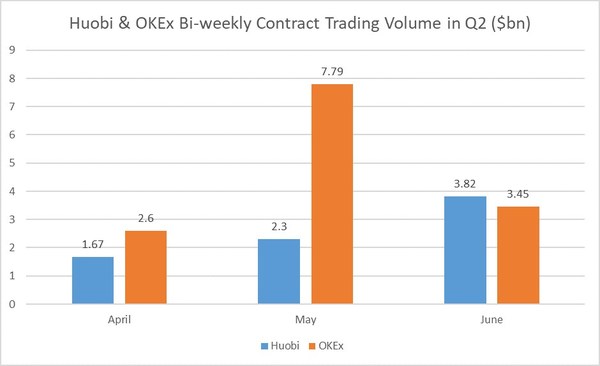
For Bi-weekly contracts trading, Huobi did not register as much trading against OKEx, but in June the exchange did manage to overtake its competitor after OKEx had a successful May.


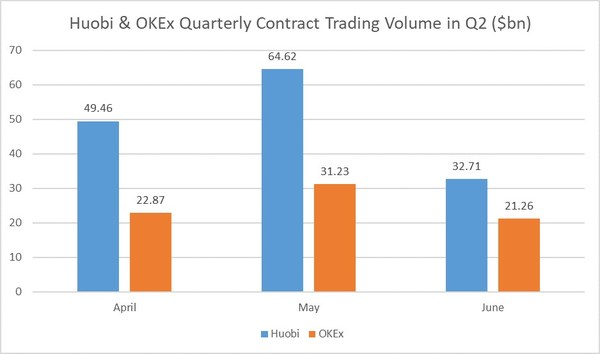
From below chart we can see obviously that Huobi was very successful with its BTC Quarterly contract trading volume across April, May and June, and outperformed OKEx in all three of these months. In April and May, Huobi doubled the volume at OKEx, and in June it was a little closer, but Huobi still came out with more trading. 


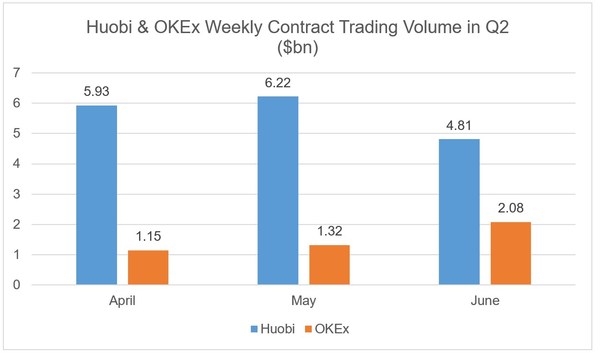
Second let’s see their performance from total trading volume of contracts in different types.

Weekly contacts trading was another area that Huobi managed to thrive in as it registered on average more than $5 billion across April, May and June. Meanwhile, OKEx only managed to get above $2.08 billion in June.


While for bi-weekly contracts trading it was OKEx that came out on top for the majority of the quarter in regards to trading volume, but Huobi finished the quarter strong with $3.82 billion in trading in June against OKEx’s $3.45 billion.


When it comes to quarterly contacts, Huobi was again at the top in terms of volume as in April and May the exchange managed to register more than double the trading volume of OKEx for these contracts. Only in June was that level taken down a bit but Huobi still had $32.7 billion in transactions more. 


Third we can analyze from the perspective of market depth and slippage.

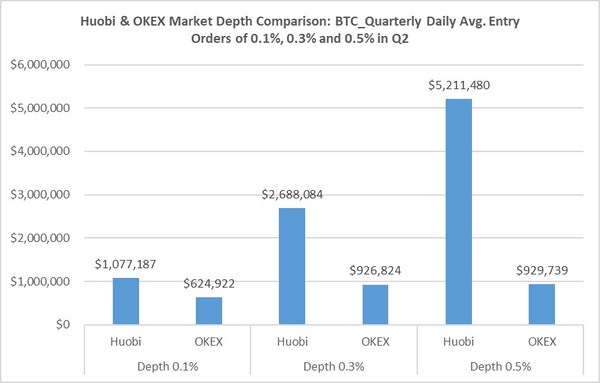
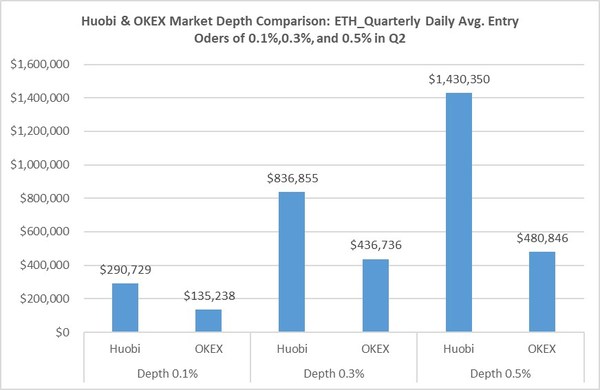
Relying on the trading volume is not sufficient for understanding a market’s liquidity, therefore it’s important to have an idea of a market’s depth before trading. Market depth is broadly defined as the market’s ability to sustain relatively large market orders without impacting the price of the asset.

Market depth considers the overall level and breadth of open orders and is calculated from the number of buy and sell orders at various price levels on each side of the mid-price. Let’s take Quarterly contract as an example, as we can see from below charts, the performance of Huobi’s market depth is much better than OKEx for both TOP 2 token BTC and ETH.


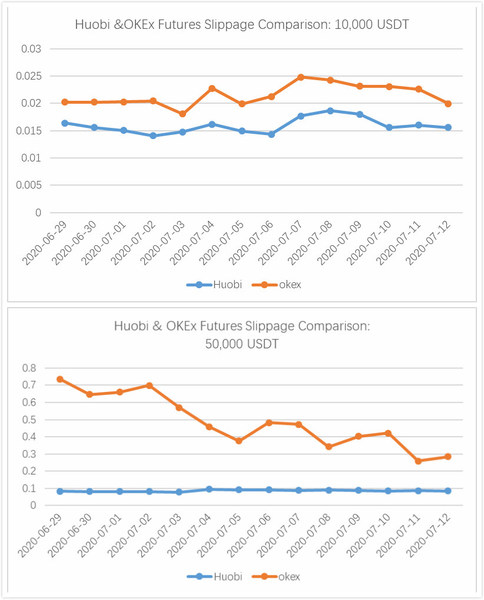
Another key metric in terms of exchanges is how much slippage there is in these futures contract trading. Slippage refers to the difference between the expected price of a trade and the price at which the trade is executed.

Slippage can occur at any time but is most prevalent during periods of higher volatility when market orders are used. Huobi has shown it has some of the lowest slippage rates, and this can be seen in comparison to OKEx in regards to 10,000 UDT and 50,000 USDT.


A good market depth indicates that Huobi Futures will barely have situations like flash crash in the future. Moreover, sound market depth and small slippage can help orders be filled instantly, so as to reduce users’ trading costs and provide users with excellent trading experience.