ATIF Holdings Limited Regains Compliance with NASDAQ Listing Requirements

SHENZHEN, China, Aug. 28, 2020 — ATIF Holdings Limited (Nasdaq: ATIF, the "Company"), a company providing business consulting services and multimedia services in Asia, today announced that on August 26, 2020, it received a written notice (the "Notice") from the Listing Qualifications Department of The Nasdaq Stock Market ("Nasdaq") that the Company has regained compliance with the Nasdaq’s Listing Rules (the "Rules") regarding the annual meeting of shareholders requirement for continued listing on the Nasdaq Capital Market.

The Company was previously notified by Nasdaq on August 4, 2020 that it was not in compliance with the annual meeting requirement for continued listing on The Nasdaq Capital Market as a result of not having held an annual meeting of stockholders within 12 months of the end of the Company’s fiscal year on July 31, 2020. On August 13, 2020, the Company submitted to Nasdaq its intention to follow home country practice in accordance with Listing Rule 5615(a)(3) and in lieu of Nasdaq’s annual meeting requirement. Accordingly, the Company’s ordinary shares will continue to be listed on The Nasdaq Capital Market and Nasdaq considers the matter closed.

About ATIF Holdings Limited

Headquartered in Shenzhen, China, ATIF Holdings Limited ("ATIF") is a company providing business consulting services to small and medium-sized enterprises in Asia, including going public consulting services, international business planning and consulting services, and financial media services. ATIF has advised several enterprises in China in their plans to become publicly listed in the U.S. Through its majority-owned subsidiary, Leaping Group Co., Ltd., ATIF also provides multimedia services and is engaged in three major businesses, including multi-channel advertising, event planning and execution, film and TV program production and movie theater operations. ATIF operates the largest pre-movie advertising network in Heilongjiang Province and Liaoning Province of China and also provides advertising services in elevators and supermarkets. ATIF is often hired to plan both online and offline advertising campaigns and to produce related advertising material. In addition, ATIF invests in films and TV programs and distributes them in movie theaters or through online platforms. ATIF is also one of majority shareholders of AeroCentury Corp. (NYSE American: ACY) which is an independent global aircraft operating lessor and finance company specializing in leasing regional jet and turboprop aircraft and related engines to airlines and commercial users worldwide. For more information, please visit https://ir.atifchina.com/.

Forward-Looking Statements

Certain statements made in this release are "forward looking statements" within the meaning of the "safe harbor" provisions of the United States Private Securities Litigation Reform Act of 1995. When used in this press release, the words "estimates," "projected," "expects," "anticipates," "forecasts," "plans," "intends," "believes," "seeks," "may," "will," "should," "future," "propose" and variations of these words or similar expressions (or the negative versions of such words or expressions) are intended to identify forward-looking statements. These forward-looking statements are not guarantee of future performance, conditions or results, and involve a number of known and unknown risks, uncertainties, assumptions and other important factors, many of which are outside the Company’s control, that could cause actual results or outcomes to differ materially from those discussed in the forward-looking statements. Important factors, among others, are: future financial and operating results, including revenues, income, expenditures, cash balances and other financial items; ability to manage growth and expansion; current and future economic and political conditions; ability to compete in an industry with low barriers to entry; ability to continue to operate through our VIE structure; ability to obtain additional financing in the future to fund capital expenditures; ability to attract new clients and further enhance brand recognition; ability to hire and retain qualified management personnel and key employees; trends and competition in the financial consulting services industry; a pandemic or epidemic; and other factors listed in the Company’s annual report on Form 20-F and other documents filed with the Securities and Exchange Commission. The Company undertakes no obligation to update forward-looking statements to reflect subsequent occurring events or circumstances, or changes in its expectations, except as may be required by law. Although the Company believes that the expectations expressed in these forward-looking statements are reasonable, it cannot assure you that such expectations will turn out to be correct, and the Company cautions you that actual results may differ materially from the anticipated results expressed or implied by the forward-looking statements we make. You should not rely upon forward-looking statements as predictions of future events. Forward-looking statements represent our management’s beliefs and assumptions only as of the date such statements are made. These forward-looking statements are made as of the date of this news release.

For more information, please contact Investor Relations at:
EverGreen Consulting Inc.
Janice Wang
+86-13811768559
+1-908-510-2351
IR@changqingconsulting.com

Related Links :

http://ir.atifchina.com/

Yiren Digital Reports Second Quarter 2020 Financial Results

BEIJING, Aug. 28, 2020 — Yiren Digital Ltd. (NYSE: YRD) ("Yiren Digital" or the "Company"), a leading fintech company in China, today announced its unaudited financial results for the second quarter ended June 30, 2020.

Second Quarter 2020 Operational Highlights

Wealth Management—Yiren Wealth

  • Cumulative number of investors served reached 2,223,250 as of June 30, 2020, representing an increase of 0.2% from 2,218,181 as of March 31, 2020 and compared to 2,185,513 as of June 30, 2019.
  • Number of current investors was 195,211 as of June 30, 2020, representing a decrease of 11.5% from 220,568 as of March 31, 2020.
  • Number of current non-P2P investors was 31,530 as of June 30, 2020, representing an increase of 19.7% from 26,346 as of March 31, 2020, and compared to 17,133 as of June 30, 2019.
  • Total assets under administration ("AUA") for P2P products on Yiren Wealth was RMB 25,896.8 million (US$3,665.4 million) as of June 30, 2020, representing a decrease of 15.2% from RMB 30,536.4 million as of March 31, 2020, and compared to RMB 43,249.9 million as of June 30, 2019.
  • Total AUA for non-P2P products on Yiren Wealth was RMB 2,528.6 million (US$357.9 million) as of June 30, 2020, representing an increase of 47.6% from 1,713.1 million as of March 31, 2020,and compared to RMB 352.7 million as of June 30, 2019.
  • Sales volume of non-P2P products amounted to RMB 2,186.2 million (US$309.4 million) in the second quarter of 2020, representing an increase of 1.1% from RMB 2,163.3 million in the first quarter of 2020 and compared to RMB 284.8 million in the same period of 2019.

Consumer Credit—Yiren Credit

  • Total loan originations in the second quarter of 2020 reached RMB 2.4 billion (US$0.3 billion), representing an increase of 30.6% from RMB 1.8 billion in the first quarter of 2020 and compared to RMB 9.7 billion in the second quarter of 2019.
  • Cumulative number of borrowers served reached 4,917,635 as of June 30, 2020, representing an increase of 2.2% from 4,810,184 as of March 31, 2020 and compared to 4,491,334 as of June 30, 2019.
  • Number of borrowers served in the second quarter of 2020 was 107,568 representing a decrease of 6.8% from 115,420 in the first quarter of 2020 and compared to 135,246 in the second quarter of 2019.
  • The percentage of loan volume generated by repeat borrowers was 0.3% in the second quarter of 2020.
  • 25.0% of loan originations were generated online in the second quarter of 2020.
  • Total outstanding principal balance of performing loans reached RMB 33,454.4 million (US$4,735.2 million) as of June 30,2020, representing a decrease of 20.5% from RMB 42,063.0 million as of March 31,2020.

"With the pandemic still not far behind us and the changing market environment in the second quarter, we are making comprehensive progresses towards our business transition in our credit-tech business and have achieved meaningful scale in our wealth management business growth," said Mr. Ning Tang, Chairman and Chief Executive Officer of Yiren Digital.

"For our credit-tech business, our new online product initiatives are tracking very well. Our new revolving loan product, Yi Xiang Hua, accounted for 13% of our total loan volume this quarter, growing over 500% quarter over quarter. Meanwhile, by leveraging our vast offline service network coverage, we are ramping up auto loans nicely, achieving a 51% growth from last quarter. Moreover, we have made great strides in repositioning our credit business by moving from a P2P funding model to a loan facilitation model. In the second quarter, 63% of loans facilitated were funded by institutional intuitional partners and we expect this proportion to reach close to 100% by the end of this year with a diversified partner base."

"On wealth management business, we are seeing very strong growth momentum particularly for our fund products. As of June 30, 2020, the number of current non-P2P investors increased 20% from last quarter to 31,530, and total AUA for non-P2P products increased by 48% quarterly to RMB 2.5 billion. Moreover, average AUA per investor for non-P2P products also sees steady growth, with average AUA per investor for bank’s fixed-income products exceeding RMB 100,000 and for funds over RMB 50,000, which is well above industry average"

"We are delighted to see a notable acceleration in loan originations from prior quarter to RMB 2.4 billion, thanks to our strategic initiatives this year in diversification of our loan products," said Mr. Zhong Bi, Chief Financial Officer of Yiren Digital. "To provide relief to our borrowers who were significantly affected by the pandemic as well as medical workers who fought on the frontlines, we proactively granted a concession totaling RMB 245 million for over 50,000 borrowers in principal, interest and late fees, this represents a one-time hit to our revenue. On the balance sheet side, our cash position remains strong with approximately RMB 3.4 billion of cash and short-term investments as of June 30, 2020. "

"Thanks to our continued efforts in risk management, the delinquency rates have shown a progressive improving trend. 15-90 days delinquency has decreased to 5.5% as of June 30, 2020 from 8.9% as of March 31, 2020. 15-90 days delinquency further decreased to 5.2% as of July 31, 2020 as a result of our strengthened efforts in tightening controls and improving borrower’s credit quality." said Mr. Michael Ji, Chief Risk Officer of Yiren Digital. "To mitigate the risk caused by covid-19 and help customers went through the financial hardship, we have launched 7 relating special collection projects in the second quarter, including continued ‘pandemic customer care program’, which offered payment relief for the customers who were hit by covid-19 and healthcare givers who were fighting the disease. These special collection projects helped us achieve a decline in NCL by over 10% as compared with projection at the beginning of the year, even facing the economic headwind. We will continue to strengthen our risk management and expect delinquency rates to further improve in the second half of the year.

Second Quarter 2020 Financial Results

Total amount of loans facilitated in the second quarter of 2020 was RMB 2,402.5 million (US$340.1 million), compared to RMB 9,673.8 million in the same period last year. As of June 30, 2020, the total outstanding principal amount of the performing loans was RMB 33.5 billion (US$4.7 billion), decreased by 20% from RMB 42.1 billion as of March 31, 2020.

Total net revenue in the second quarter of 2020 was RMB 754.7 million (US$106.8 million), compared to RMB 2,216.6 million in the same period last year. Revenue from Yiren Credit reached RMB 432.3 million (US$61.2 million), representing a decrease of 73% from RMB 1,624.3 million in the second quarter of 2019. Revenue from Yiren Wealth reached RMB 322.4 million (US$45.6 million), representing a decrease of 46% from RMB 592.4 million in the second quarter of 2019.

Sales and marketing expenses in the second quarter of 2020 were RMB 508.5 million (US$72.0 million), compared to RMB 1,208.6 million in the same period last year. Sales and marketing expenses in the second quarter of 2020 accounted for 21.2% of the total amount of loans facilitated, as compared to 12.5% in the same period last year mainly due to the decline of loan volume.

Origination and servicing costs in the second quarter of 2020 were RMB 165.2 million (US$23.4 million), compared to RMB 162.9 million in the same period last year. Origination and servicing costs in the second quarter of 2020 accounted for 6.9% of the total amount of loans facilitated, compared to 1.7% in the same period last year due to the decline of loan volume.

General and administrative expenses in the second quarter of 2020 were RMB 172.6 million (US$24.4 million), compared to RMB 175.5 million in the same period last year. General and administrative expenses in the second quarter of 2020 accounted for 22.9% of the total net revenue, compared to 7.9% in the same period last year.

Allowance for contract assets and receivables in the second quarter of 2020 were RMB 168.7 million (US$23.9 million), compared to RMB 500.9 million in the same period last year.

Income tax benefit in the second quarter of 2020 was RMB 47.6 million (US$6.7 million).

Net loss in the second quarter of 2020 was RMB 232.2 million (US$32.9 million), compared to net income of RMB 154.5 million in the same period last year. 

Adjusted EBITDA (non-GAAP) in the second quarter of 2020 was net loss of RMB 269.4 million (US$38.1 million), compared to net income of RMB 239.9 million in the same period last year.

Basic income per ADS in the second quarter of 2020 was net loss of RMB 2.5 (US$0.4), compared to a basic income per ADS of RMB 1.7 in the same period last year.

Diluted income per ADS in the second quarter of 2020 was net loss of RMB 2.5 (US$0.4), compared to a diluted income per ADS of RMB 1.7 in the same period last year.

Net cash used in operating activities in the second quarter of 2020 was RMB 86.8 million (US$12.3 million), compared to net cash generated from operating activities of RMB 36.4 million in the same period last year.

Net cash used in investing activities in the second quarter of 2020 was RMB 164.6 million (US$23.3 million), compared to net cash provided by investing activities of RMB 240.9 million in the same period last year.

As of June 30, 2020, cash and cash equivalents was RMB 2,935.5 million (US$415.5 million), compared to RMB 3,195.0 million as of March 31, 2020. As of June 30, 2020, the balance of held-to-maturity investments was RMB 4.1 million (US$0.6 million), compared to RMB 4.4 million as of March 31, 2020. As of June 30, 2020, the balance of available-for-sale investments was RMB 513.0 million (US$72.6 million), compared to RMB 456.1 million as of March 31, 2020.

Delinquency rates. As of June 30, 2020, the delinquency rates for loans that are past due for 15-29 days, 30-59 days and 60-89 days were 1.4%, 2.0%, and 2.1%, respectively compared to1.6%, 4.1%, and 3.2%, as of March 31, 2020. 

Cumulative M3+ net chargeoff rates. As of June 30, 2020, the cumulative M3+ net charge-off rate for loans originated in 2017 was 16.7%, compared to 16.5% as of March 31, 2020. As of June 30, 2020, the cumulative M3+ net charge-off rate for loans originated in 2018 was 17.6%, compared to 15.8% as of March 31, 2020. As of June 30, 2020, the cumulative M3+ net charge-off rate for loans originated in 2019 was 9.4%, compared to 5.2% as of March 31, 2020.

Recent Development

Management Change

Mr. Zhong Bi has resigned from his position as the Company’s Chief Financial Officer ("CFO") to pursue other opportunities, effective on September 10, 2020. The board of directors of the Company has appointed Ms. Na Mei as the Company’s new CFO, effective on September 10, 2020. Over the past two months, Ms. Mei has been working with Mr. Bi on daily CFO duties to ensure a smooth transition.

Ms. Mei joined CreditEase Consumer Credit Division, now part of Yiren Digital, in 2015. She has served as the financial controller for this business unit and the head of business finance department. Prior to joining CreditEase, Ms. Mei had worked 12 years at PricewaterhouseCoopers. She brought in seasoned experience in finance management, taxation, internal control and consulting, along with years of first-hand exposure dealing with publicly listed companies in China and abroad. Ms. Mei obtained her bachelor’s degree from Capital Economic University and is a certified public accountant.

2020 Share Incentive Plan

Yiren Digital adopted a 2020 share incentive plan (the "2020 Plan") in the second quarter of 2020. The 2020 Plan has a ten-year term, and has a maximum number of 18,560,000 ordinary shares available for issuance pursuant to all awards under the 2020 Plan. Yiren Digital may grant restricted share units and other form of awards pursuant to the 2020 Plan. In connection with the adoption of the 2020 Plan and to prevent dilution to existing shareholders, CreditEase Holdings (Cayman) Limited, the parent company of Yiren Digital, will surrender for cancellation and for nil consideration 18,560,000 ordinary shares of US$0.0001 par value each standing in its name in the register of members of Yiren Digital.

Non-GAAP Financial Measures

In evaluating the business, the Company considers and uses several non-GAAP financial measures, such as adjusted EBITDA and adjusted EBITDA margin as supplemental measures to review and assess operating performance. We believe these non-GAAP measures provide useful information about our core operating results, enhance the overall understanding of our past performance and prospects and allow for greater visibility with respect to key metrics used by our management in our financial and operational decision-making. The presentation of these non-GAAP financial measures is not intended to be considered in isolation or as a substitute for the financial information prepared and presented in accordance with accounting principles generally accepted in the United States of America ("U.S. GAAP"). The non-GAAP financial measures have limitations as analytical tools. Other companies, including peer companies in the industry, may calculate these non-GAAP measures differently, which may reduce their usefulness as a comparative measure. The Company compensates for these limitations by reconciling the non-GAAP financial measures to the nearest U.S. GAAP performance measure, all of which should be considered when evaluating our performance. See "Operating Highlights and Reconciliation of GAAP to Non-GAAP measures" at the end of this press release.

Currency Conversion

This announcement contains currency conversions of certain RMB amounts into US$ at specified rates solely for the convenience of the reader. Unless otherwise noted, all translations from RMB to US$ are made at a rate of RMB 7.0651 to US$1.00, the effective noon buying rate on June 30, 2020, as set forth in the H.10 statistical release of the Federal Reserve Board.

Conference Call

Yiren Digital’s management will host an earnings conference call at 8:00 p.m. U.S. Eastern Time on August 27, 2020 (or 8:00 a.m. Beijing/Hong Kong Time on August 28, 2020).

Participants who wish to join the call should register online in advance of the conference at:

http://apac.directeventreg.com/registration/event/9992747

Please note the Conference ID number of 9992747.

Once registration is completed, participants will receive the dial-in information for the conference call, an event passcode, and a unique registrant ID number. 

Participants joining the conference call should dial-in at least 10 minutes before the scheduled start time.

A replay of the conference call may be accessed by phone at the following numbers until September 3, 2020:

International

+61 2-8199-0299

U.S.

+1 646-254-3697

Replay Access Code:

9992747

Additionally, a live and archived webcast of the conference call will be available at ir.yirendai.com.

Safe Harbor Statement

This press release contains forward-looking statements. These statements constitute "forward-looking" statements within the meaning of Section 21E of the Securities Exchange Act of 1934, as amended, and as defined in the U.S. Private Securities Litigation Reform Act of 1995. These forward-looking statements can be identified by terminology such as "will," "expects," "anticipates," "future," "intends," "plans," "believes," "estimates," "target," "confident" and similar statements. Such statements are based upon management’s current expectations and current market and operating conditions and relate to events that involve known or unknown risks, uncertainties and other factors, all of which are difficult to predict and many of which are beyond Yiren Digital’s control. Forward-looking statements involve risks, uncertainties, and other factors that could cause actual results to differ materially from those contained in any such statements. Potential risks and uncertainties include, but are not limited to, uncertainties as to Yiren Digital’s ability to attract and retain borrowers and investors on its marketplace, its ability to introduce new loan products and platform enhancements, its ability to compete effectively, PRC regulations and policies relating to the peer-to-peer lending service industry in China, general economic conditions in China, and Yiren Digital’s ability to meet the standards necessary to maintain listing of its ADSs on the NYSE or other stock exchange, including its ability to cure any non-compliance with the NYSE’s continued listing criteria. Further information regarding these and other risks, uncertainties or factors is included in Yiren Digital’s filings with the U.S. Securities and Exchange Commission. All information provided in this press release is as of the date of this press release, and Yiren Digital does not undertake any obligation to update any forward-looking statement as a result of new information, future events or otherwise, except as required under applicable law.

About Yiren Digital

Yiren Digital Ltd. (NYSE: YRD) is a leading fintech company in China, providing both credit and wealth management services. For its credit business, the Company provides an effective solution to address largely underserved investor and individual borrower demand in China through online and offline channels to efficiently match borrowers with investors and execute loan transactions. Yiren Digital deploys a proprietary risk management system, which enables the Company to effectively assess the creditworthiness of borrowers, appropriately price the risks associated with borrowers, and offer quality loan investment opportunities to investors. Yiren Digital’s marketplace provides borrowers with quick and convenient access to consumer credit at competitive prices and investors with easy and quick access to an alternative asset class with attractive returns. For its wealth management business, the Company targets China’s mass affluent population and strives to provide customized wealth management services, with a combination of long-term and short-term targets as well as different types of investments, ranging from cash and fixed-income assets, to funds and insurance. For more information, please visit ir.Yirendai.com.


Unaudited Condensed Consolidated Statements of Operations

 (in thousands, except for share, per share and per ADS data, and percentages)

For the Three Months Ended 

For the Six Months Ended 

June 30,
2019

March 31,
2020

June 30,
2020

June 30,
2020

June 30,
2019

June 30,
2020

June 30,
2020

RMB

RMB

RMB

USD

RMB

RMB

USD

Net revenue:

Loan facilitation services

1,237,718

358,541

171,084

24,215

2,292,764

529,625

74,964

Post-origination services

241,321

146,520

126,477

17,902

537,600

272,997

38,640

Account management services

549,024

413,166

300,720

42,564

1,037,364

713,886

101,044

Others

188,577

105,433

156,408

22,138

329,320

261,841

37,061

Total net revenue

2,216,640

1,023,660

754,689

106,819

4,197,048

1,778,349

251,709

Operating costs and expenses:

Sales and marketing

1,208,647

616,441

508,466

71,969

2,336,592

1,124,907

159,220

Origination and servicing

162,945

102,918

165,183

23,380

335,068

268,101

37,947

General and administrative

175,534

149,041

172,568

24,425

433,241

321,609

45,521

Allowance for contract assets and
receivables

500,861

143,385

168,708

23,879

691,965

312,093

44,174

Total operating costs and expenses

2,047,987

1,011,785

1,014,925

143,653

3,796,866

2,026,710

286,862

Other income/(expenses):

Interest income, net

25,213

25,116

16,950

2,399

49,088

42,066

5,954

Fair value adjustments related to
Consolidated ABFE

5,787

(26,020)

(32,957)

(4,665)

40,785

(58,977)

(8,348)

Others, net

17,480

12,184

(3,510)

(496)

177,703

8,674

1,228

Total other income/(expenses)

48,480

11,280

(19,517)

(2,762)

267,576

(8,237)

(1,166)

Income/(loss) before provision for
income taxes

217,133

23,155

(279,753)

(39,596)

667,758

(256,598)

(36,319)

Share of results of equity investees

(816)

(5,773)

Income tax expense/(benefit)

61,856

3,936

(47,558)

(6,731)

138,390

(43,622)

(6,174)

Net income/(loss)

154,461

19,219

(232,195)

(32,865)

523,595

(212,976)

(30,145)

Weighted average number of ordinary
shares outstanding, basic

184,608,337

185,600,961

185,613,735

185,613,735

184,865,964

185,607,348

185,607,348

Basic income/(loss) per share

0.8367

0.1036

(1.2510)

(0.1771)

2.8323

(1.1475)

(0.1624)

Basic income/(loss) per ADS

1.6734

0.2072

(2.5020)

(0.3542)

5.6646

(2.2950)

(0.3248)

Weighted average number of ordinary
shares outstanding, diluted

186,667,233

186,166,429

185,613,735

185,613,735

186,621,626

185,607,348

185,607,348

Diluted income/(loss) per share

0.8275

0.1032

(1.2510)

(0.1771)

2.8057

(1.1475)

(0.1624)

Diluted income/(loss) per ADS

1.6550

0.2064

(2.5020)

(0.3542)

5.6114

(2.2950)

(0.3248)

Unaudited Condensed Consolidated
Cash Flow Data

Net cash generated from/(used in)
operating activities

36,352

557,762

(86,768)

(12,281)

(622,083)

470,994

66,664

Net cash provided by/(used in)
investing activities

240,896

(524,479)

(164,623)

(23,302)

(9,035)

(689,102)

(97,537)

Net cash (used in)/provided by
financing activities

(73,385)

(65,637)

39,905

5,648

420,004

(25,732)

(3,642)

Effect of foreign exchange rate changes

1,532

1,206

(86)

(12)

(664)

1,120

159

Net increase/(decrease) in cash, cash
equivalents and restricted cash

205,395

(31,148)

(211,572)

(29,947)

(211,778)

(242,720)

(34,356)

Cash, cash equivalents and restricted
cash, beginning of period

2,617,311

3,269,142

3,237,994

458,308

3,034,484

3,269,142

462,717

Cash, cash equivalents and restricted
cash, end of period

2,822,706

3,237,994

3,026,422

428,361

2,822,706

3,026,422

428,361


Unaudited Condensed Consolidated Balance Sheets

 (in thousands)

As of

December 31,
2019

March 31,
2020

June 30,
2020

June 30,
2020

RMB

RMB

RMB

USD

        Cash and cash equivalents

3,198,086

3,194,993

2,935,543

415,498

        Restricted cash

71,056

43,001

90,879

12,863

        Accounts receivable

3,398

33,902

27,309

3,865

        Contract assets, net

2,398,685

1,873,548

1,356,886

192,055

        Contract cost

160,003

149,917

145,809

20,638

        Prepaid expenses and other assets

1,333,221

868,462

1,134,257

160,545

        Loans at fair value

418,492

313,267

246,475

34,886

        Financing receivables

29,612

33,381

54,876

7,767

        Amounts due from related parties

988,853

1,583,859

1,560,376

220,857

        Held-to-maturity investments

6,627

4,399

4,126

584

        Available-for-sale investments

460,991

456,061

513,013

72,612

        Property, equipment and software, net

195,855

188,880

184,957

26,179

        Deferred tax assets

45,407

42,084

49,051

6,943

        Right-of-use assets

334,134

291,028

224,067

31,715

Total assets

9,644,420

9,076,782

8,527,624

1,207,007

        Accounts payable

43,583

39,068

40,324

5,708

        Amounts due to related parties

106,645

112,034

184,325

26,090

        Liabilities from quality assurance program and guarantee

4,397

3,487

2,660

377

        Deferred revenue

358,203

254,933

190,712

26,994

        Accrued expenses and other liabilities

2,338,745

1,946,205

1,981,040

280,397

        Refund liability

1,801,535

1,760,942

1,501,318

212,497

        Deferred tax liabilities

218,888

216,304

162,016

22,932

        Lease liabilities

282,334

259,197

205,056

29,024

Total liabilities

5,154,330

4,592,170

4,267,451

604,019

        Ordinary shares

121

121

121

17

        Additional paid-in capital

5,038,691

5,045,268

5,050,226

714,813

        Treasury stock

(37,097)

(37,097)

(37,097)

(5,251)

        Accumulated other comprehensive income

21,855

18,671

23,474

3,323

        Accumulated deficit

(533,480)

(542,351)

(776,551)

(109,914)

Total equity

4,490,090

4,484,612

4,260,173

602,988

Total liabilities and equity

9,644,420

9,076,782

8,527,624

1,207,007


Operating Highlights and Reconciliation of GAAP to Non-GAAP Measures

(in thousands, except for number of  borrowers, number of investors and percentages)

For the Three Months Ended 

For the Six Months Ended 

June 30,
2019

March 31,
2020

June 30,
2020

June 30,
2020

June 30,
2019

June 30,
2020

June 30,
2020

RMB

RMB

RMB

USD

RMB

RMB

USD

Operating Highlights

Amount of p2p investment

11,939,582

5,203,747

4,017,751

568,676

23,375,170

9,221,497

1,305,218

Number of p2p investors

157,973

78,256

63,066

63,066

320,054

108,252

108,252

Amount of non-p2p investment

284,782

2,163,313

2,186,210

309,438

613,490

4,349,523

615,635

Number of non-p2p investors

10,235

18,809

30,392

30,392

19,370

39,443

39,443

Amount of loans facilitated

9,673,818

1,839,454

2,402,494

340,051

20,608,740

4,241,948

600,409

Number of borrowers

135,246

115,420

107,568

107,568

280,634

220,731

220,731

Remaining principal of performing
loans

58,071,303

42,063,039

33,454,423

4,735,166

58,071,303

33,454,423

4,735,166

Segment Information

Wealth management:

Revenue

592,378

415,876

322,381

45,630

1,113,812

738,257

104,493

Sales and marketing expenses

213,168

67,326

45,454

6,434

357,072

112,780

15,963

Consumer credit:

Revenue

1,624,262

607,784

432,308

61,189

3,083,236

1,040,092

147,216

Sales and marketing expenses

995,479

549,115

463,012

65,535

1,979,520

1,012,127

143,257

Reconciliation of Adjusted
EBITDA

Net income/(loss)

154,461

19,219

(232,195)

(32,865)

523,595

(212,976)

(30,145)

Interest income, net

(25,213)

(25,116)

(16,950)

(2,399)

(49,088)

(42,066)

(5,954)

Income tax expense/(benefit)

61,856

3,936

(47,558)

(6,731)

138,390

(43,622)

(6,174)

Depreciation and amortization

31,112

27,171

24,368

3,449

63,614

51,539

7,295

Share-based compensation

17,732

4,541

2,954

418

32,431

7,495

1,061

Adjusted EBITDA

239,948

29,751

(269,381)

(38,128)

708,942

(239,630)

(33,917)

Adjusted EBITDA margin

10.8%

2.9%

-35.7%

-35.7%

16.9%

-13.5%

-13.5%


Delinquency Rates

Delinquent for

15-29 days

30-59 days

60-89 days

All Loans

December 31, 2015

0.7%

1.2%

0.9%

December 31, 2016

0.6%

0.9%

0.8%

December 31, 2017

0.8%

1.0%

0.8%

December 31, 2018

1.0%

1.8%

1.7%

December 31, 2019

1.2%

2.0%

1.7%

March 31, 2020

1.6%

4.1%

3.2%

June 30, 2020

1.4%

2.0%

2.1%

Online Channels

December 31, 2015

0.5%

0.8%

0.6%

December 31, 2016

0.5%

0.9%

0.8%

December 31, 2017

1.1%

1.1%

0.9%

December 31, 2018

1.2%

2.3%

2.2%

December 31, 2019

1.6%

2.9%

2.5%

March 31, 2020

1.9%

5.2%

3.8%

June 30, 2020

1.4%

2.4%

2.7%

Offline Channels

December 31, 2015

0.7%

1.2%

1.0%

December 31, 2016

0.6%

0.9%

0.8%

December 31, 2017

0.6%

0.9%

0.7%

December 31, 2018

0.9%

1.6%

1.5%

December 31, 2019

1.0%

1.7%

1.5%

March 31, 2020

1.6%

3.7%

3.1%

June 30, 2020

1.4%

1.8%

2.0%


Net Charge-Off Rate

Loan
Issued
Period

Amount of Loans
Facilitated
During the Period

Accumulated M3+ Net Charge-
Off
as of June 30, 2020

Total Net Charge-Off
Rate
as of June 30, 2020

(in RMB thousands)

(in RMB thousands)

2015

53,143,029

4,441,696

8.4%

2016

53,805,112

5,057,850

9.4%

2017

69,883,293

11,693,408

16.7%

2018

63,176,149

11,131,294

17.6%

2019

39,103,048

3,688,712

9.4%

2020Q1

1,320,428

6,388

0.5%


M3+ Net Charge-Off Rate

Loan
Issued
Period

Month on Book

4

7

10

13

16

19

22

25

28

31

34

2015Q1

0.8%

2.0%

3.4%

4.7%

5.7%

6.5%

7.1%

7.5%

7.7%

7.8%

7.8%

2015Q2

0.8%

2.3%

3.8%

5.2%

6.4%

7.3%

7.9%

8.3%

8.5%

8.7%

8.8%

2015Q3

0.4%

1.6%

3.1%

4.4%

5.6%

6.5%

7.1%

7.6%

7.9%

8.1%

8.4%

2015Q4

0.4%

1.6%

3.1%

4.4%

5.5%

6.3%

6.9%

7.4%

7.9%

8.3%

8.5%

2016Q1

0.3%

1.2%

2.5%

3.6%

4.5%

5.2%

5.8%

6.4%

7.0%

7.4%

7.6%

2016Q2

0.4%

1.6%

3.1%

4.3%

5.2%

6.0%

6.8%

7.6%

8.1%

8.4%

8.7%

2016Q3

0.3%

1.6%

3.1%

4.3%

5.4%

6.6%

7.8%

8.6%

9.2%

9.5%

9.8%

2016Q4

0.2%

1.5%

2.9%

4.4%

5.9%

7.4%

8.4%

9.3%

10.0%

10.4%

10.7%

2017Q1

0.3%

1.5%

3.2%

5.1%

7.1%

8.6%

9.8%

10.8%

11.5%

12.0%

12.2%

2017Q2

1.1%

2.9%

5.6%

8.4%

10.4%

12.1%

13.5%

14.5%

15.3%

15.8%

16.0%

2017Q3

0.3%

2.9%

6.4%

9.1%

11.6%

13.6%

15.0%

16.2%

16.9%

17.5%

2017Q4

0.5%

3.9%

7.3%

10.5%

13.2%

15.3%

16.9%

18.0%

18.8%

2018Q1

0.4%

3.0%

6.6%

10.1%

12.9%

15.2%

16.9%

18.2%

2018Q2

0.5%

3.6%

7.4%

10.8%

13.6%

15.8%

17.7%

2018Q3

0.4%

3.0%

6.2%

9.1%

11.7%

13.9%

2018Q4

0.3%

2.5%

5.6%

8.6%

11.7%

2019Q1

0.2%

2.5%

5.6%

9.0%

2019Q2

0.3%

2.9%

6.9%

2019Q3

0.3%

3.4%

2019Q4

0.3%


Related Links :

http://ir.yirendai.com/

Vehicle Displays & Interfaces Virtual Technical Symposium & Expo to Provide a First Look at the Future of the Vehicle-to-Human Interface

Society for Information Display (SID) Metropolitan Detroit Chapter Annual Meeting Sidelined by Pandemic to Now Take Place for a Global Engineering Virtual Only Audience October 14-15, 2020 and On Demand Until February 15, 2021

DETROIT, Aug. 27, 2020 — The Metropolitan Detroit Chapter of the Society for Information Display (SID) is pleased to announce the 27th Annual Vehicle Displays & Interfaces Symposium & Expo will take place in a virtual-only format Wednesday and Thursday October 14-15, 2020, for the benefit of multi-disciplined and multi-international OEM teams and specialists composed of designers, engineers, scientists, technologists, researchers, and system integrators of land, air, sea, and space vehicle displays.

The SID Metropolitan Detroit Chapter recognizes that in the high-tech 4th Industrial Revolution a strong technical understanding of new and emerging Display 3.0 technologies is essential to the global success of engineers, display specialists and executives who design, manufacture, sell and buy vehicle displays, display components, services, and products that integrate display and visual information technology into vehicles. 

In the 2020-decade, the rapid evolution and divergence of visual information technologies continues on pace to connect humankind with their land, air, sea and space vehicles, and their vehicles to them.

"This year’s technical program underscores how the future of electronic vehicle displays resides in the confluence of new and emerging sciences, materials, form factors and technological advances in hardware, software, sensors, systems, components and applications." – Silviu Pala, SID Symposium Chair

The two-day Vehicle Displays & Interfaces October event gives registrants an opportunity for in-depth learning and valuable insights from keynote and back-to-back technical presentations from globally recognized scientists, tech visionaries, thought leaders and researchers presenting leading-edge science and R&D, with leading value-add suppliers providing solutions to global supply chains from pandemic disruption. Registrants can conduct online Q&A with speakers in ‘chat,’ as well as move projects forward by arranging real-time ‘private chat’ sessions with expert exhibitor technical staff.

The 2020 online technical program features distinguished speaker presentations from the global display, HMI, vehicle systems, photonics, academic and vehicle OEM communities. Peer-reviewed papers provide in-depth knowledge and insights on the latest scientific advances, most recent breakthroughs, and potentially revolutionary applications.

TECHNICAL PROGRAM SEGMENTS, TOPICS AND SPEAKERS FROM US, ASIA, EUROPE

Displays and HMI Systems:

  • Reflection Properties of AR Coated Flat and AG Glass Surfaces
    Dave McLean, MAC Thin Films, Santa Rosa, CA, US
  • IOT Intelligent Display Technology
    Lingling Zhang, Tianma, Shanghai, China
  • Display Module with Integrated Driver of Multi-screen
    Liang Zhou, Tianma, Shanghai, China
  • High Precision Optical Bonding for Free-form and Curved Displays
    Gino Mariani, Henkel Surface Technologies, Madison Heights, MI, US

Head-Up Displays:

  • Diffusive Microlens Array for Head-Up Display Applications
    Jerry Wu, Dexerials Corporation, Tagajo-shi, Japan
  • Human Perception Studies of Head-Up Display Ghosting
    Steve Pankratz, 3M Display Materials and Systems Division, St. Paul, MN, US
  • Computational Holographic Displays for 3D AR HUD Using Free-Form Optics
    Hakan Urey, CY Vision, San Jose, CA, US
  • Holographic Optical Elements and Projector Design Considerations for Automotive Windshield Displays
    Michael Firth, CERES Holographics, St. Andrews, Scotland, UK

Tutorial:
Drs. Kai-Han Chang and Thomas Seder from GM R&D will deliver a presentation entitled ‘Holography and Its Automotive Applications: A Tutorial’

Display Metrology:                          

  • Understanding and Achieving Reproducible Sparkle Measurements for an Automotive Specification
    Ingo Rotscholl, TechnoTeam Bildverarbeitung GmbH, Ilmenau, Germany
  • Measuring MicroLEDs for Color Non-Uniformity Correction
    Mike Naldrett, ELDIM, Radiant Vision Systems LLC, Redmond, Washington, US

New Display Solutions:

  • Supervising (Automotive) Displays for Safe Visualization of Camera Video
    Benjamin Axmann, Mercedes-Benz Cars Group Research, Future Technologies, Boeblingen, Germany
  • Customized Local Dimming Algorithm and BLU for Automotive Application towards Low Power Consumption and High Visual Quality
    Maxim Schmidt, Institute of Microelectronics, Saarland University, Saarbrücken, Germany 
  • Automotive Smart Surfaces: Conformable HDR Displays and Smart Windows to Activate Almost Any Surface
    Paul Cain, FlexEnable, Cambridge, UK
  • The Functional Safety Designs of Vehicle Display Driver ICs
    Cheng-Chih Deno, Himax, Hsinchu City, Taiwan
  • Automotive Dual Cell microZone™LCD Development
    Paul Weindorf, Visteon Corporation, Van Buren TWP, MI, US
  • A Low-power Transflective TFT-LCD Based on IGZO TFT
    Lou Tenggang, Tianma Micro-Electronics Group, Shanghai, China
  • A Micro LED Device With 0mm Border
    TengGang Lou, Tianma Micro-Electronics Group, Shanghai, China
  • Enabling Features of VueReal MicroLED Technology for Automotive Applications
    Rexa Chaji, VueReal Inc, Waterloo, Ontario, Canada
  • New Challenges and Testing Solutions for Flexible Vehicle Displays & Interfaces
    Eisuke Tsuyuzaki, Bayflex Solutions, Alameda, CA, US
  • New Material Solutions for Automotive Displays. Interfaces and Applications
    Eisuke Tsuyuzaki, Bayflex Solutions, Alameda, CA, US 
  • An Alternative to OLED with Full-array Local Dimming in Automotive Displays
    Logan Cummins, Texas Instruments, Dallas, TX, US

Post-Event On Demand Viewing:
Registrants can view symposium presentations and virtual exhibitor booth content and videos anyplace, anytime, any time zone on demand until February 15, 2021.

Links:
To review the symposium program and exhibitor list, go to www.VehicleDisplay.org
To register, go to www.VehicleDisplay.org.
To secure a virtual exhibitor booth or sponsorship opportunity contact Joe Nemchek at jnemchek.@pcm411, or call (203) 502-8338.

About SID Vehicle Displays & Interfaces Detroit Symposium & Expo:
The SID Vehicle Displays & Interfaces Symposium & Expo Detroit is presented by the Metro-Detroit Chapter of SID (Society for Information Display) www.SID.org. SID is the only professional society focused on the advancement of electronic display and visual information technologies. By exclusively focusing on the advancement of electronic display and visual information technologies, SID provides a unique platform for industry collaboration, communication and training in all related technologies while showcasing the industry’s best new products. The organization’s members are professionals in the technical and business disciplines that relate to display research, design, manufacturing, applications, marketing and sales.

Yiwugo Signed a Digital Strategic Cooperation with AfriChina Projects Limited


YIWU, China, Aug. 27, 2020 — Yiwugo.com, the official website of the Yiwu Commodity Market, which is the largest commodity wholesale market in the world, and AfriChina Projects Limited have signed a digital cooperation agreement. Yiwugo hopes to provide better localized and quality services to overseas buyers through the cooperation, while AfriChina Projects aims to enable local buyers access to quality merchants and products from Yiwu.

AfriChina Projects is currently owner of a digital trading platform for Nigerian buyers. During the cooperation, Yiwugo will provide information about its products and shops to this online platform to help Nigerian buyers purchase commodities from Yiwu’s suppliers. In this way, most of the challenges of doing business between Nigeria and China (e.g. providing more convenient and localized services, building trust between Nigerian buyers and Chinese suppliers on the digital platform, etc.) can be addressed in order to facilitate the seamless free flow of goods.

In recent years, the economic and trade cooperation between China and Nigeria has been on a fast track, with bilateral trade between China and Nigeria reaching $19.27 billion in 2019, up 26.3 percent from the previous year, making Nigeria No. 1 among China’s top 40 trading partners in terms of growth rate. Nigeria has been paying close attention to China’s "Belt and Road Initiative" and has been strengthening its cooperation with China through it. Yiwu is one of the major cities of international trade along the "Belt and Road" and one of the largest export bases in China, with its small commodities are exported to 219 countries and regions around the world. In the context of the current global COVID-19 outbreak, digital international trade is undoubtedly the best choice.

Currently, Yiwugo has signed agreements on digital strategic cooperation with partners from more than ten countries and regions including Russia, Iran, Lebanon, Syria, Canada, Brazil, Egypt, Chile, Malaysia, Indonesia, to achieve win-win cooperation. Overseas partners provide local buyers with convenient and localized services by accessing the information of shops and products on the Yiwugo platform. By this way, Yiwugo strives to open up global digital trade channels for small commodities of Yiwu.


Frost & Sullivan Recognizes LinkShadow as Innovation Leader in User and Entity Behavior Analytics Based on Machine Learning

LinkShadow’s next-generation cybersecurity analytics capabilities provide unparalleled detection of sophisticated threats

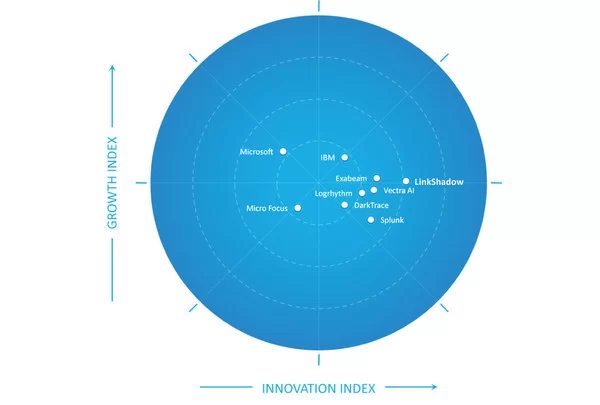
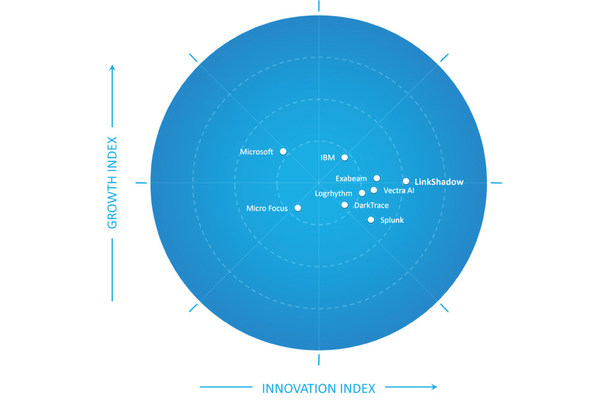
SANTA CLARA, California, Aug. 27, 2020 — Frost & Sullivan has named LinkShadow as a top industry innovator in the Frost Radar™: User and Entity Behavior Analytics Based on Machine Learning, 2020. The company is recognized for its strong track record in cybersecurity analytics and steadily evolving growth pipeline. LinkShadow’s flagship solution is the only one available in the market that tracks the chain of incidents, aggregates them, shows their stages, and graphically represents the attack path on a global map.

LinkShadow Frost Radar

It is becoming more crucial for organizations to have security tools that analyze the behavior of users who are connected to their networks and entities or endpoints such as servers and applications to detect anomalies. As the number of under-the-radar attacks increases, it will become more challenging for security staff to investigate the attacks to effectively take action. Therefore, the need for user and entity behavior analytics (UEBA) tools is greater than ever.

To download the complimentary Frost Radar, please access: http://frost.ly/4ez

"LinkShadow is unique in providing behavioral analytics that leverage the capabilities of both supervised and unsupervised machine learning," explained Saurabh Verma, Director, ICT, at Frost & Sullivan. "The company thrives, thanks to its flexibility to fulfil client requests that rivals cannot commit to, such as developing an agent deployment in addition to its agentless deployment."

LinkShadow’s main differentiator among market competitors is its service bundle, which includes the UEBA, intelligence-driven threat hunting, insider threat detection, and comprehensive management (CXO) dashboard in a single solution. Moreover, unlike other service providers in the market, LinkShadow offers its solution on a perpetual model.

"We are proud to be recognized by Frost & Sullivan and stand out as an innovation pioneer in the cybersecurity analytics space," said Kiarash Jafari, Regional Director at LinkShadow. "The key to staying ahead in the game is innovation, and achieving the highest score in the Innovation index highlights our commitment to making a difference in the industry."

LinkShadow has fueled its success through its unique behavioral analytics capabilities, which enables it to effectively support multinational businesses with a diversified customer base by:

  • Delivering supreme solutions that include threat intelligence, insider threat management, privileged user analytics, network security optimization, machine learning, and statistical analysis.
  • Providing risk scoring, prioritization, application security visibility, and predictive analytics.
  • Providing technical support and training.
  • Identifying market needs beforehand and constantly enhancing customer value by adding new features and capabilities to its service bundles.
  • Establishing strategic partnerships with security information and event management (SIEM) providers and leveraging joint go-to-market strategies.

Frost Radar: User and Entity Behavior Analytics Based on Machine Learning, 2020 provides results from an in-depth analysis built on a 360-degree research methodology where over 20 companies were evaluated. The team of industry analysts identified nine industry leaders excelling at innovation, most poised for growth and ripe for investment, and recognizes them in the Frost Radar with insight into their innovative offerings, projected growth rates, strengths, and opportunities for the future.

About Frost & Sullivan

For over five decades, Frost & Sullivan has become world-renowned for its role in helping investors, corporate leaders and governments navigate economic changes and identify disruptive technologies, Mega Trends, new business models and companies to action, resulting in a continuous flow of growth opportunities to drive future success. Contact us: Start the discussion.

Contact:
Zuzana Zukarnain
Corporate Communications
Phone: +60192657808                              
Email: zuzana.zukarnain@frost.com
http://www.frost.com

Photo – https://techent.tv/wp-content/uploads/2020/08/frost-sullivan-recognizes-linkshadow-as-innovation-leader-in-user-and-entity-behavior-analytics-based-on-machine-learning.jpg

Related Links :

Frost New Home page v2

A Unique Art Tour — London-based V&A Museum Goes Virtual on Kuaishou

BEIJING, Aug. 27, 2020 — The Victoria and Albert Museum (V&A), a world-renowned museum in London, launched its official account on Kuaishou on August 25th, becoming the first overseas museum to join China’s leading short-video and livestreaming platform.

The next day, the 160-year-old museum made its livestreaming debut on Kuaishou, whose livestreaming service has been embraced by over 170 million daily active users.

Before the pandemic, the V&A received over 1.5 million visitors annually, contributing more than 40% of visitor admissions in London. Renowned as the world’s largest museum of applied and decorative arts and design, the V&A houses a collection of over 2.3 million objects, with 5000 years of art and design history.

For their Chinese visitors, the V&A provided a virtual gallery-travel for Kuaishou’s millions of users, who are blocked from going abroad due to the pandemic. This 2-hour-long special exhibit tour via livestreaming attracted 3.8 million audiences, with 166 thousand users contributing likes.

"The coronavirus blocks physical communications between people from China and other countries but cannot cut the connection and emotion bonding between peoples and cultures. Artistic-cultural heritages are borderless," said Yi Xuan, Senior Director of Kuaishou’s regional cooperation.

"As the leading short-video platform in China, Kuaishou is continuously striving its best to introduce the international cultural-artistic contents via social media in China, enabling users to have a better understanding of the world without leaving home," added Yi.

Guided by Xiao Lang and Li Xiaoxin, V&A’s Chinese social media adviser and Chinese collections researcher respectively, Kuaishou users enjoyed themselves with the museum’s charms and exhibits from India and the Royal Family. Kuaishou also kicked off a Quiz Challenge about V&A to personalize the event and make it memorable for the audience.

Nick Marchand, V&A’s Director of International Business, expressed his appreciation to Kuaishou and the audience. "With the V&A’s reopening, we’re thrilled to welcome audiences back. But not everyone can travel right now, to see them. Thankfully, Kuaishou provides an invisible thread to connect us. While our worlds seem a little smaller right now, the V&A will transport you across time and geography. Step behind the doors of the museum with us, and get close to the extraordinary."

Nick Marchand, V&A's Director of International Business, addressed the online audiences in livestreaming via Kuaishou.
Nick Marchand, V&A’s Director of International Business, addressed the online audiences in livestreaming via Kuaishou.

As the leading livestream platform, Kuaishou has been putting great efforts into pushing the art sector to reach more people. On 14 February 2020, the world-renowned pianist Lang Lang gave a piano demonstration lesson to over 3 million music lovers and fans on Kuaishou via livestreaming, in honor of supporting efforts against COVID-19.

Since the first quarter of 2020, the National Museum of China has rolled out a series of cultural events on Kuaishou. On 5 March, the museum launched a short-video campaign under the hashtag of museum tour on Kuaishou, providing a chance for users to experience the museum. One of these short videos, which exhibited a 1500-year-old Celadon lotus-shape Zun from ancient China, achieved 2.5 million views and over 44,000 likes.

About Kuaishou Technology

Kuaishou Technology develops content sharing platforms and makes content production, distribution, and consumption fast and easy. Our content recommendation system is built on a deep understanding of our users and the content being shared on our platforms every day.

Our flagship product, Kuaishou, is China’s leading short video sharing and social networking platform that enables users to capture the unique and memorable moments of their everyday lives, and to interact with followers in real-time. Our technology offers users a highly personalized experience and encourages members from all communities to create and discover interesting and dynamic content.

Founded in 2011, Kuaishou Technology is headquartered in Beijing with more than 10,000 employees and offices in China, the United States, India and Brazil. Our notable investors include DCM Ventures, Morningside Venture Capital, Sequoia Capital, Temasek Holdings, Tencent and Baidu. For more information, please visit www.kuaishou.com.

  • March 2011 GIF Kuaishou was created as a product tool for creating animated GIFs
  • October 2013 GIF Kuaishou was transformed into a short-form video social platform – Kuaishou
  • January 2015 Kuaishou’s DAU (daily active user) exceeded 10 million
  • September 2017 Kuaishou’s total users exceeded 600 million and DAU exceeded 80 million
  • December 2017 Kuaishou’s DAU exceeded 100 million
  • June 2018 Kuaishou Technology completed the acquisition of Acfun, an ACG video community
  • May 2019 Kuaishou’s DAU exceeded 200 million
  • March 2020 Kuaishou’s DAU exceeded 300 million
  • July 2020 Kuaishou’s Livestream DAU surpassed 170 million

To download Kuaishou, click here.

CONTACT: Zhang Chuanshi, zhangchuanshi@kuaishou.com
Han Xing, hanxing@kuaishou.com 

Related Links :

http://www.kuaishou.com

Can cybersecurity keep up with flexible work arrangements?

2020 will be remembered as the year the world experienced its largest ever work-from-home experiment as the global pandemic forced businesses to move operations online and adapt to a new distributed workforce.

As some markets around the globe gradually ease some restrictions and allow employees to go back to the office, the situation remains in a delicate balance and work as we know it has been redefined for many. Increasingly, organisations are embracing the new work model and the many benefits that come with it including increased employee well-being and better work-life balance. In fact, some organisations are now establishing permanent work-from-home policies with 60 percent of the largest companies integrating flexible virtual-physical collaborative environments by 2021, according to Bain & Company. This is supported by Lenovo’s Work From Home survey which found that nearly half (46 percent) of employees are as productive when working from home as they are in the office, with 15 percent saying that productivity increases at home.

woman writing on her notebook
Photo by Retha Ferguson on Pexels.com

The survey also found that 87 percent of workers feel somewhat ready to adapt to a distributed, work-from-anywhere environment if required. So too are cybercriminals. The looming uncertainty among employees of the delicate, everchanging global circumstances, combined with their unfamiliarity with the new work arrangement, has created a wealth of opportunities for cyber-attacks. Cyber criminals are taking advantage of the situation to launch COVID-themed attacks, phishing attempts and spread fake news. In Malaysia, cybersecurity cases have seen a surge of more than 90% during the Movement Control Order (MCO) so far compared to the same period last year, CyberSecurity Malaysia revealed.

Watch for your blind spots

With employees accessing confidential data from various devices, locations, and unsecured networks, it opens more endpoints and vulnerabilities for cyberattacks. In our hyper-digital and mobile world, hardware security is becoming ever more critical, as across the globe, each person is expected to own 6.58 network connected devices in 2020. In fact, according to cybersecurity solutions provider Sepio Systems, there has been a 300 percent increase in the number of new connected devices from unknown vendors attached to the enterprise network.

blur bright business codes
Photo by Pixabay on Pexels.com

While a majority of employees are working primarily from home, it is only a matter of time before they begin heading back to shared workspaces, coffee shops and planes and once again enjoy the flexibility of working from anywhere. This means that an organisation’s network, database and confidential files may be accessed from unsecured VPNs, unknown networks, and rogue access points. Without proper security standards put in place, hackers can easily gain access to an organisation’s network via vulnerable devices and execute attacks remotely. Organisations must take this into consideration and be on the offensive to mitigate potential attacks before malicious entities infiltrate company systems and confidential data.

Adopt a Zero Trust mindset

The nature of a distributed workforce removes the luxury of face-to-face identification and validation. Tech Wire Asia reported that cyber scams based on COVID-19 becomes prevalent in recent months, as hackers look to capitalize on the virus-driven uncertainty affecting individuals, enterprises, and governments. This means that organisations must double down on their efforts in credential and access management and continue to educate employees to identify and weed out impersonation scams and phishing attempts. As hackers grow in sophistication, organisations and employees must take a Zero Trust. In order to protect business and employee data, organisations must implement a system to ensure that the right people have access to the right data at the right time, on a ‘need-to-know’ basis.

Empowering a distributed workforce with cybersecurity

To reap the full benefits of a distributed workforce in the long run, organisations must provide employees with secure devices and create a safe digital environment to operate in, allowing them to focus on the job at hand. This shift to a decentralised work environment means that IT teams must have extended visibility over digital platforms and the organisations digital ecosystems in order to identify and mitigate potential threats in a timely manner.

However, with the shortage of cyber talent and growing digital footprint, this can take a toll on IT teams. IT teams must be supported to enhance their capabilities with solutions that provide both hardware and software security. For example, Lenovo’s ThinkShield solution helps secure devices from development through disposal, giving IT admins more visibility into end points and providing easier and more secure authentication. Lenovo has also partnered with SentinelOne to leverage its behavioral AI technology to predict tomorrow’s attacks today and allow ThinkShield devices to predict cyberattacks and enable devices to self-heal from any attack instantaneously, adding another critical layer to our ThinkShield offering.

As employees have quickly adapted to new work structures in these unique times, organisations must also embrace the risk that comes with it and put in place the right measures and solutions to create a secure and robust environment for employees to operate in. One way Lenovo helps organisations empower employees is by offering services that supports remote workers. For employees who do not have access to IT helpdesks, Lenovo’s Premier Support allows for direct, 24/7 access to elite Lenovo engineers who provide unscripted troubleshooting and comprehensive support for hardware and software. This results in less downtime for end users when things go wrong, freeing IT staff up to focus on strategic efforts.

Only then will organisations and employees be able to reap the full benefits of a distributed workforce and build a stronger digital foundation to effectively navigate and succeed in the new world of work.

The Top Skills a Cloud Architect Needs to Be Successful

As the world rapidly evolves, digitalization is taking place across all aspects of life, and ushering in a rise in cloud adoption. Today, it is vital for employees to understand and acquire the skills it takes to succeed and stay relevant for jobs in the digital economy. Cloud architects must keep up with the pace by adapting and expanding their existing skillset in order to be considered valuable candidates and employees.

As cloud adoption rises, it is not surprising to see growing demand for cloud expertise. Based on the Malaysian Institute of Accounts’ “MIA-ACCA Business Outlook Report 2020,” 25% of organizations in Malaysia say they are allocating at least 10% of their budget for technology, including investing in big data analytics (64%), cloud computing (57%) and more.[1] Yet, research shows that 90% of IT decision-makers report cloud skills shortages in their workforce.[2]

woman standing while carrying laptop
Photo by Christina Morillo on Pexels.com

When I first started out in the IT industry years ago, the role of cloud architect was almost nonexistent. However, cloud adoption has grown considerably since then, and the role of cloud architect is currently in high demand and will continue to present endless opportunities for business growth and innovation.

But first – what does a cloud architect do?

Cloud architects are responsible for managing an organization’s cloud computing architecture. They have in-depth knowledge of the architectural principles and services used to develop technical cloud strategy, assist with cloud migration efforts, review workload architectures, and provide guidance on how to address high-risk issues. To do this, cloud architects need a mix of business, technical, and people skills, as well as an understanding of the always-evolving, technical training that may benefit their team.

At Amazon Web Services (AWS), I lead a team of cloud solutions architect in Southeast Asia, and we are constantly on the lookout for individuals with a builder’s mentality and a desire to build, invent, and innovate on behalf of their customers. This is especially important as the role of cloud architect has evolved beyond just architecting infrastructure solutions like database and storage, to building and innovating reliable solutions that involve emerging technologies such as machine learning.

What skills are most important for a cloud architect?

Flexibility and Eagerness to Learn

A cloud architect must be able to work in a wide variety of scenarios and be open to learn the unique requirements of each project. With a curious mind-set, cloud architects can be better equipped to seek out new approaches to problem solving.

schedule planning startup launching
Photo by Startup Stock Photos on Pexels.com

Time Management

Cloud architecture professionals must possess strong time management skills. Their days are varied and can include customer meetings to discuss problems and needs and designing architectural frameworks for those needs. As such, cloud architects are mindful to plan their days, prioritize their time on tasks, and understand how to maximize small pockets of time.

Communication Skills, Business Acumen, and Decisiveness

Cloud architects are encouraged to ask for a seat at the decision-making table and be prepared to communicate their design to any stakeholder. Successful cloud architects know how to communicate to audiences with little or no technical knowledge, while aligning their recommendations to business imperatives and the bottom-line. Other than that, stakeholders also rely on cloud architects to provide guidance from a calm, leading place of domain authority.

Industry Technical Credentials

A cloud architect must also possess the necessary technical skills to serve as the foundation for cloud architecture planning and management, including basic programming, software development and continuous integration, database, networking and security skills, modern application architecture skills, and more.

woman coding on computer
Photo by ThisIsEngineering on Pexels.com

Additionally, cloud architects can attain an industry-recognized certification, such as the new AWS Certified Solutions Architect – Associate certification, which validates the ability to design and deploy well-architected solutions on AWS that meet customer requirements.

Over the last few years, I have seen cloud computing evolve from a relatively unknown technology to a leading driver of business results. While the technology has grown and changed significantly, most skills needed to succeed in its use have remained largely constant. By committing to understand how to use cloud to its full potential – and empowering the professionals who make that possible – we can make the most of the tremendous opportunity cloud creates for businesses and employees to thrive.


[1] MIA (Malaysian Institute of Accountants) and ACCA (Association of Chartered Certified Accountants), Business Outlook Report 2020, 2020

[2] Global Knowledge, 2018 IT Skills and Salary Report, 2018.

Clarivate Announces Appointment of Stefano Maestri as Chief Technology Officer

LONDON, Aug. 27, 2020 — Clarivate Plc (NYSE:CCC), a global leader in providing trusted information and insights to accelerate the pace of innovation, today announced the appointment of Stefano Maestri as Chief Technology Officer based in London. Stefano brings over 20 years of technology leadership experience leading technology teams in global organizations within the financial services sector. Stefano replaces Randy Harvey who has announced plans to retire.


A deeply experienced technology professional, Stefano spent the past four years as CTO for the financial services division of IHS-Markit where he led a complex, multi-faceted organizational transformation to support a cloud-first product strategy. Prior to IHS Markit where he spent almost 12 years in total, he held technology and content leadership roles at Barclays Capital, NYSE and Credit Suisse.

Jerre Stead, Executive Chairman and CEO, Clarivate, said: "We are delighted to welcome Stefano Maestri as our new CTO. He brings a wealth of experience as an accomplished technology leader and his experience in the financial services sector will be invaluable. I look forward to seeing him build on the impressive milestones accomplished under Randy Harvey’s leadership."

Stefano Maestri added: "I am proud and delighted to serve as the next Chief Technology Officer for Clarivate. This is an exciting time for Clarivate and for the science and intellectual property information markets. Our global technology team includes deeply experienced leaders who are already building the new products and platforms that we need to be successful in the long term. I look forward to working closely with them to deliver our ambitious vision."

About Clarivate   
Clarivate™ is a global leader in providing trusted information and insights to accelerate the pace of innovation. We offer subscription and technology-based solutions coupled with deep domain expertise that cover the entire lifecycle of innovation – from foundational research and ideas to protection and commercialization. Today, we’re setting a trail-blazing course to help customers turn bold ideas into life-changing inventions. Our portfolio consists of some of the world’s most trusted information brands, including the Web of Science™, Cortellis™, Derwent™, CompuMark™, MarkMonitor™ and Techstreet™. For more information, please visit clarivate.com.

Forward-Looking Statements
This press release and any statements included herein may contain forward-looking statements regarding Clarivate. Forward-looking statements provide current expectations or forecasts of future events and may include statements regarding results, anticipated synergies and other future expectations. These statements involve risks and uncertainties including factors outside of the control of Clarivate that may cause actual results to differ materially. Clarivate undertakes no obligation to update or revise the statements made herein, whether as a result of new information, future events or otherwise.

Media Contacts
Tabita Seagrave, Head of Global Corporate Communications
media.enquiries@clarivate.com

Logo – https://techent.tv/wp-content/uploads/2020/08/clarivate-announces-appointment-of-stefano-maestri-as-chief-technology-officer.jpg

Related Links :

Home

Huawei-Philippine Basketball Association Presents ‘3-Point Shootout Virtual Tournament’

MANILA, Philippines, Aug. 27, 2020 — Huawei announced today its team-up with Philippine Basketball Association (PBA) to present the inaugural ‘PBA 3-Point Shootout Virtual Tournament’ for PBA players to compete for a good cause supporting the frontliners. The tournament is happening online starting from 28 August until 27 November 2020 through the ‘Basketball Slam’ app, the official basketball gaming app of PBA downloadable from HUAWEI AppGallery.

Huawei announced today its team-up with Philippine Basketball Association (PBA) to present the inaugural ‘PBA 3-Point Shootout Virtual Tournament’ for PBA players to compete for a good cause supporting the frontliners. The tournament is happening online starting from 28 August until 27 November 2020 through the ‘Basketball Slam’ app, the official basketball gaming app of PBA downloadable from HUAWEI AppGallery.

Each PBA team will nominate two players for a total of 24 players to contend each other. The tournament will take place online from the safety of their homes in a full-court mobile basketball gameplay.

The nominated players will be given five rounds to score as many points as possible with a time limit of 90 seconds at each round where a series of elimination will occur. Round One will kick off with 24 players challenging one another to qualify for Round Two where only 12 players will remain. At the Grand Finale, the top two players will battle against each other to emerge as Final Champion.

At the end of the campaign, the winner of the tournament can nominate a beneficiary charity organization to receive the tournament prize incentive of PHP 250,000.

All of the virtual plays will be streamed on www.pba.ph and Cignal TV, starting from 28 August and 29 October respectively.

Exclusive PBA Merchandises and Huawei Gifts Up for Grabs

The one-of-a-kind Basketball Slam app features an online basketball league where users can choose their favourite PBA basketball stars with real stats and abilities to play against each other.

Active players who downloaded Basketball Slam app from AppGallery and made in-app purchases (IAP) will be eligible to join the social media contest to win PBA merchandises.

Besides, Five PBA games from the popular Season 42 will be available free of charge on HUAWEI Video app starting from October onward. HUAWEI Video users will also stand a chance to win a slew of gift items from both Huawei and PBA. Users can enter the contest by voting for their favourite matches via HUAWEI Video. The participant can vote once a day and receive one lucky draw daily.

Users can visit HUAWEI Mobile Services Official Fan Page for more campaign updates.

Photo – https://photos.prnasia.com/prnh/20200826/2899890-1?lang=0