Huntkey Adds the SCA109C to Its Wireless Charger Family

SHENZHEN, China, May 8, 2020 /PRNewswire/ — Huntkey, a leading global provider of power solutions, increases its selection of wireless chargers with the SCA109C, a wireless charger complemented with one USB-C (also known as USB Type-C) port and two USB-A ports.

The Huntkey USB-C Wireless Charger:
https://en.huntkey.com/product/sca109c/

The SCA109C’s wireless charger provides a maximum 10W power output for Qi-certified devices such as Samsung and iPhone smart phones. The USB-C port delivers 5V3A, 9V2A or 12V1.5A power intelligently to fit different devices. The two USB-A ports share a combined 5V2.1A power output.

It is paired with a durable AC cable that is equipped with a two-pin US plug, which is targeted at the North America market. To ensure safety, it is FCC listed and built with multiple protections including OVP (Over Voltage Protection), OCP (Over Current Protection), OTP (Over Temperature Protection) and SCP (Short Circuit Protection). Not only will it protect itself, but also keep the charging devices safe under any circumstances. For more information, please visit: https://en.huntkey.com/

About Huntkey

Huntkey Enterprise Group, founded in 1995 and headquartered in Shenzhen, is a member of The International Power Supply Manufacturer’s Association (PSMA) and a member of The China Power Supply Society (CPSS). With branch companies in the USA, Japan and other areas, and cooperating factories in Brazil, Argentina, India and other countries, Huntkey has specialized in the development, design, and manufacturing of PC power supplies, industrial power supplies, surge protectors, adapters and chargers for many years. With its own technologies and manufacturing strength, Huntkey has served Lenovo, Haier, DELL, Bestbuy and many other large enterprises for years, and has received unanimous recognition and trust from most of the customers.

Cision View original content:http://www.prnewswire.com/news-releases/huntkey-adds-the-sca109c-to-its-wireless-charger-family-301055508.html

COOCAA Tops Best-seller List of Smart TVs on Lazada Ramadan Sale

JAKARTA, Indonesia, May 8, 2020 /PRNewswire/ — COOCAA, a subsidiary of TV manufacturer Skyworth, announced that its smart TV has topped the chart as the best-selling smart TVs on Lazada during the Ramadan sale.

“We are thrilled that our smart TV has become the option for our customers in Southeast Asia. The sales record marks another milestone in our mission to deliver world-leading home entertainment experience to customers”, said Peter Zhang, General manager of overseas brands of COOCAA.

“As the social distancing measure remains in place, we are more focused on providing the best entertainment options to ensure people can enjoy their family time. So, we brought COOCAA’s latest innovations to customers and also launched several live-streams to help them make the best choice”, Peter Zhang said.

COOCAA Tops Best-seller List of Smart TV on Lazada Ramadan Sale

COOCAA Changes the Way You Experience Home Entertainment

Powered by the latest Android 9.0 operating system, the COOCAA smart TV S6G creates an outstanding cinematic center for the homes with Netflix, YouTube and other apps from Google play that offer tens of thousands of movies and TV episodes. 

COOCAA S6G Android TV

Embedded with a high-performance processor and a variety of state-of-the-art technologies, the COOCAA S6G features a frameless infinity view 2.0 display that transcends pictures into breathtaking and vivid images with vibrant and fine-tuned colors. Immersive and heart-thumping, COOCAA’s Audio Surround System offers supreme sound quality that brings the viewer into the gaming and cinematic world. 

With the built-in integrated platform designed to deliver a more intelligent and seamless home ecosystem, users now can achieve hands-free control to select their favorite shows and turn on compatible smart home appliances through Google assistant. 

New Possibilities Fueled by Collaboration

As one of Lazada’s first Joint Business Partnership (JBP) brands for 2019, COOCAA has formed a strategic partnership with the e-commerce giant to offer premium smart TV products and high-quality customer services to the local markets. The online collaboration has resulted in a reduction in operational costs leading to even better deals for consumers.

Carved out of a leading solutions provider of smart technology, COOCAA leverages its expertise in TV technologies to make significant strides in bringing AI-enabled home entertainment experiences to customers. Dedicated to creating more intelligent features, COOCAA has established cooperation with Google to scale up the development of AI, bringing about unimagined home entertainment experience for the future.

“In the next decade, Coocaa is set to launch more online platforms, intelligent and ease-of-use home appliances and peripheral products in Southeast Asia, bringing our innovations and cutting-edge designs that allow customers to enjoy the future at home”, Peter Zhang said.

About COOCAA

Founded in 2006, COOCAA develops both smart TVs and smart consumer electronics hardware. Its products include games TVs, high-end smart TVs, remote-control devices for smartphones which allow users to control home appliances remotely, Bluetooth game handles, and Bluetooth earphones. 

Sylvia Wang
+86-755-2735-7658
wangxiaoqian@skyworth.com

Photo – https://photos.prnasia.com/prnh/20200507/2797531-1-a?lang=0
Photo – https://photos.prnasia.com/prnh/20200507/2797531-1-b?lang=0

Sungrow Rolls Out the Latest Three-phase Inverter SG25CX-SA for Brazilian 220V Market

SAO PAULO, May 8, 2020 /PRNewswire/ — Sungrow, the global leading inverter solution supplier for renewables, launched the Company’s three-phase 1000Vdc commercial inverter SG25CX-SA for Brazilian 220V grid system, showcasing its commitment to the flexibility and reliability of regional grid voltage requirement in commercial and industrial (C&I) applications.

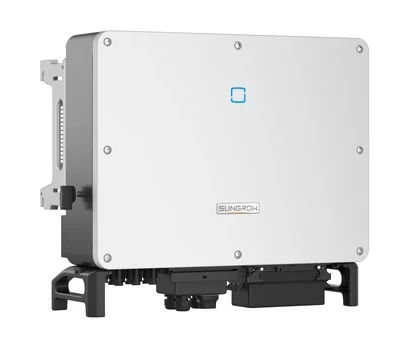
Sungrow three-phase inverter SG25CX-SA

Sungrow’s three-phase inverter SG25CX-SA with unparalleled performance is ideal for Brazilian 220V grid condition which accounts for 55% of diversified local grid voltage modes. Equipped with multiple MPPTs, the 25kW inverter is accessible to be installed in diverse commercial PV plants and guarantees optimal power generation even in the shade. It can be compatible with bifacial modules, offering higher yields and lower LCOE as well.

Particularly with an ingress protection level of IP66 and an anti-corrosion grade of C5, it’s able to accomplish the feat with stunning efficiency with improved resilience. Designed with smart forced air-cooling technology, the inverter can operate without derating at scorching weather conditions. With Built-in PID (potential induced degradation) recovery function, the SG25CX-SA can significantly reduce power loss.

It enables remote firmware update, touch free commission and can co-work with Sungrow’s intelligent monitoring system iSolarCloud, which offers a graphical readout of timely plant production, as well as the status of the PV array and inverter via portable smart devices.

“We are enthused to bring forth another standout innovation SG25CX-SA, a typical three-phase inverter for 220V grid for Brazil, maximizing ROI for our customers at unforeseen levels,” said Rafael Ribeiro, Country Manager of Sungrow Brazil. “Along with the rapid development of the comprehensive technical support, sales, after-sale service, we’re confident to navigate more in this vibrant emerging market,” he added.

Since entering Brazil in late 2010s, Sungrow has been making big moves with inverters supplied across the country, including an 80MW project in Brazil and hundreds of distributed generations in partnership with local distributors. Sungrow took the first place in market share across Brazil in 2019, according to IHS Markit.

About Sungrow

Sungrow Power Supply Co., Ltd (“Sungrow”) is the world’s most bankable inverter brand with over 100 GW to be installed worldwide as of December 2019. Founded in 1997 by University Professor Cao Renxian, Sungrow is a leader in the research and development of solar inverters, with the largest dedicated R&D team in the industry and a broad product portfolio offering PV inverter solutions and energy storage systems for utility-scale, commercial, and residential applications, as well as internationally recognized floating PV plant solutions. With a strong 23-year track record in the PV space, Sungrow products power installations in over 60 countries, maintaining a worldwide market share of over 15%. Learn more about Sungrow by visiting www.sungrowpower.com.

Cision View original content to download multimedia:http://www.prnewswire.com/news-releases/sungrow-rolls-out-the-latest-three-phase-inverter-sg25cx-sa-for-brazilian-220v-market-301054903.html

Wealthbridge Acquisition Limited and Scienjoy Inc. Announce Closing of Business Combination

NEW YORK, May 8, 2020 /PRNewswire/ — Wealthbridge Acquisition Limited (“Wealthbridge”) (NASDAQ: HHHH, HHHHU, HHHHW, HHHHR), a special purpose acquisition company, and Scienjoy Inc. (“Scienjoy” or the “Company”), a leading live entertainment mobile streaming platform in China, today announced the successful closing of the transactions contemplated by the previously-announced Share Exchange Agreement (the “Share Exchange Agreement”), dated as of October 28, 2019, by and among Scienjoy, Lavacano Holdings Limited (“Lavacano”), and WBY Entertainment Holdings Ltd. (“WBY”, together with Lavacano, the “Sellers”), and approved by Wealthbridge shareholders as of May 5, 2020.

In connection with the closing, Wealthbridge has changed its name to Scienjoy Holding Corporation (“SHC”). Additionally, SHC expects that its ordinary shares will begin trading under the ticker symbol “SJ” on the Nasdaq stock exchange effective May 11, 2020, and its units and rights will cease trading as of the close of business on May 8, 2020. No action is needed from current Wealthbridge shareholders in relation to the ticker symbols change.

SHC will be led by Scienjoy’s current management team with Victor He as Chief Executive Officer, Bo Wan as Chief Operating Officer, and Denny Tang as Chief Financial Officer. Meanwhile, Winston Liu, Chairman and CEO of Wealthbridge will remain on SHC’s board of directors. SHC will remain headquartered in Beijing, China.

Winston Liu, Chairman and CEO of Wealthbridge, stated “We commend Victor and his team at Scienjoy for their success to date in building a vibrant live streaming ecosystem in China. As the mobile entertainment live streaming market continues to grow both in China and abroad, we are excited to work with Scienjoy to capitalize on these emerging opportunities.”

Victor He, Scienjoy’s CEO, also commented “We are quite pleased to announce the closing of the business combination and would like to thank all of our shareholders for their support during the process. The recognition we have received from our partners is an important company milestone, and we plan to maintain this momentum going forward. To fuel our growth, we are in the process of exploring potential overseas expansion opportunities. We firmly believe that social media networks and online business models do not have cultural boundaries. By leveraging our proprietary technology, international talent, and deep IT industry expertise, we will not only rapidly expand our global footprint, but move one step close to bringing joy and entertainment to all people around the world.”

Chardan acted as an M&A and financial advisor to Wealthbridge. Loeb and Loeb LLP acted as a legal advisor to Wealthbridge. Jun He Law Offices LLC, Fengyu Law Firm, and Maple Group acted as the legal advisors to Scienjoy.

About Scienjoy Inc.

Founded in 2011, Scienjoy is a leading show live streaming video entertainment social platform in China. With more than 200 million registered users, Scienjoy currently operates three primary online live streaming brands with their respective websites and mobile apps: Showself, Lehai, and Haixiu. More information can be found at: http://www.scienjoy.com

About Wealthbridge Acquisition Limited.

Wealthbridge Acquisition Limited is incorporated in the British Virgin Islands as a blank check company for the purpose of entering into a merger, share exchange, asset acquisition, share purchase, recapitalization, reorganization or similar business combination with one or more businesses or entities. Wealthbridge’s efforts to identify a prospective target business have not been limited to a particular industry or geographic region, although Wealthbridge intended to focus on targets located in China.

Forward-Looking Statements

This press release contains, and certain oral statements made by representatives of Wealthbridge, Scienjoy, and their respective affiliates, from time to time may contain, “forward-looking statements” within the meaning of the “safe harbor” provisions of the Private Securities Litigation Reform Act of 1995. Wealthbridge’s and Scienjoy’s actual results may differ from their expectations, estimates and projections and consequently, you should not rely on these forward-looking statements as predictions of future events. Words such as “expect,” “estimate,” “project,” “budget,” “forecast,” “anticipate,” “intend,” “plan,” “may,” “will,” “could,” “should,” “believes,” “predicts,” “potential,” “might” and “continues,” and similar expressions are intended to identify such forward-looking statements. These forward-looking statements include, without limitation, Wealthbridge’s and Scienjoy’s expectations with respect to future performance and anticipated financial impacts of the business combination, the satisfaction of the closing conditions to the business combination and the timing of the completion of the business combination. These forward-looking statements involve significant risks and uncertainties that could cause actual results to differ materially from expected results. Most of these factors are outside the control of Wealthbridge or Scienjoy and are difficult to predict. Factors that may cause such differences include, but are not limited to: (1) the occurrence of any event, change or other circumstances that could give rise to the termination of the share exchange agreement relating to the proposed business combination; (2) the outcome of any legal proceedings that may be instituted against Wealthbridge or Scienjoy following the announcement of the share exchange agreement and the transactions contemplated therein; (3) the inability to complete the business combination, including due to failure to obtain approval of the shareholders of Wealthbridge or other conditions to closing in the share exchange agreement; (4) delays in obtaining or the inability to obtain necessary regulatory approvals (including approval from insurance regulators) required to complete the transactions contemplated by the share exchange agreement; (5) the occurrence of any event, change or other circumstance that could give rise to the termination of the share exchange agreement or could otherwise cause the transaction to fail to close; (6) the inability to obtain or maintain the listing of the post-acquisition company’s ordinary shares on NASDAQ following the business combination; (7) the risk that the business combination disrupts current plans and operations as a result of the announcement and consummation of the business combination; (8) the ability to recognize the anticipated benefits of the business combination, which may be affected by, among other things, competition, the ability of the combined company to grow and manage growth profitably and retain its key employees; (9) costs related to the business combination; (10) changes in applicable laws or regulations; (11) the possibility that Scienjoy or the combined company may be adversely affected by other economic, business, and/or competitive factors; and (12) other risks and uncertainties to be identified in Wealthbridge’s proxy statement (when available) relating to the business combination, including those under “Risk Factors” therein, and in other filings with the Securities and Exchange Commission (“SEC”) made by Wealthbridge and Scienjoy. Wealthbridge and Scienjoy caution that the foregoing list of factors is not exclusive. Wealthbridge and Scienjoy caution readers not to place undue reliance upon any forward-looking statements, which speak only as of the date made. Neither Wealthbridge or Scienjoy undertakes or accepts any obligation or undertaking to release publicly any updates or revisions to any forward-looking statements to reflect any change in its expectations or any change in events, conditions or circumstances on which any such statement is based, subject to applicable law. The information contained in any website referenced herein is not, and shall not be deemed to be, part of or incorporated into this press release.

Important Information

Scienjoy Inc. (“Scienjoy”), Wealthbridge Acquisition Limited (“Wealthbridge”), and their respective directors, executive officers and employees and other persons may be deemed to be participants in the solicitation of proxies from the holders of Wealthbridge ordinary shares in respect of the proposed transaction described herein. Information about Wealthbridge’s directors and executive officers and their ownership of Wealthbridge’s ordinary shares is set forth in Wealthbridge’s Annual Report on Form 10-K filed with the SEC, as modified or supplemented by any Form 3 or Form 4 filed with the SEC since the date of such filing. Other information regarding the interests of the participants in the proxy solicitation will be included in the proxy statement pertaining to the proposed transaction when it becomes available. These documents can be obtained free of charge from the sources indicated below.

In connection with the transaction described herein, Wealthbridge will file relevant materials with the SEC including a proxy statement on Schedule 14A. Promptly after filing its definitive proxy statement with the SEC, Wealthbridge will mail the definitive proxy statement and a proxy card to each stockholder entitled to vote at the special meeting relating to the transaction. INVESTORS AND SECURITY HOLDERS OF WEALTHBRIDGE ARE URGED TO READ THESE MATERIALS (INCLUDING ANY AMENDMENTS OR SUPPLEMENTS THERETO) AND ANY OTHER RELEVANT DOCUMENTS IN CONNECTION WITH THE TRANSACTION THAT WEALTHBRIDGE WILL FILE WITH THE SEC WHEN THEY BECOME AVAILABLE BECAUSE THEY WILL CONTAIN IMPORTANT INFORMATION ABOUT WEALTHBRIDGE, SCIENJOY AND THE TRANSACTION. The definitive proxy statement, the preliminary proxy statement and other relevant materials in connection with the transaction (when they become available), and any other documents filed by Wealthbridge with the SEC, may be obtained free of charge at the SEC’s website (www.sec.gov).

Contacts

Yongsheng Liu
Chief Executive Officer
Wealthbridge Acquisition Limited
+86 (186) 0217-2929
winstonca@163.com

Xiaowu He
Chief Executive Officer
Scienjoy Inc.
+86 (10) 6445-9071
victor.he@scienjoy.com

Jack Wang
ICR Inc.
+1 (212) 537-9254
scienjoy.ir@icrinc.com

Cision View original content:http://www.prnewswire.com/news-releases/wealthbridge-acquisition-limited-and-scienjoy-inc-announce-closing-of-business-combination-301055205.html

Source: Scienjoy Inc.

Ribbon Announces Management Change

WESTFORD, Mass., May 8, 2020 /PRNewswire/ — Ribbon Communications Inc. (Nasdaq: RBBN), a global provider of real time communications software and network solutions to service providers, enterprises, and critical infrastructure sectors, today announced that the President and CEO of ECI Telecom Ltd. (“ECI”), Darryl Edwards, has departed Ribbon at the end of April as planned. Since the completion of the combination of Ribbon and ECI on March 3, 2020, Mr. Edwards has been an advisor to Bruce McClelland, CEO and President of Ribbon.

Mr. Edwards joined ECI in June 2012, with the goal of re-establishing ECI’s reputation for innovation and breaking boundaries in the telecommunications industry. Under his leadership, ECI has made significant investments in research and development and refreshed its product portfolio with new packet and optical product lines, making the transition to software defined networking (SDN) and network functions virtualization (NFV).

“We’re immensely grateful for the great work that Darryl has done in cementing ECI’s place as an innovation leader in the packet and optical networking space,” said Mr. McClelland.  “We are now very focused on executing on our strategy to significantly scale the ECI business by leveraging the strong foundation that Ribbon has with major Service Providers and Enterprise customers around the world, particularly as we enter the 5G networking era.”

“It has been a great pleasure to lead ECI for the past eight years. During this time, the industry has changed dramatically, and so did ECI,” added Mr. Edwards. “When I became CEO of ECI, we had to re-assert ECI’s innovation and put it back at the heart of the company. We’ve since become a pioneer in the industry, supporting a large number of customers, helping them realize their ambitions with our unique elastic network philosophy and approach. The merger with Ribbon is a natural and positive next step for ECI as it looks to continue to expand its global presence.” 

About Ribbon
Ribbon Communications (Nasdaq: RBBN), which recently merged with ECI Telecom Group, delivers global communications software and network solutions to service providers, enterprises and critical infrastructure sectors. We engage deeply with our customers, helping them modernize their networks for improved competitive positioning and business outcomes in today’s smart, always-on and data-hungry world. Our innovative, end-to-end solutions portfolio delivers unparalleled scale, performance, and agility, including core to edge IP solutions, UCaaS/ CPaaS cloud offers, leading-edge software security and analytics tools, as well as packet and optical networking leveraging ECI’s Elastic Network technology.  To learn more about Ribbon, visit rbbn.com and for more information about our packet and optical networking portfolio, visit ecitele.com.

Important Information Regarding Forward-Looking Statements  
The information in this release contains forward-looking statements regarding future events that involve risks and uncertainties. All statements other than statements of historical facts contained in this release are forward-looking statements. The actual results of Ribbon Communications may differ materially from those contemplated by the forward-looking statements. For further information regarding risks and uncertainties associated with Ribbon Communications’ business, please refer to the “Risk Factors” section of Ribbon Communications’ most recent annual or quarterly report filed with the SEC. Any forward-looking statements represent Ribbon Communications’ views only as of the date on which such statement is made and should not be relied upon as representing Ribbon Communications’ views as of any subsequent date. While Ribbon Communications may elect to update forward-looking statements at some point, Ribbon Communications specifically disclaims any obligation to do so.

Investor Relations
Monica Gould
+1 (212) 871-3927
IR@rbbn.com      

North American Press
Dennis Watson
+1 (214) 695-2224
dwatson@rbbn.com 

APAC, CALA & EMEA Press
Catherine Berthier
+1 (646) 741-1974
cberthier@rbbn.com 

Analyst Relations
Michael Cooper
+1 (708) 383-3387
mcooper@rbbn.com

Logo: https://techent.tv/wp-content/uploads/2020/05/ribbon-announces-management-change.jpg 

Source: Ribbon Communications Inc.

51job, Inc. Reports First Quarter 2020 Financial Results

SHANGHAI, May 8, 2020 /PRNewswire/ — 51job, Inc. (Nasdaq: JOBS) (“51job” or the “Company”), a leading provider of integrated human resource services in China, announced today its unaudited financial results for the first quarter of 2020 ended March 31, 2020.

First Quarter 2020 Financial Highlights:

  • Net revenues decreased 13.2% over Q1 2019 to RMB791.1 million (US$111.7 million)
  • Online recruitment services revenues decreased 10.8%
  • Other human resource related revenues decreased 18.2%
  • Income from operations was RMB170.0 million (US$24.0 million)
  • Fully diluted earnings per share was RMB3.02 (US$0.43)
  • Excluding share-based compensation expense, gain from foreign currency translation and change in fair value of equity securities investment, as well as the related tax effect of these items, non-GAAP adjusted fully diluted earnings per share was RMB3.27 (US$0.46), which exceeded the Company’s expectations
  • Cash and short-term investments balance increased to RMB11,231.1 million (US$1,586.1 million) as of March 31, 2020

Commenting on the results, Rick Yan, President and Chief Executive Officer of 51job, said, “Despite a decline in revenues and profitability in the first quarter that reflected the significant impact of the COVID-19 pandemic on economic activity and recruitment market demand in China, I’m very proud of how quickly our 51job team has rallied together to adapt to these unprecedented circumstances.  Tapping into our large HR services ecosystem of innovative solutions and strategic partners, we are assisting and supporting employers, workers and job seekers in every possible way, including contactless services such as online job fairs, AI assessment and video interviewing.  Although companies have resumed operations and employees have returned to work, the current market sentiment is still cautious and uncertain due to the ongoing pandemic and its unpredictable consequences on China and globally.  But we have confidence in our proven business model, and with our ample financial resources, we remain committed to leading with high quality services, improving the user experience and driving operational excellence, all of which will position and strengthen 51job to capture more opportunities in the future.”

First Quarter 2020 Unaudited Financial Results

Net revenues for the first quarter ended March 31, 2020 were RMB791.1 million (US$111.7 million), a decrease of 13.2% from RMB911.9 million for the same quarter in 2019.

Online recruitment services revenues for the first quarter of 2020 were RMB547.0 million (US$77.3 million), representing a 10.8% decrease from RMB613.4 million for the same quarter of the prior year.  The decline was due to the disruptive social and economic impact of the COVID-19 pandemic on companies in China, including temporary office and facility closures, travel restrictions and quarantines, which hindered business operations, reduced recruitment demand and curtailed employer spending on the Company’s online recruitment platforms in the first quarter of 2020.

Other human resource related revenues for the first quarter of 2020 decreased 18.2% to RMB244.1 million (US$34.5 million) from RMB298.5 million for the same quarter in 2019.  The decrease was primarily due to fewer in-person training seminars and recruitment events conducted in the first quarter of 2020 as a result of the COVID-19 pandemic and the restrictions instituted on public gatherings.

Gross profit for the first quarter of 2020 was RMB536.8 million (US$75.8 million) compared with RMB662.5 million for the same quarter of the prior year.  Gross margin, which is gross profit as a percentage of net revenues, was 67.9% in the first quarter of 2020 compared with 72.7% for the same quarter in 2019.  The decrease in gross margin was primarily due to a lower level of revenues in the first quarter of 2020 while cost of services increased 2.0% from the year-ago quarter, mainly as a result of greater employee compensation expenses which were largely offset by less direct costs related to training and recruitment events.

Operating expenses for the first quarter of 2020 decreased 3.2% to RMB366.8 million (US$51.8 million) from RMB379.0 million for the same quarter in 2019.  Sales and marketing expenses for the first quarter of 2020 decreased 4.3% to RMB276.2 million (US$39.0 million) from RMB288.7 million for the same quarter of the prior year primarily due to a decrease in performance-based bonuses and selling expenses, which was partially offset by greater spending on advertising and promotion activities.  General and administrative expenses for the first quarter of 2020 were RMB90.6 million (US$12.8 million), slightly higher than RMB90.2 million for the same quarter of the prior year.

Income from operations for the first quarter of 2020 was RMB170.0 million (US$24.0 million) compared with RMB283.5 million for the first quarter of 2019.  Operating margin, which is income from operations as a percentage of net revenues, was 21.5% in the first quarter of 2020 compared with 31.1% for the same quarter in 2019.  Excluding share-based compensation expense, operating margin would have been 26.2% in the first quarter of 2020 compared with 34.3% for the same quarter in 2019.

The Company recognized a gain from foreign currency translation of RMB10.2 million (US$1.4 million) in the first quarter of 2020 compared with RMB13.8 million in the first quarter of 2019 primarily due to the impact of the change in exchange rate between the Renminbi and the U.S. dollar on the Company’s U.S. dollar cash deposits.

In the first quarter of 2020, the Company recognized a mark-to-market, non-cash gain of RMB9.9 million (US$1.4 million) associated with a change in fair value of equity securities investment in Huali University Group Limited, which is traded on the Hong Kong Stock Exchange.

Other income in the first quarter of 2020 included local government financial subsidies of RMB4.5 million (US$0.6 million) compared with RMB62.5 million in the first quarter of 2019.

Net income attributable to 51job for the first quarter of 2020 was RMB205.2 million (US$29.0 million) compared with net loss of RMB(84.8) million for the same quarter in 2019.  Fully diluted earnings per share for the first quarter of 2020 was RMB3.02 (US$0.43) compared with loss per share of RMB(1.38) for the same quarter in 2019.

In the first quarter of 2020, total share-based compensation expense was RMB37.1 million (US$5.2 million) compared with RMB29.3 million in the first quarter of 2019.

Excluding share-based compensation expense, gain from foreign currency translation, and changes in fair value of equity securities investment and convertible senior notes, as well as the related tax effect of these items, non-GAAP adjusted net income attributable to 51job for the first quarter of 2020 was RMB222.3 million (US$31.4 million) compared with RMB349.5 million for the first quarter of 2019.  Non-GAAP adjusted fully diluted earnings per share was RMB3.27 (US$0.46) in the first quarter of 2020 compared with RMB5.33 in the first quarter of 2019.

As of March 31, 2020, cash and short-term investments totaled RMB11,231.1 million (US$1,586.1 million) compared with RMB9,940.6 million as of December 31, 2019.

Business Outlook

Based on current market and operating conditions, the Company’s net revenues target for the second quarter of 2020 is in the estimated range of RMB775 million to RMB825 million (US$109.5 million to US$116.5 million). Excluding share-based compensation expense, any gain or loss from foreign currency translation and any change in fair value of equity securities investment, as well as the related tax effect of these items, the Company’s non-GAAP fully diluted earnings target for the second quarter of 2020 is in the estimated range of RMB4.35 to RMB4.85 (US$0.61 to US$0.68) per share, which factors in the receipt of local government financial subsidies of approximately RMB120 million (US$17.4 million) in the second quarter of 2020. The Company expects total share-based compensation expense in the second quarter of 2020 to be in the estimated range of RMB37 million to RMB39 million (US$5.2 million to US$5.5 million). The above forecast reflects 51job’s current and preliminary view, which is subject to change and substantial uncertainty.

Guidance for earnings per share is provided on a non-GAAP basis due to the inherent difficulty in forecasting the future impact of certain items, such as gain/loss from foreign currency translation and change in fair value of equity securities investment. The Company is not able to provide a reconciliation of these non-GAAP items to expected reported GAAP earnings per share, without unreasonable efforts, due to the unknown effect and potential significance of such future impact.

Currency Convenience Translation

For the convenience of readers, certain Renminbi amounts have been translated into U.S. dollar amounts at the rate of RMB7.0808 to US$1.00, the noon buying rate on March 31, 2020 in New York for cable transfers of Renminbi as set forth in the H.10 weekly statistical release of the Federal Reserve Board.

Conference Call Information

The Company’s management will hold a conference call at 9:00 p.m. Eastern Time on May 7, 2020 (9:00 a.m. Beijing / Hong Kong time zone on May 8, 2020) to discuss its first quarter 2020 financial results, operating performance and business outlook.  To dial in to the call, please use the following telephone numbers:

US: +1-888-346-8982
International: +1-412-902-4272
Hong Kong: +852-3018-4992
Conference ID: 51job

The call will also be available live and on replay through 51job’s investor relations website, http://ir.51job.com.

Use of Non-GAAP Financial Measures

To supplement the consolidated financial statements presented in accordance with United States Generally Accepted Accounting Principles (“GAAP”), 51job uses non-GAAP financial measures of income before income tax expense, income tax expense, adjusted net income, adjusted net income attributable to 51job and adjusted earnings per share, which are adjusted from results based on GAAP to exclude share-based compensation expense, gain from foreign currency translation, and changes in fair value of equity securities investment and convertible senior notes, as well as the related tax effect of these items.  The Company believes excluding share-based compensation expense and its related tax effect from its non-GAAP financial measures is useful for its management and investors to assess and analyze the Company’s core operating results as such expense is not directly attributable to the underlying performance of the Company’s business operations and do not impact its cash earnings.  The Company believes excluding gain from foreign currency translation, and changes in fair value of equity securities investment and convertible senior notes, as well as the related tax effect, from its non-GAAP financial measures is useful for its management and investors as such translation, mark-to-market gain or loss is not indicative of the Company’s core business operations and will not result in cash settlement nor impact the Company’s cash earnings.  51job also believes these non-GAAP financial measures excluding share-based compensation expense, gain from foreign currency translation, and changes in fair value of equity securities investment and convertible senior notes, as well as the related tax effect of these items, are important in helping investors to understand the Company’s current financial performance and future prospects and to compare business trends among different reporting periods on a consistent basis.  The presentation of these additional measures should not be considered a substitute for or superior to GAAP results or as being comparable to results reported or forecasted by other companies.  The non-GAAP measures have been reconciled to GAAP measures in the attached financial statements.

About 51job

Founded in 1998, 51job is a leading provider of integrated human resource services in China.  With a comprehensive suite of HR solutions, 51job meets the needs of enterprises and job seekers through the entire talent management cycle, from initial recruitment to employee retention and career development.  The Company’s main online recruitment platforms (http://www.51job.com, http://www.yingjiesheng.com, http://www.51jingying.com, http://www.lagou.com, and http://www.51mdd.com), as well as mobile applications, connect millions of people with employment opportunities every day.  51job also provides a number of other value-added HR services, including business process outsourcing, training, professional assessment, campus recruitment, executive search and compensation analysis.  51job has a call center in Wuhan and a nationwide network of sales and service locations spanning more than 30 cities across China.

Contact

Linda Chien
Investor Relations, 51job, Inc.
Tel: +86-21-6879-6250
Email: ir@51job.com

Safe Harbor Statement

This announcement contains forward-looking statements. These statements are made under the “safe harbor” provisions of the U.S. Private Securities Litigation Reform Act of 1995. These forward-looking statements can be identified by terminology such as “will,” “expects,” “anticipates,” “future,” “intends,” “plans,” “believes,” “estimates,” “targets, “confident” and similar statements. Among other things, statements that are not historical facts, including statements about 51job’s beliefs and expectations, the business outlook and quotations from management in this announcement, as well as 51job’s strategic and operational plans, are or contain forward-looking statements.  51job may also make written or oral forward-looking statements in its periodic reports to the U.S. Securities and Exchange Commission, in its annual report to shareholders, in press releases and other written materials and in oral statements made by its officers, directors or employees to third parties.  All forward-looking statements are based upon management’s expectations at the time of the statements and involve inherent risks and uncertainties. A number of factors could cause actual results to differ materially from those contained in any forward-looking statement, including but not limited to the following: execution of 51job’s strategies and business plans; growth and trends of the human resource services industry in China; market acceptance of 51job’s products and services; competition in the industry; 51job’s ability to control costs and expenses; 51job’s ability to retain key personnel and attract new talent; relevant government policies and regulations relating to 51job’s industry, corporate structure and business operations; seasonality in the business; fluctuations in the value of the Renminbi against the U.S. dollar and other currencies; risks related to acquisitions or investments 51job has made or will make in the future; accounting adjustments that may occur during the quarterly or annual close or auditing process; and fluctuations in general economic and business conditions in China and globally, including the impact of the coronavirus or other pandemic.  Further information regarding these and other risks are included in 51job’s filings with the U.S. Securities and Exchange Commission.  All information provided in this press release and in the attachments is as of the date of the press release and based on assumptions that 51job believes to be reasonable as of this date, and 51job undertakes no obligation to update any forward-looking statement, except as required under applicable law.

51job, Inc.

Consolidated Statements of Operations and Comprehensive Income

For the Three Months Ended

March 31, 2019

March 31, 2020

March 31, 2020

(In thousands, except share and per share data)

(unaudited)

(unaudited)

(unaudited)

RMB

RMB

US$ (Note 1)

Revenues:

   Online recruitment services

613,376

547,017

77,254

   Other human resource related revenues

298,485

244,094

34,473

Net revenues

911,861

791,111

111,727

Cost of services (Note 2)

(249,364)

(254,303)

(35,914)

Gross profit

662,497

536,808

75,813

Operating expenses:

   Sales and marketing (Note 3)

(288,728)

(276,192)

(39,006)

   General and administrative (Note 4)

(90,243)

(90,642)

(12,801)

Total operating expenses

(378,971)

(366,834)

(51,807)

Income from operations

283,526

169,974

24,006

Gain from foreign currency translation

13,780

10,171

1,436

Interest and investment income, net

32,556

44,315

6,258

Change in fair value of equity securities investment

9,891

1,397

Change in fair value of convertible senior notes

(418,786)

Other income, net

62,328

4,335

612

Income (Loss) before income tax expense

(26,596)

238,686

33,709

Income tax expense

(60,056)

(36,771)

(5,193)

Net income (loss)

(86,652)

201,915

28,516

Net loss attributable to non-controlling interests

1,836

3,331

470

Net income (loss) attributable to 51job, Inc.

(84,816)

205,246

28,986

Net income (loss)

(86,652)

201,915

28,516

Other comprehensive income (loss)

(318)

308

43

Total comprehensive income (loss)

(86,970)

202,223

28,559

Earnings (Loss) per share:

   Basic

(1.38)

3.07

0.43

   Diluted (Note 5)

(1.38)

3.02

0.43

Weighted average number of common shares outstanding:

   Basic

61,645,331

66,802,054

66,802,054

   Diluted

61,645,331

68,005,680

68,005,680

Notes:

(1) The conversion of Renminbi amounts into U.S. dollar amounts is based on the noon buying rate of RMB7.0808

to US$1.00 on March 31, 2020 in New York for cable transfers of Renminbi as set forth in the H.10 weekly statistical

release of the Federal Reserve Board.

(2) Includes share-based compensation expense of RMB4,661 and RMB5,917 (US$836) for the three months ended 

March 31, 2019 and 2020, respectively.

(3) Includes share-based compensation expense of RMB4,007 and RMB5,087 (US$718) for the three months ended

March 31, 2019 and 2020, respectively.

(4) Includes share-based compensation expense of RMB20,618 and RMB26,120 (US$3,689) for the three months ended

March 31, 2019 and 2020, respectively.

(5) Diluted loss per share for the three months ended March 31, 2019 was calculated in accordance with the

“if converted” method. The potential conversion of the convertible senior notes was excluded in the computation of diluted

loss per share for the three months ended March 31, 2019 because the effect would be anti-dilutive. The impact of share

options was also excluded in the computation of diluted loss per share for the three months ended March 31, 2019

because the effect would be anti-dilutive. On April 15, 2019, the convertible senior notes matured, and the note holders

requested the conversion of the senior notes into 4,035,664 shares.

51job, Inc.

Reconciliation of GAAP and Non-GAAP Results

For the Three Months Ended

March 31, 2019

March 31, 2020

March 31, 2020

(In thousands, except share and per share data)

(unaudited)

(unaudited)

(unaudited)

RMB

RMB

US$ (Note 1)

GAAP income (loss) before income tax expense

(26,596)

238,686

33,709

Add: Share-based compensation

29,286

37,124

5,243

Less: Gain from foreign currency translation

(13,780)

(10,171)

(1,436)

Less: Change in fair value of equity securities investment

(9,891)

(1,397)

Add: Change in fair value of convertible senior notes

418,786

Non-GAAP income before income tax expense

407,696

255,748

36,119

GAAP income tax expense

(60,056)

(36,771)

(5,193)

Tax effect of non-GAAP line items

8

(31)

(4)

Non-GAAP income tax expense

(60,048)

(36,802)

(5,197)

Non-GAAP adjusted net income

347,648

218,946

30,922

Non-GAAP adjusted net income attributable to 51job, Inc.

349,484

222,277

31,392

Non-GAAP adjusted earnings per share:

   Basic

5.67

3.33

0.47

   Diluted (Note 2)

5.33

3.27

0.46

Weighted average number of common shares outstanding:

   Basic

61,645,331

66,802,054

66,802,054

   Diluted

67,336,334

68,005,680

68,005,680

Notes:

(1) The conversion of Renminbi amounts into U.S. dollar amounts is based on the noon buying rate of RMB7.0808

to US$1.00 on March 31, 2020 in New York for cable transfers of Renminbi as set forth in the H.10 weekly statistical

release of the Federal Reserve Board.

(2) Diluted earnings per share for the three months ended March 31, 2019 was calculated in accordance with the “if

converted” method. This included the add-back of interest expense of RMB9,403 related to the convertible senior notes

to the numerator of non-GAAP adjusted net income attributable to 51job for the three months ended March 31, 2019.

The maximum number of 4,035,672 potentially converted shares related to the convertible senior notes was added to the

denominator of diluted common shares for the three months ended March 31, 2019. On April 15, 2019, the convertible

senior notes matured, and the note holders requested the conversion of the senior notes into 4,035,664 shares.

51job, Inc.

Consolidated Balance Sheets

As of

December 31,
2019

March 31,
2020

March 31,
2020

(In thousands, except share and per share data)

(unaudited)

(unaudited)

(unaudited)

RMB

RMB

US$ (Note 1)

ASSETS

Current assets:

Cash

2,294,904

2,899,211

409,447

Restricted cash

66,169

3,085

436

Short-term investments

7,645,686

8,331,892

1,176,688

Accounts receivable (net of allowance of RMB21,952 and

  RMB19,344 as of December 31, 2019 and March 31, 2020,

  respectively)

266,437

211,017

29,801

Prepayments and other current assets

669,208

184,437

26,047

Total current assets

10,942,404

11,629,642

1,642,419

Non-current assets:

Long-term investments

1,482,544

1,495,713

211,235

Property and equipment, net

271,932

268,239

37,883

Goodwill

1,036,124

1,036,124

146,329

Intangible assets, net

203,162

192,612

27,202

Right-of-use assets

320,809

313,250

44,239

Other long-term assets

10,420

12,537

1,770

Deferred tax assets

22,147

24,527

3,464

Total non-current assets

3,347,138

3,343,002

472,122

Total assets

14,289,542

14,972,644

2,114,541

LIABILITIES, MEZZANINE EQUITY AND EQUITY

Current liabilities:

Accounts payable

48,114

75,234

10,625

Salary and employee related accrual

162,775

111,389

15,731

Taxes payable

267,596

131,891

18,627

Advance from customers

1,108,518

979,627

138,350

Lease liabilities, current

34,817

35,591

5,026

Other payables and accruals

1,211,642

1,924,001

271,721

Total current liabilities

2,833,462

3,257,733

460,080

Non-current liabilities:

Lease liabilities, non-current

50,763

45,775

6,465

Deferred tax liabilities

214,307

209,679

29,612

Total non-current liabilities

265,070

255,454

36,077

Total liabilities

3,098,532

3,513,187

496,157

Mezzanine equity:

Redeemable non-controlling interests

216,974

213,298

30,123

Shareholders’ equity:

Common shares (US$0.0001 par value: 500,000,000 shares

  authorized, 66,784,688 and 66,902,685 shares issued and

  outstanding as of December 31, 2019 and March 31, 2020,

  respectively)

53

54

8

Additional paid-in capital

4,901,466

4,967,497

701,545

Statutory reserves

17,930

17,930

2,532

Accumulated other comprehensive income

254,524

254,832

35,989

Retained earnings

5,774,358

5,979,604

844,481

Total 51job, Inc. shareholders’ equity

10,948,331

11,219,917

1,584,555

Non-controlling interests

25,705

26,242

3,706

Total equity

10,974,036

11,246,159

1,588,261

Total liabilities, mezzanine equity and equity

14,289,542

14,972,644

2,114,541

Note (1): The conversion of Renminbi amounts into U.S. dollar amounts is based on the noon buying rate of RMB7.0808 to US$1.00

on March 31, 2020 in New York for cable transfers of Renminbi as set forth in the H.10 weekly statistical release of the Federal

Reserve Board.

Cision View original content:http://www.prnewswire.com/news-releases/51job-inc-reports-first-quarter-2020-financial-results-301054710.html

Source: 51job, Inc.

Cyient reports the Q4 FY 20 financial results

HYDERABAD, India, May 8, 2020 /PRNewswire/ — Cyient (Estd: 1991, NSE: CYIENT), a global engineering and technology solutions company, today reported its consolidated financial results for the fourth quarter (Q4) of FY 2020 ending March 31, 2020.

Mr. Krishna Bodanapu, Managing Director and CEO, Cyient Limited

Financial Highlights:

For FY2020

  • Group revenue at $625.2 Mn (₹44,274 Mn); de-growth of 5.3% (4.0% in CC terms) and degrowth 4.1% YoY (₹ terms)
  • Services revenue at $550.7 Mn; de-growth of 5.1% (3.7% in CC terms)
  • DLM revenue at $74.6 Mn; de-growth of 6.6%
  • Normalized EBIT excluding one-offs at ₹4,084 Mn; de-growth of 23.4%
  • Normalized EBIT margins excluding one-offs at 9.2%; lower by 232 bps
    • Normalized EBIT margin for services excluding one-offs at 10.5%, lower by 228bps
  • Free Cash flow at ₹4,102Mn (highest ever)
  • Free Cash Flow conversion at 56.9%
  • Normalized PAT at ₹3,727 Mn; de-growth of 23.9%
  • Total dividend for the year stood at Rs 15/- per share

For Q4 FY20

  • Consolidated revenue at $149.2 Mn; degrowth of 3.8% QoQ and de-growth of 9.7% YoY
  • Services revenue at $132.3 Mn; de-growth of 5.6% QoQ (5.4% in CC) and de-growth 10.0% YoY
  • DLM revenue at $17 Mn; growth of 12.4% QoQ; de-growth of 7.1% YoY
  • Cash flow to EBITDA conversion at 74.0%
  • Normalized EBIT excluding one-offs at ₹905 Mn
    • Normalized EBIT margin excluding one-offs 8.4%; lower by 118 bps QoQ
    • Normalized EBIT margin for services excluding one-offs at 9.6%, lower by 100 bps QoQ

Business Highlights

  • Signed an agreement with Hitachi Rail to deliver a series of project engineering services to support and accelerate the evolution of its signaling technology and enhance its project execution capacity in April 2020
  • Mysore facility to support manufacturing of COVID-19 diagnosis units and X-ray system assemblies
  • Providing Telangana State Police with drone-based surveillance technology to help implement the COVID-19 related lockdown in Hyderabad
  • Contributed ₹ 20 Mn to the Telangana Chief Minister’s Relief Fund to support the government’s efforts in fighting the COVID-19 pandemic in April 2020

Message from the Management         

Commenting on the results, Mr. Krishna Bodanapu, Managing Director and Chief Executive Officer, said, “Our performance was below expectations both on revenue and margin terms largely due to the impact of COVID which was significant on many parts of our business. Our revenue for the quarter stood at $149.2 Mn, 3.8% lower QoQ in constant currency. Services revenue at $132.3 Mn is lower by 5.4% in constant currency due to de-growth in Utilities and Semiconductor businesses and was offset by an increase in the Aerospace & Defense business. The DLM revenue at $17 Mn was higher by 12.4% QoQ. Our Gross margin at 33.5% was lower by 248 bps QoQ with significant impact due to the shortfall in revenue. DLM gross margin at 13.3% was lower due to changes in revenue mix. Lower utilization during the quarter due to COVID preparedness also impacted the margin. Our EBIT margin was lower by 120 bps mainly due to a volume drop. For the year, our revenue stood at $625.2 Mn which is 5.3% lower YoY. Services revenue at $550.7 Mn was lower by 5.1% YoY while DLM at $74.6 Mn was lower by 6.6%. Degrowth in the services business was driven predominantly by A&D, Communication and Portfolio BUs. We are focused on accelerating business growth and have strengthened our leadership team with the appointment of Karthik Natarajan as the President & Chief Operating Officer and Felice Gray-Kemp as Sr. Vice President & General Counsel. With both joining us we will strengthen our focus on winning new business, especially in digital focused, IP-driven solutions and services. We will continue to strengthen our capabilities across business verticals and realign ourselves to achieve growth through these challenging times.”

Commenting on the results, Mr. Ajay Aggarwal, President & CFO, said, “The revenue for FY20 stood at $625.2 Mn (₹ 44,274 Mn) with operating profit of $57 Mn (₹ 4,084 Mn) and normalized PAT of $52.2 Mn (₹ 3,727 Mn). Our sustained focus on collections led to a robust EBIDTA to FCF conversion of 56.9% and healthy cash balance of ₹ 9,518 Mn. We generated FCF of ₹ 4,102 Mn for the year. We are preparing to secure future in these challenging times with an aggressive cost control and optimization plan with primary focus on liquidity and cash. This includes rigorous initiatives on collections, working capital cycles, receivables, payables, and discretionary cost control. We continue to tap opportunities for automation, pyramid rationalization, subcontracting cost optimization and other cost levers. We expect our margins to strengthen in FY21 where the full benefits of improved operational efficiency will be visible. The COVID-19 pandemic has slowed down the positive momentum that we had seen building in the overall performance. However, we stay confident in our ability to embrace and adapt to the new normal and to get back to an industry-leading growth and profitability position over the long term.”

Business Performance & Outlook

Aerospace & Defense 

Aerospace & Defense BU witnessed a growth of 4.7% QoQ and de-growth of 6.9% YoY in Q4 FY20 predominately driven by weak customer spend and impact of COVID pandemic from mid of Q4. For full year, BU de-growth is at 4.7% YoY. Services business is expected to de-grow through the year due to the global industry challenges caused by COVID. Growth momentum is likely to be back in Q4. We continue to see growth in our DLM business with significant order wins. Defense market spends seems to be promising and is expected to grow in this FY which gives Cyient an opportunity for growth.

Transportation

Transportation BU witnessed a de-growth of 3.5% QoQ and 15.9% YoY in Q4 FY20 driven by supply side challenges in the Q4, in addition to delay in closure of new deals. For full year Transportation BU witnessed a de-growth of 4.2% YoY. The year we extended the MSA with a key client, new client wins and initiation of a strategic DLM project in signalling space. The outlook for the year continues to be moderate and we expect growth across several key clients.

Communications

Communications BU witnessed a de-growth of 2% QoQ and growth of 1.1% YoY in Q4 FY20. The performance was better in the second half of the year compared to first half with a growth of 11% driven by generation of new revenue streams in key clients, new client additions, revenue streams from 5G rollouts and expansion into new segment. For full year Communications BU witnessed a de-growth of 8.1% YoY. For the year the industry is expected to investment in improving network, 5G technology increasing adoption of IoT and smart city solutions.

E&U 

The Energy and Utilities BU witnessed a de-growth of 20.5% QoQ and 18.3% YoY in Q4 FY20 impacted by closing of two major utilities projects and supply side challenges in Q4. For full year Energy and Utilities BU witnessed a de-growth of 0.6% YoY. The BU witnessed a flat growth YoY. The business is expected to be impacted in the near term with uncertainties over demand and supply, investment strategies and business models. We expect the business to recover in the second half of the year.

Semiconductor 

Semiconductor business witnessed de-growth of 22.3% QoQ and 35.1% YoY in Q4 FY20 predominantly driven by IC chips delivery issues due to disruptions in the supply chain. For full year SIA BU witnessed a degrowth of 14.3% YoY. We expect positive business momentum through opportunities in design services for large digital chips, embedded systems and software for automotive and new turnkey silicon opportunities.

Medical Technology and Healthcare

The Medical and Healthcare business witnessed a de-growth of 10.9% QoQ and a growth of 12.7% YoY. Revenue from key clients has grown considerably through the year. For full year MT&H BU witnessed a growth of 18.5% YoY. We also witnessed a strong growth in the manufacturing side of the business. With the focus on COVID related services we expect positive momentum to be back in the second half of the year.

Portfolio

Portfolio BU witnessed a de-growth of 3.0% QoQ and 10.6% YoY. The business was impacted by supply side challenges in Q4 predominantly in the industrial business. For full year Portfolio BU witnessed a degrowth of 9.7% YoY. Our Geospatial business grew QoQ led by a strong performance in two of our top three clients. For the year we expect the revenue to decline as clients are likely to limit their IT spends.

Operational Highlights      

CSR Activities

  • Continue to support 28 Government Schools – providing education to 18,500+ under privileged children
  • Continue to support 70 Cyient Digital Centers (CDCs) in around Telangana and Andhra Pradesh
  • Provided training to the 3rd pilot batch of 300 unemployed women on tailoring, bakery and beauty courses through the Cyient Urban Micro Skill Center (CUMSC) for urban poor
  • Organized a blood donation drive to commemorate 100 years of the Indian Red Cross Society. Witnessed participation by more than 500 volunteers
  • Took up the cause of girl child welfare by organizing activities geared to help under privileged adolescent girls

Awards & Recognitions

  • Won the Supplier Innovation Award for the seventh consecutive year and the Supplier Highest Productivity Award for the fourth year in a row at the Annual Pratt and Whitney Supplier Summit 2019
  • Won the 2019 Harithaharam Award at the CII Telangana State Annual Meeting 2019-20 for sustainable efforts in improving tree cover in the state

About Cyient

Cyient (Estd: 1991, NSE: CYIENT) provides engineering, manufacturing, geospatial, digital, networks, and operations management solutions to global industry leaders. Cyient leverages the power of digital technology and advanced analytics capabilities, along with domain knowledge and technical expertise, to solve complex business problems.  As a Design, Build and Maintain partner, Cyient takes solution ownership across the value chain to help clients focus on their core, innovate, and stay ahead of the curve.

Relationships form the core of how Cyient works. With over 15,000 employees in 22 countries, Cyient partners with clients to operate as part of their extended team, in ways that best suit their organization’s culture and requirements. Cyient’s industry focus includes aerospace and defense, medical, telecommunications, rail transportation, semiconductor, utilities, industrial, energy and natural resources.

For more information, please visit www.cyient.com.
Follow news about the company at @Cyient.

Contact Details
Media Relations 

Perfect Relations
Vishal Thapa
Mobile: +91 9701834446
Email:
vthapa@perfectrelations.com

Disclaimer

This document contains certain forward-looking statements on our future prospects. Although Cyient believes that expectations contained in these statements are reasonable, their nature involves a number of risks and uncertainties that may lead to different results. These forward-looking statements represent only the current expectations and beliefs, and the company provides no assurance that such expectations will prove correct.

All the references to Cyient’s financial results in this update pertain to the company’s consolidated operations comprising wholly-owned and Step-down subsidiaries Cyient Europe Limited; Cyient Inc.; Cyient GmbH; Cyient Australia Pty Ltd; Cyient Singapore Private Limited; Cyient KK; Cyient Israel India Limited; Cyient Insights Private Limited; Cyient Canada Inc.; Cyient Defense Services Inc.; Certon Software Inc.; Certon Instruments Inc.; B&F Design Inc.; New Technology Precision Machining Co. Inc.; Cyient Insights LLC; Cyient Benelux BV; Cyient Schweiz GmbH; Cyient SRO; AnSem NV; AnSem B.V.; Cyient AB; partly owned subsidiaries Cyient Solutions and Systems Private Limited; Cyient DLM Private Limited; joint venture Infotech HAL Ltd (HAL JV) & associate company Infotech Aerospace Services Inc. (IASI) until 8th December 2017.

The income statement and cash flow provided is in the internal MIS format. MIS format is different from the income statement published as part of the financial results, which is as per the statutory requirement.

Logo – https://techent.tv/wp-content/uploads/2020/05/cyient-reports-the-q4-fy-20-financial-results.jpg
Photo – https://techent.tv/wp-content/uploads/2020/05/cyient-reports-the-q4-fy-20-financial-results-1.jpg

VeChain Becomes The Sole Public Blockchain Protocol Of The APAC Provenance Council – A Cross-continental Food Supply Chain & Finance Consortium

SHANGHAI, May 8, 2020 /PRNewswire/ — The APAC Provenance Council supported by government, export and industry bodies, standards agencies, packaging and labelling service providers, finance giants and blockchain technology providers, is established to integrate blockchain technology into the food supply chain finance in AustraliaChina trades. Currently, the core founding members include Fresh Supply Co, Source Certain International, and Laava, joined by affiliate members VeChain, FoodAgility CRC (Cooperative Research Centre), DNV GL Business Assurance, Australian Made, GS1, Blockchain Australia and several others.

The New Roadmap To a Post-COVID Food Industry 

In February 2020, the Australian Government published The National Blockchain Roadmap, proactively addressing opportunities in the Agritech & Food industry, which directly accelerates the establishment of the Council.

The impact from COVID-19 further lifts the urgency of pushing forward this initiative. On one hand, the pandemic is posing a direct threat to food & beverage vendors around the globe, particularly in cross-continental trading, the suppliers are heavily impacting their cash flows, which calls for immediate invoice finance to quickly unlock unpaid invoices and stimulate business growth. On the other hand, the public awareness of food safety is unprecedentedly high. According to a study of InTarget Shanghai, Chinese consumers have become more health and safety-conscious and this will continue to be reflected in future.

Blockchain-enabled APAC Provenance Council To Stimulate The Market

By combining resources from all members, the Council aims to provide a comprehensive blockchain-enabled food supply chain finance ecosystem, bridging traceable, safe and trusted trades with shorter billing terms between Australian suppliers and Chinese importers.

David Inderias, APAC Provenance Council Executive Chairman says, “Many solution providers have offered ‘track and trace’ services, but haven’t addressed industry needs in a comprehensive way. In a post-COVID world when many commercial entities are in decline, we are growing by making sure to deliver real economic value, meeting industry needs, as well as including funding sources for industry.”

Powered by AliPay in Australia, all the B2B payments for China-destined trades from Australian food suppliers will receive milestone-based payments of the total fiat payment upfront upon meeting the first milestone of their delivery terms. For food suppliers in Australia, when they export food products traced by VeChain ToolChain™, the entire process of product delivery will be recorded, including logistics information, temperature during the process and so forth. Acting as the “trust machine” in multiparty collaboration, blockchain provides immutable and authentic records, which not only ensures the secured process of logistics transfer, bringing transparency and trust into the cross-continental trade, but also helps shorten the billing period for suppliers.

VeChain To Be The Sole Public Blockchain Protocol In The Consortium

VeChain is dedicated to enabling its partners to implement blockchain technology in various industries to solve real problems. The proven cases such as FoodGates, pave the way for making the supply chain finance more effective at an all-new level.

Sunny Lu, CEO at VeChain, stressed that, “Guided by the mission of powering the real economy, VeChain positions itself to be an Enabler to empower our partners with blockchain to build business applications in various sectors. The implementation of blockchain certainly contributes to buffering the immediate economic impacts of the pandemic for the enterprises, and will help improve productivity by unleashing more resources and growth opportunities.”

The Australian Department of Agriculture predicts China will account for 43% of global growth in demand for agricultural products by 2050. Since the Australian products have an enviable reputation for being high-quality, Australian exporters can strongly take advantage of China’s growing demand for quality produce and its need for food security. With the market evolving, the demand for business-ready standard blockchain tools will also see a dramatic growth, which positions VeChain ToolChain™ to seize the opportunity to support more enterprises and create more value.

About APAC Provenance Council
The Asia Pacific Provenance Council is an industry alliance which helps exporters digitally enable and scientifically prove the provenance, traceability and authenticity of their products, and tell the stories behind their brands. The Council will soon be taking expressions of interest for multiple food production verticals in Food Agility backed pilots, corporates and industry bodies are urged to.

About VeChain
Launched in 2015, VeChain connects blockchain technology to the real world by providing a comprehensive governance structure, a robust economic model, and IoT integration. VeChain is the pioneer of real-world applications using public blockchain technology, with international operations in Singapore, Luxembourg, Tokyo, Shanghai, Paris, Hong Kong, and San Francisco. Together with our strategic partners PwC and DNV GL, we have established cooperative relations with many leading enterprises in different industries, including Walmart China, BMW, BYD Auto, H&M, LVMH, D.I.G, AWS, PICC, ASI etc.

Official website www.vechain.com

Logo – https://techent.tv/wp-content/uploads/2020/05/vechain-becomes-the-sole-public-blockchain-protocol-of-the-apac-provenance-council-a-cross-continental-food-supply-chain-finance-consortium.jpg  

TrustKey Solutions, a new entity headquartered in the United States, is focused on bringing advanced FIDO2 security solutions to the world

DALLAS, May 7, 2020 /PRNewswire/ — Announcing TrustKey Solutions (“TrustKey”). eWBM is a diverse business of which FIDO security keys is just one part. Due to the surge in global demand for its FIDO security keys, the company is spinning off its FIDO key business into a new entity headquartered in the United States.

TrustKey is founded by Dr. Stephen Oh and a carefully selected group of US based executives. The team of executives are solely focused on bringing advanced FIDO2 security solutions to the world and will oversee growth into the global identity security marketplace.

TrustKey has several hardware security keys in its lineup including the flagship line, the G-series keys. The G-series keys are the world’s first and only FIDO2 Level2 certified biometric security keys, making it impossible for side channel attacks, man-in-the-middle attacks, or phishing. The biometric (fingerprint) sensor allows the added security of user identity verification to make them the highest level of security available. TrustKey offer the G-series keys in both USB-A and USB-C. The next line of keys are the T-series keys.

The T-series keys are implemented on the same platform as the G-Series series keys. This allows the company to provide the same high security performance of the G-series while keeping the key affordable. The non-biometric touch sensor on the keys allows for user presence verification protecting against remote hacking attacks. T-series keys are great for consumer or enterprise deployment – they are fast, easy to use, and affordable.

TrustKey is committed to supporting true passwordless login via the FIDO2 standard to help protect the online identities of all people, everywhere. The company is a board member of the fido alliance, ensuring that they are able to help shape the passwordless future and protect the identity of all people throughout the world. The company is pleased to move forward as TrustKey to support the goal of providing secure, reliable, and simple identity solutions to everyone, and are excited about the future products currently under development with new features and form factors.

For more information about TrustKey, please visit us at www.trustkeysolutions.com.

About TrustKey Solutions.

TrustKey Solutions, www.trustkeysolutions.com, is a security technology company providing hardware security keys. Headquartered in Dallas, TX, USA, TrustKey is committed to supporting true passwordless login via the FIDO2 standard to help people protect their online identities with hardware security keys.

About eWBM Co, Ltd.

eWBM, www.ewbm.com, is a fabless SoC company which provides security MCUs and modules for variety of IoT applications such as MS500, Secure LoRa Module, Secure Sensor to Ethernet module, Secure NB-IoT module, and Secure IP Cameras. The next generation security SoC chip, MS1200, will be introduced in 2020. The chip supports FIPS 140-2 and the ultra-low power deep sleep mode optimized for battery-powered IoT applications.

Contact:
Andrew Jun, +1 ‪408 471 6849

Cision View original content:http://www.prnewswire.com/news-releases/trustkey-solutions-a-new-entity-headquartered-in-the-united-states-is-focused-on-bringing-advanced-fido2-security-solutions-to-the-world-301054537.html

TBM Council Adds Prominent Technology Leaders to its Board of Directors

BELLEVUE, Washington, May 7, 2020 /PRNewswire/ — The Technology Business Management (TBM) Council, a non-profit organization that promotes technology business management standards and practices to empower collaboration between IT leaders and business partners, introduced 10 leaders to its board of directors.

The TBM Council is a thriving community with more than 11,000 members, including CIOs and other executives united in the mission of creating standards for the new IT hybrid cost model in order to help businesses achieve their transformation goals – whether it’s undergoing a cloud migration or implementing new and innovative technologies. The new board members bring with them a wealth of experience in driving digital and business strategies within their organizations by leveraging the TBM discipline to achieve success.

Alongside the leaders already on the board, they will be instrumental in helping the wider TBM Council members continue to identify and execute impactful ways to leverage the practice of TBM in order to achieve business objectives.

The new TBM Council Board of Directors include:

In cooperation with the TBM Council leadership team, led by Jarod Greene, general manager of the TBM Council, the board of directors will help direct the organization’s efforts and continue its focus on collaboration, standardization and education of TBM. Their expertise will be valuable in helping to direct the TBM Council’s goals and vision for the future.

“Shifts in technology mean that the IT operating model is changing for every business no matter what sector they’re in,” said Jarod Greene, general manager of the TBM Council. “As such, I’m thrilled to welcome our new board members, who bring with them experience from a wide range of industries. It’s our most diverse board ever, both in terms of the people and the types of companies they represent, and their knowledge and expertise will be key in ensuring we continue to deliver on our commitments to our members.”

The TBM Council was originally founded in 2012 as an extension of Apptio’s CIO Advisory Board, which brought together like-minded CIOs with the goal of standardizing a new IT operating model. Apptio continues to serve as its technical advisor to help automate best practices with robust TBM solutions. The TBM Council is an independent body governed by executives from across some of the world’s leading businesses.

“I have been actively involved with the TBM Council since the beginning when it was just a few CIOs,” said Larry Godec, chairman of the TBM Council Board of Directors. “TBM is an essential framework for allowing CIOs to run their IT organization like a business with complete financial transparency and strategic business alignment. I am very pleased to see it grow to include more than 11,000 CIOs and IT leaders across the globe.”

In addition to undertaking their governance responsibilities in board meetings, the board of directors will help to foster awareness and understanding of the discipline by taking part in events to share their own experiences in applying TBM to their operations and sharing key insights.

“Understanding the cost of technology has always been a challenge in the healthcare industry, and TBM has been pivotal in helping to bring critical transparency to this business driver,” said Jeri Koester, CIO of Marshfield Clinic Health System. “Being part of the TBM Council and collaborating with other members helped us take visibility of our costs and talk about it in a way that the business understands, which means that we can be the strategic partner in transformation at our health system. I’m looking forward to engaging with the TBM community and helping others to do the same in my new role as a board member.”

The TBM Council Board of Directors will take part in a virtual board retreat in May to help set the direction for the organization in 2020 and beyond. During this virtual retreat, the board will convene to discuss the current state of TBM and the wider technology industry, as well as how CIOs and CFOs can work together as part of a TBM framework. Members of the TBM Council will have an opportunity to listen in on key discussions on topics including re-planning and optimizing spending in times of disruption.

The full list of TBM Council Board of Directors includes:

The TBM Council provides a forum for its members to exchange knowledge and learnings with peers to help manage and achieve success with the TBM framework. Membership is open to qualified IT, finance or business leaders and practitioners who meet applicable membership standards. For more information or to join, please visit www.TBMCouncil.org

About Technology Business Management (TBM) Council

Founded from members of Apptio’s CIO advisory board in 2012, the Technology Business Management (TBM) Council is a non-profit organization governed by a board of business and technology leaders from some of the world’s most innovative companies like Aflac, State Farm, Tyson, Intuit, First American and more. The Council is dedicated to advancing the discipline of TBM and driving standards for analyzing, planning, optimizing, controlling, and collaborating about the investments that will transform the IT operating model. Apptio, the industry’s leading provider of TBM software solutions, serves as the TBM Council’s technical advisor. Membership is open to qualified IT, finance or business leaders and practitioners who meet applicable membership standards. For more information or to join, please visit www.TBMCouncil.org

MEDIA CONTACT
pr@tbmcouncil.org

Logo – https://techent.tv/wp-content/uploads/2020/05/tbm-council-adds-prominent-technology-leaders-to-its-board-of-directors.jpg